Article

Identifying the Relationship between Livelihoods and Land Ecosystem Services Using a Coupled Model: A Case Study in the “One River and Two Tributaries” Region of Tibet

1
College of Resources and Environmental Sciences, Henan Agricultural University, Zhengzhou 450002, China
2
Henan Engineering Research Center of Land Consolidation and Ecological Restoration, Henan Agricultural University, Zhengzhou 450002, China
3
Faculty of Geographical Science, Beijing Normal University, Beijing 100875, China
*
Author to whom correspondence should be addressed.
Land 2022, 11(9), 1377; https://doi.org/10.3390/land11091377
Submission received: 25 July 2022 / Revised: 17 August 2022 / Accepted: 21 August 2022 / Published: 23 August 2022

Abstract

:
In fragile and impoverished areas, identifying the interrelationship between livelihoods and ecosystem services can help protect the ecological environment and improve human well-being. This study selected the “One River and Two Tributaries” region (ORTTR) in Tibet with a fragile, sensitive ecological environment as the study area. With the years 2000, 2005, 2010, 2015, and 2020 as the research time points, a coupled evaluation model of residents’ livelihood and land ecosystem services was constructed to study the relationship between the two. Results showed that from 2000 to 2020, the coupling degree and coupling coordination degree between the two continued to increase because of the improvement in residents’ livelihood and ecosystem services. The level of coupling coordination gradually changed from a reluctant coordination stage to a moderate coordination stage. The coupling coordination degree showed more revealing results than the coupling degree in time scale. The relative development type between the two was mainly of the type lagging residents’ livelihood. By considering the physical geography and socio-economic characteristics and the relative development types, the counties and districts in the ORTTR are divided into ecological conservation areas, ecological restoration areas, and ecological reconstruction areas. The coupled model can evaluate the relationship between livelihoods and ecosystem services from a systematic integration perspective and provide scientific support for the improvement of regional human well-being.

1. Introduction

Ecosystems provide humans with a diverse range of goods and services that support their survival and development [1]. Around the world today, the magnitude and rates of ecosystem change are undermining the sustainability of some fragile and impoverished areas that rely directly on ecosystem services for their livelihoods [2,3]. Ecosystem services are the benefits that humans obtain from ecosystems [4]. They refer to life support products and services directly or indirectly obtained through the structure, process, and function of the ecosystem, and they form and maintain the natural environment conditions and utility on which human survival and development depend [5,6]. The Millennium Ecological Assessment divides ecological services into provisioning, regulating, cultural, and supporting services [7]. In recent years, ecosystem service value has become a hotspot in sustainable development research [8,9]. In regions relying on natural resources for production and development, areas with a high supply of ecosystem services tend to have low livelihood levels [10,11]. An obvious relationship exists between the vulnerability of the ecological environment or the importance of the ecological environment and the livelihood of residents [12,13,14].
“Livelihood” is defined in the dictionary as “a means or way of living”, which is the basic concept of the sustainable livelihood analysis framework [15,16,17]. Livelihoods consist of abilities, assets (including physical and social resources), and actions required for living [18]. At present, sustainable livelihood analysis frameworks are of three main types [19], namely, the sustainable livelihood analysis framework established by the Department for International Development (DFID) of the United Kingdom [15], the farmers’ livelihood security framework proposed by the Cooperative for American Remittances to Everywhere [20], and the sustainable livelihood approach proposed by the United Nations Development Programme [21]. Among these sustainable livelihood frameworks, the framework developed by the DFID is the most widely used and the most typical [22,23]. DFID’s conceptual framework consists of five parts: vulnerability background, livelihood capital, organizational structure and policy system, livelihood strategy, and livelihood status [15,23]. In the framework, livelihood capitals refer to the resource base of a community and of different categories of residents, and they are grouped into human, natural, financial, physical, and social capitals [15,24]. DFID’s framework is a good approach to sustainable livelihood analysis that provides a checklist of important issues for development and poverty research and emphasizes the multiplicity of interactions among the different factors that affect life [15]. Scholars have employed different approaches to explore the influencing factors of livelihoods, such as the structural equation model [25], livelihood resilience evaluation model [26], gray correlation model [27], participatory method [28,29], and coupling model [30]. Through these methods, the relationships between livelihoods and the factors (i.e., land use, ecological conservation policy, poverty alleviation) were analyzed in different ecologically vulnerable, sensitive, and economically poor areas. The above-mentioned research has shown that the relationship between ecosystem services and residents’ livelihood is very close, so deeply analyzing and exploring the relationship between the two is necessary.
Understanding the relationship between livelihood and ecosystem service is important not only for the purpose of scientific research but also to inform policy and practice [3,31,32,33]. Existing research has explored the relationships between residents’ livelihoods and ecosystem services. Some conceptual models have been developed to study the interaction between livelihood and ecosystem services, such as ecosystem services—livelihood adaptation framework [2], spatial targets and sustainable livelihoods analytic framework of payment for ecosystem service program [34], framework for cost–benefit analysis of ecosystem service providers and beneficiaries [35], landscape framework for food and livelihood security and ecosystem services [36], and framework of ecosystem services, human well-being, and poverty alleviation [37]. These conceptual models provide a practical basis to study the ecosystem services and residents’ livelihood. From the perspective of livelihoods, some studies have focused on the impact of changes in ecosystem services on livelihoods. They found the changes in grassland [38,39], forest [40,41], mangrove [42], homegardens [43,44], and wetland [45,46] ecosystem services because of climate change, land use change, or human factors produced an important impact on residents’ livelihood. The land use change process affects the transformation of the ecosystem structure and function to a certain extent, and land use change is an important cause of ecosystem service changes [47,48,49]. Changes in land use lead to changes in ecosystem services, which also affect people’s livelihoods [50,51]. Some other studies have tried to quantify the contribution of ecosystem services to livelihoods [52,53,54,55] in different landscapes and clarify the impacts of payment for ecosystem services on local livelihoods [56,57,58,59]. Unreasonable utilization of ecosystem services cannot sustain life effectively and is an important cause of ecological degradation [17]. During the formulation and implementation of ecological compensation policies, if the relationship between ecosystem services and livelihoods is not fully considered, its effects will be greatly affected [17,60,61]. From the perspective of livelihoods, some studies have focused on the livelihood dependence on ecosystem services [62,63] and tried to improve livelihoods by resilient livelihood strategies to cope with changes in ecosystem service provisions [64,65,66]. Ecosystem services are the basic life guarantee for residents’ survival and development [1]. The improvement of residents’ livelihood depends on the improvement of ecosystem services, and livelihoods react to the composition and structure of ecosystems, resulting in changes in ecosystem services [30,67,68]. Therefore, the key to improving the livelihood of residents and protecting the ecological environment is to scientifically understand the coupling relationship between the livelihood of residents and ecosystem services. Only with a full understanding of the interaction between the two can we maintain a livelihood and ecological balance and achieve regional sustainable development.
Within the previous literature on livelihoods and ecosystem services, research on the coupling relationship between livelihoods and ecosystem services remains insufficient. Few research studies consider the interaction between livelihoods and ecosystem services from a systematic integration perspective. To close the gap, there is a great need for research that employs a coupling model to assess livelihoods and ecosystem services. Coupling is a physical concept that is used to describe the state of interaction and coordination between two or more systems [69]. Coordination degree aims to quantitatively reflect the coordinated development of multiple systems, that is, whether they are in a state of imbalance or coordination, and control measures are timely taken according to the changing trend of coordination degree. The coupling coordination model has obvious advantages in analyzing the complex system relation composed of multiple factors and levels, and it can better reflect the structure and function of complex systems [70,71]. Human, natural, financial, physical, and social capital are involved in the improvement of livelihoods. Therefore, livelihoods and ecosystem services are not one-dimensional, and they are relatively complex systems. The coupling model can be employed to quantify the coupling level and coupling coordination level between livelihoods and land ecosystem services. Some research has used the coupling model to identify the relationship between ecosystem services and residents’ income [72] and between ecological compensation and farmers’ livelihood [27], which provides an important reference for the coupling coordination between livelihoods and land ecosystem services. By studying the evolution law of residents’ livelihood and land ecosystem services, the coupling relationship between the two systems can be revealed, thus providing a reference for improving residents’ livelihood and protecting the ecological environment.
As the main body of the Qinghai–Tibet Plateau, Tibet’s ecological value is mainly manifested by its huge gene pool on Earth; it is an important initiator of the world’s climate, the solid reservoirs in the surrounding areas, the source of rivers, and an ecological barrier in eastern China [73,74]. However, with the acceleration of urbanization and industrialization and the disorderly development and utilization of natural resources, the ecosystem of Tibet has been severely damaged [75]. The “One River and Two Tributaries” region (ORTTR) in Tibet is a fragile ecological environment, and it is a typical interlaced area of valley-type planting, agriculture, and animal husbandry [76]. Tibet has harsh natural conditions [77]. Affected by the alpine natural geographical environment and the harsh conditions for the development and utilization of agricultural resources, agricultural resources are mainly distributed in the ORTTR with low altitude, good water and heat conditions, and fertile soil [78]. The farmers and herdsmen in the study area converted the primary industry to secondary and tertiary industries through labor and successfully diversified their livelihoods, and improved their living standards [79]. This area is the political, economic, religious, and cultural center of Tibet. It is an area characterized by early development and rapid economic development in the Tibet Autonomous Region. Local farmers and herdsmen utilize the products and services provided by the ecosystem to maintain their livelihoods and exert various impacts on the structure and function of the ecosystem; meanwhile, the ecosystem maintains the ecological security of the basin by providing water conservation, soil conservation, and other services and affects the improvement of agriculture, animal husbandry, and people’s livelihood. Hence, they have a close coupling relationship. Investigating the relationship between residents’ livelihoods and land ecosystem services in the ORTTR is the premise of promoting regional sustainable development. Against this background, our work explores the following questions: (1) how to assess the coupling relationships between residents’ livelihoods and land ecosystem services in the ORTTR; (2) are the coupling relationships improved in recent twenty years, and what are the reasons; (3) and what is the policy implications of the coupling coordination results between residents’ livelihoods and land ecosystem services in the ORTTR. To answer these questions, we employ the coupling model to quantify the coupling degree and the coupling coordination degree between livelihoods and land ecosystem services from 2000 to 2020. A relative development model is adopted to identify the lead–lag relationship between livelihoods and land ecosystem services and zone the county-level ecological management. By studying the evolution laws of residents’ livelihood and land ecosystem service value in the ORTTR, this work provides a reference for improving residents’ livelihood level and protecting the ecological environment. Related policy suggestions are proposed for supporting ecological protection and high-quality sustainable development in the ORTTR.

2. Materials and Methods

2.1. The Study Area

ORTTR is located in the southwest of the Qinghai–Tibet Plateau, which is known as the “Roof of the World”. Its coordinates are 28°20′ to 30°20′ north latitude and 87°00′ to 92°35′ east longitude, and it covers the middle reaches of Yarlung Zangbo River (One River) and its tributaries, namely, Nianchu River and Lhasa River (Two Tributaries). This area starts from Sangri of Shannan in the east, reaches Lazi of Shigatse in the west, reaches Kailas Range Nyenchenthanglha Mountains in the north, and connects the Tibetan River Valley in the south, including Lhasa, Shannan, and Shigatse regions. The administrative area covers 18 counties/districts (Figure 1). The land utilization rate in the ORTTR is extremely high [76], with a land area of 6.68 × 10⁴ km2 accounting for 5.52% of the total land area of the Tibet Autonomous Region. The area of arable land accounts for more than 60% of the total area of arable land in the Tibet Autonomous Region, and the population accounts for 36% of the total population of the Tibet Autonomous Region. The area is located between 3284 and 7141 m above sea level and has a typical plateau temperate monsoon semi-arid climate with mild climate, rain, and heat in the same period. The average annual temperature is 4.7–8.3 °C, and the annual precipitation is 251.7–580.0 mm. The precipitation is mainly concentrated from May to September, forming very obvious dry and wet seasons [78].

2.2. Data Collection and Collation

The five years of 2000, 2005, 2010, 2015, and 2020 in Tibet’s ORTTR were selected as the research time points. The data used to calculate the residents’ livelihood capital index were mainly from the Tibet Statistical Yearbook and China County Statistical Yearbook. The national annual average grain price was from the China Grain Yearbook and the State Administration of Grain and Material Reserves. The land use raster data with a spatial resolution of 30 m in 2000, 2005, 2010, 2015, and 2020 were from the Resource and Environmental Science and Data Center of the Chinese Academy of Sciences (https://www.resdc.cn/, accessed on 10 February 2022).
Land use classification data belong to China’s Multi-Period Land Use/Land Cover Change Remote Sensing Monitoring Dataset. These data with a spatial resolution of 30 m were constructed through manual visual interpretation, and the interpretation accuracy exceeded 90%. This series of data divides land use types into first-level categories (arable land, forest land, grassland, water area, construction land, and unused land) and secondary-level categories (25 in all, including dryland, paddy field, shrub land, river canal, lake, high-coverage grassland, etc.). Different ecosystem types were mapped to land types in this study because land ecosystem services were to be assessed. In accordance with classification standards, the characteristics of the land type of ORTTR and ecosystem classification systems of Xie et al. [80], this study reclassified land use types into drylands, paddy fields, mixed coniferous broad-leaved forest, shrubs, grasslands, meadows, wetlands, deserts, bare land, water area, and glacier snow.

2.3. Calculation of Livelihood Capital

Livelihood capital refers to all kinds of capital needed by communities, farmers, or villagers to survive or develop [15,24]. The calculation of residents’ livelihood level in this study was mainly based on the sustainable livelihood analysis framework of the DFID, and the five capital types of natural capital, human capital, physical capital, financial capital, and social capital were regarded as the core elements of the comprehensive level of residents’ livelihood [15]. Considering the objectives of our work, natural capital is defined as a stock of materials that can directly or indirectly provide human beings with various ecosystem services [81]. In the ORTTR, this form of capital is mainly various land ecosystems, including cultivated land, woodland, grassland, and water. Physical capital refers to resources such as the material equipment that facilitate people’s life and production and some provisioning services [24,82,83,84]. According to past studies [24,25,30,82,83,84], village residential land, agricultural machinery, meat, and food are selected as measurement indicators of physical capital in the ORTTR. Human capital is primarily composed of the labor force, skills, and knowledge [82,85]. The number of rural populations, agriculture, animal husbandry, fishery practitioners, and ordinary middle school students are used to measure human capital. Financial capital denotes the financial resources that people use to achieve their livelihood objectives [24,86]. Savings deposits and industrial output value are selected as measurement indicators of financial capital in the ORTTR. Social capital is taken to mean the social resources upon which people draw in pursuit of their livelihood objectives [24]. According to the past studies [27,30], urbanization level can reflect social support level to livelihoods. Medical and health institution beds and urbanization levels are used as two indexes to measure social capital. In accordance with the data availability, natural resources, local characteristics, cultural customs, economic development status, and characteristics of residents’ lives in the ORTTR, 15 typical livelihood capital evaluation indicators were selected in this study to construct the residents’ livelihood capital level index system, as shown in Table 1.
The calculation of each capital type index of residents’ livelihoods includes three steps. First, the original data are made dimensionless. Second, the entropy method is used to assign weights to each capital type index (Table 1). Lastly, the indicators are aggregated to calculate each capital type index and overall livelihood capital index. In the calculation process of the overall livelihood capital index, the five capital types were equally important, and the weight is the same [79,87].
This study used the range standardization method to process the raw data of 15 livelihood capital indicators. The formula is
Z i j = ( x i j min x i j ) / ( max x i j min x i j )
where Zij represents the normalized value of the original data, xij represents the original data, minxij represents the minimum value of the original data, and maxxij represents the maximum value of the original data.
As an objective weighting method, the entropy method can assign weights to the selected evaluation indicators. The calculation steps are as follows:
Calculate the proportion pij of the i-th scheme of the j-th indicator as follows:
p i j = z i j / i = 1 m z i j
Calculate the entropy value ej of index j as follows:
e j = 1 / ln m i = 1 m p i j ln p i j
Calculate the weight Wj of the j-th indicator as follows:
W j = ( 1 e j ) / j = 1 n ( 1 e j )
Calculate livelihood capital LC as follows:
L C = j = 1 n W j Z i j
On the basis of the livelihood capital index system of Table 1, the livelihood capital level of the ORTTR in 2000, 2005, 2010, 2015, and 2020 can be calculated.

2.4. Calculation of Land Ecosystem Service Value

Costanza et al. [5] proposed an ecosystem service value evaluation method that has been widely used in different countries [88,89,90,91,92], but the method has shortcomings when directly applied in China [93]. The first version of the equivalent factor method based on the unit area value proposed by Xie et al. [93] was used to evaluate the ecosystem service values of six land types. The improved value–equivalent factor method based on the unit area, was employed for the value assessment of 11 types of ecosystem services and 14 types of land in the country. The ecosystem service types included four categories, namely, supply, regulation, support, and culture. The four categories of services were further subdivided into 11 types of services: food production, raw material production, water supply, gas regulation, climate regulation, environmental purification, hydrological regulation, soil conservation, maintenance of nutrient cycling, biodiversity, and aesthetic landscape. However, the equivalence factor table proposed by Xie et al. [80] reflects the average level of ecosystem services in China and is not fully applicable to the ORTTR. Therefore, this study appropriately revised the equivalence table in accordance with the situation of the study area.
On the basis of the agricultural production situation in the ORTTR, the national grain production level and price were used to modify the coefficient of the equivalent value of land ecosystem services per unit area in the study area [80]. The grain planting area, grain output, and annual average price of grain in 2000, 2005, 2010, 2015, and 2020 are shown in Table 2.
The economic value of the food production service function provided by the farmland ecosystem per unit area in the ORTTR of Tibet from 2000 to 2020 is estimated to reach 5.6134 million USD/hm2. Table 3 shows the ecosystem service value per unit area of the land ecosystem in the ORTTR of Tibet. The land ecosystem service value in Tibet’s ORTTR from 2000 to 2020 was calculated. The formula is as follows:
E S V = A t × V C t
where ESV is the land ecosystem service value (USD), At is the t area of each land use type (hm2), and VCt is the ecological value service coefficient of the t-th land use type (USD/hm2).

2.5. Coupling Model

Coupling refers to the relationship in which two or more system states interact and influence each other [69]. Although the coupling degree can represent the mutual influence between the livelihood of residents and ecosystem services, it is not a good measure of the coordinated development between the two systems. Therefore, to effectively analyze the degree of coupling coordinated development of residents’ livelihoods and the land ecosystem service value, a coupled coordination degree model was introduced in this study. The coupling model [30,71] was used to calculate the relationship between residents’ livelihood and ecosystem services. The formula is as follows:
T = a U 1 + b U 2
C = U 1 U 2 / ( a U 1 + b U 2 ) 2
K = T × C
where C is the coupling degree, U1 is the normalized value of ecosystem services, and U2 is the residents’ livelihood capital index. Given that the two systems are equally important, a = b = 0.5. T represents the correlation between the two systems, and K represents the degree of coupling coordination. Coupling degree C is in the range of [0, 1]; the greater C is, the greater the correlation between the two is. Coupling coordination degree K is added to the coupling relationship between the two systems, and K is between [0, 1], which can represent the coordinated development level of the two systems. By referring to existing research results [30,69,71,72,94], the coupling degree and coupling coordination degree range level of the two systems was divided in this study, as shown in Table 4 and Table 5.
The relative development index of the two was calculated to further identify the leading–lagging relationship between residents’ livelihoods and land ecosystem services in various districts and counties, and the relative development types were classified based on the relative development index. All counties and districts in the research area were divided into land ecosystem service lag type, residents’ livelihood and land ecosystem service development type, and residents’ livelihood lag type. The specific classification criteria are shown in Table 6.

3. Results

3.1. Spatiotemporal Change in Residents’ Livelihood Capital

From 2000 to 2020, the overall livelihood capital index of the ORTTR in Tibet showed an upward trend (Table 7). Among the five capital types, natural and human capital initially increased then decreased, and financial and social capital showed a trend of continuous growth. In 2000, the economic development of Tibet’s ORTTR was backward, and the comprehensive level of livelihood capital was low at 0.14. Specifically, the human and physical capital indexes were high at 0.25 and 0.20, respectively, but the natural, financial, and social capital indexes were low and in a period of severe scarcity. In 2005, the total livelihood capital index area increased by 25.48% to 0.17, and both natural and human capital increased significantly. In 2010, the residents’ livelihood capital index increased by 24.04% to 0.21. In 2015, the residents’ livelihood capital index increased to 0.26, indicating an increase of 21.03%. In 2020, the total livelihood capital index of residents was 0.28. Overall, the total power of agricultural machinery in Tibet’s ORTTR in the past 20 years increased by nearly five times compared with the value in 2000, and the balance of urban and rural savings deposits increased by 94 times compared with the value in 2000. From 2000 to 2020, Tibet’s ORTTR experienced rapid economic development, and the residents’ livelihoods improved rapidly. In particular, social and financial capital increased significantly, changing the backward production and living conditions in 2000.
From 2000 to 2020, the livelihood capital index of all districts and counties in the ORTTR of Tibet increased (Figure 2). The livelihood capital of Sangzhuzi, Duilongdeqing, and Naidong Districts was relatively high; the three areas are the municipal districts of Shigatse, Lhasa, and Shannan, respectively. The GDP growth was fast, the per capita medical beds and infrastructure were good, the level of education was high, and the living standards of the residents were relatively high. As the distance between the county and those three districts increased, the livelihood capital index decreased accordingly. The livelihood capital index was the lowest in the northwest and southeast of ORTTR, indicating that the livelihood capital index had a good relationship with the geographical location of districts and counties.

3.2. Spatiotemporal Change in Land Ecosystem Service Value

From 2000 to 2020, the land ecosystem service value in Tibet’s ORTTR increased by 1.58 billion USD, showing a trend of initially decreasing, then increasing, and finally decreasing (Table 8). The ecosystem service values of forests and wetlands changed the most; they increased by 6.87 and 10.75 times, respectively. From 2000 to 2005, the total value of ecosystem services was almost stable. From 2005 to 2010, the service value of forest and wetland ecosystems increased significantly by 540.71% and 944.52%, respectively, resulting in a sharp upward trend in the total value (i.e., an increase of USD 1.47 billion). Desert and water areas had less growth than forests and wetlands. The values of farmland and grassland ecosystem services decreased by 2.08% and 17.72%, respectively. The ORTTR is an important valley for the development of agriculture and animal husbandry in Tibet. The negative effect of the deterioration of its ecological environment on economic development cannot be underestimated. From 2010 to 2020, the total value of land ecosystem services was stable, and no major increase or decrease was observed in the various ecosystems.
According to the spatiotemporal distribution of land ecosystem service value (Figure 3), from 2000 to 2020, the land ecosystem service value of Xietongmen was at the highest level mainly because Xietongmen is located in the northwest of the study area, and it has a high altitude, high vegetation coverage, and many woodland and grassland areas. In 2020, the forest land and grassland areas in Xietongmen accounted for almost 25.39% and 15.90% of the total forest land and grassland areas in Tibet’s ORTTR, respectively. The value of ecosystem services in the western region was higher than that in the eastern region, and the value of ecosystem services in the central region was the lowest. From 2000 to 2020, the cultivated land, forest land, grassland, and water area of Nimu, Qushui, Duilongdeqing District, Dazi, Naidong District, and Qiongjie in the central region were smaller than those of other districts and counties, resulting in a low land ecosystem service value. Although the land ecosystem service value increased, it was still at a low level.

3.3. Coupling Relationship between Residents’ Livelihood and Land Ecosystem Services

3.3.1. Coupling Degree

The overall coupling degree between residents’ livelihoods and land ecosystem services in the ORTTR of Tibet has been increasing, albeit at a slow growth rate (Table 9). From 2000 to 2010, the coupling degree of residents’ livelihood and land ecosystem service value was at a moderate coupling stage in a state of slow growth, and the change range was weak. From 2010 to 2015, the coupling degree showed a slow upward trend from moderate coupling to high coupling. From 2015 to 2020, the coupling degree between the two systems increased slightly, and it was still at the stage of high coupling.
The coupling degree of residents’ livelihood and land ecosystem service value in the districts and counties of Tibet’s ORTTR was mainly distributed within the high coupling interval (Figure 4). In terms of time scale, in 2000, 2005, and 2010, the study area had 16 highly coupled districts and counties, accounting for 94.12% of the entire ORTTR and only one moderate-coupling county. From the perspective of the change process, from 2000 to 2010, the number of medium- and high-coupling districts and counties did not change, but the coupling value of each county increased. This result indicates that since 2000, the interaction between residents’ livelihood and land ecosystem services has been increasing. Given that Xietongmen changed from moderately coupled to highly coupled in 2015, the proportion of highly coupled counties in the study area reached 100%. In 2020, the number of highly coupled districts and counties remained at 100%, and the coupling degree of Duilongdeqing and Naidong Districts decreased significantly, but they were still at the highly coupled stage. The reason may be that the urbanization process of the two districts is faster than that of other districts and counties; as a consequence, the ecosystem service is reduced, and the livelihood capital grows rapidly, resulting in a decrease in the coupling degree of the two systems. According to the spatiotemporal distribution of the coupling degree (Figure 4), Xietongmen is a moderately coupled county, which is mainly distributed in the northwest of ORTTR. The per capita cultivated land, forest land, grassland, and water area in Xietongmen are large and contribute greatly to ecosystem services. However, the added value of the primary industry and the savings amount of urban and rural residents are low, the per capita number of medical and health beds is small, and the infrastructure is poor, resulting in a low level of residents’ livelihood and a moderate coupling in Xietongmen. The formation of highly coupled districts and counties is mainly due to the fact that the livelihood capital and ecosystem service indices are at medium levels, and the development of the two systems is relatively balanced; hence, the coupling degree of the two systems in these districts and counties is relatively high.

3.3.2. Coupling Coordination Degree

According to Table 9, from 2000 to 2020, the coupling coordination degree of the two systems in the ORTTR was between 0.57 and 0.72. From 2000 to 2005, the coupling and coordination degree of the two increased from 0.57 to 0.60 with a slow growth rate of 5.83%, shifting from the transition stage of reluctant coordination to the transition stage of primary coordination. From 2005 to 2010, the coupling coordination degree between the two increased from 0.60 to 0.68, showing an increase of 12.92%, and it was still under primary coordination at the transformation stage. From 2010 to 2015, the coupling coordination degree between the two increased from 0.68 to 0.71 with a growth rate of 5.41%, shifting from the transition stage of primary coordination to the coordinated development stage of moderate coordination. From 2015 to 2020, the degree of coupling and coordination increased slightly from 0.71 to 0.72, and it remained at the coordinated development stage of moderate coordination.
In 2000, ORTTR had one moderate-imbalance recession, five mild-imbalance recessions, seven near-imbalance recessions, and four reluctantly coordinated transitions (Figure 5). In 2010, one moderate-dissonance recession, one mild-dissonance recession, seven near-dissonance recessions, four barely dissonance recessions, three primary coordinated transformations, and one moderate coordinated development were observed. From 2000 to 2010, the categories of mild-dissonance and near-dissonance recessions were transformed into near-dissonance recession and barely coordinated transition, respectively. Mild dissonance decreased from 29.41% in 2000 to 5.88% in 2010, and primary coordination and moderate coordination increased from 0% to 17.65% and 5.88%, respectively. In 2020, one moderate-dissonance recession, no mild-dissonance recession, six near-dissonance recessions, five barely coordinated transformations, three primary coordinated transformations, and two moderate coordinated development cases were observed. From 2010 to 2020, the category of mild-dissonance recession was cleared, and it changed to the category of near-dissonance recession. The moderate coordinated development category also increased. However, from 2000 to 2020, Qiongjie was at the stage of moderate-dissonance recession. The remaining districts and counties rose by one or several stages. From the spatiotemporal distribution of coupling coordination in the ORTTR shown in Figure 5, the coupling coordination degree of the western districts and counties was higher than that of the eastern districts and counties, and the coupling coordination degree of the eastern districts was higher than that of the central region. Qiongjie was the only one that belonged to the moderate-dissonance recession category. In 2020, Qiongjie residents lacked natural capital, financial capital, and human capital for their livelihood. Their livelihood capital index was 2–9 times lower than that of other counties, and their economic development was relatively backward. At the same time, the ecosystem service value was 2–20 times lower than that in the other counties. The coupling coordination of the two systems was poor. From 2000 to 2010, the scope of mild-dissonance regions in the central and eastern regions gradually narrowed, the coupling coordination degree in the western and eastern regions increased significantly, and the regional scope gradually expanded. From 2010 to 2020, the number of districts and counties close to dissonance in the central and eastern regions decreased, and all districts and counties in the northwestern region reached the primary coordinated development category. Overall, the degree of coupling coordination between the two systems gradually weakened from the northwest and northeast regions to the central region.

3.3.3. Relative Development Index

From 2000 to 2020, the relative development type of residents’ livelihood and land ecosystem service in the ORTTR was mainly based on the lagging type of residents’ livelihood (Figure 6). From 2000 to 2020, the number of districts and counties with lagging livelihoods decreased from 13 to 10. The number of districts and counties with simultaneous development of residents’ livelihoods and ecosystem services was reduced from 4 to 2, and the number of districts and counties with lagging ecosystem services increased from 0 to 5. Figure 6 reveals that the districts and counties around Chengguan District, such as Duilongdeqing District, Naidong District, Qushui County, and Lazi County, have gradually developed from a type of lagging residents’ livelihoods and a type of synchronous development to a type of lagging ecosystem services. As the main economic development area in the western part of ORTTR, Sangzhuzi District has accelerated its economic development after being set as a municipal district, and it has developed from a type of lagging residents’ livelihood to a type of lagging ecosystem services. This result shows that with the development of the social economy and the acceleration of urbanization, the livelihood capital of residents has gradually increased, and the land ecosystem has been affected, resulting in a decrease in the number of districts and counties with lagging livelihoods and an increase in the number of districts and counties with lagging ecosystem services.

4. Discussion

4.1. Coupling Relationship between Residents’ Livelihoods and Land Ecosystem Services

Identifying the relationships between livelihoods and ecosystem services and incorporating effective results into management practices were conducive to achieving region sustainability [11,31,62,95]. The existing research focused more on the contribution of ecosystem services to the residents’ livelihood [52,53,54,55] or the impact of livelihood activities on ecosystem services [96,97,98]. The interaction (i.e., coupling degree, coupling coordinate degree, and relative development index) between livelihoods and ecosystem services failed to be identified from a systematic integration perspective. The spatiotemporal dynamics of coupling relationships could not be detected because of the limitations of methods and data [33,64]. Existing research mainly applied a questionnaire survey [50,54,57,62,99] to quantify the livelihoods. However, the methods are unable to analyze the dynamic changes of the relationships between the two systems because the long-term data were difficult to be accumulated, thereby introducing challenges in identifying spatiotemporal dynamics of coupling relationships under a complex background (e.g., urbanization and ecological environmental change). Our research in the ORTTR of Tibet explored the coupling relationship between residents’ livelihoods and land ecosystem services using a coupled model from 2000 to 2020. The livelihood capital index was used to quantify the residents’ livelihood level. Ecosystem service value was utilized to quantify the land ecosystem service level. Our study sheds light on the relationships between residents’ livelihoods and land ecosystem services and their dynamics by quantifying the coupling degree, coupling coordinate degree, and relative development degree between the two from 2000 to 2020 on the county scale. The research revealed three major findings that could be important for further exploration of the coupling relationships between livelihood and ecosystem service in other similar areas. The findings of the research can be summarized in the following major points: (i) the coupling degree and coupling coordinate degree between livelihood and ecosystem service continued to increase from 2000 to 2020, (ii) the coupling coordination degree showed more revealing results than the coupling degree in time scale, and (iii) identifying the relative development types by relative development index between livelihood and ecosystem service was conducive to ecosystem management zoning of the study area.
Our results have shown that the residents’ livelihood capital index doubled from 0.14 to 0.28 during the study period. The continuous improvement of the financial and social capital provided strong support for the development of the residents’ livelihood. Actually, in the whole of China, the total scale of livelihood capital has increased greatly and has maintained a trend of continuous increase with the development of land use. The rate of change in the western region is lower than that in the central and eastern regions of China, and the imbalance in the development of national livelihood capital has intensified [94]. Poverty livelihoods mainly occurred in the Qinghai–Tibet Plateau [27], and our study in the ORTTR of Tibet has important policy value. During the study period, the coupling degree between residents’ livelihood and land ecosystem service value in the ORTTR of Tibet remained at the medium–high coupling stage, and an intense interaction exists between the residents’ livelihood and the land ecosystem services. Although a series of large-scale or super-large ecological protection projects have achieved remarkable results in the field of ecological protection in the past 20 years [72,100], a win–win situation between livelihood improvement and ecological conservation remained challenging. In the ORTTR of Tibet, ecological protection measures need to consider the dual goals of safeguarding critical ecosystem services and improving residents’ livelihoods to achieve harmonious coexistence between man and nature and attain regional sustainable development. Some other relevant studies [101,102] also confirmed that. Human well-being will suffer if people’s livelihoods are not considered. Although the coupling coordination degree of residents’ livelihoods and land ecosystem services increased, the relative development degree of the two systems in most districts and counties was of the residents’ livelihood lagging type, which introduced challenges about how to achieve win–win of livelihoods and land ecosystem services in the ORTTR of Tibet in the future research.
Our study applied an effective method for assessing the coupling relationship between residents’ livelihoods and land ecosystem services. However, there are still some limitations in the selection of measurement indicators. In our study, the evaluation factors of livelihood capitals were selected from five aspects: natural capital, human capital, physical capital, financial capital, and social capital [15]. The selection of evaluation indicators followed the principles of indicator diversity and data availability. Some indicators (e.g., expenditures on social interaction, loan amounts, and income structure) were relevant to the livelihood capital [81,82,83,84,85,86], but the data availability could not be guaranteed. Therefore, those indicators were not selected in the evaluation system. Although our indicators have covered all the capital types, the impact of the incomplete indicators still need to be attention. In the following research, we will conduct research on some other availability data. Residents’ livelihoods of the ORTTR can be more fully and convincingly assessed in the future.

4.2. Influencing Factors

This study used a coupling model to identify the spatiotemporal changes in the coupling relationship between residents’ livelihoods and land ecosystem services in the ORTTR from 2000 to 2020. Overall, the coupling degree and coupling coordination degree between residents’ livelihoods and land ecosystem services increased. The coupling degree increased from 0.72 in 2000 to 0.82 in 2020 (an increase of 13.75%), and the coupling coordination degree increased from 0.57 to 0.72. The proportion of districts and counties in recession and imbalance decreased from 76.47% to 41.18%. The direct reason is that during the study period, the residents’ livelihood and the land ecosystem service value in the ORTTR were improved.
The ORTTR has a flat terrain and excellent agricultural planting conditions [76]. Its area of arable land accounts for more than half of the total area of arable land in Tibet [78]. It is the birthplace of Tibetan culture. China has included the comprehensive development of the ORTTR as a key construction project in the National Eighth Five-Year Plan and Ten-Year Plan. A total of USD 0.16 billion was allotted to support Tibet. The central basin of the ORTTR is an agriculturally comprehensive area with the highest investment and the largest development scale. It is the largest comprehensive agricultural and animal husbandry development project in Tibet’s history that includes water conservancy, planting, animal husbandry, and forestry in more than 200 key development and construction projects. This project has made the three rivers the “Golden Triangle” of Tibet’s economic development, benefiting 800,000 people. The completion of numerous basic agricultural and animal husbandry projects has greatly improved the production conditions of agriculture and animal husbandry in Tibet. The production and lifestyle of farmers and herdsmen relying on the sky for food and raising animals are becoming history, and agricultural and animal husbandry production has begun to move toward modernization. The supportive policies have laid a good foundation for the future development of Tibet’s ORTTR and improved the infrastructure conditions of the Tibet Autonomous Region. Livelihood capital has been continuously improved. For example, the grain and meat outputs in the ORTTR and the per capita income of farmers and herdsmen have increased significantly in the past 20 years. In the past 20 years, the urban and rural medical and health service systems have been further improved, and free compulsory education has been implemented. All of these provide an effective guarantee for the improvement of the livelihood of residents in the ORTTR.
The enhancement of the land ecosystem service value is directly affected by land use change. The type of land use directly determines the value of ecosystem services, and the effect of different land use type changes on ecosystem services value is different. Some scholars [103,104,105] found urbanization processes could produce a negative impact on ecosystem services. In some ecological sensitive areas, ecosystem service value could be improved because of ecological protection or restoration [106,107,108]. In the ORTTR, ecosystem service value has changed because of the changes in different land use types. From 2000 to 2020, the main land use types in Tibet’s ORTTR were grassland, unused land, and forest land, followed by cultivated land, water area, and construction land. From 2005 to 2010, the area of land use types in the ORTTR underwent great changes, and the area of forest land, water area, construction land, and unused land increased rapidly. The newly added forest land area is 944,200 hectares, the unused land area is 749,600 hectares, the water area is 48,300 hectares, and the construction land area is 285,100 hectares. The areas of cultivated land and grassland showed a decreasing trend. The cultivated land area decreased by 5300 hectares, and the grassland area decreased the most, namely, 944,200 hectares. The reason for the increase in the area of construction land may be that in 2014, county-level Shigatse was changed to Sangzhuzi District. In 2015, Duilongdeqing was removed from the county level and changed into a district. In 2016, Naidong was removed from the county level and transferred to the district level. To meet the needs of urban development, the urbanization process has accelerated, and cultivated land, forest land, and grassland have been occupied and converted into construction land, resulting in an increase in the area of construction land. The greatest decrease in the grassland ecosystem service value was due to the prominent contradiction between grass and livestock in the river valley. Eighty percent of livestock are concentrated in the river valley of the ORTTR, resulting in the overgrazing of grassland, a decline in the proportion of fine grass, the depletion of water sources, and the intensification of desertification. Although grassland reduction and urbanization process produced a negative impact on ecosystem service value, woodlands increase markedly improved ecosystem service value. Moreover, the newly added wetlands and water areas made up for the decline of the ecosystem service value caused by the reduction of grassland, increased the diversity of ecosystem services, and improved the ecosystem service value.
According to the calculation results of the correlation coefficient (Table 10), land use area changes were the major factors that affected the coupling coordinate degree between residents’ livelihoods and land ecosystem services. Woodland area and urbanization level exhibited a positive correlation with the coupling coordinate degree. That is, the higher the woodland area and urbanization level, the higher the coupling coordinate degree. The major factors that exhibited a negative correlation were cultivated land area and grassland area. During the study period, the coupling coordinate degree between residents’ livelihoods and land ecosystem services increased with the decrease in cultivated land area and grassland area, which might mean a decline in human activities. With the enhancement of humans’ awareness of environmental protection, China has begun to issue a series of ecological protection policies, and the ecological protection policies and measures for Tibet’s ORTTR have been promoted. Since 2005, Shannan of the ORTTR has been listed as a National Comprehensive Demonstration Zone for Sand Prevention and Control by the National Forestry Administration. In the same year, the Planning of the Comprehensive Demonstration Zone for Sand Prevention and Control in the Shannan Area of Tibet (2005–2010) was compiled. From 2005 to 2010, the forest land area of the five districts and counties in Shannan increased significantly, which promoted the improvement of ecosystem service value from 2005 to 2010. The overall implementation of afforestation and shelter forest construction projects in Lhasa and its surrounding areas has been good, increasing the forest area and greatly improving the ecological environment of the study area. In 2015, the afforestation and greening project in the “Two Rivers and Four Tributaries” watershed in Tibet was launched, and Nanmulin, as the demonstration and starting area of the “Two Rivers and Four Tributaries” project, effectively promoted the implementation of the ORTTR ecological protection construction project. In 2017, Shannan developed a sand control ecological poverty alleviation project, which played an important role in ecological protection construction. The wetland area in the study area increased. In 2011, the policy titled “Regulations on Wetland Protection of the Tibet Autonomous Region” was passed, focusing on the protection of wetlands, protection of wetland ecological functions and biodiversity, and promotion of sustainable resource utilization; Tibet’s ORTTR was included in this policy. Overall, land use change caused by a series of ecological policies was the main driving force of the improvement in the coupling coordinate degree between residents’ livelihoods and land ecosystem services.

4.3. Policy Enlightenment

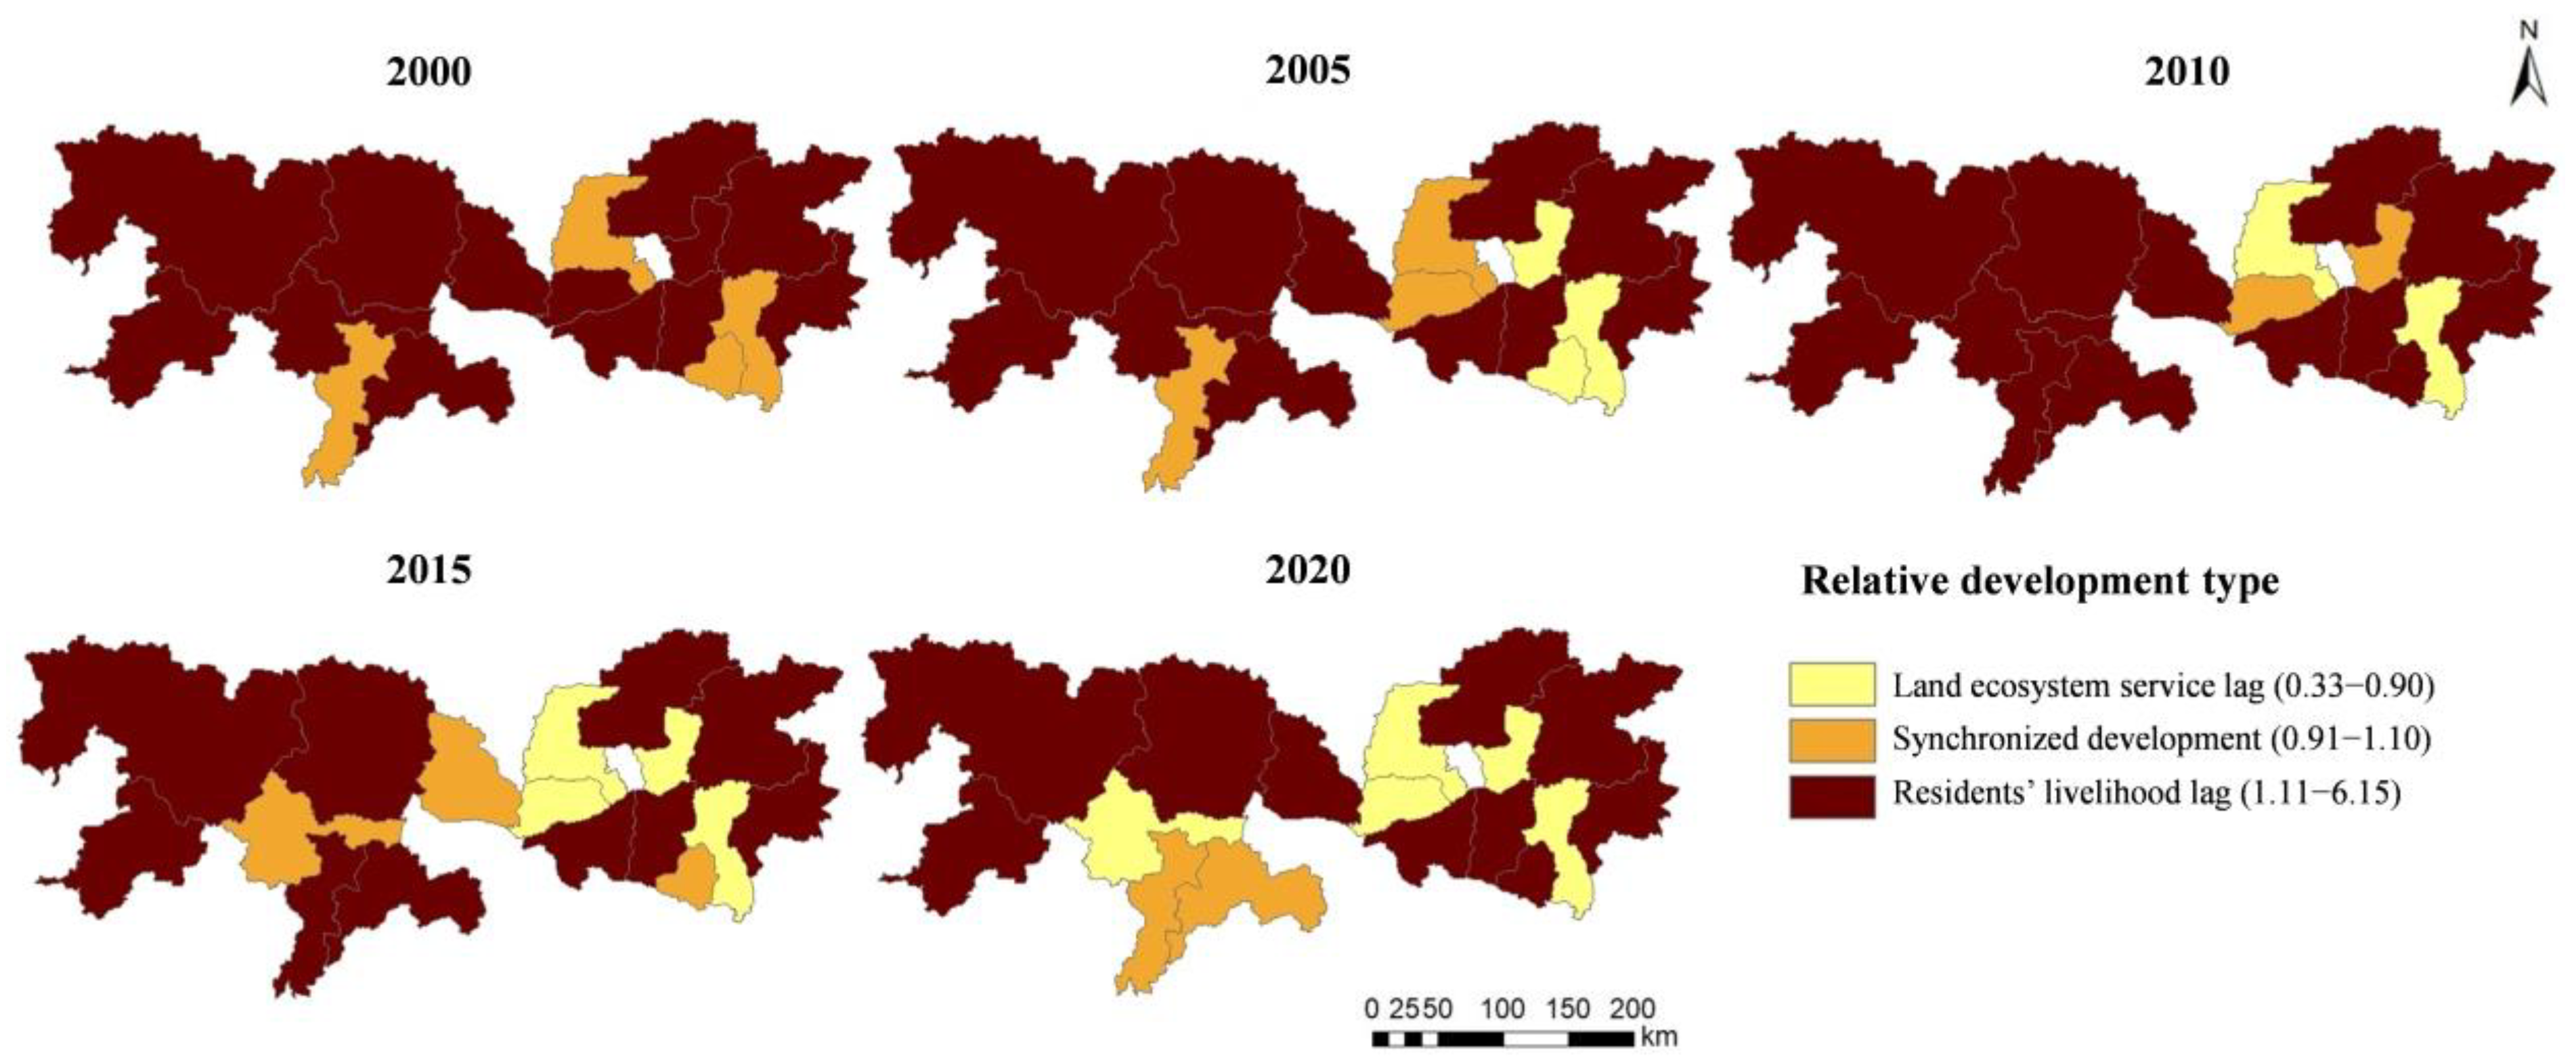
Although the coupling coordination degree between some residents’ livelihoods and land ecosystem services is on the rise, the current results on the relative development degree showed that residents’ livelihoods in the ORTTR lag behind ecosystem services. In 2020, the livelihoods of residents in most districts and counties lagged behind ecosystem services. The relative development index can accurately identify the leading–lagging relationship between residents’ livelihoods and land ecosystem services in each district and county. Therefore, on the basis of the relative development types of residents’ livelihood and ecosystem services, ecological management zoning can be conducted. In 2020, most of the districts and counties in the study area were dominated by residents’ livelihood lag (Figure 6). By considering the physical geography and socio-economic characteristics and by taking the lag of ecosystem services as a reference for ecological management zoning, the counties and districts in the ORTTR are divided into three types of ecological management zones: ecological conservation areas, ecological restoration areas, and ecological reconstruction areas.
Districts and counties with lagging residents’ livelihoods, such as Xietongmen and Nanmulin in the northwest and Mozhugongka in the east, are designated as ecological conservation areas. These counties are high in altitude and sparsely populated. The grassland vegetation coverage is high, with the characteristics of minimal human interference, fragile ecology, and difficult recovery. A comprehensive ban on custodial breeding or rotational grazing should be implemented to reduce human interference and focus on prevention and protection. The government should delimit a strict ecological protection red line. To improve the residents’ livelihoods, land ecosystem service value must be realized in various ways, such as compensation for grassland ecological conservation and ecological tourism development. On the basis of existing ecological vegetation, the counties should plan to build demonstration sites for ecological tourism to create a visual offering of rural and ecological landscapes. The in-depth integration and development of ecological and cultural tourism should be actively promoted.
Bailang and Jiangzi, which are characterized by the simultaneous development of residents’ livelihoods and land ecosystem services, and Lazi, Nimu, Linzhou, Gongga, Zharang, Qiongjie, and Sangri, which are characterized by relatively lagging residents’ livelihoods, are designated as ecological restoration areas. Ecological restoration areas have a low altitude and relatively flat terrain. The vegetation type is mainly alpine meadows. The vegetation coverage is generally high, the water and heat conditions are good, and the ecosystem has a certain self-healing ability. Enclosure management in the key ecological area should be implemented to reduce livestock disturbance and consolidate the existing governance effects. In these areas, the river valley is wide, the soil is fertile, the sunshine is sufficient, and the temperature difference between day and night is large. The fruit industry in this area should be listed as the key industry with the most characteristics, the most potential, and the most promising development prospects. Accelerating the transformation and development of the agricultural industry and realizing agricultural modernization can effectively meet the growing development needs of farmers, encourage overall economic and social progress and improve residents’ livelihoods.
Sangzhuzi, Duilongdeqing, Qushui, Dazi, and Naidong, with lagging ecosystem services, are designated as ecological reconstruction areas, and the population, production, and life of the study area are concentrated in this region. With the acceleration of urbanization and frequent infrastructure construction activities in those areas, soil erosion and land desertification have become serious, and soil and water conservation in the region should be strengthened. In this area, comprehensive control measures that combine engineering measures with forest and grass measures should be adopted, and bank protection and embankment construction should be carried out for the channel. Grids and grass-checkered sand barriers should be built for debris flow channels, the slopes should be changed to ladders, and soil conservation for sloping farmland should be promoted.

5. Conclusions

(1)
Our study sheds light on the relationships between residents’ livelihoods and land ecosystem services using a coupled model from 2000 to 2020 on the county scale of the ORTTR.
(2)
During the study period, the residents’ livelihood level of the ORTTR in Tibet was on the rise. The land ecosystem service value increased by USD 1.58 billion. Therefore, the coupling degree and the coupling coordination degree between the two continued to increase.
(3)
During the study period, the coupling coordination degree between residents’ livelihood and land ecosystem service value in the ORTTR of Tibet transitioned from a reluctant coordination stage to a moderate coordination stage. The coupling coordination degree showed more revealing results than the coupling degree in time scale.
(4)
The relative development degree of the two systems in most districts and counties was of the residents’ livelihood lagging type. By considering the physical geography and socio-economic characteristics and the relative development types between the two, the counties and districts in the ORTTR are divided into ecological conservation areas, ecological restoration areas, and ecological reconstruction areas.
(5)
The coupled model can evaluate the relationship between livelihoods and ecosystem services from a systematic integration perspective and provide scientific support for the improvement of regional human well-being.

Author Contributions

Conceptualization, X.D. and Y.Z.; data curation, J.Z. and D.X.; formal analysis, M.L.; funding acquisition, H.W. and X.D.; investigation, D.X. and M.L.; methodology, J.Z.; visualization, J.Z.; writing—original draft, H.W. and J.Z.; writing—review and editing, H.W. and Y.Z. All authors have read and agreed to the published version of the manuscript.

Funding

This research was funded by the Second Tibetan Plateau Scientific Expedition and Research Program (2019QZKK0608) and the National Natural Science Foundation of China (41901259).

Institutional Review Board Statement

Not applicable.

Informed Consent Statement

Not applicable.

Data Availability Statement

Not applicable.

Conflicts of Interest

The authors declare no conflict of interest.

References

  1. Fu, B.; Zhou, G.; Bai, Y.; Song, C.; Liu, J.; Zhang, H.; Lü, Y.; Zheng, H.; Xie, G. The main terrestrial ecosystem services and ecological security in China. Adv. Earth Sci. 2009, 24, 571–576. (In Chinese) [Google Scholar]
  2. King, E.; Nelson, D.; McGreevy, J. Advancing the integration of ecosystem services and livelihood adaptation. Environ. Res. Lett. 2019, 14, 124057. [Google Scholar] [CrossRef]
  3. Egoh, B.N.; O’Farrell, P.J.; Charef, A.; Gurney, L.J.; Koellner, T.; Abi, H.N.; Egoh, M.; Willemen, L. An African account of ecosystem service provision: Use, threats and policy options for sustainable livelihoods. Ecosyst. Serv. 2012, 2, 71–81. [Google Scholar] [CrossRef]
  4. Daily, G. Nature’s Services: Societal Dependence on Natural Ecosystems; Island Press: Washington, DC, USA, 1997. [Google Scholar]
  5. Costanza, R.; D’Arge, R.; de Groot, R.; Farber, S.; Grasso, M.; Hannon, B.; Limburg, K.; Naeem, S.; O’Neill, R.V.; Paruelo, J.; et al. The value of the world’s ecosystem services and natural capital. Nature 1997, 387, 253–260. [Google Scholar] [CrossRef]
  6. De Groot, R.S.; Alkemade, R.; Braat, L.; Hein, L.; Willemen, L. Challenges in integrating the concept of ecosystem services and values in landscape planning, management and decision making. Ecol. Complex. 2010, 7, 260–272. [Google Scholar] [CrossRef]
  7. Millennium Ecosystem Assessment (MEA). Ecosystems and Human Well-Being: Health Synthesis; Island Press: Washington, DC, USA, 2005. [Google Scholar]
  8. Gnatyeva, M.; Yurak, V.; Dushin, A. Valuating Natural Resources and Ecosystem Services: Systematic Review of Methods in Use. Sustainability 2022, 14, 1901. [Google Scholar] [CrossRef]
  9. Bostian, M.; Lundgren, T. Valuing Ecosystem Services for Agricultural TFP: A Review of Best Practices, Challenges, and Recommendations. Sustainability 2022, 14, 3035. [Google Scholar] [CrossRef]
  10. Suich, H.; Howe, C.; Mace, G. Ecosystem services and poverty alleviation: A review of the empirical links. Ecosyst. Serv. 2015, 12, 137–147. [Google Scholar] [CrossRef]
  11. Pan, Y.; Wu, J.; Zhang, Y.; Zhang, X.; Yu, C. Simultaneous enhancement of ecosystem services and poverty reduction through adjustments to subsidy policies relating to grassland use in Tibet, China. Ecosyst. Serv. 2021, 48, 101254. [Google Scholar] [CrossRef]
  12. Li, Z.; Liu, M. Livelihood Diversification Helps Herder Households on the Mongolian Plateau Reduce Emissions: A Case Study of a Typical Pastoral Area. Agronomy 2022, 12, 267. [Google Scholar] [CrossRef]
  13. Wang, Y.; Zhou, L. Performance and Obstacle Tracking to Qilian Mountains’ Ecological Resettlement Project: A Case Study on the Theory of Public Value. Land 2022, 11, 910. [Google Scholar] [CrossRef]
  14. Everard, M.; Kataria, G.; Kumar, S.; Gupta, N. Assessing Livelihood-Ecosystem Interdependencies and Natural Resource Governance in a Tribally Controlled Region of India’s North-Eastern Middle Himalayas. Environ. Dev. Sustain. 2021, 23, 7772–7790. [Google Scholar] [CrossRef]
  15. DFID. Sustainable Livelihoods Guidance Sheets; Department for International Development: London, UK, 2000. [Google Scholar]
  16. Chambers, R.; Conway, G.R. Sustainable Rural Livelihoods: Practical Concepts for the 21st Century; IDS Discussion Paper No. 296; Institute of Development Studies: Brighton, UK, 1992. [Google Scholar]
  17. Su, F.; Xu, Z.; Shang, H. An Overview of Sustainable Livelihoods Approach. Adv. Earth Sci. 2009, 24, 61–69. (In Chinese) [Google Scholar]
  18. Scoones, I. Sustainable Rural Livelihoods: A Framework for Analysis; IDS Working Paper 72; Institute of Development Studies: Brighton, UK, 1998. [Google Scholar]
  19. Tang, Q. Research progress and future key trends of sustainable livelihoods. Adv. Earth Sci. 2015, 30, 823–833. (In Chinese) [Google Scholar]
  20. Frankenberger, T.; Maxwell, M. Operational Household Livelihood Security: A Holistic Approach for Addressing Poverty and Vulnerability; Cooperative for American Remittances to Everywhere: Washington, DC, USA, 2000. [Google Scholar]
  21. Lasse, K. The Sustainable Livelihood Approach to Poverty Reduction; Swedish International Development Cooperation Agency: Stockholm, Swedish, 2001; pp. 42–98. [Google Scholar]
  22. He, R.; Liu, S.; Chen, G.; Xie, F.; Yang, X.; Liang, L. Research progress and tendency of sustainable livelihoods for peasant household in China. Prog. Geogr. 2013, 32, 657–670. (In Chinese) [Google Scholar]
  23. Wang, X.; Peng, L.; Xu, D.; Wang, X. Sensitivity of Rural Households’ Livelihood Strategies to Livelihood Capital in Poor Mountainous Areas: An Empirical Analysis in the Upper Reaches of the Min River, China. Sustainability 2019, 11, 2193. [Google Scholar] [CrossRef]
  24. Fang, Y.; Fan, J.; Shen, M.; Song, M. Sensitivity of livelihood strategy to livelihood capital in mountain areas: Empirical analysis based on different settlements in the upper reaches of the Minjiang River, China. Ecol. Indic. 2014, 38, 225–235. [Google Scholar] [CrossRef]
  25. Wang, W.; Gong, J.; Wang, Y.; Shen, Y. The Causal Pathway of Rural Human Settlement, Livelihood Capital, and Agricultural Land Transfer Decision-Making: Is It Regional Consistency? Land 2022, 11, 1077. [Google Scholar] [CrossRef]
  26. Liu, H.; Pan, W.; Su, F.; Huang, J.; Luo, J.; Tong, L.; Fang, X.; Fu, J. Livelihood Resilience of Rural Residents under Natural Disasters in China. Sustainability 2022, 14, 8540. [Google Scholar] [CrossRef]
  27. Zhou, L.; Guan, D.; Yuan, X. Coupling correlation analysis of ecosystem services and livelihoods in the perspective of targeted poverty alleviation. Acta Ecol. Sin. 2018, 38, 6391–6401. (In Chinese) [Google Scholar]
  28. Diniz, F.H.; Hoogstra-Klein, M.A.; Kok, K.; Arts, B. Livelihood strategies in settlement projects in the brazilian amazon: Determining drivers and factors within the agrarian reform program. J. Rural Stud. 2013, 32, 196–207. [Google Scholar] [CrossRef]
  29. Hua, X.; Yan, J.; Zhang, Y.L. Evaluating the role of livelihood assets in suitable livelihood strategies: Protocol for anti-poverty policy in the Eastern Tibetan Plateau, China. Ecol. Indic. 2017, 78, 62–74. [Google Scholar] [CrossRef]
  30. Guan, D.; Sun, L.; Zhou, L. Construction and application of coupling model of ecosystem service and farmers’ livelihood in Three Gorges Reservoir area. Res. Soil Water Conserv. 2020, 27, 269–277. (In Chinese) [Google Scholar]
  31. Cazcarro, I.; Arto, I.; Hazra, S.; Bhattacharya, R.N.; Osei-Wusu Adjei, P.; Ofori-Danson, P.K.; Asenso, J.K.; Amponsah, S.K.; Khondker, B.; Raihan, S.; et al. Biophysical and Socioeconomic State and Links of Deltaic Areas Vulnerable to Climate Change: Volta (Ghana), Mahanadi (India) and Ganges-Brahmaputra-Meghna (India and Bangladesh). Sustainability 2018, 10, 893. [Google Scholar] [CrossRef]
  32. Peng, W.; Robinson, B.E.; Zheng, H.; Li, C.; Wang, F.; Li, R. Telecoupled Sustainable Livelihoods in an Era of Rural–Urban Dynamics: The Case of China. Sustainability 2019, 11, 2716. [Google Scholar] [CrossRef]
  33. He, S.; Gallagher, L.; Min, Q. Examining Linkages among Livelihood Strategies, Ecosystem Services, and Social Well-Being to Improve National Park Management. Land 2021, 10, 823. [Google Scholar] [CrossRef]
  34. Deng, X.; Yan, S.; Song, X.; Li, Z.; Mao, J. Spatial targets and payment modes of win–win payments for ecosystem services and poverty reduction. Ecol. Indic. 2022, 136, 108612. [Google Scholar] [CrossRef]
  35. Zheng, H.; Robinson, B.E.; Liang, Y.-C.; Polasky, S.; Ma, D.-C.; Wang, F.-C.; Ruckelshaus, M.; Ouyang, Z.-Y.; Daily, G.C. Benefits, costs, and livelihood implications of a regional payment for ecosystem service program. Proc. Natl. Acad. Sci. USA 2013, 110, 16681–16686. [Google Scholar] [CrossRef]
  36. Bailey, I.; Buck, L.E. Managing for resilience: A landscape framework for food and livelihood security and ecosystem services. Food Secur. 2016, 8, 477–490. [Google Scholar] [CrossRef]
  37. Liu, M.; Wei, H.; Dong, X.; Wang, X.; Zhao, B.; Zhang, Y. Integrating Land Use, Ecosystem Service, and Human Well-Being: A Systematic Review. Sustainability 2022, 14, 6926. [Google Scholar] [CrossRef]
  38. Bremer, L.L. Land-Use Change, Ecosystem Services, and Local Livelihoods: Ecological and Socioeconomic Outcomes of Payment for Ecosystem Services in Ecuadorian Páramo Grasslands. Ph.D. Thesis, University of California, Santa Barbara and San Diego State University, Santa Barbara, CA, USA, 2012. [Google Scholar]
  39. Teague, R.; Barnes, M. Grazing Management That Regenerates Ecosystem Function and Grazingland Livelihoods. Afr. J. Range Forage Sci. 2017, 34, 77–86. [Google Scholar] [CrossRef]
  40. Xu, J.; Zhang, Y.; Huang, C.; Zeng, L.; Teng, M.; Wang, P.; Xiao, W. Forest restoration shows uneven impacts on soil erosion, net primary productivity and livelihoods of local households. Ecol. Ind. 2022, 134, 108462. [Google Scholar] [CrossRef]
  41. Kumar, H.; Pandey, B.W.; Anand, S. Analyzing the Impacts of forest Ecosystem Services on Livelihood Security and Sustainability: A Case Study of Jim Corbett National Park in Uttarakhand. Int. J. Geoherit. Parks 2019, 7, 45–55. [Google Scholar] [CrossRef]
  42. Orchard, S.E.; Stringer, L.C.; Quinn, C.H. Mangrove system dynamics in Southeast Asia: Linking livelihoods and ecosystem services in Vietnam. Reg. Environ. Chang. 2016, 16, 865–879. [Google Scholar] [CrossRef]
  43. Landreth, N.; Saito, O. An Ecosystem Services Approach to Sustainable Livelihoods in the Homegardens of Kandy, Sri Lanka. Aust. Geogr. 2014, 45, 355–373. [Google Scholar] [CrossRef]
  44. Setiani, S.; Setiawan, E.; Huang, W.-C. Taneyan Lanjang Shared Home Gardens and Sustainable Rural Livelihoods of Ethnic Madurese in Madura Island, Indonesia. Sustainability 2022, 14, 5960. [Google Scholar] [CrossRef]
  45. Bhatta, L.D.; Chaudhary, S.; Pandit, A.; Baral, H.; Das, P.J.; Stork, N.E. Ecosystem Service Changes and Livelihood Impacts in the Maguri-Motapung Wetlands of Assam, India. Land 2016, 5, 15. [Google Scholar] [CrossRef]
  46. Marambanyika, T.; Mupfiga, U.N.; Musasa, T.; Ngwenya, K. Local Perceptions on the Impact of Drought on Wetland Ecosystem Services and Associated Household Livelihood Benefits: The Case of the Driefontein Ramsar Site in Zimbabwe. Land 2021, 10, 587. [Google Scholar] [CrossRef]
  47. Ji, Z.; Wei, H.; Xue, D.; Liu, M.; Cai, E.; Chen, W.; Feng, X.; Li, J.; Lu, J.; Guo, Y. Trade-Off and Projecting Effects of Land Use Change on Ecosystem Services under Different Policies Scenarios: A Case Study in Central China. Int. J. Environ. Res. Public Health 2021, 18, 3552. [Google Scholar] [CrossRef]
  48. Lu, X.; Jiang, B.; Liu, M.; Li, Y.; Chen, D. A Study on the Gains and Losses of the Ecosystem Service Value of the Land Consolidation Projects of Different Properties in Hubei Province: An Empirical Comparison Based on Plains, Mountains and Hills. Land 2022, 11, 1015. [Google Scholar] [CrossRef]
  49. Fu, B.; Zhang, L. Land-use change and ecosystem services: Concepts, methods and progress. Prog. Geogr. 2014, 33, 441–446. (In Chinese) [Google Scholar]
  50. Chettri, N.; Aryal, K.; Thapa, S.; Uddin, K.; Kandel, P.; Karki, S. Contribution of ecosystem services to rural livelihoods in a changing landscape: A case study from the Eastern Himalaya. Land Use Policy 2021, 109, 105643. [Google Scholar] [CrossRef]
  51. Robinson, B.; Zheng, H.; Peng, W. Disaggregating livelihood dependence on ecosystem services to inform land management. Ecosyst. Serv. 2019, 36, 100902. [Google Scholar] [CrossRef]
  52. Nöldeke, B.; Winter, E.; Laumonier, Y.; Simamora, T. Simulating Agroforestry Adoption in Rural Indonesia: The Potential of Trees on Farms for Livelihoods and Environment. Land 2021, 10, 385. [Google Scholar] [CrossRef]
  53. Reed, J.; van Vianen, J.; Foli, S.; Clendenning, J.; Yang, K.; MacDonald, M.; Petrokofsky, G.; Padoch, C.; Sunderland, T. Trees for life: The ecosystem service contribution of trees to food production and livelihoods in the tropics. For. Policy Econ. 2017, 84, 62–71. [Google Scholar] [CrossRef]
  54. Mendako, R.K.; Tian, G.; Ullah, S.; Sagali, H.L.; Kipute, D.D. Assessing the Economic Contribution of Forest Use to Rural Livelihoods in the Rubi-Tele Hunting Domain, DR Congo. Forests 2022, 13, 130. [Google Scholar] [CrossRef]
  55. Kalaba, F.K.; Helen, C.; Dougill, A.J. Contribution of forest provisioning ecosystem services to rural livelihoods in the Miombo woodlands of Zambia. Popul. Environ. 2013, 35, 159–182. [Google Scholar] [CrossRef]
  56. Thuy, P.; Duong, P. Impacts of Payment for Forest Ecosystem Services on Local livelihoods in A Luoi District, Thua Thien Hue Province, Viet Nam. For. Soc. 2022, 6, 590–608. [Google Scholar] [CrossRef]
  57. Waruingi, E.; Mbeche, R.; Ateka, J. Determinants of forest dependent household’s participation in payment for ecosystem services: Evidence from Plantation Establishment Livelihood Improvement Scheme (PELIS) in Kenya. Glob. Ecol. Conserv. 2021, 26, e01514. [Google Scholar] [CrossRef]
  58. Bhatta, M.; Garnett, S.T.; Zander, K.K. Exploring Options for a PES-like Scheme to Conserve Red Panda Habitat and Livelihood Improvement in Western Nepal. Ecosyst. Serv. 2022, 53, 101388. [Google Scholar] [CrossRef]
  59. Blundo-Canto, G.; Bax, V.; Quintero, M.; Cruz-Garcia, G.S.; Groeneveld, R.A.; Perez-Marulanda, L. The different dimensions of livelihood impacts of Payments for Environmental Services (PES) schemes: A systematic review. Ecol. Econ. 2018, 149, 160–183. [Google Scholar] [CrossRef]
  60. Renaud, F.G.; Szabo, S.; Matthews, Z. Sustainable deltas: Livelihoods, ecosystem services, and policy implications. Sustain. Sci. 2016, 11, 519–523. [Google Scholar] [CrossRef]
  61. Reed, M.S.; Stringer, L.C.; Dougill, A.J.; Perkins, J.S.; Atlhopheng, J.R.; Mulale, K.; Favretto, N. Reorienting land degradation towards sustainable land management: Linking sustainable livelihoods with ecosystem services in rangeland systems. J. Environ. Manag. 2015, 151, 472–485. [Google Scholar] [CrossRef] [PubMed]
  62. Das, M.; Das, A.; Pandey, R. Exploring nexus between ecosystem services and livelihood dependency for sustainable ecosystem management in lower Gangetic plains, Eastern India. Environ. Sci. Pollut. Res. 2022, 29, 1–17. [Google Scholar] [CrossRef]
  63. Huq, N.; Pedroso, R.; Bruns, A.; Ribbe, L.; Huq, S. Changing dynamics of livelihood dependence on ecosystem services at temporal and spatial scales: An assessment in the southern wetland areas of Bangladesh. Ecol. Indic. 2020, 110, 105855. [Google Scholar] [CrossRef]
  64. Ehara, M.; Hyakumura, K.; Sato, R.; Kurosawa, K.; Araya, K.; Sokh, H.; Kohsaka, R. Addressing maladaptive coping strategies of local communities to changes in ecosystem service provisions using the DPSIR framework. Ecol. Econ. 2018, 149, 226–238. [Google Scholar] [CrossRef]
  65. Bhatta, L.D.; van Oort, B.E.H.; Stork, N.E.; Baral, H. Ecosystem services and livelihoods in a changing climate: Understanding local adaptations in the Upper Koshi, Nepal. Int. J. Biodivers. Sci. Ecosyst. Serv. Manag. 2015, 11, 145–155. [Google Scholar] [CrossRef]
  66. Jinger, D.; Khatri, P.; Kumari, K.; Kumar, D.; Dinesh, D. Agroforestry-Based ecosystem services for livelihood resilience. Food Sci. Rep. 2022, 3, 50–55. [Google Scholar]
  67. Hempattarasuwan, N.; Untong, A.; Christakos, G.; Wu, J. Wetland changes and their impacts on livelihoods in Chiang Saen Valley, Chiang Rai Province, Thailand. Reg. Environ. Change 2021, 21, 1–15. [Google Scholar] [CrossRef]
  68. Thapa, S.; Shrestha, S.; Adhikari, R.; Bhattarai, S.; Paudel, D.; Gautam, D.; Koirala, A. Residents’ willingness-to-pay for watershed conservation program facilitating ecosystem services in Begnas watershed, Nepal. Environ. Dev. Sustain. 2022, 24, 7811–7832. [Google Scholar] [CrossRef]
  69. Su, S.; Wu, L. Research on the coupling coordination of ecological environment and economic development in concentrated destitute area of Liupanshan Mountain in Ningxia Autonomous Region. Res. Soil Water Conserv. 2019, 26, 286–291, 298. (In Chinese) [Google Scholar]
  70. Yao, S.; Zhang, P.; Yu, C.; Li, J.; Wang, C. The Theory and Practice of New Urbanization in China. Sci. Geogr. Sin. 2014, 34, 641–647. (In Chinese) [Google Scholar]
  71. Wei, H.; Xue, D.; Huang, J.; Liu, M.; Li, L. Identification of Coupling Relationship between Ecosystem Services and Urbanization for Supporting Ecological Management: A Case Study on Areas along the Yellow River of Henan Province. Remote Sens. 2022, 14, 2277. [Google Scholar] [CrossRef]
  72. Hu, L.; Wu, J.; Li, H. The coupling relationship between ecosystem services and residents’ income and its impact factors: A case study of the Lashihai basin in Lijiang, Yunan. Acta Ecol. Sin. 2018, 38, 6402–6411. (In Chinese) [Google Scholar]
  73. Zhou, Y.; Zhang, X.; Yu, H.; Liu, Q.; Xu, L. Land Use-Driven Changes in Ecosystem Service Values and Simulation of Future Scenarios: A Case Study of the Qinghai–Tibet Plateau. Sustainability 2021, 13, 4079. [Google Scholar] [CrossRef]
  74. Min, Q.; Cheng, S. Poverty, ecology and development in Tibet. Resour. Sci. 2001, 23, 62–67. (In Chinese) [Google Scholar]
  75. Dong, H.; Feng, Z.; Yang, Y.; Li, P.; You, Z. Dynamic assessment of ecological sustainability and the associated driving factors in Tibet and its cities. Sci. Total Environ. 2021, 759, 143552. [Google Scholar] [CrossRef]
  76. Li, C.; Yan, J.; Hua, X.; Zhang, Y. Household-level livelihood vulnerability assessment in the YNL River Region of the Tibetan Plateau, China. Mt. Res. 2018, 36, 930–941. (In Chinese) [Google Scholar]
  77. Ding, Y.; Shi, B.; Su, G.; Li, Q.; Meng, J.; Jiang, Y.; Qin, Y.; Dai, L.; Song, S. Assessing Suitability of Human Settlements in High-Altitude Area Using a Comprehensive Index Method: A Case Study of Tibet, China. Sustainability 2021, 13, 1485. [Google Scholar] [CrossRef]
  78. Li, D.; Tian, P.; Luo, H.; Luo, Y.; Cui, Y. Spatio-temporal characteristics and obstacle diagnosis of cultivated land ecological security in “one river and two tributaries”region in Tibet. Trans. Chin. Soc. Agric. Mach. 2020, 51, 213–222. (In Chinese) [Google Scholar]
  79. Yan, J.; Wu, Y.; Zhang, Y.; Zhou, S. Livelihood diversification of farmers and nomads of eastern transect in Tibetan Plateau. J. Geogr. Sci. 2010, 20, 757–770. (In Chinese) [Google Scholar] [CrossRef]
  80. Xie, G.; Zhang, C.; Zhang, C.; Xiao, Y.; Lu, C. The value of ecosystem services in China. Resour. Sci. 2015, 37, 1740–1746. (In Chinese) [Google Scholar]
  81. Osamu, S.; Chiho, K.; Shizuka, H.; Takanori, M.; Kikuko, S.; Kei, K.; Tomoko, U.; Hisatomo, T.; Yoichi, I.; Kyohei, M. Co-design of national-scale future scenarios in japan to predict and assess natural capital and ecosystem services. Sustain. Sci. 2018, 14, 5–21. [Google Scholar] [CrossRef]
  82. Kuang, F.; Jin, J.; He, R.; Wan, X.; Ning, J. Influence of livelihood capital on adaptation strategies: Evidence from rural households in Wushen Banner, China. Land Use Policy 2019, 89, 104228. [Google Scholar] [CrossRef]
  83. Liu, M.; Feng, X.; Wang, S. Does poverty-alleviation-based industry development improve farmers’ livelihood capital? J. Integr. Agric. 2021, 20, 915–926. [Google Scholar] [CrossRef]
  84. Wang, W.; Lan, Y.; Wang, X. Impact of livelihood capital endowment on poverty alleviation of households under rural land consolidation. Land Use Policy 2021, 109, 105608. [Google Scholar] [CrossRef]
  85. Wang, M.; Li, M.; Jin, B.; Yao, L.; Ji, H. Does Livelihood Capital Influence the Livelihood Strategy of Herdsmen? Evidence from Western China. Land 2021, 10, 763. [Google Scholar] [CrossRef]
  86. Islam, K.; Nath, T.; Jashimuddin, M.; Rahman, M. Forest dependency, co-management and improvement of peoples’ livelihood capital: Evidence from Chunati Wildlife Sanctuary, Bangladesh. Environ. Dev. 2019, 32, 100456. [Google Scholar] [CrossRef]
  87. Yang, L.; Liu, M.; Lun, F.; Min, Q.; Zhang, C.; Li, H. Livelihood Assets and Strategies among Rural Households: Comparative Analysis of Rice and Dryland Terrace Systems in China. Sustainability 2018, 10, 2525. [Google Scholar] [CrossRef]
  88. Radford, K.; James, P. Changes in the value of ecosystem services along a rural–urban gradient: A case study of Greater Manchester, UK. Landsc. Urban Plan. 2013, 109, 117–127. [Google Scholar] [CrossRef]
  89. Quintas-Soriano, C.; Martín-López, B.; Santos-Martín, F.; Loureiro, M.; Montes, C.; Benayas, J.; García-Llorente, M. Ecosystem services values in Spain: A meta-analysis. Environ. Sci. Policy 2016, 55, 186–195. [Google Scholar] [CrossRef]
  90. Sutton, P.C.; Anderson, S.J.; Costanza, R.; Kubiszewski, I. The ecological economics of land degradation: Impacts on ecosystem service values. Ecol. Econ. 2016, 129, 182–192. [Google Scholar] [CrossRef]
  91. Webb, E.L.; Jachowski, N.R.A.; Phelps, J.; Friess, D.A.; Than, M.M.; Ziegler, A.D. Deforestation in the Ayeyarwady Delta and the conservation implications of an internationally-engaged Myanmar. Glob. Environ. Chang. 2014, 24, 321–333. [Google Scholar] [CrossRef]
  92. Anderson, S.; Ankor, B.; Sutton, P. Ecosystem service valuations of South Africa using a variety of land cover data sources and resolutions. Ecosyst. Serv. 2017, 27, 173–178. [Google Scholar] [CrossRef]
  93. Xie, G.; Zhen, L.; Lu, C.; Xiao, Y.; Chen, C. Expert Knowledge Based Valuation Method of Ecosystem Services in China. J. Nat. Resour. 2008, 23, 911–919. (In Chinese) [Google Scholar]
  94. Wu, J.; Yang, H. Study on spatio-temporal evolution and coupling coordination of livelihood capital of urban and rural residents in China. Econ. Inq. Issues 2020, 11, 27–40. (In Chinese) [Google Scholar]
  95. Singh, S.; Chatterjee, S. Forest Certification Related to Non-Timber Forest Products (NTFPs) in India: Study of NTFP Harvest of Rhododendrons in Western Himalayas for Its Sustainable Use. Environ. Sci. Proc. 2022, 13, 19. [Google Scholar] [CrossRef]
  96. Cuni-Sanchez, A.; Ngute, A.; Sonké, B.; Sainge, M.; Burgess, N.; Klein, J.; Marchant, R. The importance of livelihood strategy and ethnicity in forest ecosystem services’ perceptions by local communities in north-western Cameroon. Ecosyst. Serv. 2019, 40, 101000. [Google Scholar] [CrossRef]
  97. Wang, F.; Yang, D.; Wang, C.; Zhang, X. The Effect of Payments for Ecosystem Services Programs on the Relationship of Livelihood Capital and Livelihood Strategy among Rural Communities in Northwestern China. Sustainability 2015, 7, 9628–9648. [Google Scholar] [CrossRef]
  98. Nhamo, L.; Mpandeli, S.; Liphadzi, S.; Mabhaudhi, T. Securing Land and Water for Food Production through Sustainable Land Reform: A Nexus Planning Perspective. Land 2022, 11, 974. [Google Scholar] [CrossRef]
  99. Musakwa, W.; Mpofu, E.; Nyathi, N.A. Local Community Perceptions on Landscape Change, Ecosystem Services, Climate Change, and Livelihoods in Gonarezhou National Park, Zimbabwe. Sustainability 2020, 12, 4610. [Google Scholar] [CrossRef]
  100. Li, Q.; Shi, X.; Wu, Q. Effects of protection and restoration on reducing ecological vulnerability. Sci. Total Environ. 2021, 761, 143180. [Google Scholar] [CrossRef] [PubMed]
  101. Sheng, W.; Zhen, L.; Xiao, Y.; Hu, Y. Ecological and socioeconomic effects of ecological restoration in China’s Three Rivers Source Region. Sci. Total Environ. 2019, 650, 2307–2313. [Google Scholar] [CrossRef] [PubMed]
  102. Yurui, L.; Xuanchang, Z.; Zhi, C.; Zhengjia, L.; Zhi, L.; Yansui, L. Towards the progress of ecological restoration and economic development in China’s Loess Plateau and strategy for more sustainable development. Sci. Total Environ. 2021, 756, 143676. [Google Scholar] [CrossRef]
  103. Sharma, S.; Nahid, S.; Sharma, M.; Sannigrahi, S.; Anees, M.M.; Sharma, R.; Shekhar, R.; Basu, A.S.; Pilla, F.; Basu, B.; et al. A long-term and comprehensive assessment of urbanization-induced impacts on ecosystem services in the capital city of India. City Environ. Interact. 2020, 7, 100047. [Google Scholar] [CrossRef]
  104. Prakash, M.C.; Milap, P. Impact of urbanization processes on availability of ecosystem services in National Capital Region of Delhi (1992–2010). Environ. Dev. Sustain. 2022, 24, 7324–7348. [Google Scholar] [CrossRef]
  105. Ferreira, L.; Esteves, L.; de Souza, E.; dos Santos, C. Impact of the urbanisation process in the availability of ecosystem services in a tropical ecotone area. Ecosystems 2019, 22, 266–282. [Google Scholar] [CrossRef]
  106. Peh, K.S.-H.; Balmford, A.; Field, R.H.; Lamb, A.; Birch, J.C.; Bradbury, R.B.; Brown, C.; Butchart, S.H.M.; Lester, M.; Morrison, R.; et al. Benefits and costs of ecological restoration: Rapid assessment of changing ecosystem service values at a U.K. wetland. Ecol. Evol. 2014, 4, 3875–3886. [Google Scholar] [CrossRef]
  107. Wang, Y.; Gao, J.; Wang, J.; Qiu, J. Value assessment of ecosystem services in nature reserves in Ningxia, China: A response to ecological restoration. PLoS ONE 2014, 9, e89174. [Google Scholar] [CrossRef]
  108. Solomon, N.; Segnon, A.C.; Birhane, E. Ecosystem Service Values Changes in Response to Land-Use/Land-Cover Dynamics in Dry Afromontane Forest in Northern Ethiopia. Int. J. Environ. Res. Public Health 2019, 16, 4653. [Google Scholar] [CrossRef]
Figure 1. Geographical location of the study area.
Land 11 01377 g001
Figure 2. Spatiotemporal distribution of residents’ livelihood capital index in the ORTTR from 2000 to 2020.
Land 11 01377 g002
Figure 3. Spatiotemporal distribution of ecosystem service value in the ORTTR from 2000 to 2020.
Land 11 01377 g003
Figure 4. Spatiotemporal distribution of the coupling degree between residents’ livelihoods and land ecosystem service value in the ORTTR of Tibet from 2000 to 2020.
Land 11 01377 g004
Figure 5. Spatiotemporal distribution of the coupling coordination degree between residents’ livelihoods and land ecosystem services in the ORTTR from 2000 to 2020.
Land 11 01377 g005
Figure 6. Spatiotemporal distribution of the relative development between residents’ livelihoods and land ecosystem services in the ORTTR of Tibet from 2000 to 2020.
Land 11 01377 g006
Table 1. Measurement of livelihood capital in the ORTTR.
SystemSub-SystemIndex Sign LayerQuantification of Indicators (Dimensions)Weight
Livelihood capitalNatural capitalCultivated landPer capita cultivated land area (ha/person)0.14
WoodlandPer capita woodland area (ha/person)0.40
GrasslandPer capita grassland area (ha/person)0.20
Water areaPer capita water area (ha/person)0.26
Physical capitalVillage residential landPer capita village residential land (square meter/person)0.23
Agricultural machineryTotal power of agricultural machinery (10,000 kilowatts)0.27
MeatTotal meat production (ton/10,000 people)0.21
GrainTotal grain production (ton/10,000 people)0.29
Human capitalRural populationRural population (10,000 people)0.38
Agriculture, animal husbandry, and fishery practitionersAgriculture, animal husbandry, and fishery practitioners (10,000 people)0.27
Number of ordinary middle school students in schoolNumber of ordinary middle school students in school (10,000 people)0.35
Financial capitalSavings deposits of urban and rural residentsBalance of savings deposits of urban and rural residents (USD 10,000)0.70
Industrial output valueAdded value of the primary industry (USD 10,000)0.30
Social capitalMedical and health institution bedsNumber of hospital beds per 10,000 people0.14
Urbanization levelUrbanization rate (%)0.86
Table 2. Grain planting area, grain output, and annual average price of grain in the ORTTR.
YearGrain Planting Area (hm2)Grain Production (ton)Average Price of Grain (USD/ton)
2000255,188.16529,259159
2005254,288.52500,704189
2010249,349.14489,379271
2015246,802.68539,979334
2020242,637.21548,744322
Table 3. Ecosystem service value per unit area of land use types in the ORTTR (USD/hm2).
Land Use TypesProvisioning ServicesRegulating ServicesSupporting ServicesCultural Services
Food ProductionRaw Material ProductionWater Resources SupplyGas RegulationClimate RegulationEnvironment PurificationHydrology
Regulation
Soil ConservationMaintaining Nutrient CirculationBiodiversityAesthetic Landscape
Dryland65.430.81.551.627.77.720.879.39.210.04.6
Paddy field104.76.9−202.585.543.913.1209.50.814.616.26.9
Mixed coniferous broad-leaved forest23.954.728.5181.0541.3153.2270.3220.216.9200.287.8
Shrub14.633.116.9108.6325.798.6258.0132.410.0120.953.1
Grassland7.710.86.239.3103.233.975.547.73.943.119.2
Meadow16.925.413.987.8232.677.0170.2107.08.597.843.1
Wetland39.338.5199.4146.3277.2277.21865.7177.913.9606.0364.2
Desert0.82.31.58.57.723.916.210.00.89.23.9
Bare land0.00.00.01.50.07.72.31.50.01.50.8
River61.617.7638.359.3176.3427.47872.671.65.4196.4145.5
Glacier and accumulated snow0.00.0166.313.941.612.3549.00.00.00.86.9
Table 4. Coupling type judgment criteria.
Judgment Conditions0 < C ≤ 0.390.40 ≤ C ≤ 0.590.60 ≤ C ≤ 0.790.80 ≤ C < 1C = 1
Type of developmentLow-coupling stageAntagonistic stageMedium-coupling stageHigh-coupling stageMaximum coupling stage
Table 5. Discrimination criteria for the coupling coordination type.
Partition IntervalCoupling Coordination Degree (K)Grade
Developmental disorder stage0 < K ≤ 0.390.00–0.09Extreme dissonance recession
0.10–0.19Severe dissonance recession
0.20–0.29Moderate dissonance recession
0.30–0.39Mild dissonance recession
Transformation stage0.40 ≤ K ≤ 0.690.40–0.49Close to dissonance recession
0.50–0.59Reluctant coordination
0.60–0.69Primary coordination
Coordinated development stage0.70 ≤ K ≤ 1.0.70–0.79Moderate coordination
0.80–0.89Good coordination
0.90–1.00Excellent coordination
Table 6. Classification standard for relative development types.
TypeRelative Development DegreeClassification
Relative development types0 < β = U1/U2 < 0.9Land ecosystem service lag
0.9 < β = U1/U2 < 1.1Synchronized development of residents’ livelihoods and land ecosystem services
β = U1/U2 > 1.1Residents’ livelihood lag
Table 7. Residents’ livelihood capital index in the ORTTR from 2000 to 2020.
Capital Type20002005201020152020
Natural capital0.100.170.220.230.21
Physical capital0.200.180.190.250.18
Financial capital0.040.050.100.240.42
Social capital0.100.110.180.220.23
Human capital0.250.340.370.360.33
Livelihood capital0.140.170.210.260.28
Table 8. Changes in the land ecosystem service value in Tibet’s ORTTR in 2000, 2005, 2010, 2015, and 2020.
Land Use TypesLand Ecosystem Service Value (ESV/a Hundred Million USD)Rate of Change (%)
200020052010201520202000–20052005–20102010–20152015–2020
Farmland0.790.780.770.760.75−0.35−2.08−0.89−1.69
Forest2.572.5716.4717.6817.66−0.01540.717.37−0.14
Grassland31.3531.3525.7926.0526.04−0.02−17.720.99−0.04
Wetland0.050.050.500.520.520.00944.522.860.04
Desert0.160.160.260.250.250.0061.92−2.75−0.05
Water area12.3612.3618.1617.9217.83−0.0246.93−1.30−0.51
Total47.2847.2761.9563.1963.05−0.0231.071.99−0.22
Table 9. The overall coupling degree and coupling coordination degree between residents’ livelihood and land ecosystem service value in the ORTTR from 2000 to 2020.
YearCoupling DegreeCoupling TypesCoupling Coordination DegreeCoupling Coordination Types
20000.72Medium-coupling stage0.57Reluctant coordination
20050.78Medium-coupling stage0.60Primary coordination
20100.77Medium-coupling stage0.68Primary coordination
20150.81High-coupling stage0.71Moderate coordination
20200.82High-coupling stage0.72Moderate coordination
Table 10. Correlation between the coupling degree/coupling coordinate degree and key indicators.
Key IndicatorsCoupling DegreeCoupling Coordinate Degree
Cultivated land area−0.844 *−0.955 **
Woodland area0.6970.963 **
Grassland area−0.686−0.959 **
Total power of agricultural machinery0.8100.895 *
Meat production0.4140.719
Grain production0.3730.359
Savings deposits of urban and rural residents0.817 *0.829 *
Industrial output value0.840 *0.860 *
Urbanization level0.873 *0.987 **
Note: * indicates that it is significant at the level of 0.05; ** indicates that it is significant at the level of 0.01.
Publisher’s Note: MDPI stays neutral with regard to jurisdictional claims in published maps and institutional affiliations.

