Abstract
In order to reduce the flooding risk in urban and peri-urban river catchments, retention ponds or wet detention ponds are often used. However, there has been little work that uses distributed hydrological modeling to consider their optimum location and design in order to reduce the flood risk in a river catchment. This work considers two existing and two potential ponds in the 22.8 km2 Braid Burn catchment, Edinburgh, Scotland. Using the Shetran physically based distributed hydrological model, the effect of these ponds on the river discharges for eight measured rainfall events and two design rainfall events is considered. The results show the larger Blackford pond is best at reducing the peak discharge at the catchment outlet. The other three ponds are designed to be almost the same. The potential pond in the upper part of the catchment reduces the peak discharge at the outlet; the pond in the middle at Oxgangs makes little difference to the peak discharge, while the potential pond in the lower part of the catchment increases the peak discharge at the outlet. These results show that when considering flood risk, the location of a retention pond within a river catchment is important, and it can make the flooding worse at the outlet if it is located in the wrong location. This work suggests the pond should be located in the upper part of the catchment, although the ideal location will depend on the catchment’s shape and lag time.
1. Introduction
In river catchments, urbanization has the potential to increase the flood risk [1,2,3,4]. This is caused by the increased impervious area, which increases the peak flows and runoff volumes and reduces the time to peak in the catchments [5,6,7,8,9]. To negate the impact of the increased imperviousness, a range of methods are used to store and slow down the flow of water [10,11,12,13,14,15,16]. There are a number of terms used to describe these methods, including nature-based solutions (NBS), blue-green infrastructure (BGI), sustainable drainage systems (SuDS), green infrastructure (GI) and stormwater control measures (SCM). Retention ponds or wet detention ponds are a type of NBS or SCM often incorporated into new housing developments in urban catchments [17]. Unlike detention ponds, these ponds include a permanent pool of water in their design. They are designed to store some excess water, with an outlet structure that gradually allows discharge into the downstream drainage network.
In many countries, SCM are required for all new developments to reduce the size of the flood peak discharging into the downstream drainage network [18]. Jefferson et al. [19] have reviewed their effectiveness at a catchment scale, and Bell et al. [14] carried out a meta-analysis of the effect of SCM in catchment modeling studies, and a statistical relationship they produced shows that incorporating SCM causes a reduction in peak flows. However, as was first shown by McCuen [20], local reductions in peak discharge can actually increase the peak discharge in other parts of the larger river catchment. McCuen [20] showed that the delayed peak can coincide with the main peak in the main river channel and so increase the overall peak flow. A number of other researchers have also considered the location of detention and retention ponds on peak flows in a river catchment [21,22,23,24,25,26]. They all showed that, in order to reduce the peak flow, the location of the pond is important. This analysis was carried out by Fang et al. [24] and Ravazzani et al. [25] using distributed hydrological models, which, in both studies, were calibrated on two flood events.
This work focuses on the functioning of stormwater retention ponds in the Braid Burn peri-urban river catchment (22.8 km2) and the effect of these ponds on downstream flooding, with the aim to investigate what is the optimal location for a retention pond and the optimum design of the ponds to reduce the flooding at the catchment outlet. Compared to previous distributed hydrological modeling studies [24,25], this is achieved, firstly, by using a hydrological model at a finer resolution (50 m) and, secondly, by calibrating the model against hourly measured discharge data for an eight-year period. This enables the effect of two existing ponds and two potential ponds for eight rainfall events that produce annual maximum discharges to be analyzed. The results are also compared against running the model for two design rainfall events. Recommendations for the optimum location of retention ponds in other river catchments are considered.
2. Data and Methods
2.1. Case Study: Braid Burn Catchment
The Braid Burn (55.929° N, 3.154° W) is a river that rises southwest of the city of Edinburgh, Scotland, in the Pentland Hills (Figure 1 and Figure 2) and generally flows in a northeasterly direction. The river flows between the Braid Hills and Blackford Hill to the Liberton gauging station, which has a catchment area of 16.2 km2. Near Inch Park and Peffermill, it merges with the Jordan Burn, which flows east, along the northern edge of the Blackford Hills. This work considers the Braid Burn catchment to Peffermill (22.8 km2), just downstream of the confluence of the Braid Burn and the Jordan Burn.
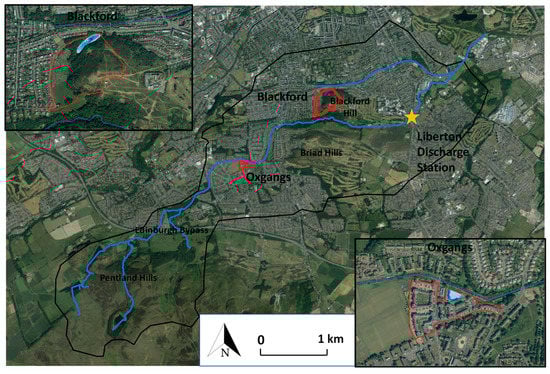
Figure 1.
The Braid Burn catchment, showing the location of the Liberton Discharge station, the existing Blackford and Oxgangs Ponds and their catchment boundaries.
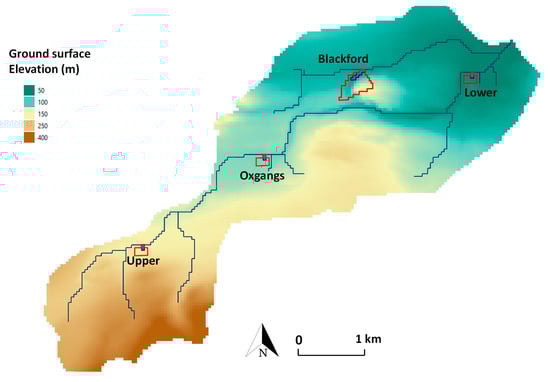
Figure 2.
The Braid Burn catchment elevations. The location of the four ponds considered in this work and their modeled catchment boundaries are also shown. The 50 m model grid resolution and the modeled river channels can be seen.
The highest elevation within the catchment is at 486 m in the Pentland hills near its southern edge. It drops steeply down from this point to the Edinburgh bypass, only 2 km north of the highest point, which has an elevation of around 150 m. Downstream of the Edinburgh bypass, and within the urbanized part of Edinburgh, the catchment becomes more gentle, and over the next 7 km to Peffermill, the elevation drops to 44 m.
The catchment is prone to flooding, with a significant event in April 2000. This is due to the steep upper parts of the catchment, which have thin soils (see Section 2.5), and a rapid response to rainfall events, together with the urbanization of the lower part of the catchment. As a consequence, two major flood storage reservoirs were built on the playing fields located in Inch Park and Peffermill, with a combined storage of 220,000 m3 [27]. The scheme was completed in 2010.
2.2. Blackford and Oxgangs Ponds
There are currently two ponds within the Braid Burn catchment: Blackford and Oxgangs ponds (Figure 1). The Blackford Pond is the larger of the two and is a semi-natural feature established in the 19th century in a natural glacial hollow [28]. It increases the flood resilience of the surrounding area, despite not having been designed as a retention pond [29]. The pond has a surface area of 7780 m2, a volume of 6480 m3, and its catchment area is 0.19 km2 (190,000 m2). The south and east of the catchment that drains into the pond is dominated by Blackford Hill (Figure 1), and the land use is a mixture of forested areas, grassland and allotments (where the local residents grow their own fruit and vegetables). An outlet pipe controls the flow from the pond north into the Jordan Burn. The Oxgangs pond was established at the end of 2009 as a retention pond. The surface area of the pond is 1750 m2; it has a volume of 431 m3, and the pond’s catchment area is 30,800 m2. The pond is fed by storm drains from the housing development built at the same time as the pond. The outlet of the pond is to the north, directly into the Braid Burn.
2.3. Upper and Lower Ponds
Two potential ponds were considered as part of this work (Figure 2). These were designed to have the same catchment area and pond dimensions as the Oxgangs pond, and they also discharge water directly into the Braid Burn. Similar to the Oxgangs pond, they were also designed to contain a housing development, with storm drains feeding the pond. The Upper pond is located on grassland, just south of the Edinburgh bypass at the edge of the Pentland Hills. The Lower pond is located in Inch Park on a playing field, which is near the location of the large flood storage reservoir considered in Section 2.1 [27], but this work considers data only up to 2009, and that scheme became operational in 2010.
2.4. Discharge, Rainfall and Catchment Boundary Data
Hourly rainfall data for a 10-year period (1 January 2000–31 December 2009) from a national 1 km gridded rainfall product was used [30], together with daily potential evaporation for the same period [31]. Hourly discharge data for the Liberton Gauging station were obtained from the Scottish Environment Protection Agency [32] and were used for the calibration of the hydrological model.
In addition to the above, two design rainfall events were used when analyzing the effect of the ponds on river flows. These events were produced using the UK depth–duration–frequency model, where rainfall events have symmetrical shapes with centered peak intensities [33]. The events selected were the 1 in 100 year 1 h event and the 1 in 100 year 6 h event.
The catchment boundary data from the National River Flow Archive [34] were extracted for the catchment to Liberton; this was then extended to the larger catchment by considering the flow directions from 2 m Lidar data. The catchment boundary for the pond at Blackford was already well defined (Figure 2). The flow of water into the Oxgangs pond is from the storm drains rather than natural flow, and due to the resolution of the model, to correctly force these flow pathways into the pond required some small manual changes to the elevations. Checks were carried out on the elevations at the Upper and Lower ponds, so that the catchment areas corresponded to those at Oxgangs.
2.5. Hydrological Modeling
The physically based spatially distributed Shetran hydrological model [35] was used in this work. The model was developed from the original SHE model [36] by the University of Newcastle. It is mostly coded in Fortran 95 and has been used extensively throughout the world [37,38]. The model is suitable for this work, as it considers all the flows of water in the river catchment and is also able to incorporate the ponds into the model [39]. The model includes components for vegetation interception, evaporation and transpiration, overland flow, variably saturated subsurface flow and channel–aquifer interactions. Solutions to the governing, physics-based, partial differential equations of mass and momentum are solved on a three-dimensional grid using finite-difference equations [40]. An important component of this work is the routing of flows to and along the river channels, which is achieved in Shetran using the diffusive wave approximation of the full 2D shallow water equations. For the 22.8 km2 Braid Burn catchment, the model used 9120 grid squares at a 50 m × 50 m resolution. In addition, 542 river channels were defined along the edge of the grid squares (Figure 2).
The hydrological modeling was carried out as a two-stage process. Firstly, the model was calibrated against hourly flows at the Liberton gauging station (16.2 km2). This baseline model was run for the period from 1 January 2000 to 31 December 2009, with a two-year spin-up period and a calibration from 1 January 2002 to 31 December 2009. Secondly, changes compared to a baseline run were calculated by incorporating one or all of the ponds into the model. The changes considered were to the discharge from each of the ponds into the adjacent river and also to the discharge at the outlet of the larger Braid Burn catchment (22.8 km2). Model runtimes for the period from 1 January 2000 to 31 December 2009 were approximately 36 h.
Soil, geology and land-use parameters were based on national measured datasets [41] and can be seen in Table 1 and Table 2. The Braid, Blackford and Pentland Hills (Figure 1) have an igneous bedrock with no superficial deposits and only a thin overlying soil (soil 1 in Table 1), whereas in the other parts of the catchment, there is a sedimentary base rock of the Kinnesswood Formation (aquifer in Table 1) with superficial till deposits and freely drained brown soils [42] (soil 2 in Table 1). There was a calibration of the soil and geology saturated hydraulic conductivities to improve the correspondence between the measured and simulated flows in the first stage of the hydrological modeling.

Table 1.
Soil and aquifer parameters used in the model. * indicates a parameter was calibrated.
Table 2.
Land-use parameters used in the model. * indicates a parameter was calibrated.
The land use in the Pentland Hills is predominately rough grassland, and the remainder of the catchment is predominately urban, although there are parks, which includes some forested areas, and golf courses. There was a calibration of the Strickler coefficient (inverse of Manning’s coefficient) for the different land-use types.
For the Oxgangs, Upper and Lower ponds (Figure 2), a pond was incorporated into the model by reducing the elevation of one grid square, so it became a 50 m by 50 m (2500 m2) pond. For the Blackford pond catchment (Figure 2), to incorporate the pond into the model, the elevation of 5 grid squares (12,500 m2) was reduced. The Strickler coefficient in all grid squares where a pond was defined was reduced to slow the flow of water; this increased the maximum water depth and delayed and attenuated the flow of water into the adjacent river channel. The effect of this is similar to having an outlet structure in a retention pond that controls the flow of water from the pond into the adjacent river channel. To consider the effect of different outlet structures on flows discharging from a pond, three different Strickler coefficients were used; the lower the value, the slower the flow of water in the pond, which increases the storage. The low value was set at 0.25 (called increased storage), the standard value was set at 1 (called standard storage), and a higher value was set at 4 (called decreased storage).
The Blackford and Oxgangs ponds were based on the actual characteristics of the pond. It should be noted that the resolution of the model is insufficient to perfectly represent the pond. However, both ponds are modeled in sufficient detail to reproduce the important features of delaying and attenuating the flow of water into the adjacent river.
3. Results
3.1. Model Calibration
The first stage of the hydrological modeling was the calibration of the hourly simulated discharge against the hourly measured discharge (Figure 3) at the Liberton gauging station (16.2 km2). To assess the quality of this calibration, the standard Nash–Sutcliffe efficiency (NSE) and percentage bias (PBias) objective functions were used [43]. For the hourly discharge, the model had a NSE value of 0.69, and for mean daily discharge, a value of 0.73, where the perfect simulation had a NSE value of 1, and a value of zero indicated that the model simulation had the same skill as using the mean of the measured discharge. For the PBias, the model gives a value of 7%. Moriasi et al. [43] suggest that this a good value for NSE and a very good value for PBias. More useful is how it benchmarks against other models of the same catchment, and Lane et al. [44], using four lumped hydrological models, showed NSE values of 0.52–0.57 for the daily discharges for this catchment. The higher NSE value using Shetran than the benchmarks suggests it is a suitable hydrological model for this catchment, and the good NSE value suggests it is capable of simulating the change to the discharges as a result of incorporating the ponds into the model.
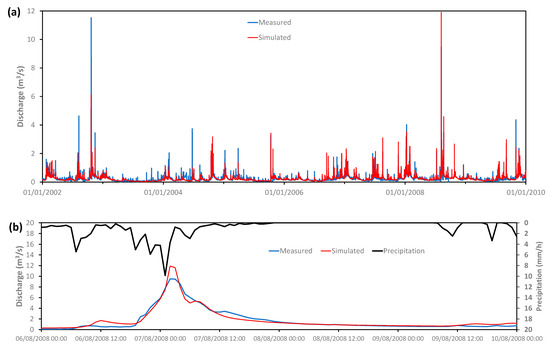
Figure 3.
Measured and simulated discharges (a) for the 8-year calibration period from 1 January 2002 to 31 December 2009, (b) for a 4-day period from 6 August 2008 to 10 August 2008.
It is interesting to note that about 75% of the catchments considered by Lane et al. [44] have NSE values greater than the value they obtained for this catchment. This suggests this catchment is one of the harder ones to model. This is probably because it is a small peri-urban catchment with a fast runoff. Additionally, the spatial variation in rainfall between the Pentland Hills and the lower urban area is considerable and probably not captured accurately by the rain gauge network, and hence, the gridded rainfall used in this work. The fast response to rainfall can also be seen in Figure 3b, which shows a very rapid rise and fall in the hydrograph, with a lag time of only around 2 h between the peak rainfall and discharge (this is considered in more detail in Section 4).
3.2. Change in Discharge to the Water Courses Adjacent to the Ponds
The second stage of the hydrological modeling considered changes from a baseline run by incorporating each of the ponds into the model. A design 1 in 100 year 1 h event is considered here; having rainfall in only a 1 h period makes it easier to understand how the ponds are working. The flows from the ponds into the adjacent water course can be seen in Figure 4 for both the baseline run and for the model with the ponds incorporated. The difference between the two can be seen in Figure 5. These figures show three main points. Firstly, as designed in the model, the Oxgangs, Upper and Lower ponds behave very similarly, both with and without a pond. There is a very fast rise and fall in the discharge, as the catchment areas for these ponds are small and urban. They are not identical due to local variations in the slope within these small catchments. The Blackford pond has a much larger non-urban catchment and so a slower rise in the hydrograph and a more gradual recession. Secondly, in all cases, the pond delays the peak of the hydrograph and reduces the size of the peak. This attenuation is more pronounced where there is increased storage available in the pond (Table 3). In the Blackford pond, the reduction in peak flow and increase in lag time are much larger than for the other ponds. Thirdly, for the Oxgangs, Upper and Lower ponds, there is an initial large reduction in the peak discharge (Figure 5), but then, there is an increase in discharge as a result of the pond, with the stored water being released to the adjacent channel. This change between reducing the discharge and increasing the discharge occurs after 1 h 45 min for the increased storage, 1 h 30 min for the standard storage and 1 h 15 min for the decreased storage. In the Blackford pond, there is also a reduction in the peak discharge and then an increase in flow as a result of the pond. However, the change takes much longer to occur. For the increased storage, it is after 8 h, for the standard storage, after 4 h 30 min and for the reduced storage, after 2 h 45 min.
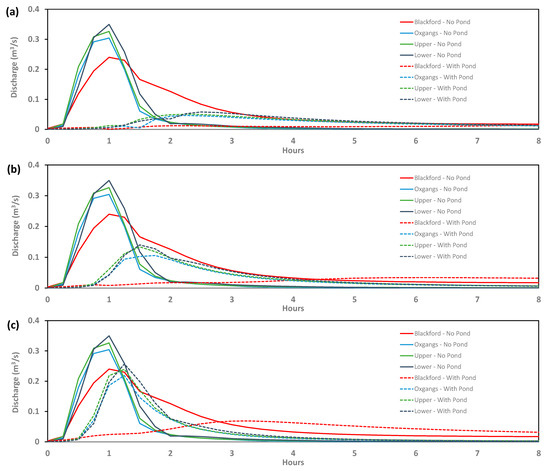
Figure 4.
Flow from the four ponds into the adjacent water courses for a 1 in 100 year 1 h event starting at hour 0. This is for the baseline run with no pond and incorporating each pond into the model. (a) increased storage, (b) standard storage, (c) decreased storage.
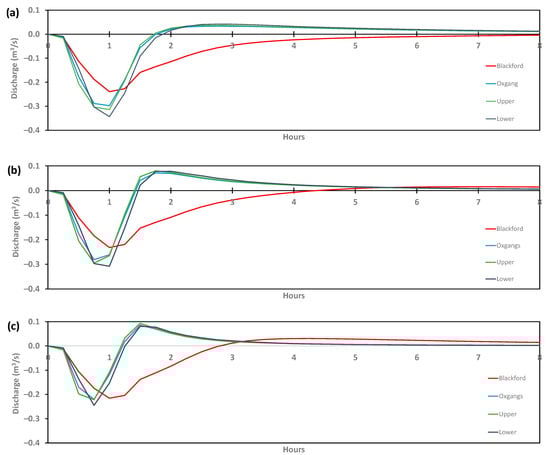
Figure 5.
Difference in flow into the adjacent water courses for a 1 in 100 year 1 h event starting at hour 0. These are the differences between the baseline run and the incorporated pond. (a) increased storage, (b) standard storage, (c) decreased storage.
Table 3.
The change in flow peak and lag time to the adjacent water course as a result of incorporating the ponds into the model for a 1 in 100 year 1 h event.
3.3. Change in Discharge at the Catchment Outlet for a 1 in 100 Year 1 h Event
The effect at the catchment outlet of incorporating each of the ponds is considered in this section. Figure 6 shows the baseline discharge for a 1 in 100 year 1 h event and the percentage change in discharge compared to the baseline run for each of the four ponds incorporated into the model. In the previous section, the Oxgangs, Lower and Upper ponds produced very similar changes to discharge to the adjacent water course. However, at the outlet of the catchment, the results are very different due to the different locations of the ponds within the catchment. The Lower pond produces a big initial drop in the outlet discharge in hour 1, as it is close to the catchment outlet, and there is also a drop in hour 2. However, at hour 3, when the peak discharge occurs at the catchment outlet, the pond increases the discharge to its adjacent water course (Section 3.2), so it produces a small increase in discharge at the outlet. The Oxgangs pond produces the peak reduction in outlet discharge at hour 2, but there is also an increase in discharge at hour 3, whereas for the Upper pond, there is a decrease in discharge at hours 2 and 3. For the Blackford pond, there is a reduction in discharge at the outlet at hours 2–5 and an increase in discharge at hours 6–12. For the peak discharge at the outlet, which occurs at hour 3, the Upper and Blackford ponds reduce the discharge, whereas the Oxgangs and Lower ponds increase the discharge.
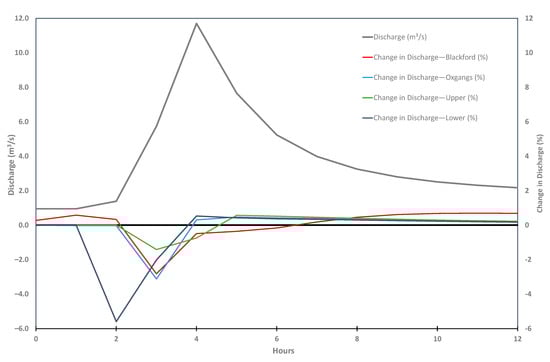
Figure 6.
Baseline outlet discharge flow and change in discharge for each incorporated pond for a 1 in 100 year 1 h event starting at hour 0. This is for the standard storage.
The plot of the change in discharge against the baseline discharge can be seen in Figure 7. In Figure 7b, for the standard storage, the data are the same as for Figure 6, again showing that for the highest baseline discharge (11.7 m3/s), the Blackford (−0.51%) and Upper (−0.77%) ponds reduce the discharge, but the Lower (+0.51%) and Oxgangs (+0.26%) ponds increase the discharge. For the increased storage in Figure 7a, the Upper (−1.4%) pond easily produces the best reduction in storage, with the Blackford (−0.54%) and Oxgangs (−0.22%) ponds also reducing the discharge, and the Lower pond increasing the discharge (+0.30%). For the reduced storage in Figure 7c, the Blackford (−0.28%) pond produces the best reduction in storage, with the Upper (−0.13%) pond slightly reducing the discharge, whereas the Oxgangs (+0.31%) and the Lower ponds increase the discharge (+0.42%).
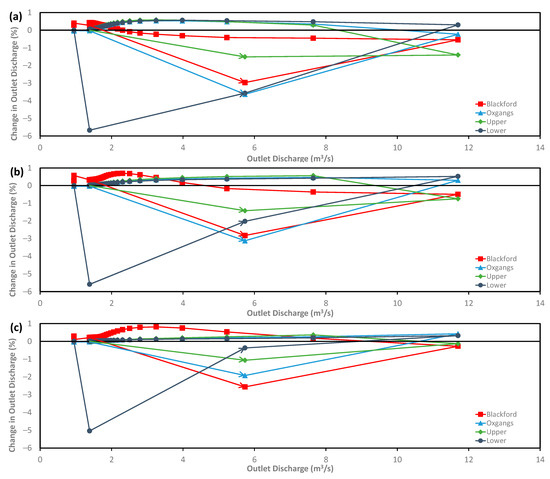
Figure 7.
Baseline outlet discharge flow plotted against the change in discharge for each pond for a 1 in 100 year 1 h event. The dots represent every hour, and the arrows show the increasing time through the model simulation. (a) increased storage, (b) standard storage, (c) decreased storage.
3.4. Change in Discharge at the Catchment Outlet for 10 Rainfall Events
In this section, the effect of the ponds on the outlet discharge for 10 rainfall events is considered. These are the eight measured rainfall events that produce annual maximum discharges for the 8-year calibration period from 1 January 2002 to 31 December 2009, together with the 1 in 100 year 1 h and 6 h events (Table 4). The length of the rainfall event in Table 4 is somewhat arbitrary, but for every hour in that period, the rainfall must be greater than 0.1 mm. Note that these are catchment average rainfalls, whereas for the eight measured rainfall events, gridded rainfall data are used.
Table 4.
The change in flow peak at the catchment outlet compared to the baseline run for the four individual ponds and with all the ponds incorporated into the model. This is for the eight measured events that produce annual maximum discharges and the two design events.
For the 10 rainfall events with the standard storage, Figure 8 shows that the Blackford pond works successfully for every event, with an average reduction in discharge of 0.67%. Of the three similarly designed ponds, the location is important. On average, the Upper pond works best with a reduction in peak flow in 7 out of the 10 events and an average reduction in peak flow of 0.34%. The Oxgangs pond produces a reduction in peak flow in 6 out of the 10 events, with an average reduction of 0.06%, whereas the Lower pond actually increases the peak discharge in 8 out of the 10 events, with an average increase in peak discharge of 0.16%. Figure 8 also shows that all the ponds together work better than any of the individual ponds, with an average reduction in peak flow of 0.82%. Figure 9 shows the results for the increased and decreased storage, as well as the standard storage. In all the ponds, this shows that over the 10 events, this increased storage works better at reducing the peak flow than the decreased storage.
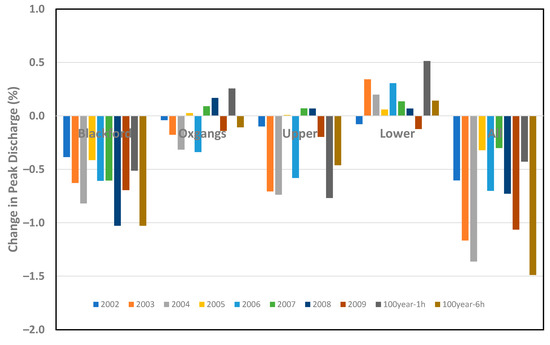
Figure 8.
Change in the peak outlet discharge for each pond for the 10 rainfall events (8 measured events that produce annual maximum discharges and 2 design events). Additionally shown are the synergistic results for the catchment outlet due to incorporating all the ponds into the model. These results are for the standard storage.
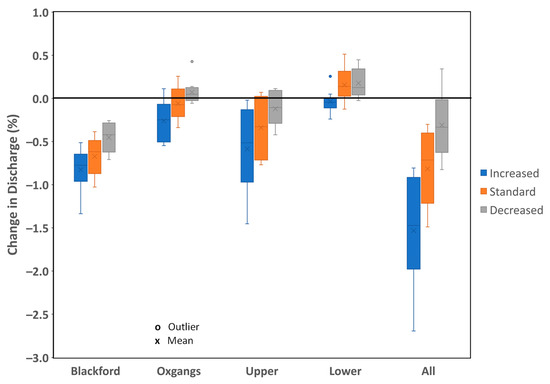
Figure 9.
Box plot showing the change in the outlet discharge for each pond for the 10 rainfall events (8 annual maximum events and 2 design events). Additionally shown are the synergistic results for the catchment outlet due to incorporating all the ponds into the model. Results from the increased, standard and decreased storage are shown.
4. Discussion
This work is focused on the peak river discharges at the outlet of the 22.8 km2 Braid Burn catchment. If the flooding location were either upstream or downstream of this location, then the effect of the ponds would be different. For this location, the results clearly show that for the standard storage for the three ponds with similar catchment areas and design (Oxgangs, Upper and Lower), the Upper pond generally reduces the peak flow, the Oxgangs pond has little effect on the peak flow, and the Lower pond makes the flooding worse by increasing the peak flow. The reason for this depends on the lag between the most intense rainfall and peak discharge and also the location of the ponds. Of the 10 events considered in Table 4, 8 of them have a lag time between the most intense rainfall and peak discharge of either 2 or 3 h. The other two events have lag times of 5 and 6 h. For a pond to be successful at reducing the peak flow, this lag time should correspond to the sum of the total lag time for the pond to discharge into the adjacent water course plus the travel time of the flood wave from this location to the outlet. For the Lower pond, the travel time of a flood wave from the adjacent river channel to the catchment outlet is much too short, and in most cases, when the peak flow is at the catchment outlet, the pond is releasing water stored during the rainfall event and so increasing the flow. For the Upper pond, the travel time of the flood wave from the adjacent river channel to the catchment outlet is sufficient for the pond to still reduce the peak discharge. However, Figure 6 and Figure 7 show the pond produces a bigger percentage reduction in flow at the catchment outlet in the previous hour, although with a similar actual reduction. So, installing the pond slightly higher up in the catchment or further away from the main Braid Burn channel would have had a slightly better effect on alleviating the peak discharge at the catchment outlet. However, finding a suitable location in this location might be difficult.
For the 1 in 100 year 1 h event, the Upper pond performs slightly better at reducing the peak flow than the Blackford pond. The other events where it worked well were those in 2003, 2004, 2006 and the 1 in 100 year 6 h event. Table 4 shows these are all shorter-duration events, where the pond is able to store the water and release it when the most intense rainfall had passed. The remaining events considered are of a much longer duration, and the Upper pond is either not reducing the flow much or increasing the flow slightly when the most intense rainfall occurs. The Blackford pond is much bigger, with a much larger catchment, which means it can store water and reduce the discharge into the adjacent water course for a much longer period of time (Section 3.2). Consequently, it works successfully for all 10 rainfall events. This shows the importance of modeling a range of real historic rainfall events (in addition to design rainfall events) when considering the functioning of a pond.
5. Conclusions
The Braid Burn catchment has suffered from a number of flood incidents, causing significant damage to buildings within the city of Edinburgh. As a consequence, a large flood scheme was installed next to the river in the Inch Park and Peffermill area, with a combined storage of 220,000 m3 [27]. The scheme was designed to protect over 900 homes and businesses against a 1 in 200 year flood event and was completed in 2010. However, this work has a very different focus, which is understanding how small retention ponds installed to reduce flooding from local housing developments function in a wider river catchment. It considers the best location and design of these small retention ponds to reduce flooding at the outlet of the Braid Burn catchment. The issues and applicability are not only relevant for this catchment but for new retention ponds designed in any urban or peri-urban catchment.
There are four main conclusions. Firstly, the location of the retention pond is very important. If it is too close to the area where flooding is an issue, then it can increase the peak discharge and potentially make the flooding worse. This is because it stores water when the rainfall is at its most intense, and when the main river flows are still low, but then, it releases an increased flow at the same time as the flood reaches its peak. In these locations, the aim should be to discharge the water out of the catchment as quickly as possible. Ponds installed further upstream work better, but finding the ideal location is complicated. At the location where flooding is an issue, the typical lag time between the most intense rainfall and the peak discharge can be found. At the ideal pond location, this lag time should correspond to the sum of the lag time for the pond discharging into the adjacent water course plus the travel time of the flood wave from this location to the outlet. In other words, if the pond is discharging into the main river channel, one wants the peak reduction in flow from the pond to occur when the river flow in the main channel at this location is at its peak. As a general rule of thumb, taking into account the faster flows in the river channel compared to soil and aquifer flows, this suggests that ponds adjacent to river channels should be located in the upper part of the catchment. Secondly, as expected, bigger ponds produce greater attenuation of the flow and reduce the flow in adjacent water courses for longer periods of time. As this reduced flow into adjacent water courses occurs for longer, it is easier for there to be synchronization between the reduced flow from the pond and the peak flows in the main river channel, which suggests that the location of bigger ponds is not as crucial as that of smaller ponds, although further work is necessary to show this is indeed the case. Thirdly, increasing the amount of water that can be stored in any of the ponds is helpful in reducing the flooding risk. Fourthly, when designing the ponds, real rainfall events, as well as design events, should be used to analyze the effects of the pond. The complicated variation in real rainfall events affects the results.
This work used the Shetran physically based distributed hydrological model at a fine resolution to help analyze the best location and design for small retention ponds to reduce flooding. The main limitation of the modeling approach is defining the model parameters that relate the water depths in the ponds to the outlet discharge into the adjacent water course, as this depends on the design structure at the outlet of the pond, which is different for every pond. This uncertainty is considered by using different roughness coefficients for the pond.
Further work using the same modeling procedure for other catchments with different topographies and shapes, in order to check whether the same conclusions are valid, would be useful. It is also noteworthy that although our research considered only ponds, the findings presented here are likely to be applicable to other SCM, e.g., constructed wetlands.
It should also be noted that in addition to flood risk reduction, the ponds provide a range of other ecosystem services, including water quality improvement, increased amenity and biodiversity values [45]. Hence, the decisions on the location and design characteristics of any particular pond should be based on the consideration of all the multiple benefits, as well as costs and logistical constraints. Further research should address these issues, plus the practicalities of incorporating the findings presented here into tools calculating the net benefits resulting from changes in land use and installation of ponds and other SCM [29].
Author Contributions
Conceptualization, S.J.B. and V.K.; methodology, S.J.B. and V.K.; software, S.J.B.; validation, S.J.B. and V.K.; formal analysis, S.J.B. and V.K.; investigation, S.J.B. and V.K.; resources, S.J.B.; data curation, S.J.B.; writing—original draft preparation, S.J.B.; writing—review and editing, S.J.B. and V.K.; visualization, S.J.B.; project administration, S.J.B. and V.K. All authors have read and agreed to the published version of the manuscript.
Funding
This research was funded under the EPSRC funded Urban Flood Resilience project (EP/P004334/1) and the NERC Open CLimate IMpacts modeling framework (OpenCLIM) project (NE/T013931/1).
Institutional Review Board Statement
Not applicable
Informed Consent Statement
Not applicable
Data Availability Statement
Model datasets and results from this work will be made available in an external repository.
Acknowledgments
This work made use of data from the Scottish Environment Protection Agency. The authors would like to thank three reviewers for their constructive comments, which resulted in an improved paper.
Conflicts of Interest
The authors declare no conflict of interest. The funders had no role in the design of the study; in the collection, analyses, or interpretation of data; in the writing of the manuscript, or in the decision to publish the results.
References
- Miller, J.D.; Hutchins, M. The impacts of urbanisation and climate change on urban flooding and urban water quality: A review of the evidence concerning the United Kingdom. J. Hydrol. Reg. Stud. 2017, 12, 345–362. [Google Scholar] [CrossRef] [Green Version]
- Blum, A.G.; Ferraro, P.J.; Archfield, S.A.; Ryberg, K.R. Causal effect of impervious cover on annual flood magnitude for the United States. Geophys. Res. Lett. 2020, 47, e2019GL086480. [Google Scholar] [CrossRef] [Green Version]
- Bhaskar, A.S.; Hopkins, K.G.; Smith, B.K.; Stephens, T.A.; Miller, A.J. Hydrologic signals and surprises in US streamflow records during urbanization. Water Resour. Res. 2020, 56, e2019WR027039. [Google Scholar] [CrossRef]
- Tierolf, L.; de Moel, H.; van Vliet, J. Modeling urban development and its exposure to river flood risk in Southeast Asia. Comput. Environ. Urban Syst. 2021, 87, 101620. [Google Scholar] [CrossRef]
- Shuster, W.D.; Bonta, J.; Thurston, H.; Warnemuende, E.; Smith, D.R. Impacts of impervious surface on watershed hydrology: A review. Urban Water J. 2005, 2, 263–275. [Google Scholar] [CrossRef]
- Putro, B.; Kjeldsen, T.R.; Hutchins, M.G.; Miller, J. An empirical investigation of climate and land-use effects on water quantity and quality in two urbanising catchments in the southern United Kingdom. Sci. Total Environ. 2016, 548, 164–172. [Google Scholar] [CrossRef] [Green Version]
- Oudin, L.; Salavati, B.; Furusho-Percot, C.; Ribstein, P.; Saadi, M. Hydrological impacts of urbanization at the catchment scale. J. Hydrol. 2018, 559, 774–786. [Google Scholar] [CrossRef] [Green Version]
- Hu, S.; Fan, Y.; Zhang, T. Assessing the effect of land use change on surface runoff in a rapidly urbanized city: A case study of the central area of Beijing. Land 2020, 9, 17. [Google Scholar] [CrossRef] [Green Version]
- Birkinshaw, S.J.; Kilsby, C.; O’Donnell, G.; Quinn, P.; Adams, R.; Wilkinson, M.E. Stormwater Detention Ponds in Urban Catchments—Analysis and Validation of Performance of Ponds in the Ouseburn Catchment, Newcastle upon Tyne, UK. Water 2021, 13, 2521. [Google Scholar] [CrossRef]
- Ellis, J.B. Sustainable surface water management and green infrastructure in UK urban catchment planning. J. Environ. Plan. Manag. 2013, 56, 24–41. [Google Scholar] [CrossRef]
- Maes, J.; Jacobs, S. Nature-based solutions for Europe’s sustainable development. Conserv. Lett. 2017, 10, 121–124. [Google Scholar] [CrossRef] [Green Version]
- Nesshöver, C.; Assmuth, T.; Irvine, K.N.; Rusch, G.M.; Waylen, K.A.; Delbaere, B.; Haase, D.; Jones-Walters, L.; Keune, H.; Kovacs, E.; et al. The science, policy and practice of nature-based solutions: An interdisciplinary perspective. Sci. Total Environ. 2017, 579, 1215–1227. [Google Scholar] [CrossRef]
- Pauleit, S.; Ambrose-Oji, B.; Andersson, E.; Anton, B.; Buijs, A.; Haase, D.; Elands, B.; Hansen, R.; Kowarik, I.; Kronenberg, J.; et al. Advancing urban green infrastructure in Europe: Outcomes and reflections from the GREEN SURGE project. Urban For. Urban Green. 2019, 40, 4–16. [Google Scholar] [CrossRef]
- Bell, C.D.; Wolfand, J.M.; Panos, C.L.; Bhaskar, A.S.; Gilliom, R.L.; Hogue, T.S.; Hopkins, H.G.; Jefferson, A.J. Stormwater control impacts on runoff volume and peak flow: A meta-analysis of watershed modelling studies. Hydrol. Processes 2020, 34, 3134–3152. [Google Scholar] [CrossRef]
- O’Donnell, E.; Thorne, C.; Ahilan, S.; Arthur, S.; Birkinshaw, S.; Butler, D.; Dawson, D.; Everett, G.; Fenner, R.; Glenis, V.; et al. The blue-green path to urban flood resilience. Blue-Green Syst. 2020, 2, 28–45. [Google Scholar] [CrossRef] [Green Version]
- Qi, Y.; Chan FK, S.; Thorne, C.; O’Donnell, E.; Quagliolo, C.; Comino, E.; Pezzoli, A.; LI, L.; Griffiths, J.; Sang, Y.; et al. Addressing challenges of urban water management in Chinese sponge cities via nature-based solutions. Water 2020, 12, 2788. [Google Scholar] [CrossRef]
- Ureta, J.; Motallebi, M.; Vassalos, M.; Alhassan, M.; Ureta, J.C. Valuing stakeholder preferences for environmental benefits of stormwater ponds: Evidence from choice experiment. J. Environ. Manag. 2021, 293, 112828. [Google Scholar] [CrossRef]
- Melville-Shreeve, P.; Cotterill, S.; Grant, L.; Arahuetes, A.; Stovin, V.; Farmani, R.; Butler, D. State of SuDS delivery in the United Kingdom. Water Environ. J. 2018, 32, 9–16. [Google Scholar] [CrossRef]
- Jefferson, A.J.; Bhaskar, A.S.; Hopkins, K.G.; Fanelli, R.; Avellaneda, P.M.; McMillan, S.K. Stormwater management network effectiveness and implications for urban watershed function: A critical review. Hydrol. Processes 2017, 31, 4056–4080. [Google Scholar] [CrossRef]
- McCuen, R.H. A regional approach to urban storm water detention. Geophys. Res. Lett. 1974, 1, 321–322. [Google Scholar] [CrossRef]
- Emerson, C.H.; Welty, C.; Traver, R.G. Watershed-scale evaluation of a system of storm water detention basins. J. Hydrol. Eng. 2005, 10, 237–242. [Google Scholar] [CrossRef]
- Goff, K.M.; Gentry, R.W. The influence of watershed and development characteristics on the cumulative impacts of stormwater detention ponds. Water Resour. Manag. 2006, 20, 829–860. [Google Scholar] [CrossRef]
- Kaini, P.; Artita, K.; Nicklow, J.W. Evaluating optimal detention pond locations at a watershed scale. In Proceedings of the World Environmental and Water Resources Congress, Tampa, FL, USA, 15–19 May 2007; pp. 1–8. [Google Scholar]
- Fang, Z.; Zimmer, A.; Bedient, P.B.; Robinson, H.; Christian, J.; Vieux, B.E. Using a distributed hydrologic model to evaluate the location of urban development and flood control storage. J. Water Resour. Plan. Manag. 2010, 136, 597–601. [Google Scholar] [CrossRef]
- Ravazzani, G.; Gianoli, P.; Meucci, S.; Mancini, M. Assessing downstream impacts of detention basins in urbanized river basins using a distributed hydrological model. Water Resour. Manag. 2014, 28, 1033–1044. [Google Scholar] [CrossRef]
- Ronalds, R.; Zhang, H. Assessing the impact of urban development and on-site stormwater detention on regional hydrology using Monte Carlo simulated rainfall. Water Resour. Manag. 2019, 33, 2517–2536. [Google Scholar] [CrossRef]
- Gowans, I.A.T.; Dougall, T.; Davies, J. Braid Burn Flood Storage Reservoirs. In Dams: Engineering in a Social & Environmental Context; Thomas Telford: London, UK, 2012. [Google Scholar]
- Jarvie, J.; Arthur, S.; Beevers, L. Valuing multiple benefits, and the public perception of SUDS ponds. Water 2017, 9, 128. [Google Scholar] [CrossRef] [Green Version]
- Krivtsov, V.; Forbes, H.; Birkinshaw, S.; Olive, V.; Chamberlain, D.; Buckman, J.; Yahr, R.; Arthur, S.; Christie, D.; Monteiro, Y.; et al. Ecosystem services provided by urban ponds and green spaces: A detailed study of a semi-natural site with global importance for research. Blue-Green Syst. 2022, 4, 1–23. [Google Scholar] [CrossRef]
- Lewis, E.; Quinn, N.; Blenkinsop, S.; Fowler, H.J.; Freer, J.; Tanguy, M.; Hitt, O.; Coxon, G.; Bates, P.; Woods, R. A rule based quality control method for hourly rainfall data and a 1 km resolution gridded hourly rainfall dataset for Great Britain: CEH-GEAR1hr. J. Hydrol. 2018, 564, 930–943. [Google Scholar] [CrossRef]
- Robinson, E.L.; Blyth, E.M.; Clark, D.B.; Comyn-Platt, E.; Rudd, A.C. Climate Hydrology and Ecology Research Support System Potential Evapotranspiration Dataset for Great Britain (1961–2017) [CHESS-PE]; NERC Environmental Information Data Centre: Lancaster, UK, 2020. [Google Scholar]
- Scottish Environment Protection Agency. 2022. Available online: https://timeseriesdoc.sepa.org.uk (accessed on 10 February 2022).
- Vesuviano, G.; Stewart, E.; Spencer, P.; Miller, J.D. The effect of depth-duration-frequency model recalibration on rainfall return period estimates. J. Flood Risk Manag. 2021, 14, e12703. [Google Scholar] [CrossRef]
- National River Flow Archive. 2022. Available online: http://nrfa.ceh.ac.uk (accessed on 10 February 2022).
- Ewen, J.; Parkin, G.; O’Connell, P.E. SHETRAN: Distributed river basin flow and transport modeling system. J. Hydrol. Eng. 2000, 5, 250–258. [Google Scholar] [CrossRef] [Green Version]
- Abbott, M.B.; Bathurst, J.C.; Cunge, J.A.; O’Connell, P.E.; Rasmussen, J. An introduction to the European hydrological system—Systeme Hydrologique Europeen, “SHE”, 1: History and philosophy of a physically-based, distributed modelling system. J. Hydrol. 1986, 87, 45–49. [Google Scholar] [CrossRef]
- de Hipt, F.O.; Diekkrüger, B.; Steup, G.; Yira, Y.; Hoffmann, T.; Rode, M.; Näschen, K. Modeling the effect of land use and climate change on water resources and soil erosion in a tropical West African catch-ment (Dano, Burkina Faso) using SHETRAN. Sci. Total Environ. 2019, 653, 431–445. [Google Scholar] [CrossRef]
- Sreedevi, S.; Eldho, T.I. Effects of grid-size on effective parameters and model performance of SHETRAN for estimation of streamflow and sediment yield. Int. J. River Basin Manag. 2021, 19, 535–551. [Google Scholar] [CrossRef]
- Birkinshaw, S.J.; O’Donnell, G.; Glenis, V.; Kilsby, C. Improved hydrological modelling of urban catchments using runoff coefficients. J. Hydrol. 2021, 594, 125884. [Google Scholar] [CrossRef]
- Shetran. 2022. Available online: https://research.ncl.ac.uk/shetran/ (accessed on 18 August 2022).
- Lewis, E.; Birkinshaw, S.; Kilsby, C.; Fowler, H.J. Development of a system for automated setup of a physically-based, spatially-distributed hydrological model for catchments in Great Britain. Environ. Model. Softw. 2018, 108, 102–110. [Google Scholar] [CrossRef]
- British Geological Survey. Geology of Britain Viewer. 2022. Available online: https://mapapps.bgs.ac.uk/geologyofbritain/home.html (accessed on 10 February 2022).
- Moriasi, D.N.; Arnold, J.G.; van Liew, M.W.; Bingner, R.L.; Harmel, R.D.; Veith, T.L. Model evaluation guidelines for systematic quantification of accuracy in watershed simulations. Trans. ASABE 2007, 50, 885–900. [Google Scholar] [CrossRef]
- Lane, R.A.; Coxon, G.; Freer, J.E.; Wagener, T.; Johnes, P.J.; Bloomfield, J.P.; Greene, S.; Macleod, C.J.A.; Reaney, S.M. Benchmarking the predictive capability of hydrological models for river flow and flood peak predictions across over 1000 catchments in Great Britain. Hydrol. Earth Syst. Sci. 2019, 23, 4011–4032. [Google Scholar] [CrossRef] [Green Version]
- Krivtsov, V.; Birkinshaw, S.; Arthur, S.; Knott, D.; Monfries, R.; Wilson, K.; Christie, D.; Chamberlain, D.; Brownless, P.; Kelly, D.; et al. Flood resilience, amenity and biodiversity benefits of an historic urban pond. Philos. Trans. R. Soc. A 2020, 378, 20190389. [Google Scholar] [CrossRef] [Green Version]
Publisher’s Note: MDPI stays neutral with regard to jurisdictional claims in published maps and institutional affiliations. |
© 2022 by the authors. Licensee MDPI, Basel, Switzerland. This article is an open access article distributed under the terms and conditions of the Creative Commons Attribution (CC BY) license (https://creativecommons.org/licenses/by/4.0/).