
Identifying the Multi-Scale Influences of Climate Factors on Runoff Changes in a Typical Karst Watershed Using Wavelet Analysis


 ,
, 
Abstract
:1. Introduction
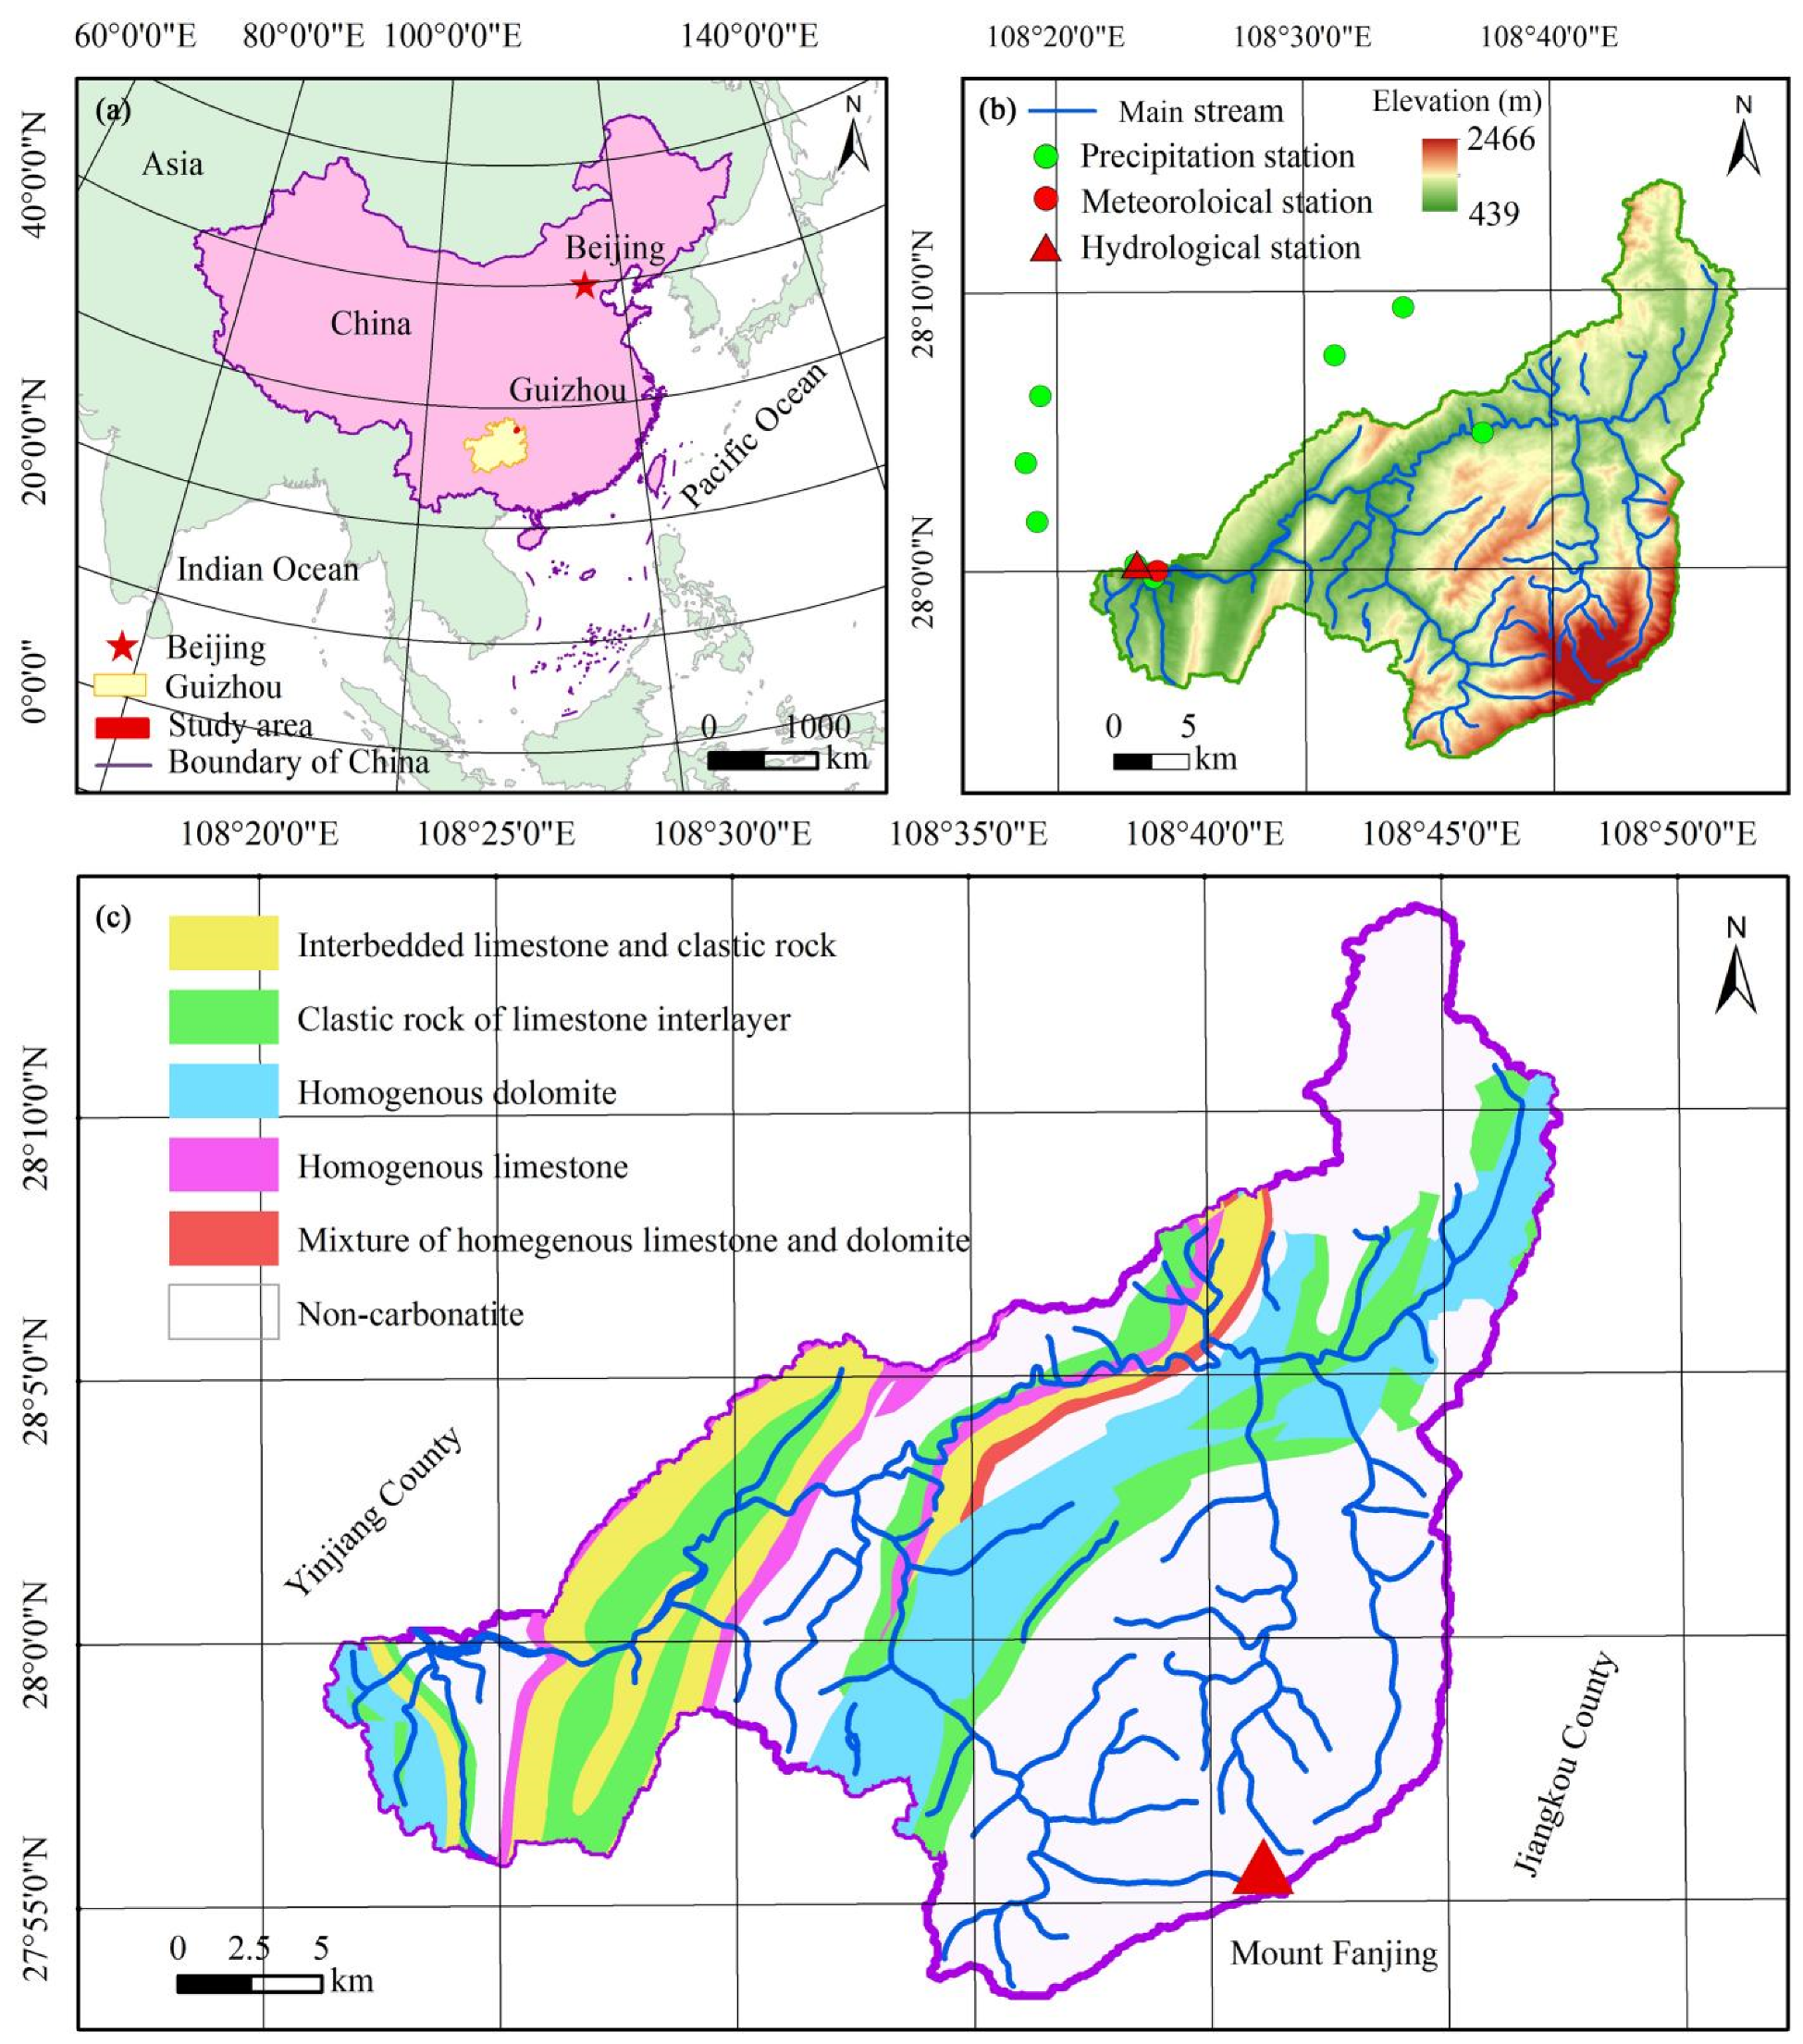
2. Study Site
3. Materials
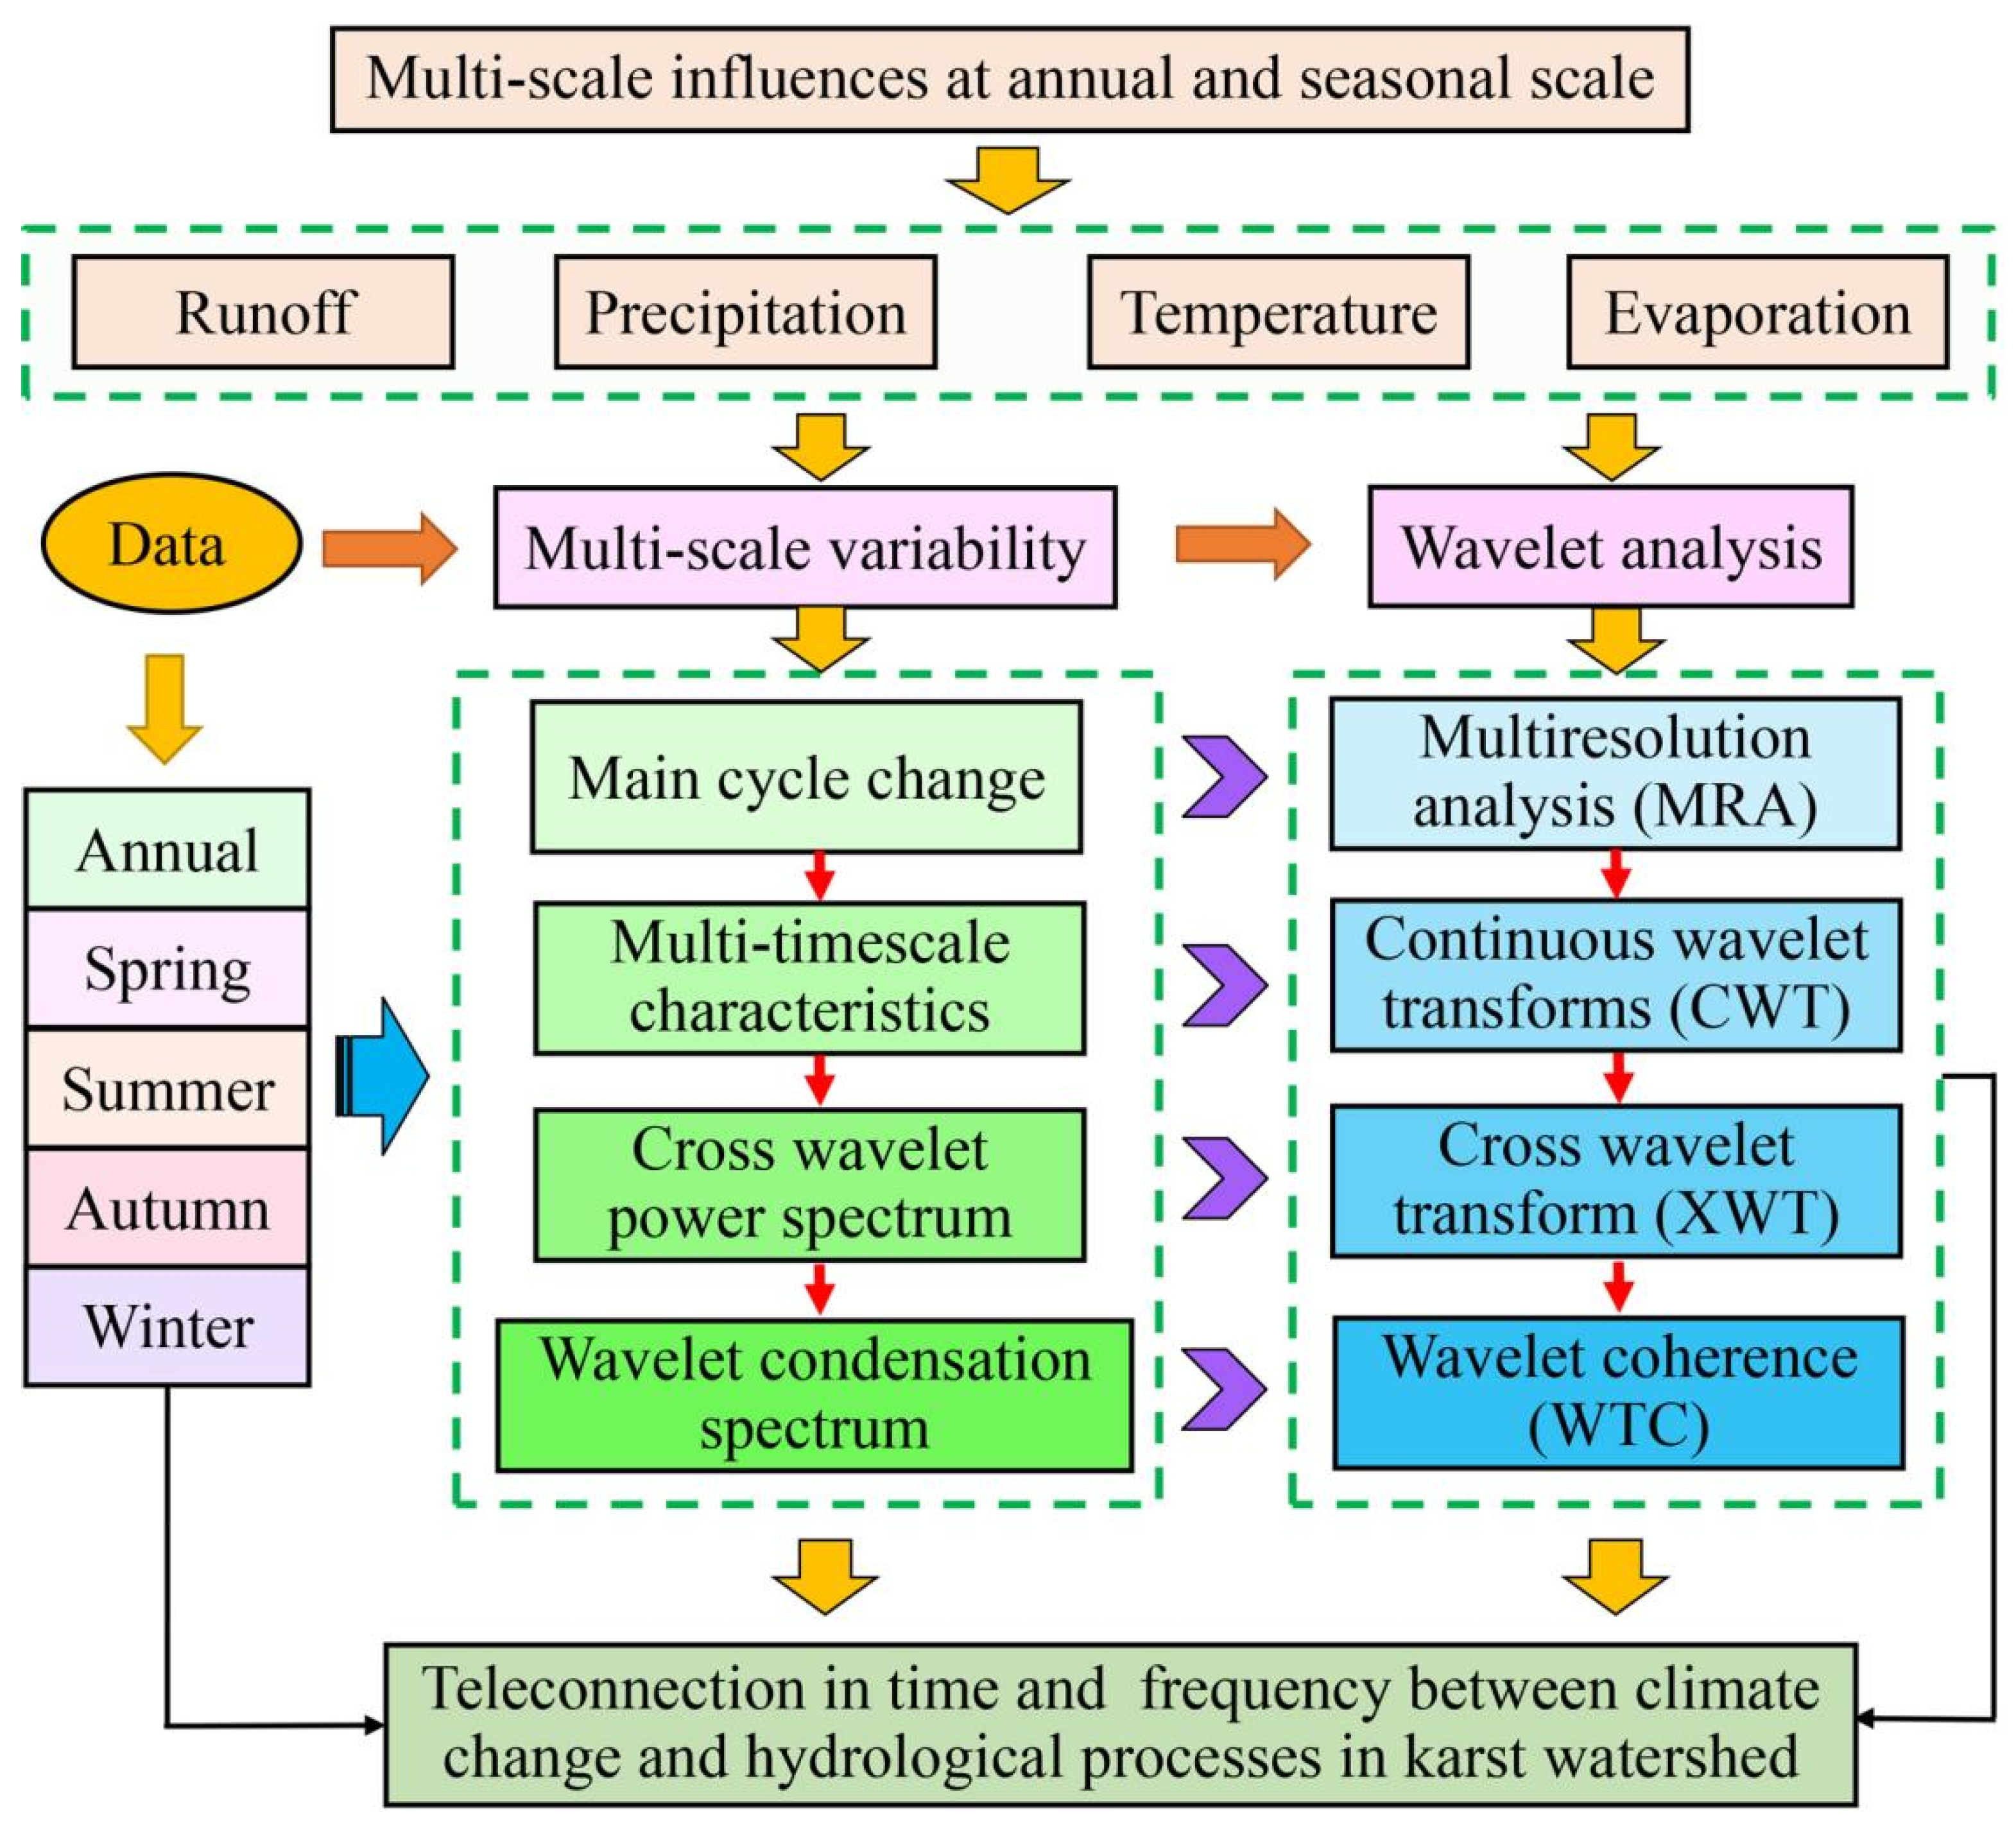
4. Methodology
4.1. MRA
4.2. CWT
4.3. XWT
4.4. WTC
5. Result Analysis
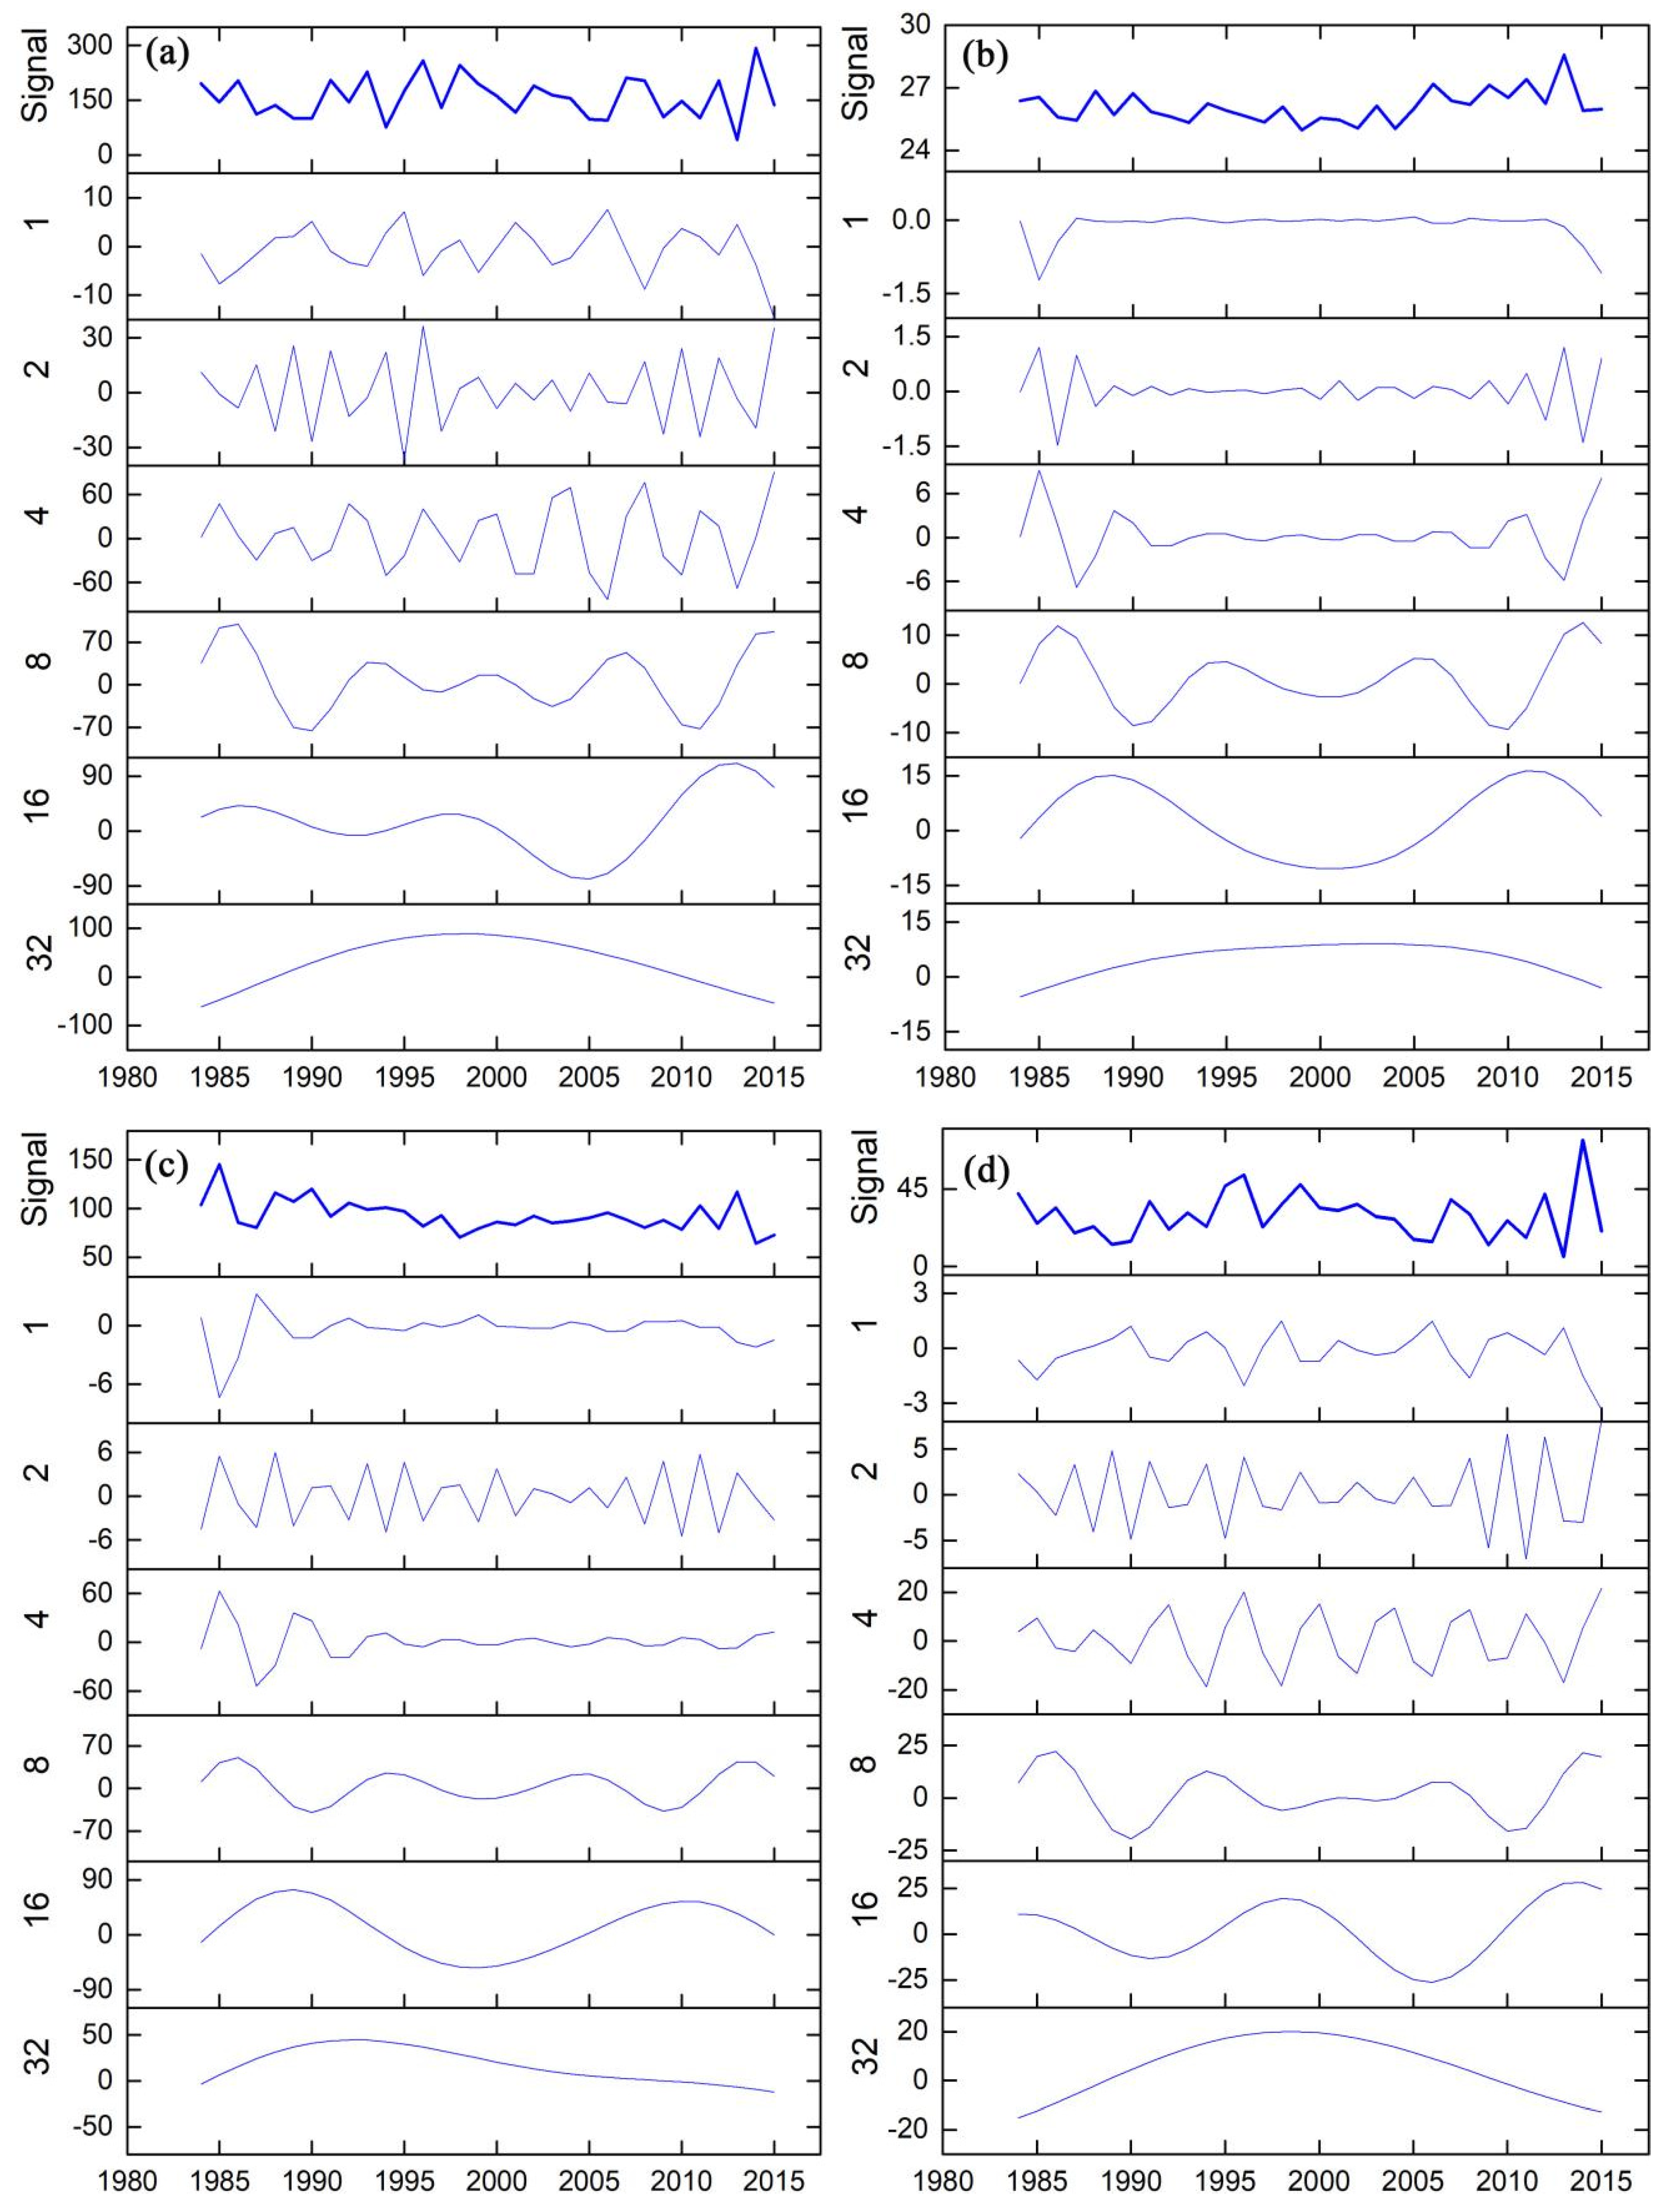
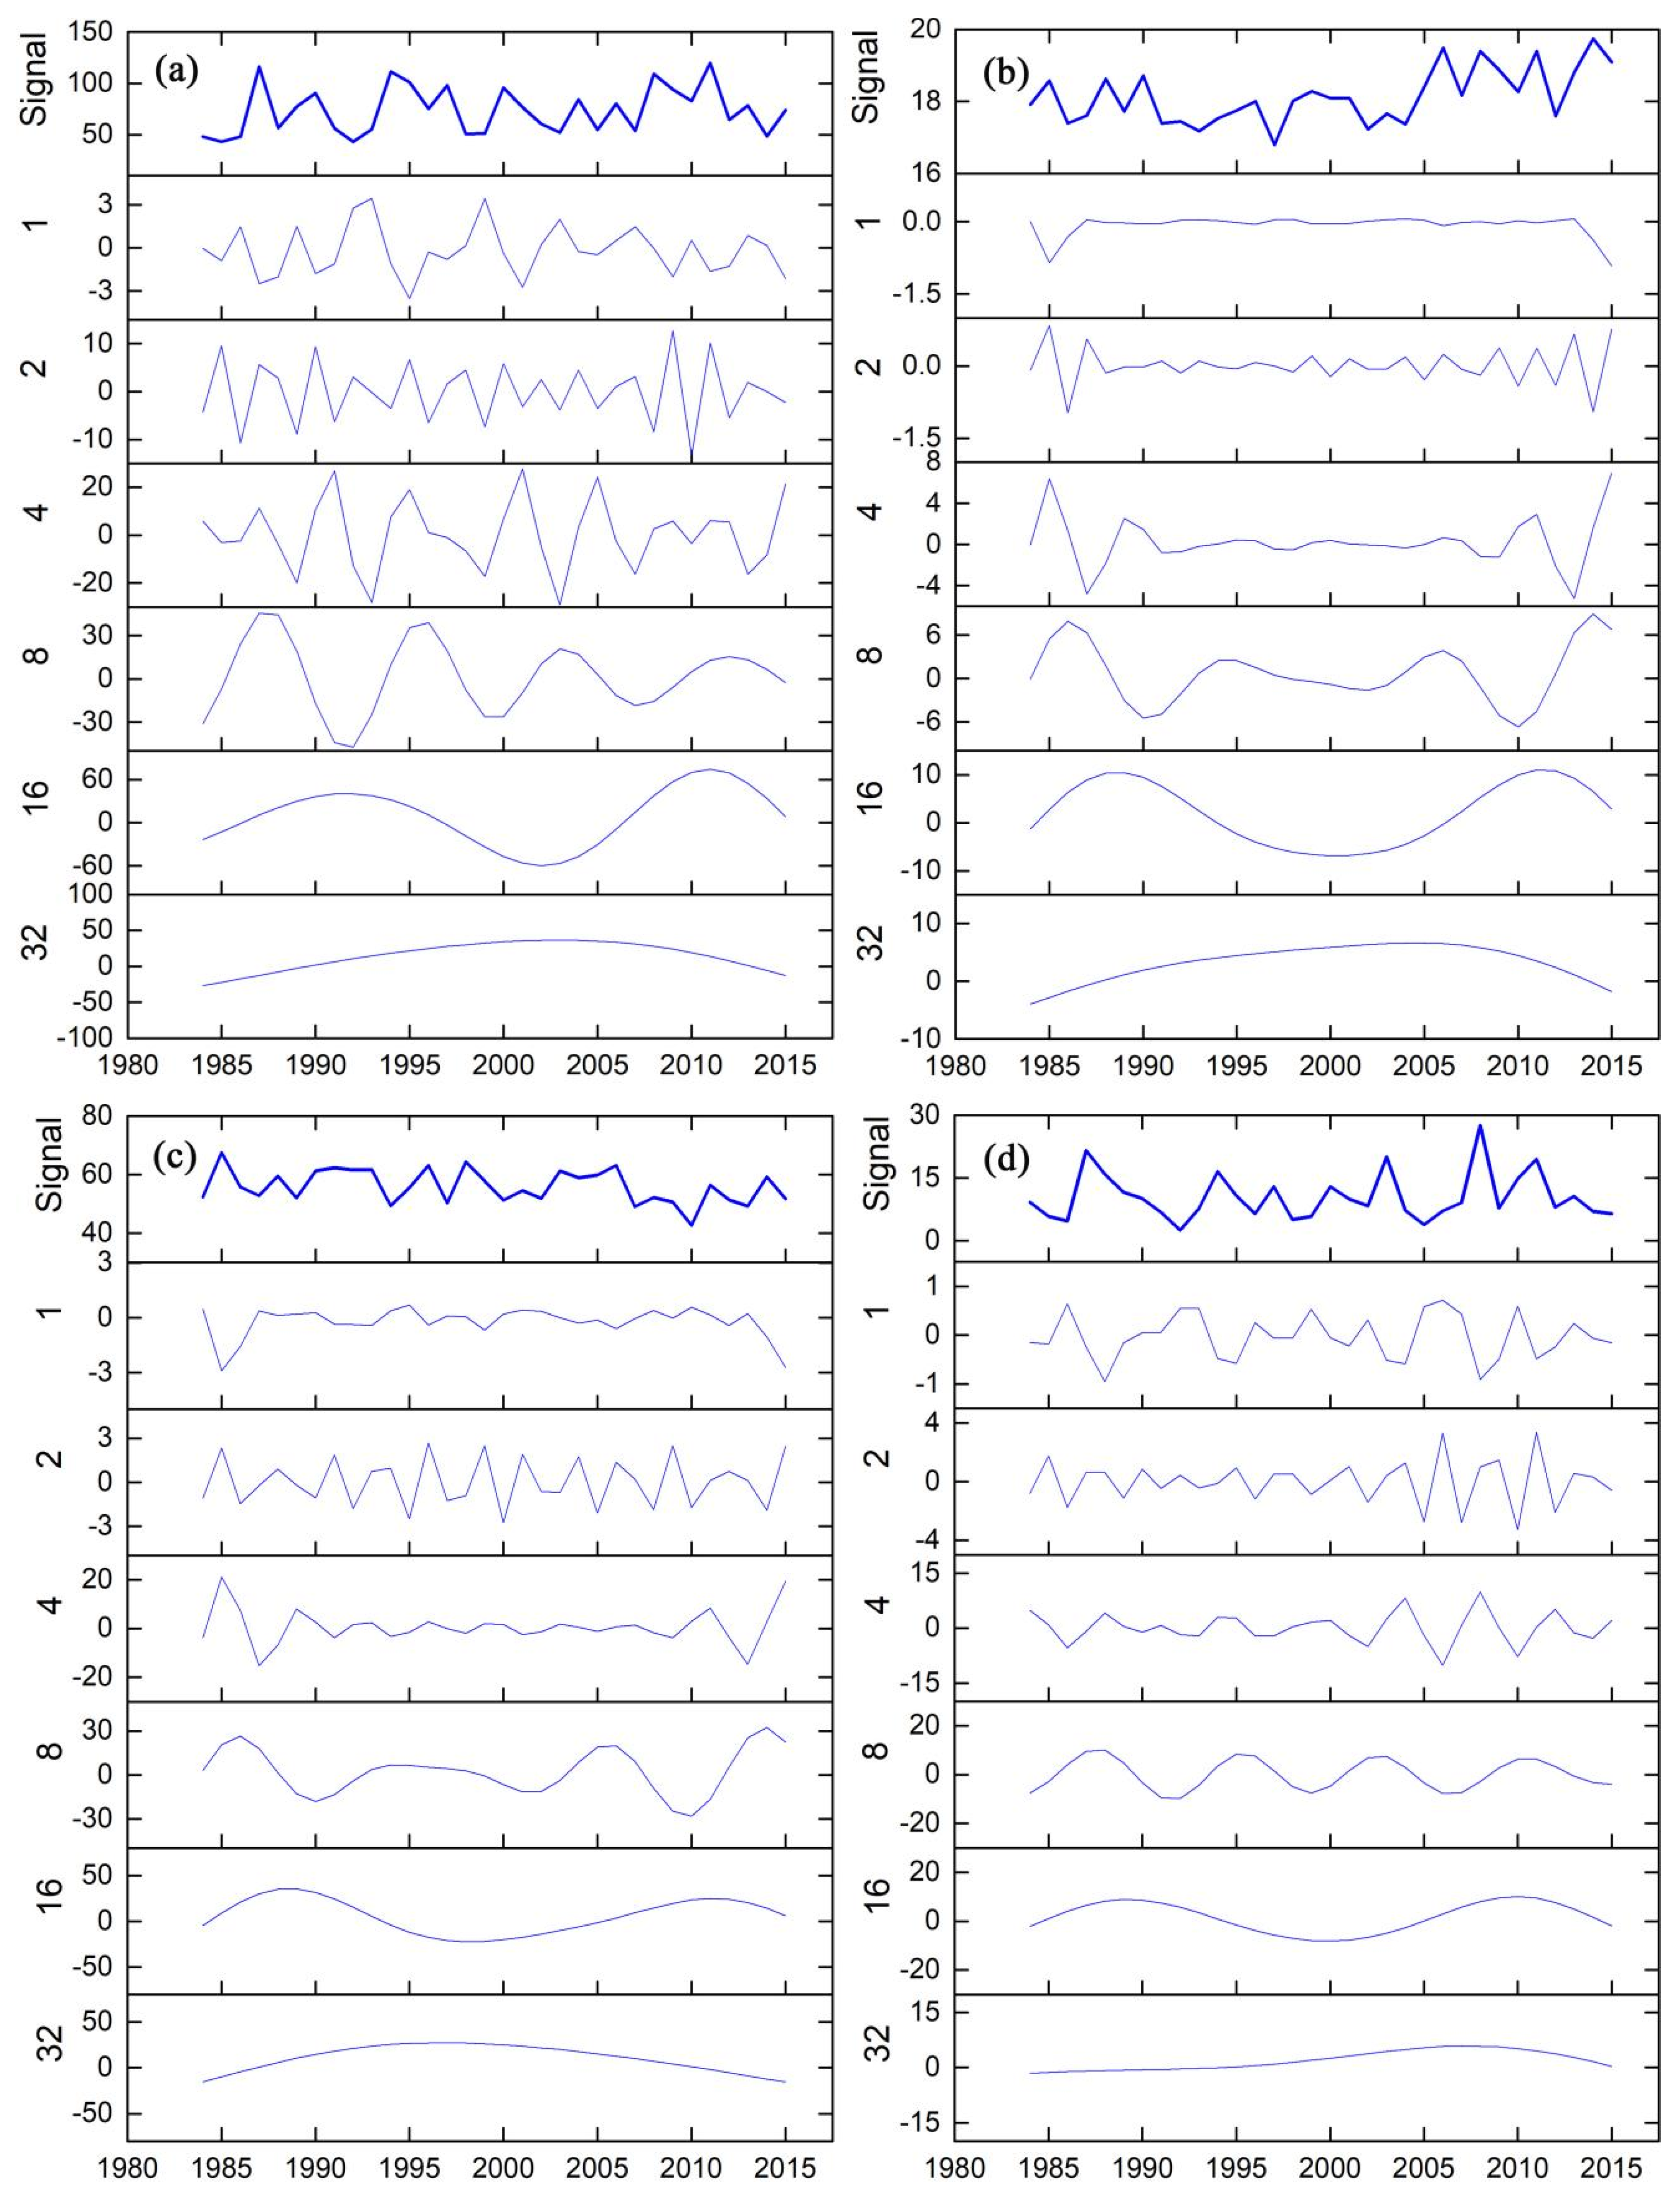
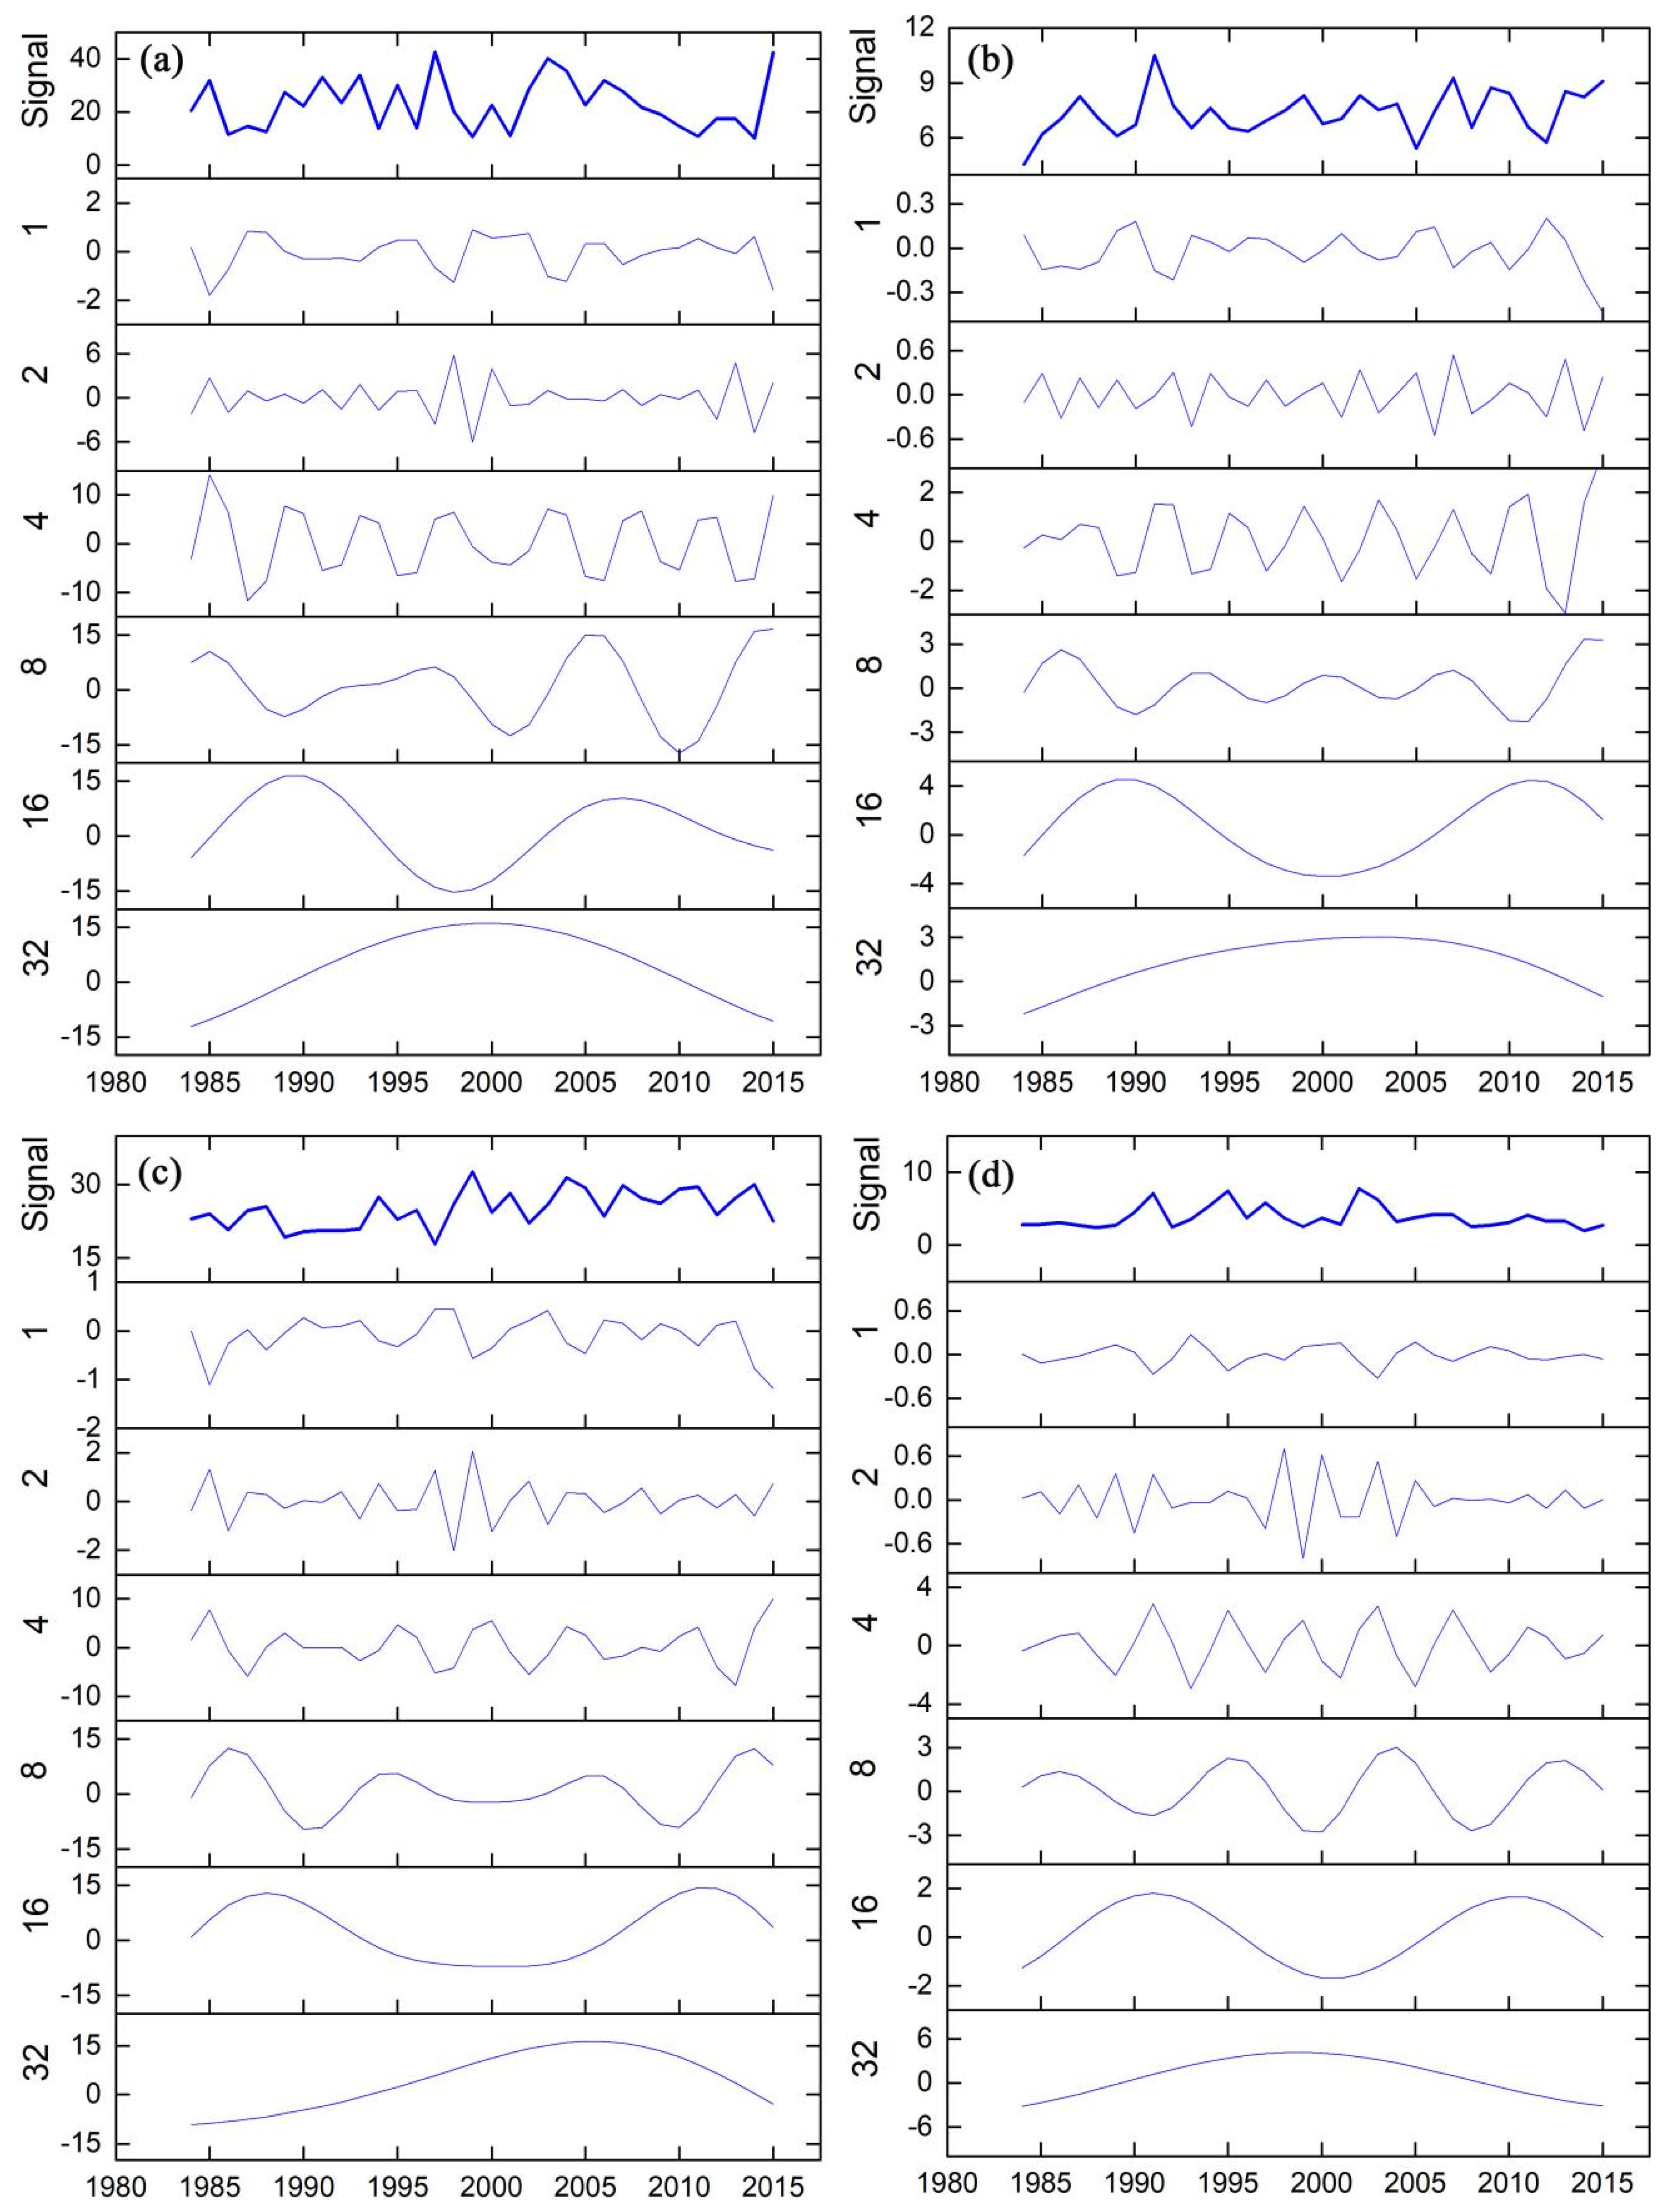
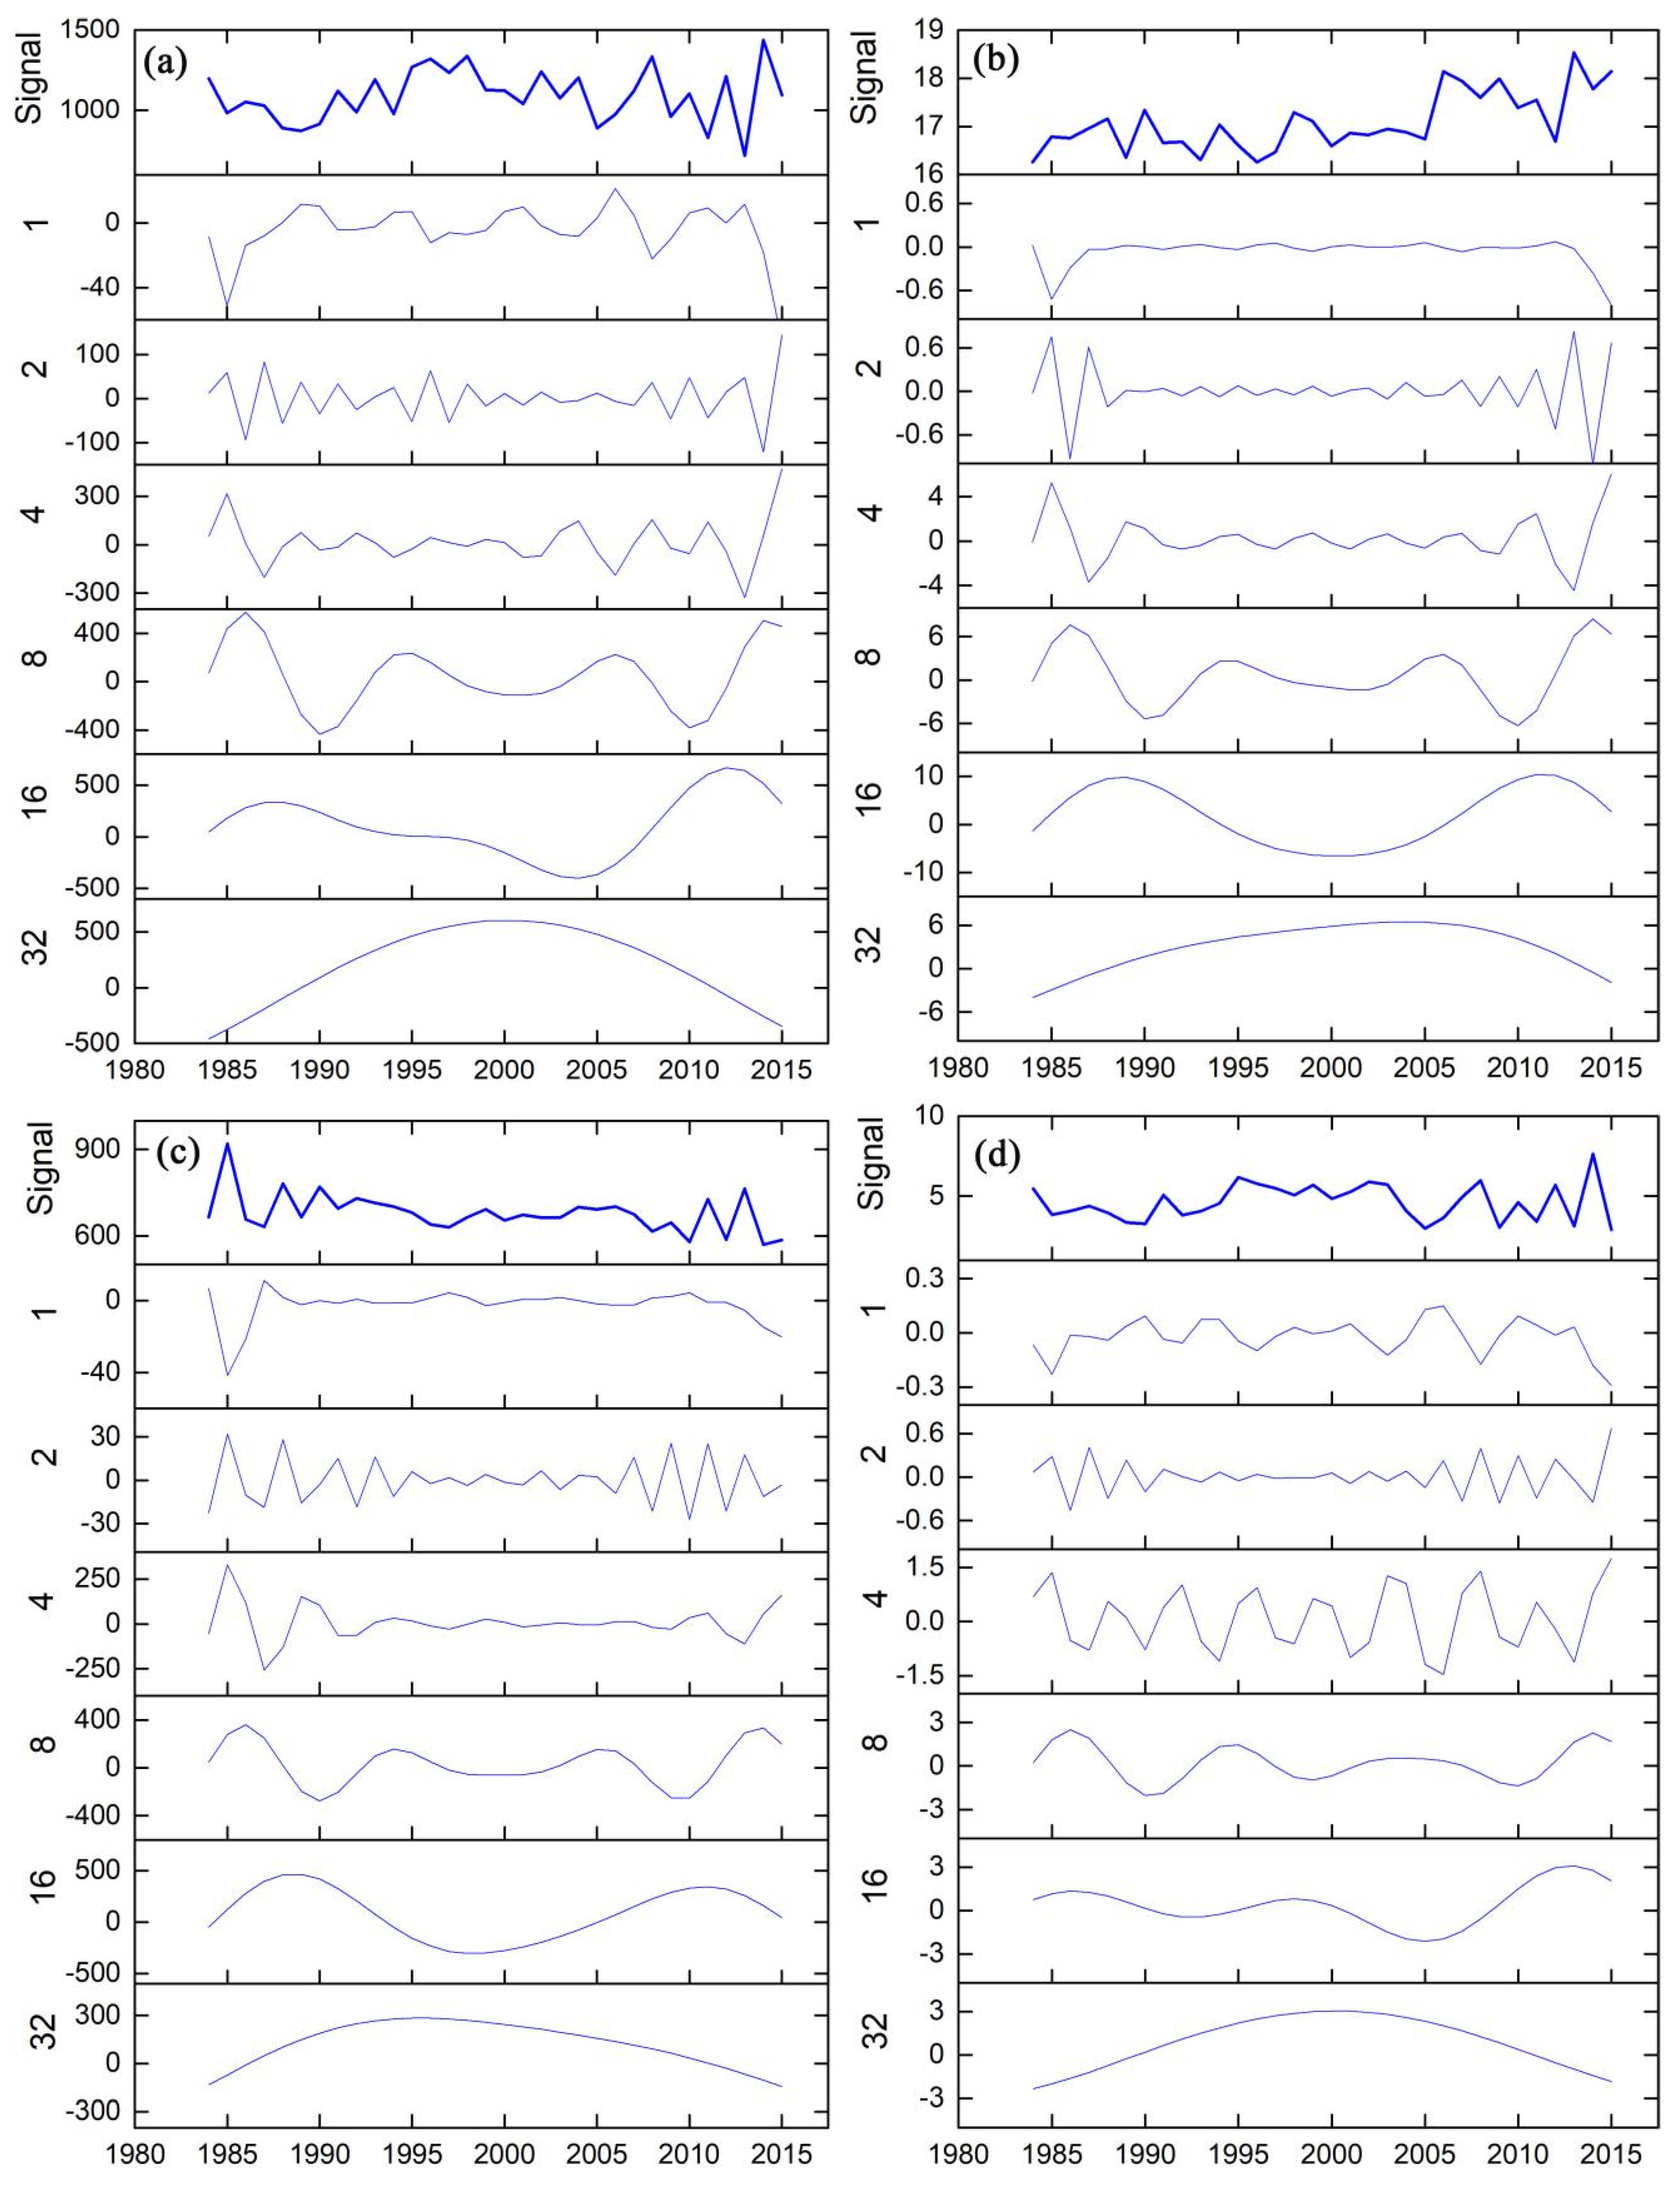
5.1. Annual, Seasonal and Monthly Evolution of Runoff and Climatic Factors on Main Scales Analyzed by MRA
5.1.1. Monthly Variation
5.1.2. Seasonal Variation
5.1.3. Annual Variation
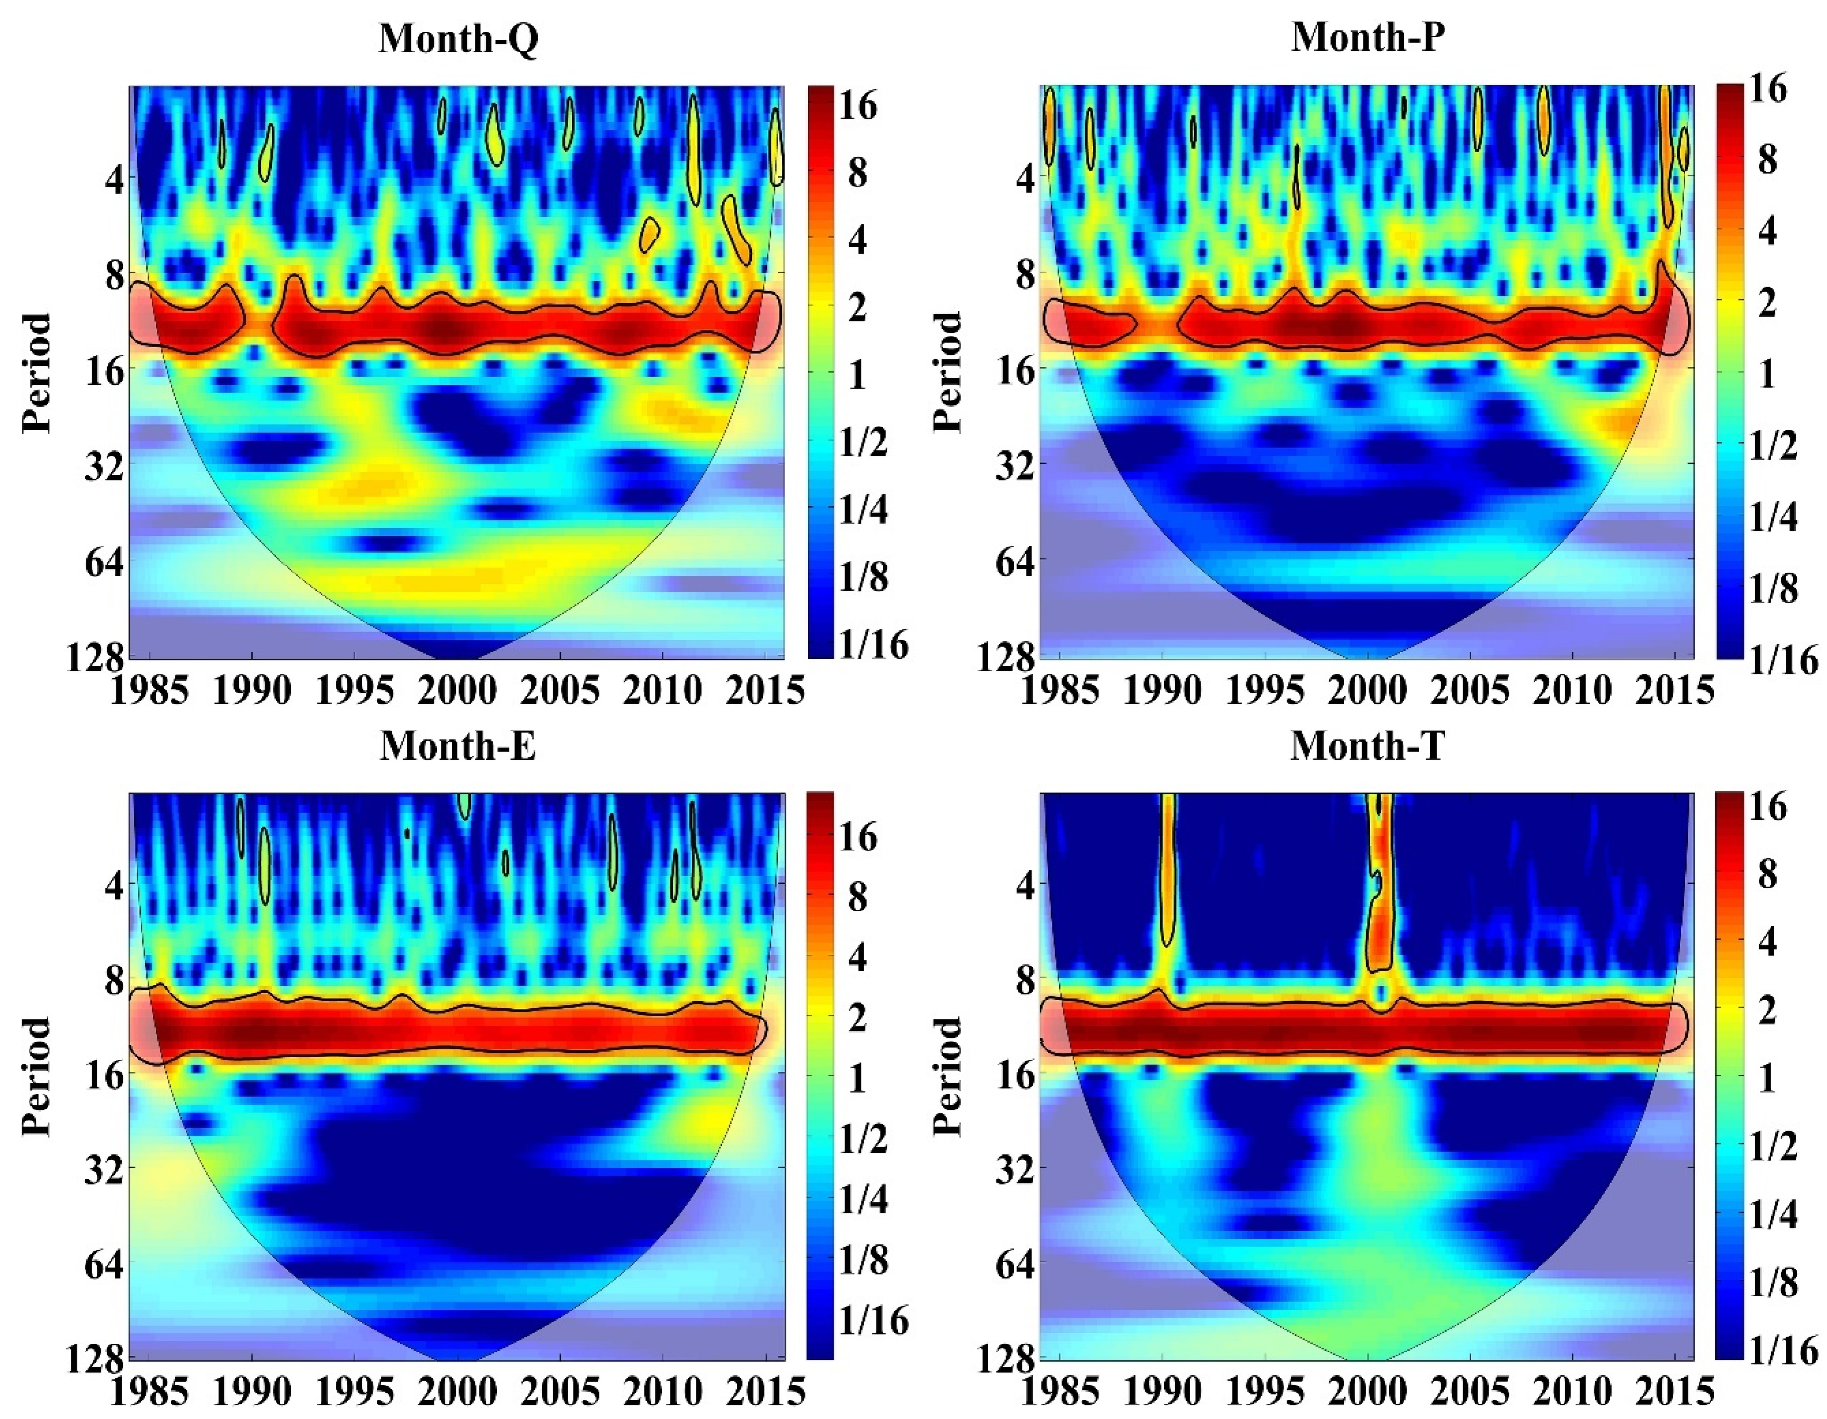
5.2. Multi-Scale Evolution of Runoff and Climatic Factors Analyzed by CWT
5.3. Response Characteristics of Runoff Changes to Climatic Factors at Different Time Scales
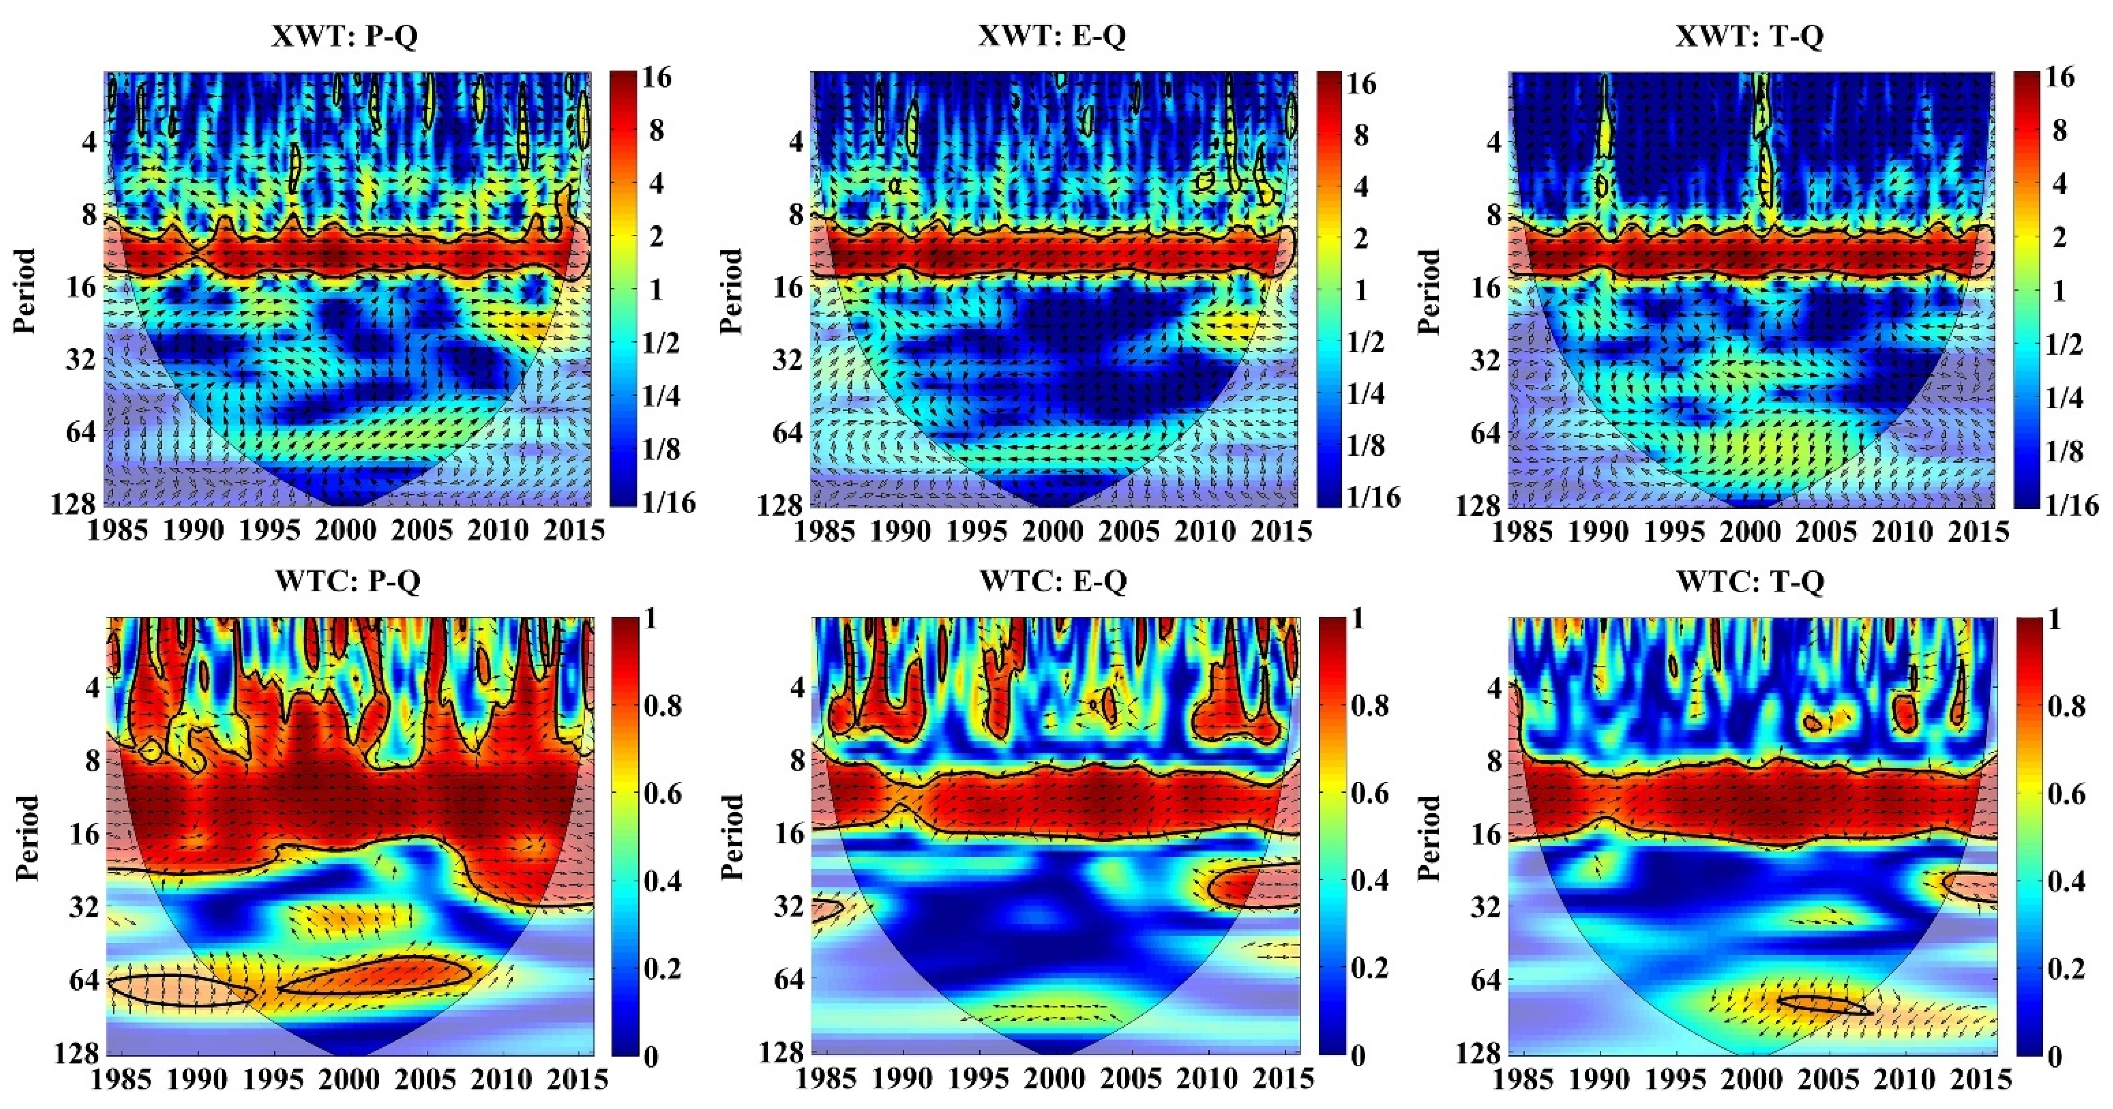
5.3.1. Response of Runoff Changes to Climatic Factors on Monthly Scale
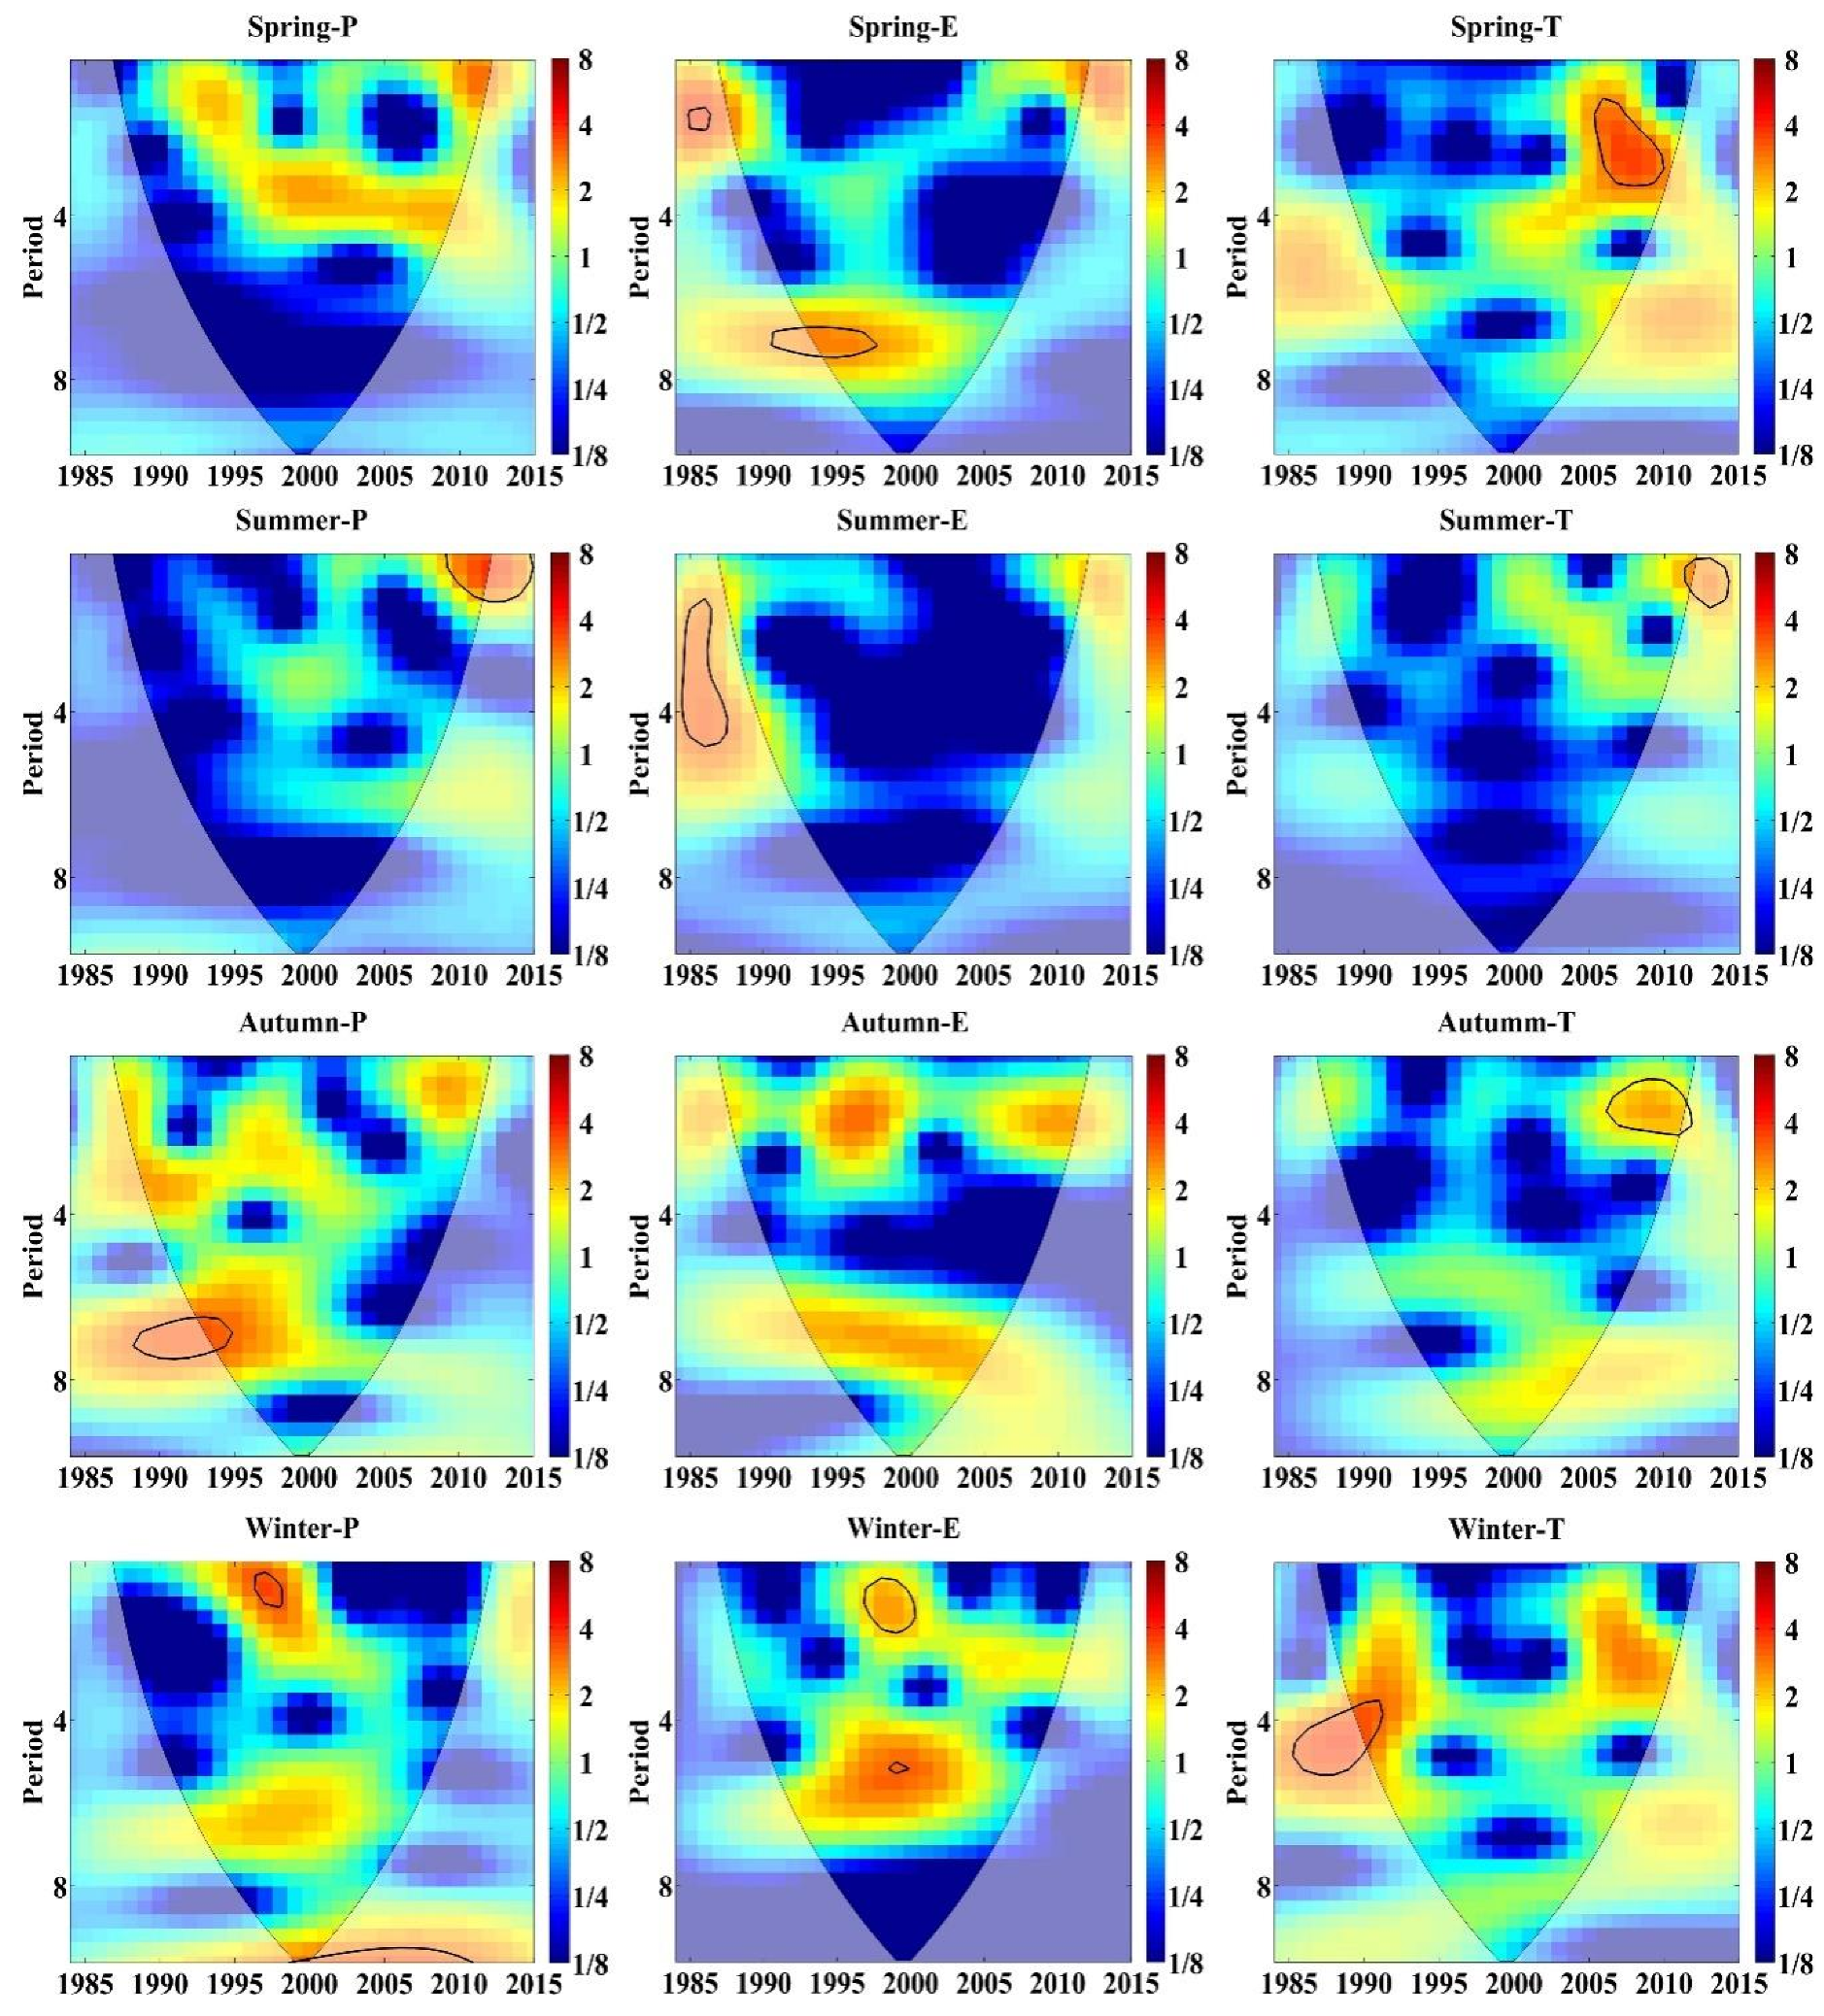
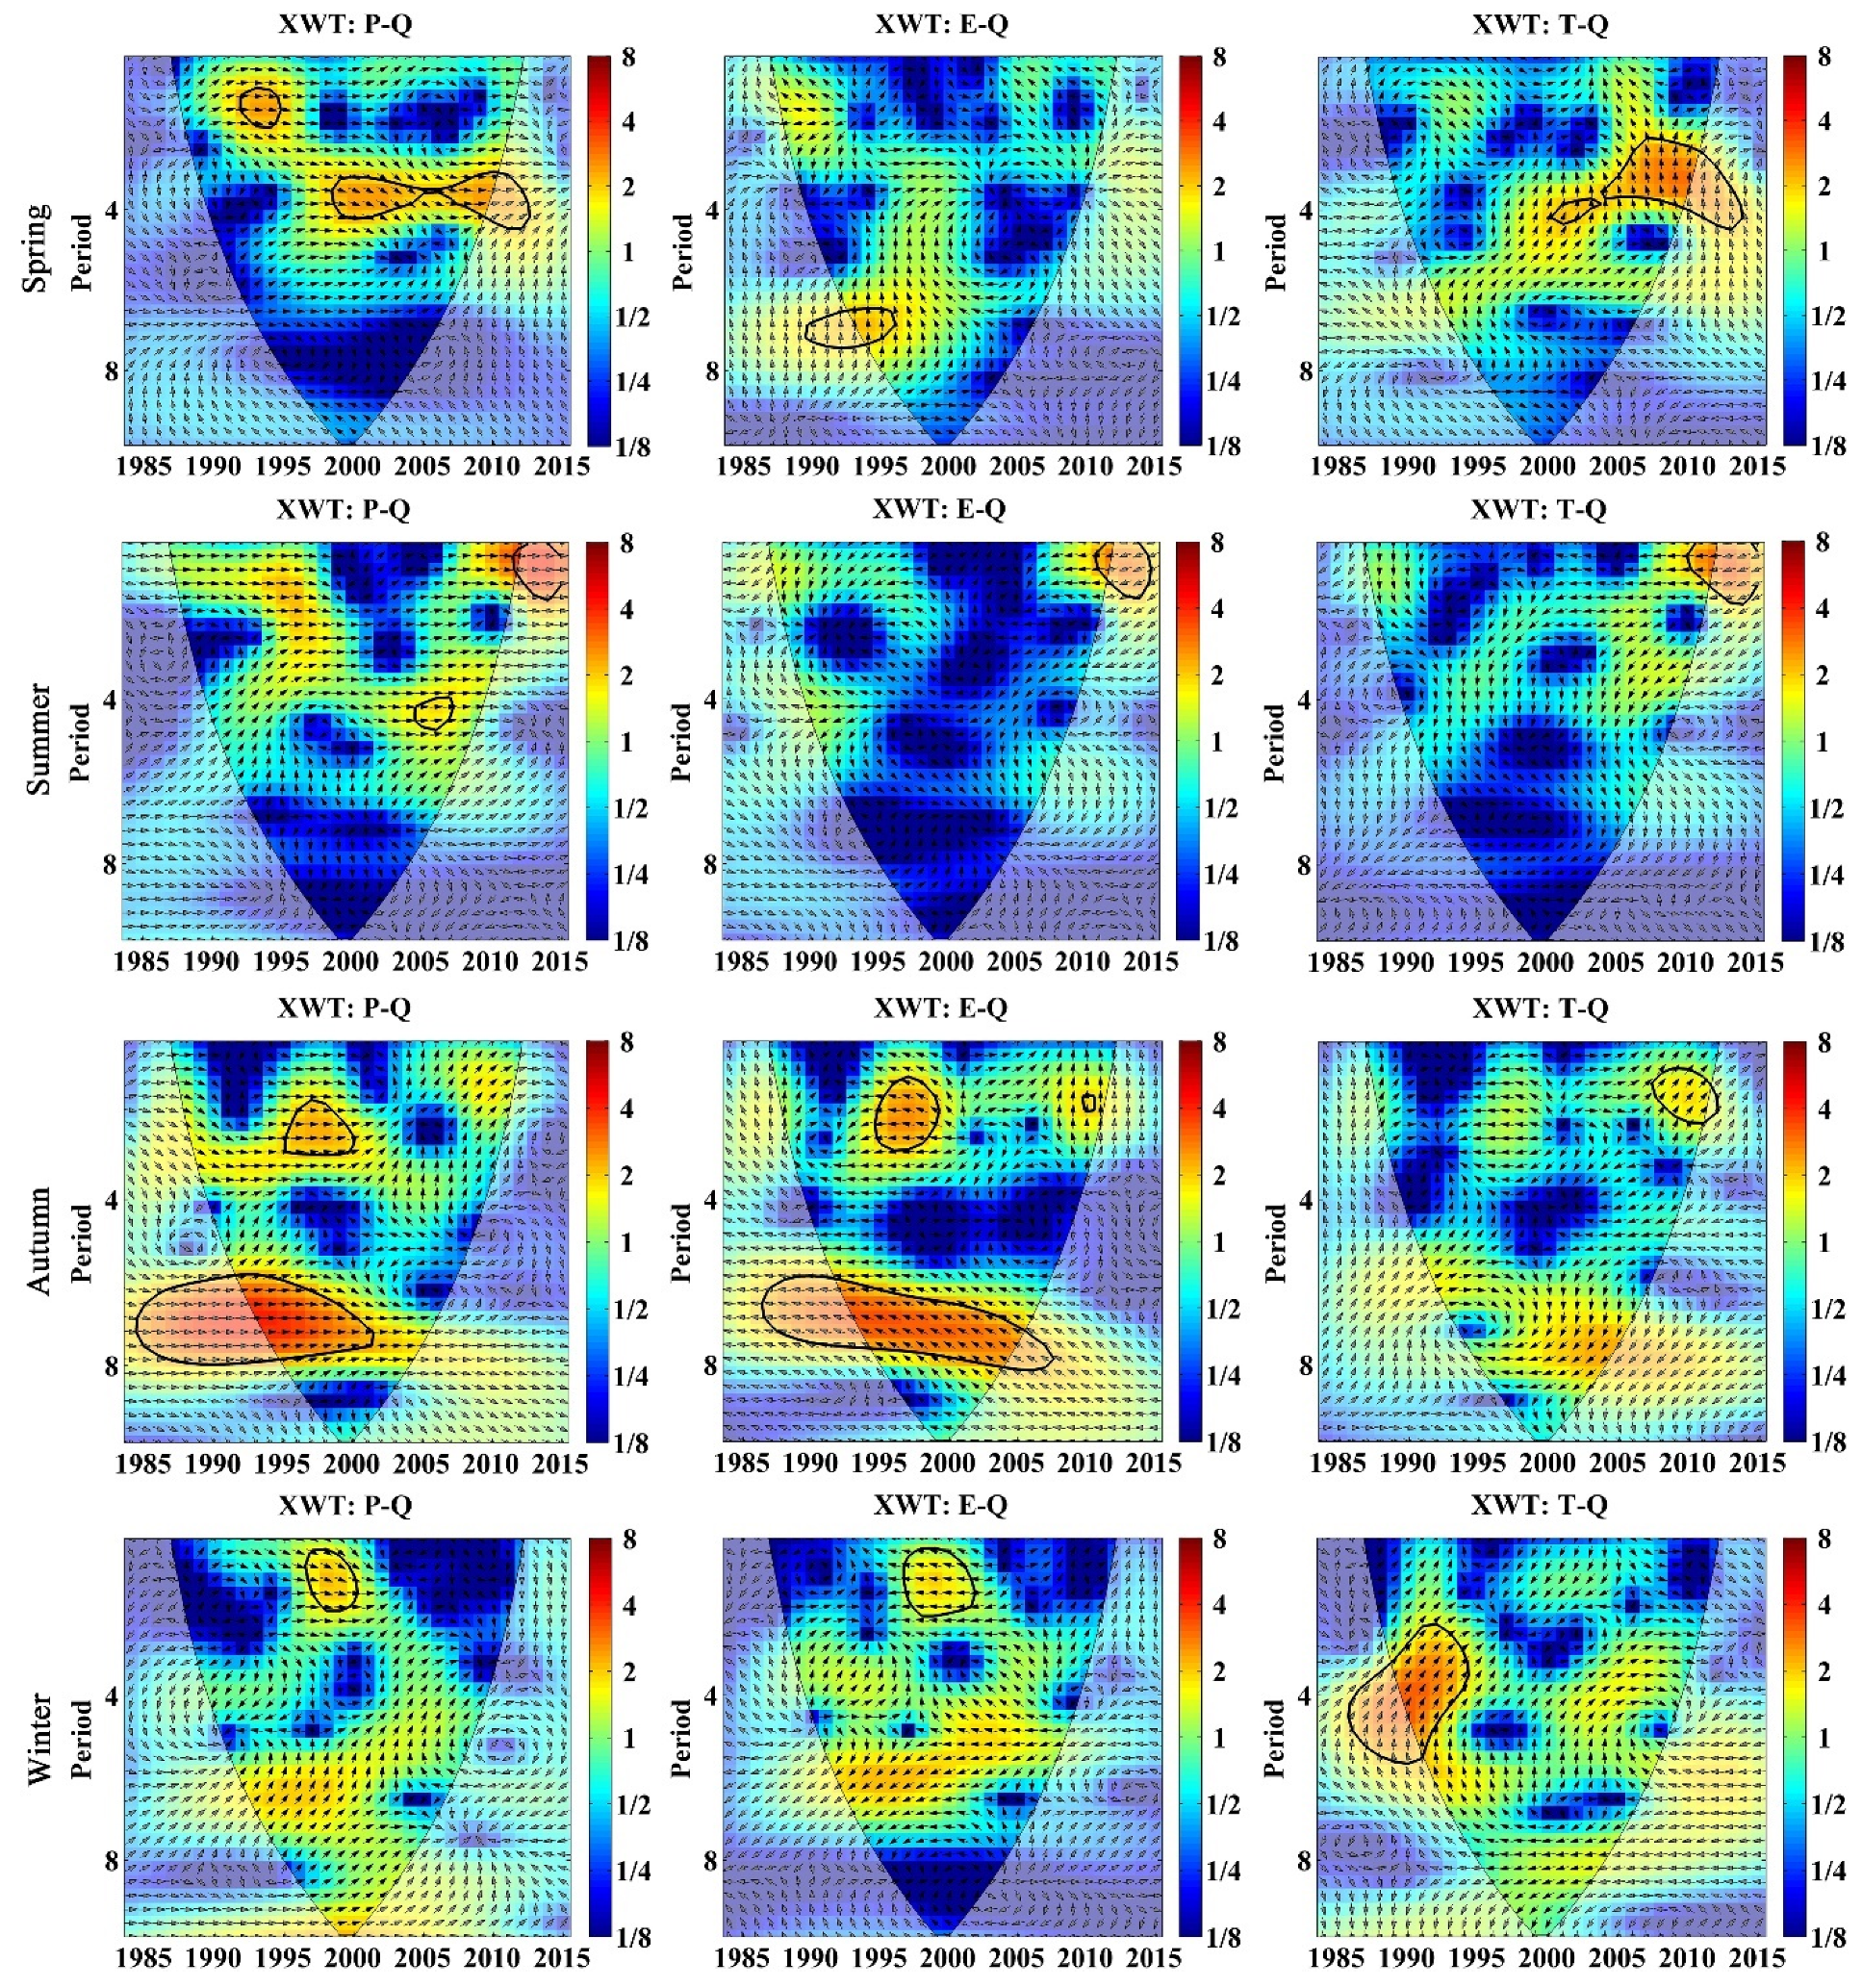
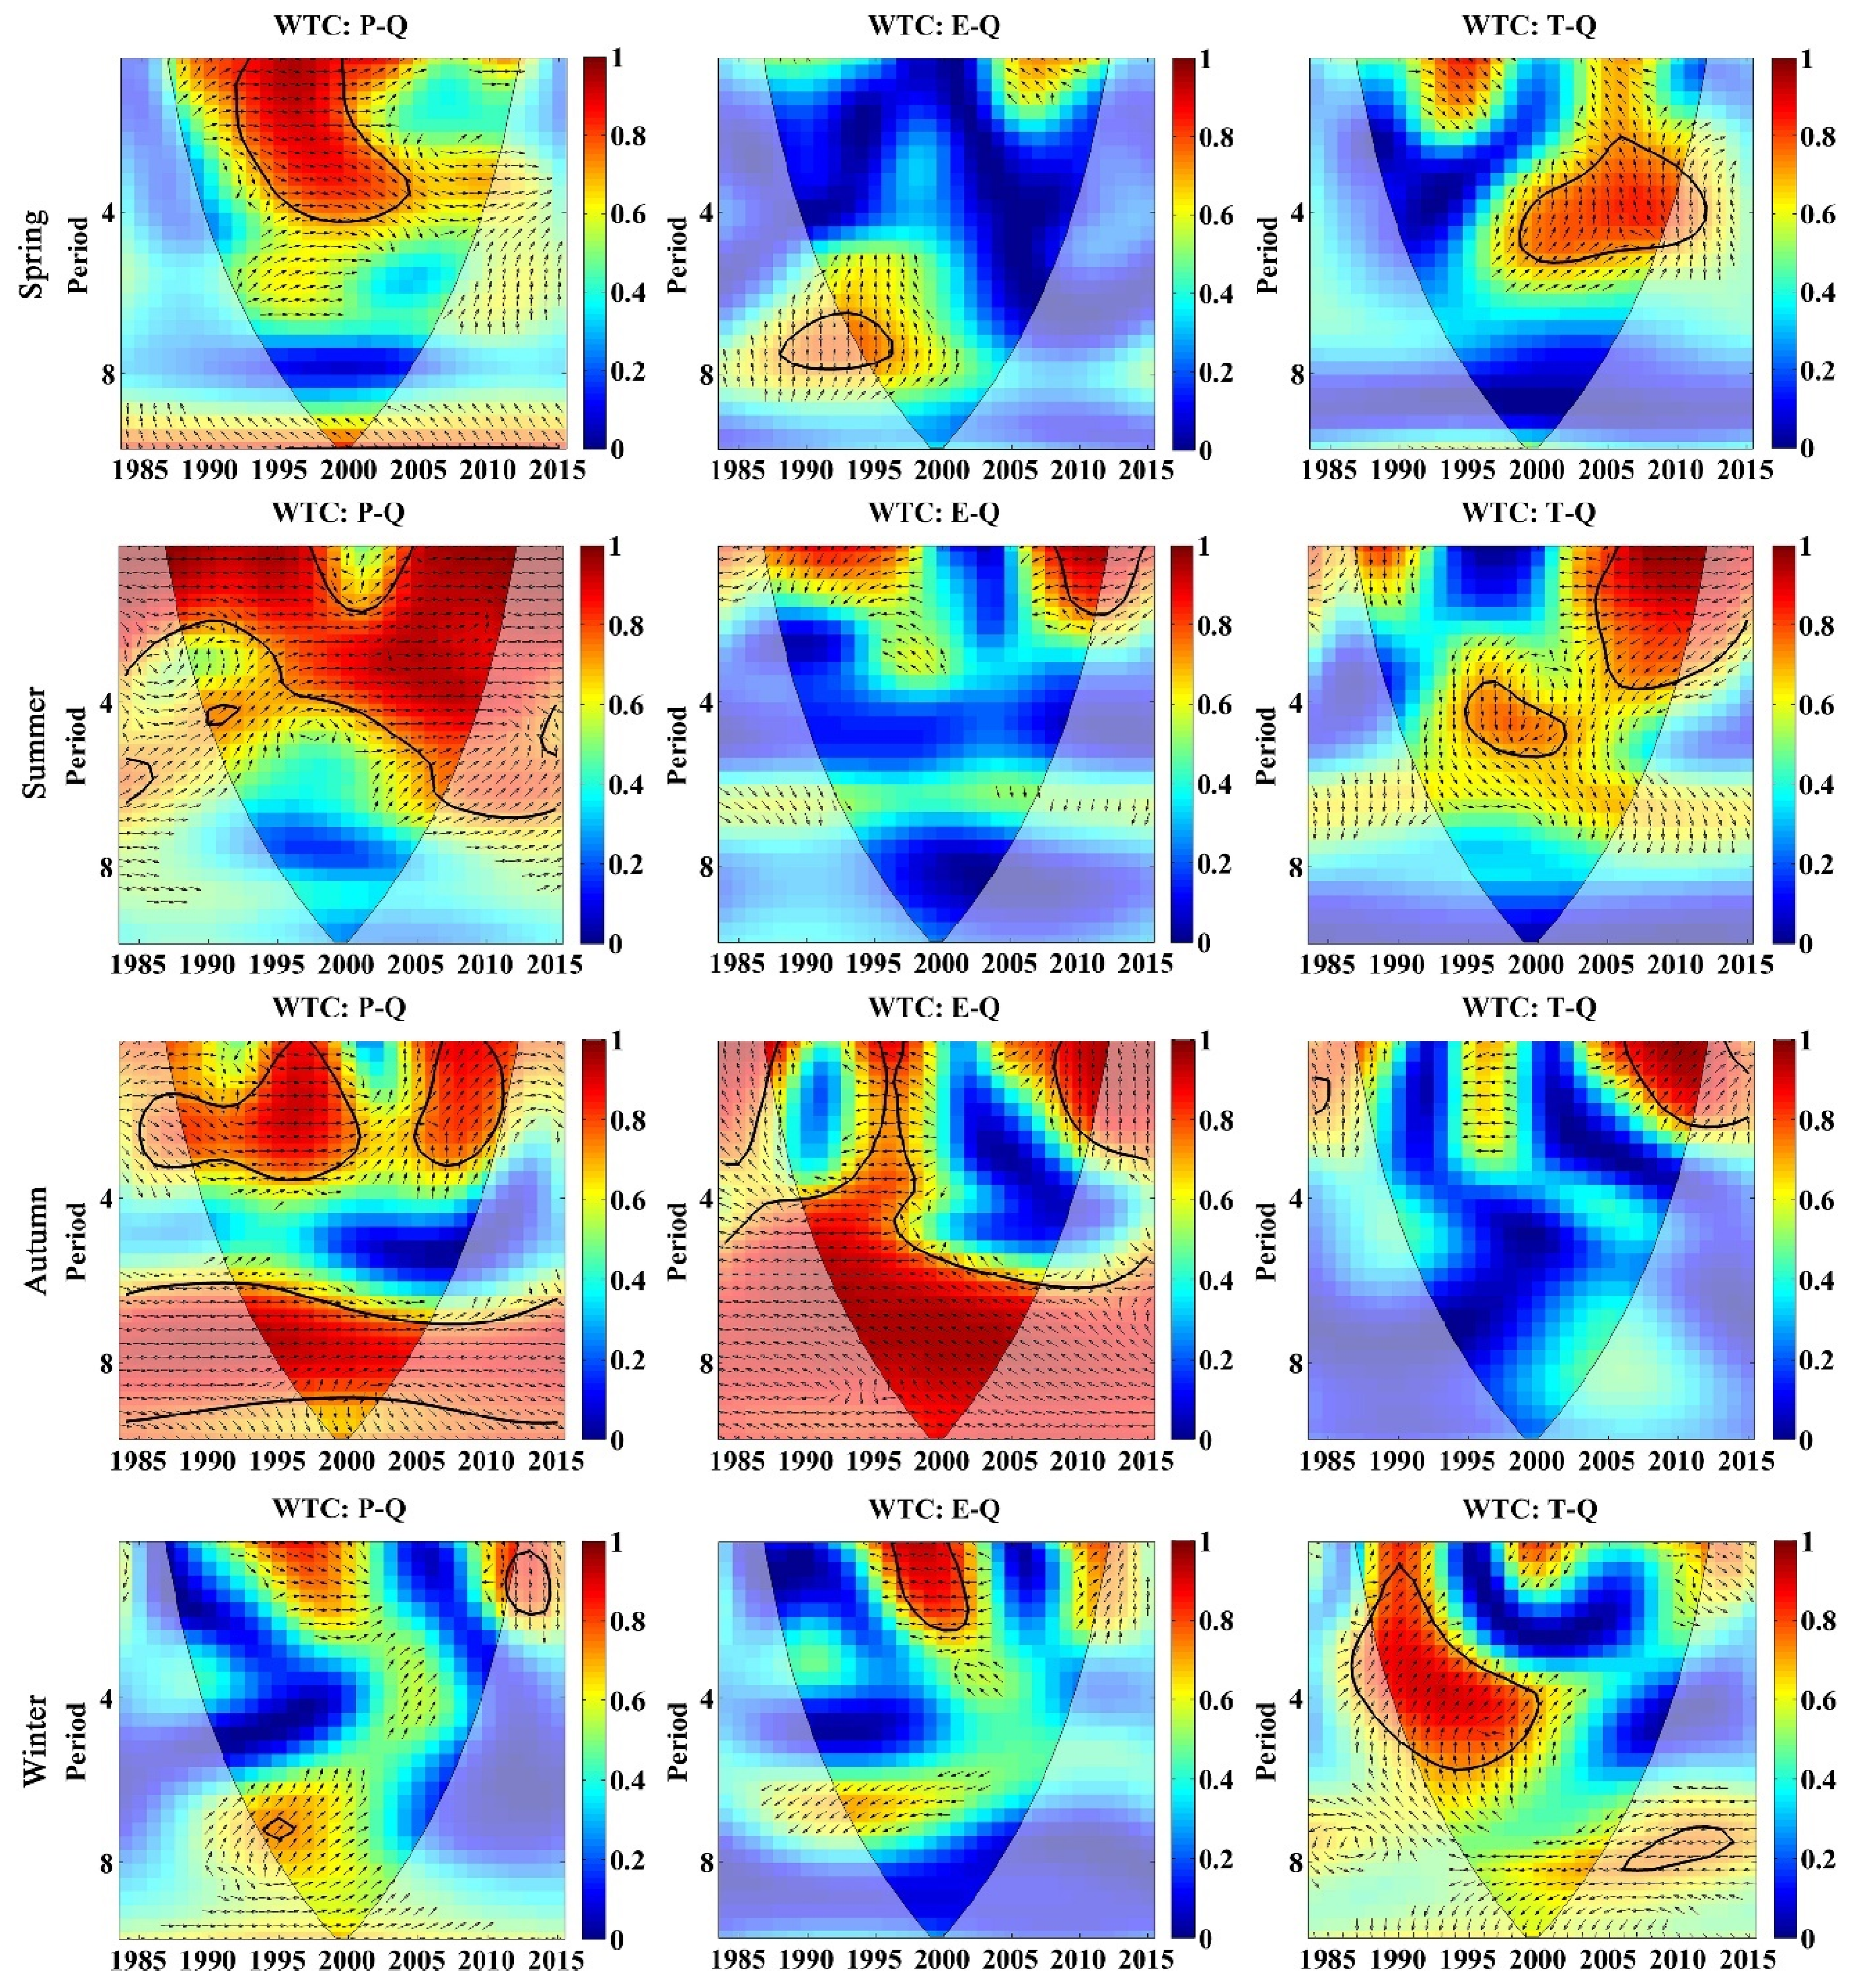
5.3.2. Response of Runoff Changes to Climatic Factors on Seasonal Scale
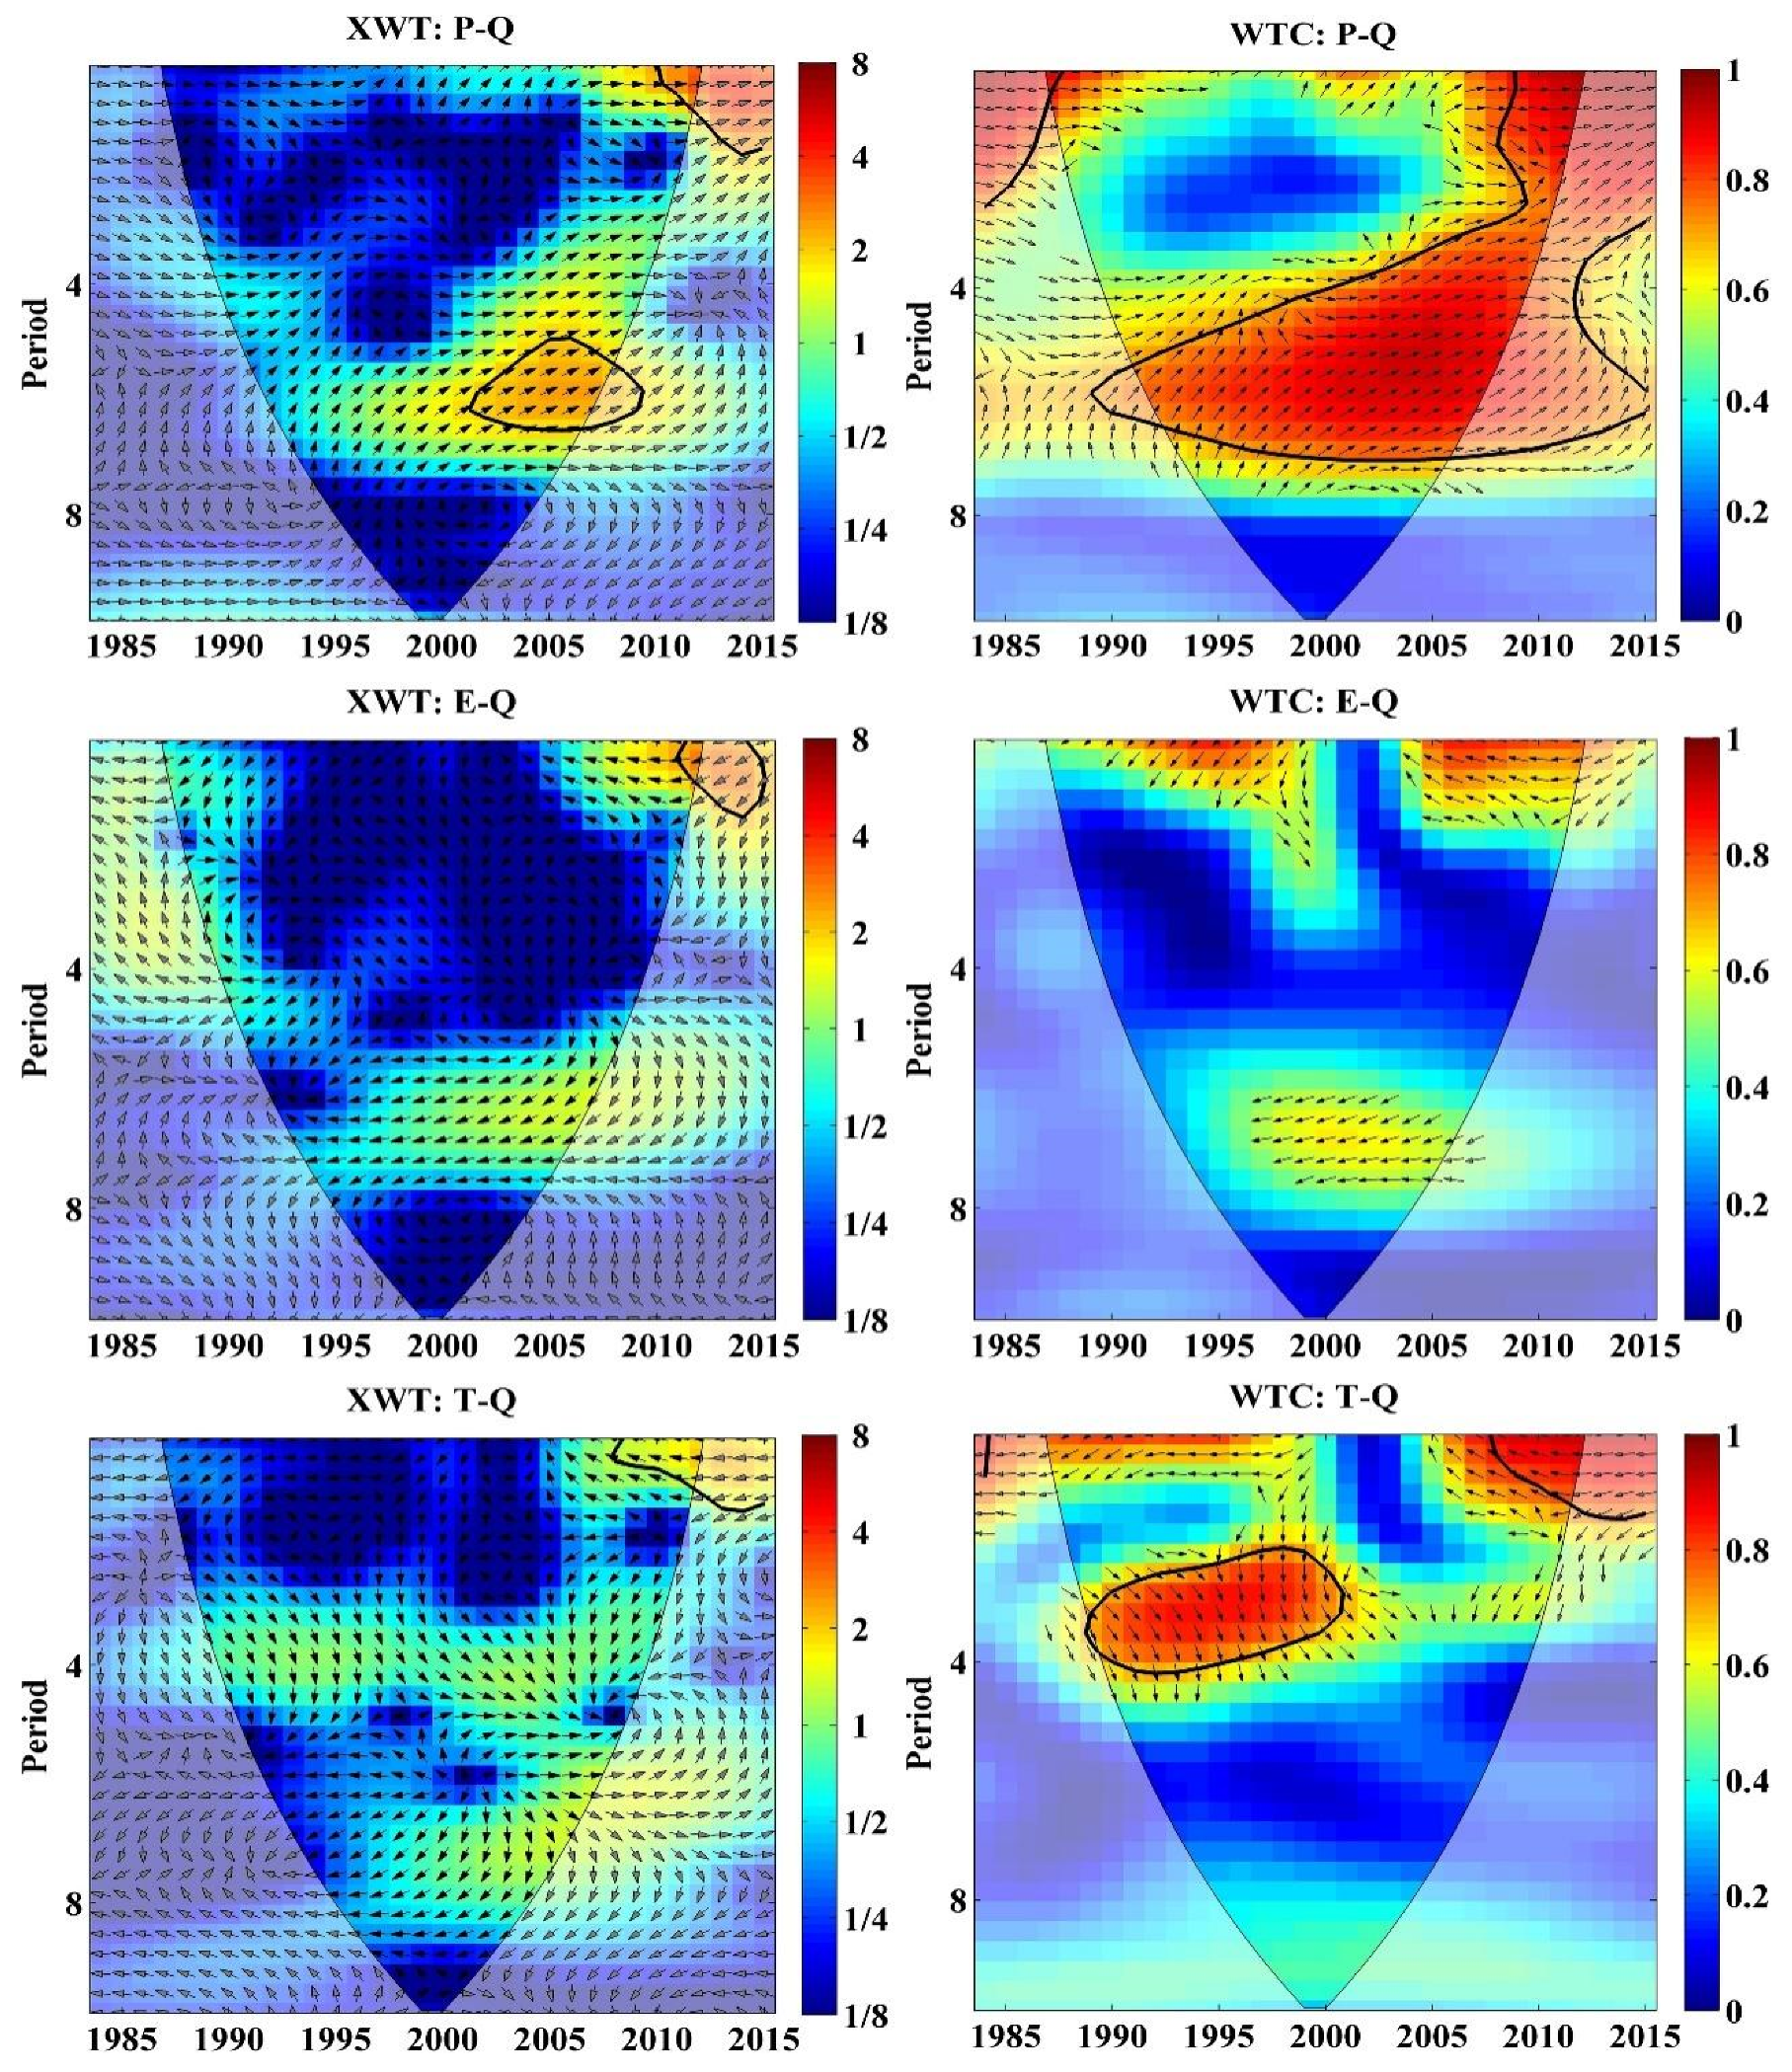
5.3.3. Response of Runoff Changes to Climatic Factors on Annual Scale
6. Discussion
6.1. Multi-Scale Effects of Rainfall on Runoff Changes
6.2. Multi-Scale Effects of Evaporation on Runoff Changes
6.3. Multi-Scale Effects of Temperature on Runoff Changes
7. Conclusions
Author Contributions
Funding
Institutional Review Board Statement
Informed Consent Statement
Data Availability Statement
Acknowledgments
Conflicts of Interest
References
- Liu, M.; Xu, X.; Wang, D.; Sun, A.Y.; Wang, K. Karst catchments exhibited higher degradation stress from climate change than the non-karst catchments in southwest China: An ecohydrological perspective. J. Hydrol. 2016, 535, 173–180. [Google Scholar] [CrossRef]
- Li, Z.W.; Xu, X.L.; Yu, B.F.; Xu, C.H.; Liu, M.X.; Wang, K.L. Quantifying the impacts of climate and human activities on water and sediment discharge in a karst region of southwest China. J. Hydrol. 2016, 542, 836–849. [Google Scholar] [CrossRef]
- Tian, Y.C.; Wang, S.J.; Bai, X.Y.; Luo, G.J.; Xu, Y. Trade-offs among ecosystem services in a typical Karst watershed, SW China. Sci. Total Environ. 2016, 566–567, 1297–1308. [Google Scholar] [CrossRef] [PubMed]
- Burns, D.A.; Klaus, J.; McHale, M.R. Recent climate trends and implications for water resources in the Catskill Mountain region, New York, USA. J. Hydrol. 2007, 336, 155–170. [Google Scholar] [CrossRef]
- Sun, W.G.; Cheng, B.Y.; Li, R. Seasonal variations of runoff and its wavelet correlations with regional climate in source regional of the Yellow River. J. Desert Res. 2010, 30, 712–721. [Google Scholar]
- Yonaba, R.; Biaou, A.C.; Koïta, M.; Tazen, F.; Mounirou, L.A.; Zouré, C.O.; Queloz, P.; Karambiri, H.; Yacouba, H. A dynamic land use/land cover input helps in picturing the Sahelian paradox: Assessing variability and attribution of changes in surface runoff in a Sahelian watershed. Sci. Total Environ. 2020, 757, 143792. [Google Scholar] [CrossRef]
- Chen, Y.N.; Xu, C.C.; Yang, Y.H.; Hao, X.M. Hydrology and water resources variation and its response to regional climate change in Xinjiang. Acta. Geogr. Sin. 2009, 64, 1331–1341. [Google Scholar] [CrossRef]
- Cannon, A.J.; McKendry, I.G. A graphical sensitivity analysis for statistical climate models: Application to Indian monsoon rainfall prediction by artificial neural networks and multiple linear regression models. Int. J. Clim. 2002, 22, 1687–1708. [Google Scholar] [CrossRef]
- Liang, L.; Liu, Q. Streamflow sensitivity analysis to climate change for a large water-limited watershed. Hydrol. Process. 2014, 28, 1767–1774. [Google Scholar] [CrossRef]
- Xu, X.; Du, Y.; Tang, J.; Wang, Y. Variations of temperature and rainfall extremes in recent two decades over China. Atmos. Res. 2011, 101, 143–154. [Google Scholar] [CrossRef]
- Wu, S.F.; Liu, Z.H.; Han, P.; Zhu, Z.C. Impact of climate change on water resources of the Urumchi River watershed. J. Glaciol. Geocryol. 2006, 28, 703–706. [Google Scholar]
- Li, Z.; Wang, W.; Zhang, M.; Wang, F.; Li, H. Observed changes in streamflow at the headwaters of the Urumqi River, eastern Tianshan, central Asia. Hydrol. Process. 2010, 24, 217–224. [Google Scholar] [CrossRef]
- Lan, Y.; Shen, Y.; Zhong, Y.; Wu, S.F.; Wang, G. Sensitivity of the mountain runoff of Urumqi River to the climate changes. J. Arid. Land Resour. Environ. 2010, 24, 50–55. [Google Scholar]
- Cui, Y.; Ye, B.; Wang, J.; Liu, Y.; Jing, Z. Analysis of the spatial-temporal variation of the positive degree-day factors on the glacier no.1 at the headwaters of the Urumqi River. J. Glaciol. Geocryol. 2010, 32, 265–274. [Google Scholar]
- Duan, K.Q.; Yao, T.D.; Wang, N.L.; Liu, H.C. Numerical simulation of Urumqi Glacier No. 1 in the eastern Tianshan, central Asia from 2005 to 2070. Sci. Bull. 2012, 57, 4505–4509. [Google Scholar] [CrossRef] [Green Version]
- Cui, Y.H. The runoff simulations for the Glacier No.1 hydrologic section at the headwaters of the Urumqi River on the different timescales. J. Arid. Land Resour. Environ. 2013, 27, 119–126. [Google Scholar]
- Qian, K.; Wang, X.S.; Lv, J.; Wan, L. The wavelet correlative analysis of climatic impacts on runoff in the source region of Yangtze River, in China. Int. J. Clim. 2013, 34, 2019–2032. [Google Scholar] [CrossRef]
- Si, B.C. Spatial Scaling Analyses of Soil Physical Properties: A Review of Spectral and Wavelet Methods. Vadose Zone J. 2008, 7, 547–562. [Google Scholar] [CrossRef] [Green Version]
- Grinsted, A.; Moore, J.C.; Jevrejeva, S. Application of the cross wavelet transform and wavelet coherence to geophysical time series. Nonlin. Process. Geophys. 2004, 11, 561–566. [Google Scholar] [CrossRef]
- Torrence, C.; Compo, G.P. A practical guide to wavelet analysis. Bull. Am. Meteorol. Soc. 1998, 9, 61–78. [Google Scholar] [CrossRef] [Green Version]
- Hao, Y.; Liu, G.; Li, H.; Li, Z.; Zhao, J.; Yeh, T.C.J. Investigation of karstic hydrological processes of Niangziguan Springs (North China) using wavelet analysis. Hydrol. Process. 2011, 26, 3062–3069. [Google Scholar] [CrossRef]
- Li, X.; Xu, X.; Liu, W.; He, L.; Zhang, R.; Xu, C.; Wang, K. Similarity of the temporal pattern of soil moisture across soil profile in karst catchments of southwestern China. J. Hydrol. 2017, 555, 659–669. [Google Scholar] [CrossRef]
- Charlier, J.B.; Ladouche, B.; Maréchal, J.C. Identifying the impact of climate and anthropic pressures on karst aquifers using wavelet analysis. J. Hydrol. 2015, 523, 610–623. [Google Scholar] [CrossRef] [Green Version]
- Labat, D.; Ababou, R.; Mangin, A. Rainfall–runoff relations for karstic springs. Part II: Continuous wavelet and discrete orthogonal multiresolution analyses. J. Hydrol. 2000, 238, 149–178. [Google Scholar] [CrossRef]
- Labat, D.; Ronchail, J.; Guyot, J.L. Recent advances in wavelet analyses: Part 2—Amazon, Parana, Orinoco and Congo discharges time scale variability. J. Hydrol. 2005, 314, 289–311. [Google Scholar] [CrossRef]
- Massei, N.; Durand, A.; Deloffre, J.; Dupont, J.P.; Valdes, D.; Laignel, B. Investigating possible links between the North Atlantic Oscillation and rainfall variability in northwestern France over the past 35 years. J. Geophys. Res. 2007, 112, D09121. [Google Scholar] [CrossRef] [Green Version]
- Labat, D. Cross wavelet analyses of annual continental freshwater discharge and selected climate indices. J. Hydrol. 2010, 385, 269–278. [Google Scholar] [CrossRef]
- Fu, G.B.; Charles, S.P.; Chiew, F.H.S. A two-parameter climate elasticity of streamflow index to assess climate change effects on annual streamflow. Water Resour. Res. 2007, 43, W11419. [Google Scholar] [CrossRef]
- Lafrenière, M.; Sharp, M. Wavelet analysis of inter-annual variability in the runoff regimes of glacial and nival stream catchments, Bow Lake, Alberta. Hydrol. Process. 2003, 17, 1093–1118. [Google Scholar] [CrossRef]
- Schaefli, B.; Maraun, D.; Holschneider, M. What drives high flow events in the Swiss Alps? Recent developments in wavelet spectral analysis and their application to hydrology. Adv. Water Resour. 2007, 30, 2511–2525. [Google Scholar] [CrossRef] [Green Version]
- Wu, L.; Wang, S.; Bai, X.; Luo, W.; Tian, Y.; Zeng, C.; Luo, G.; He, S. Quantitative assessment of the impacts of climate change and human activities on runoff change in a typical karst watershed, SW China. Sci. Total Environ. 2017, 601–602, 1449–1465. [Google Scholar] [CrossRef] [PubMed]
- Li, Z.W.; Xu, X.L.; Xu, H.; Liu, X.; Wang, K.L.; Yi, R. Monthly sediment discharge changes and estimates in a typical karst catchment of southwest China. J. Hydrol. 2017, 555, 95–107. [Google Scholar] [CrossRef]
- Li, Z.W.; Xu, X.L.; Xu, C.H.; Liu, M.X.; Wang, K.L. Dam construction impacts on multiscale characterization of sediment discharge in two typical karst watersheds of southwest China. J. Hydrol. 2018, 558, 42–54. [Google Scholar] [CrossRef]
- Liu, Y.C.; Liu, Z.F.; Hao, Y.H.; Han, T.D.; Shen, Y.P.; Jiao, K.Q.; Huo, X.L. Multi-time scale characteristics of the runoff in the upstream of Rümqi River, Tianshan Mountains, based on cross-wavelet transformation. J. Glaciol. Geocryol. 2013, 35, 1564–1572. [Google Scholar]
- Sidibe, M.; Dieppois, B.; Eden, J.; Mahé, G.; Paturel, J.E.; Amoussou, E.; Anifowose, B.; Lawler, D. Interannual to Multi-decadal streamflow variability in West and Central Africa: Interactions with catchment properties and large-scale climate variability. Glob. Planet. Chang. 2019, 177, 141–156. [Google Scholar] [CrossRef]
- Hartmann, A.; Goldscheider, N.; Wagener, T.; Lange, J.; Weiler, M. Karst water resources in a changing world: Review of hydrological modeling approaches. Rev. Geophys. 2014, 52, 218–242. [Google Scholar] [CrossRef]
- Liu, C.Q. Biogeochemical Processes and Cycling of Nutrients in the Earth’s Surface: Cycling of Nutrients in Soil-Plant Systems of Karstic Environments; Science Press: Beijing, China, 2009. [Google Scholar]
- Liu, C.C.; Liu, Y.G.; Fan, D.Y.; Guo, K. Plant drought tolerance assessment for re-vegetation in heterogeneous karst landscapes of southwestern China. Flora-Morphol. Distrib. Funct. Ecol. Plants 2012, 207, 30–38. [Google Scholar] [CrossRef]
- Wilcox, B.P.; Wilding, L.P.; Woodruff, C.M. Soil and topographic controls on runoff generation from stepped landforms in the Edwards Plateau of Central Texas. Geophys. Res. Lett. 2007, 34, L24S24. [Google Scholar] [CrossRef] [Green Version]
- Williams, P.W. The role of the epikarst in karst and cave hydrogeology: A review. Int. J. Speleol. 2008, 37, 1–10. [Google Scholar] [CrossRef] [Green Version]
- Nie, Y.P.; Chen, H.S.; Wang, K.L.; Yang, J. Water source utilization by woody plants growing on dolomite outcrops and nearby soils during dry seasons in karst region of Southwest China. J. Hydrol. 2012, 420–421, 264–274. [Google Scholar] [CrossRef]
- Butscher, C.; Huggenberger, P. Modeling the Temporal Variability of Karst Groundwater Vulnerability, with Implications for Climate Change. Environ. Sci. Technol. 2009, 43, 1665–1669. [Google Scholar] [CrossRef] [PubMed] [Green Version]
- Petrella, E.; Falasca, A.; Celico, F. Natural-gradient tracer experiments in epikarst: A test study in the Acqua dei Faggi experimental site, southern Italy. Geofluids 2008, 8, 159–166. [Google Scholar] [CrossRef]
- Wilcox, B.P.; Taucer, P.I.; Munster, C.L.; Owens, M.K.; Mohanty, B.P.; Sorenson, J.R.; Bazan, R. Subsurface stormflow is important in semiarid karst shrublands. Geophys. Res. Lett. 2008, 35, L10403. [Google Scholar] [CrossRef] [Green Version]
- Qin, L.Y.; Bai, X.Y.; Wang, S.J.; Zhou, D.Q.; Li, Y.; Peng, T.; Tian, Y.; Luo, G. Major problems and solutions on surface water resource utilisation in karst mountainous areas. Agric. Water Manag. 2015, 159, 55–65. [Google Scholar] [CrossRef]
- Luo, G.J.; Wang, S.J.; Bai, X.Y.; Liu, X.M.; Cheng, A.Y. Delineating small karst watersheds based on digital elevation model and eco-hydrogeological principles. Solid Earth 2016, 7, 457–468. [Google Scholar] [CrossRef] [Green Version]
- Burrus, C.S.; Gopinath, R.A.; Guo, H. Introduction to Wavelets and Wavelet Transforms; Prentice Hall: Hoboken, NJ, USA, 1998. [Google Scholar]
- Allen, M.R.; Smith, L.A. Monte Carlo SSA: Detecting irregular oscillations in the presence of coloured noise. J. Clim. 1996, 9, 3373–3404. [Google Scholar] [CrossRef]
- Kumar, P.; Foufoula-Georgiou, E. Wavelet analysis for geophysical applications. Rev. Geophys. 1997, 35, 385–412. [Google Scholar] [CrossRef] [Green Version]
- Zar, J.H. Biostatistical Analysis; Prentice Hall: Hoboken, NJ, USA, 1999. [Google Scholar]
- Wang, S.J.; Zhang, D.F. Karst rocky desertification in south western China: Geomorphology, landuse, impact and rehabilitation. Land Degrad. Dev. 2004, 15, 115–121. [Google Scholar] [CrossRef]
- Williams, P.W. The epikarst: Evolution of understanding. In Epikarst; Jones, W.K., Culver, D.C., Herman, J.S., Eds.; Karst Waters Institute: Charles Town, WV, USA, 2004; pp. 8–15. [Google Scholar]
- Peng, T.; Wang, S.J. Effects of land use, land cover and rainfall regimes on the surface runoff and soil loss on karst slopes in southwest China. Catena 2012, 90, 53–62. [Google Scholar] [CrossRef]
- Zhang, S.R.; Bai, X.Y.; Zhao, C.W.; Tan, Q.; Luo, G.J.; Cao, Y.; Deng, Y.; Li, Q.; Li, C.; Wu, L.; et al. Limitations of soil moisture and formation rate on vegetation growth in karst areas. Sci. Total Environ. 2021, 810, 151209. [Google Scholar] [CrossRef]
- Xiong, L.; Bai, X.Y.; Zhao, C.W.; Li, Y.B.; Tan, Q.; Luo, G.J.; Wu, L.; Chen, F.; Li, C.; Ran, C.; et al. High-Resolution Data Sets for Global Carbonate and Silicate Rock Weathering Carbon Sinks and Their Change Trends. Earth’s Feature 2022, 10, e2022EF002746. [Google Scholar] [CrossRef]
- Xi, H.P.; Wang, S.J.; Bai, X.Y.; Tang, H.; Luo, G.J.; Li, H.W.; Wu, L.; Li, C.; Chen, H.; Ran, C.; et al. The responses of weathering carbon sink to eco-hydrological processes in global rocks. Sci. Total Environ. 2021, 788, 147706. [Google Scholar] [CrossRef] [PubMed]
- Yan, J.H.; Zhou, G.Y.; Shen, W.J. Grey correlation analysis of the effect of vegetation status on surface runoff coefficient of forest ecosystems. Chin. J. Appl. Environ. Biol. 2000, 6, 197–200. [Google Scholar]
- Dong, H.B.; Zhang, J.J.; Zhang, B.; Zhang, R.; Zhou, X.X. Research on rain-runoff relationship in different land use types on the loess area in western Shanxi province. J. Arid. Land Resour. Environ. 2009, 23, 110–116. [Google Scholar]
- Li, X.Y.; Sergio, C.; Albert, S.B.; Yolanda, C.; Francisco, D.; Roberto, L.; Henry, L.; Bas, V.W.; Juan, P. Controls of infiltration-runoff processes in Mediterranean karst rangelands in SE Spain. Catena 2011, 86, 98–109. [Google Scholar] [CrossRef] [Green Version]
- Chen, H.S.; Yang, J.; Fu, W.; He, F.; Wang, K.L. Characteristics of slope runoff and sediment yield on karst hill-slope with different land-use types in northwest guangxi. Trans. Chin. Soc. Agric. Eng. 2012, 28, 121–126. [Google Scholar]
- Chen, W.Y.; Wang, S.J.; Bai, X.Y.; Qin, L.Y.; Zhang, S.Y. Drainage network distribution and its master natural factors in Guizhou province. Earth. Environ. 2013, 41, 193–202. [Google Scholar]
- Peng, X.D.; Dai, Q.H.; Li, C.L.; Zhao, L.S. Role of underground fissure flow in near-surface rainfall-runoff process on a rock mantled slope in the karst rocky desertification area. Eng. Geol. 2018, 243, 10–17. [Google Scholar] [CrossRef]
- Peng, T.; Yang, T.; Wang, S.J.; Zhang, X.B.; Chen, B.; Wang, J.Y. Monitoring results of soil loss in karst slopes. Earth Environ. 2009, 37, 126–130. (In Chinese) [Google Scholar]
- Fu, Z.; Chen, H.; Zhang, W.; Xu, Q.; Wang, S.; Wang, K. Subsurface flow in a soil-mantled subtropical dolomite karst slope: A field rainfall simulation study. Geomorphology 2015, 250, 1–14. [Google Scholar] [CrossRef]
- Maass, M.; Ahedo-Hernández, R.; Salvador, A.; Verduzco, A.; Martínez-Yrízar, A.; Jaramillo, V.J.; Parker, G.; Pascual, F.; García-Méndez, G.; Sarukhán, J. Long-term (33 years) rainfall and runoff dynamics in a tropical dry forest ecosystem in western Mexico: Management implications under extreme hydrometeorological events. For. Ecol. Manag. 2018, 426, 7–17. [Google Scholar] [CrossRef]


Publisher’s Note: MDPI stays neutral with regard to jurisdictional claims in published maps and institutional affiliations. |
© 2022 by the authors. Licensee MDPI, Basel, Switzerland. This article is an open access article distributed under the terms and conditions of the Creative Commons Attribution (CC BY) license (https://creativecommons.org/licenses/by/4.0/).
Share and Cite
Wu, L.; Wang, S.; Bai, X.; Chen, F.; Li, C.; Ran, C.; Zhang, S. Identifying the Multi-Scale Influences of Climate Factors on Runoff Changes in a Typical Karst Watershed Using Wavelet Analysis. Land 2022, 11, 1284. https://doi.org/10.3390/land11081284
Wu L, Wang S, Bai X, Chen F, Li C, Ran C, Zhang S. Identifying the Multi-Scale Influences of Climate Factors on Runoff Changes in a Typical Karst Watershed Using Wavelet Analysis. Land. 2022; 11(8):1284. https://doi.org/10.3390/land11081284
Chicago/Turabian StyleWu, Luhua, Shijie Wang, Xiaoyong Bai, Fei Chen, Chaojun Li, Chen Ran, and Sirui Zhang. 2022. "Identifying the Multi-Scale Influences of Climate Factors on Runoff Changes in a Typical Karst Watershed Using Wavelet Analysis" Land 11, no. 8: 1284. https://doi.org/10.3390/land11081284
APA StyleWu, L., Wang, S., Bai, X., Chen, F., Li, C., Ran, C., & Zhang, S. (2022). Identifying the Multi-Scale Influences of Climate Factors on Runoff Changes in a Typical Karst Watershed Using Wavelet Analysis. Land, 11(8), 1284. https://doi.org/10.3390/land11081284