
The Effect of Land Use and Land Cover Changes on Flood Occurrence in Teunom Watershed, Aceh Jaya

 ,
,
Abstract
:1. Introduction
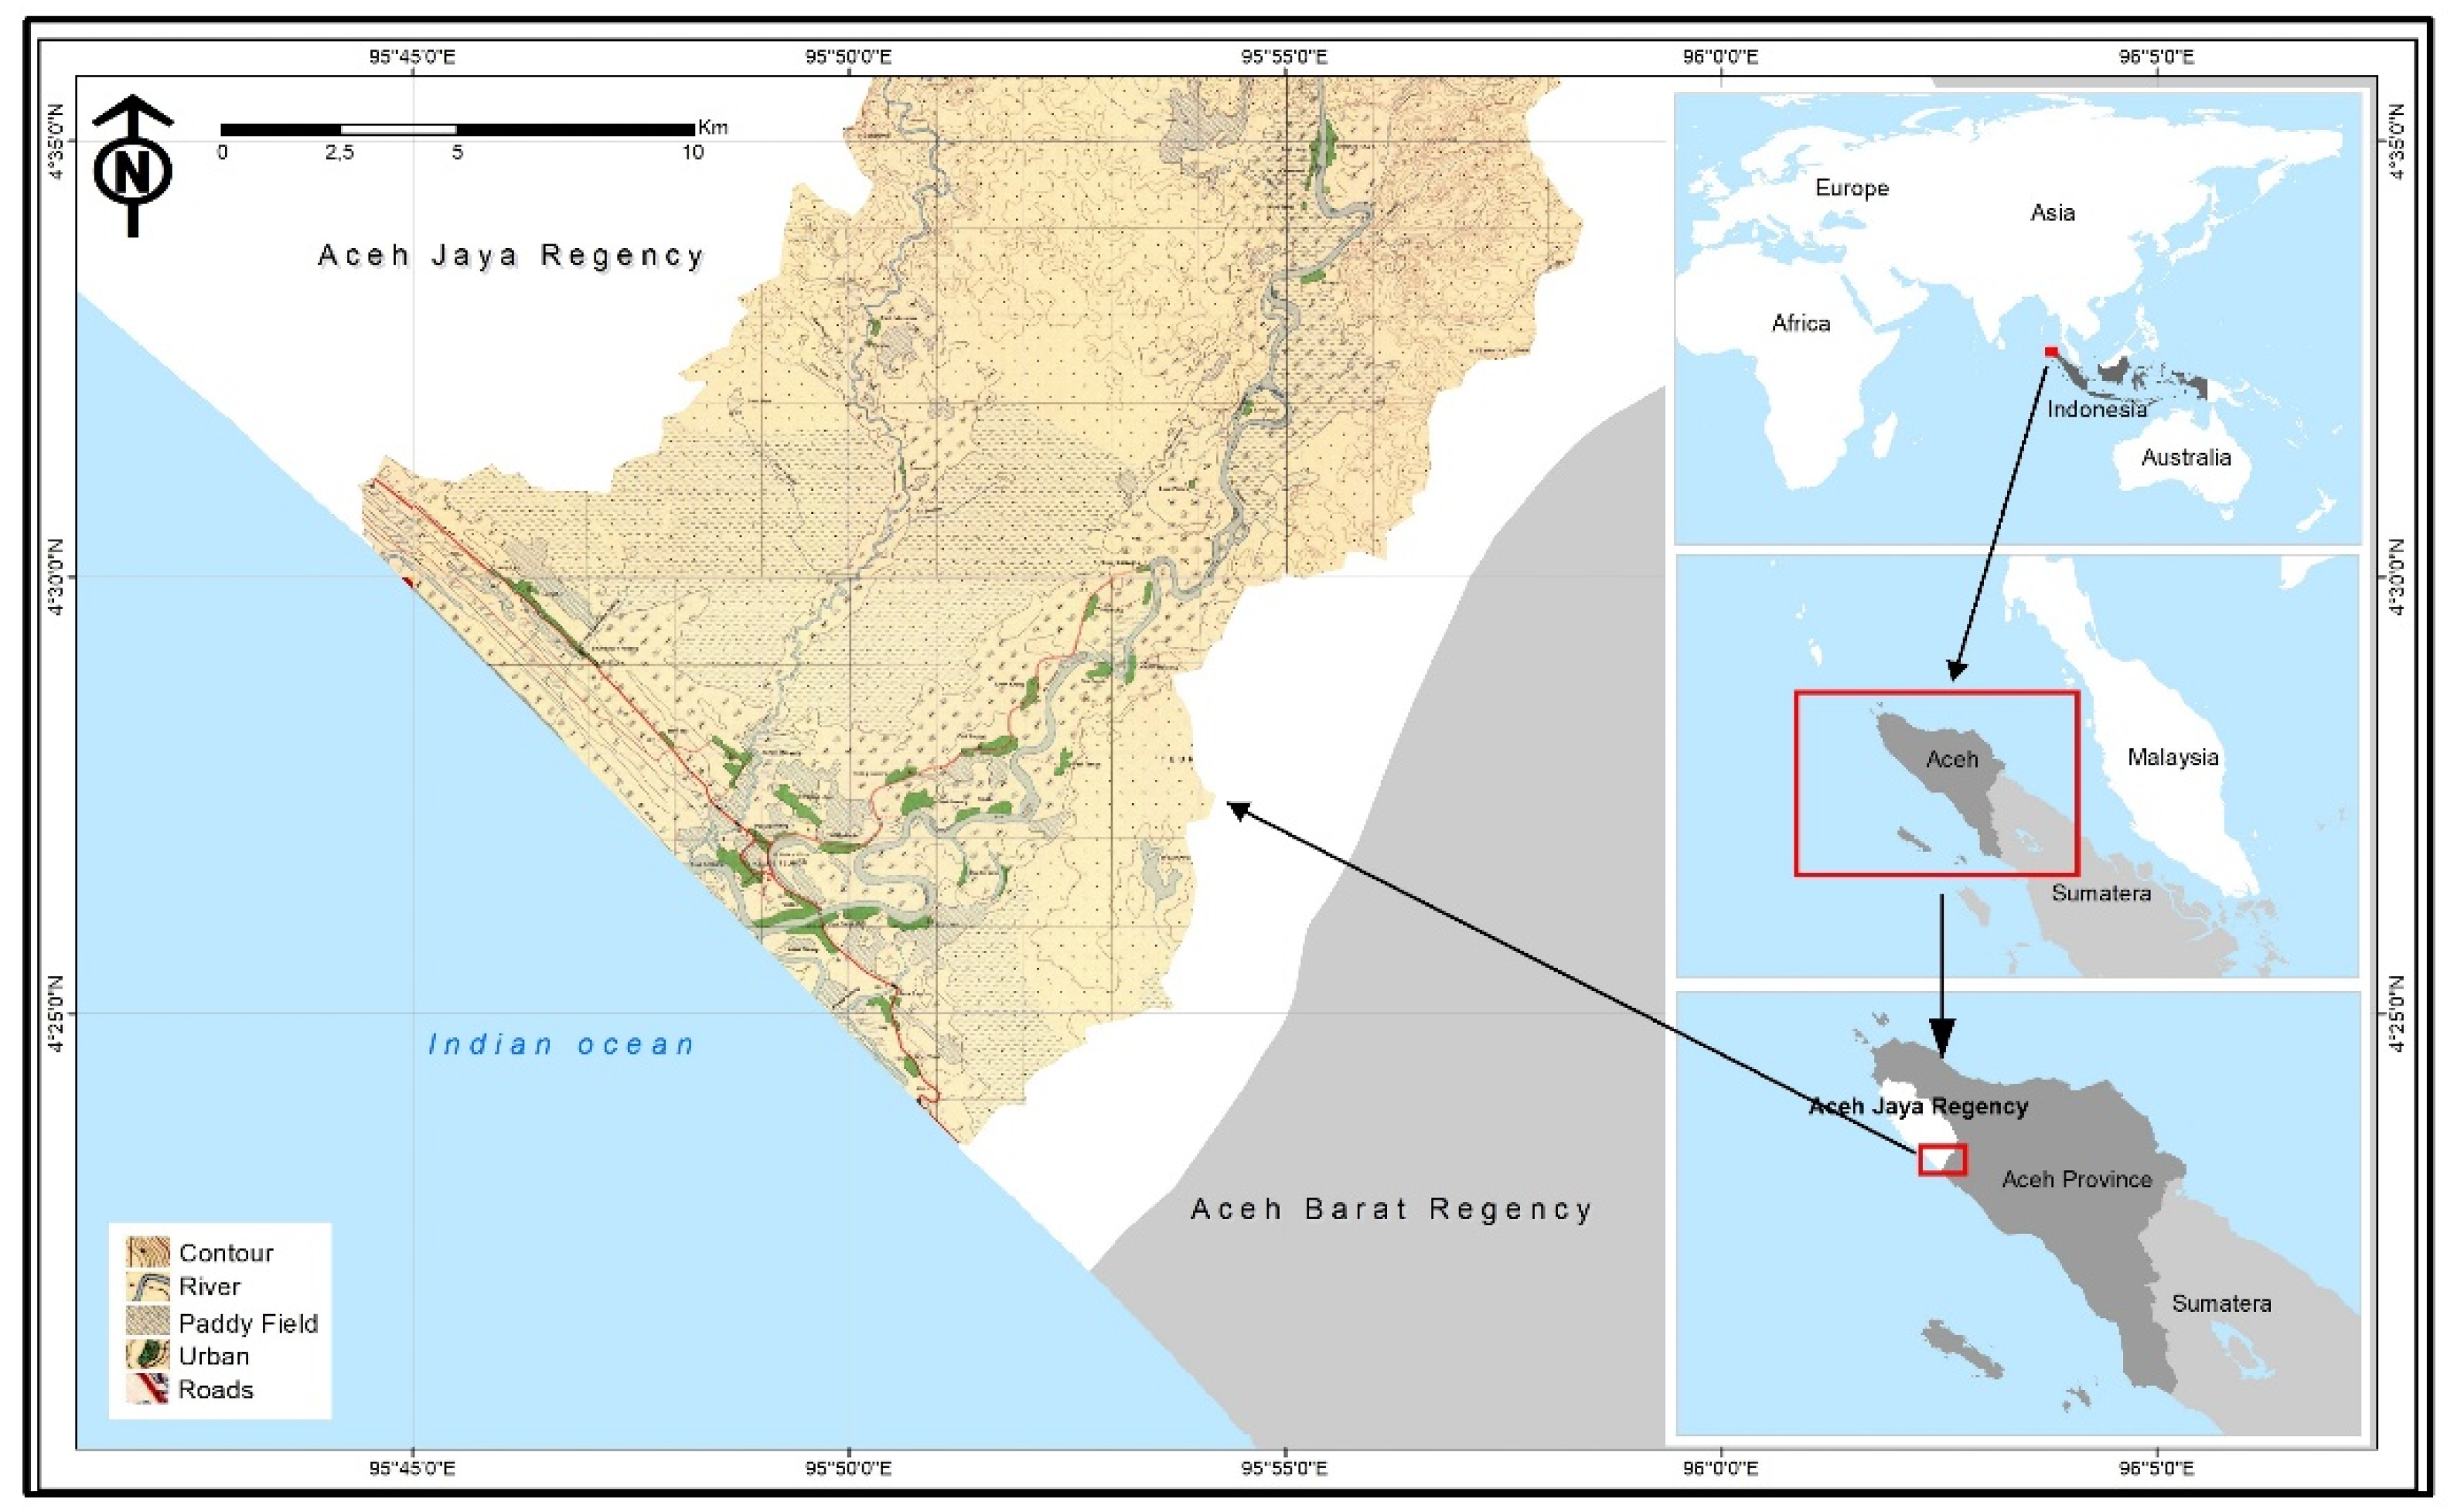
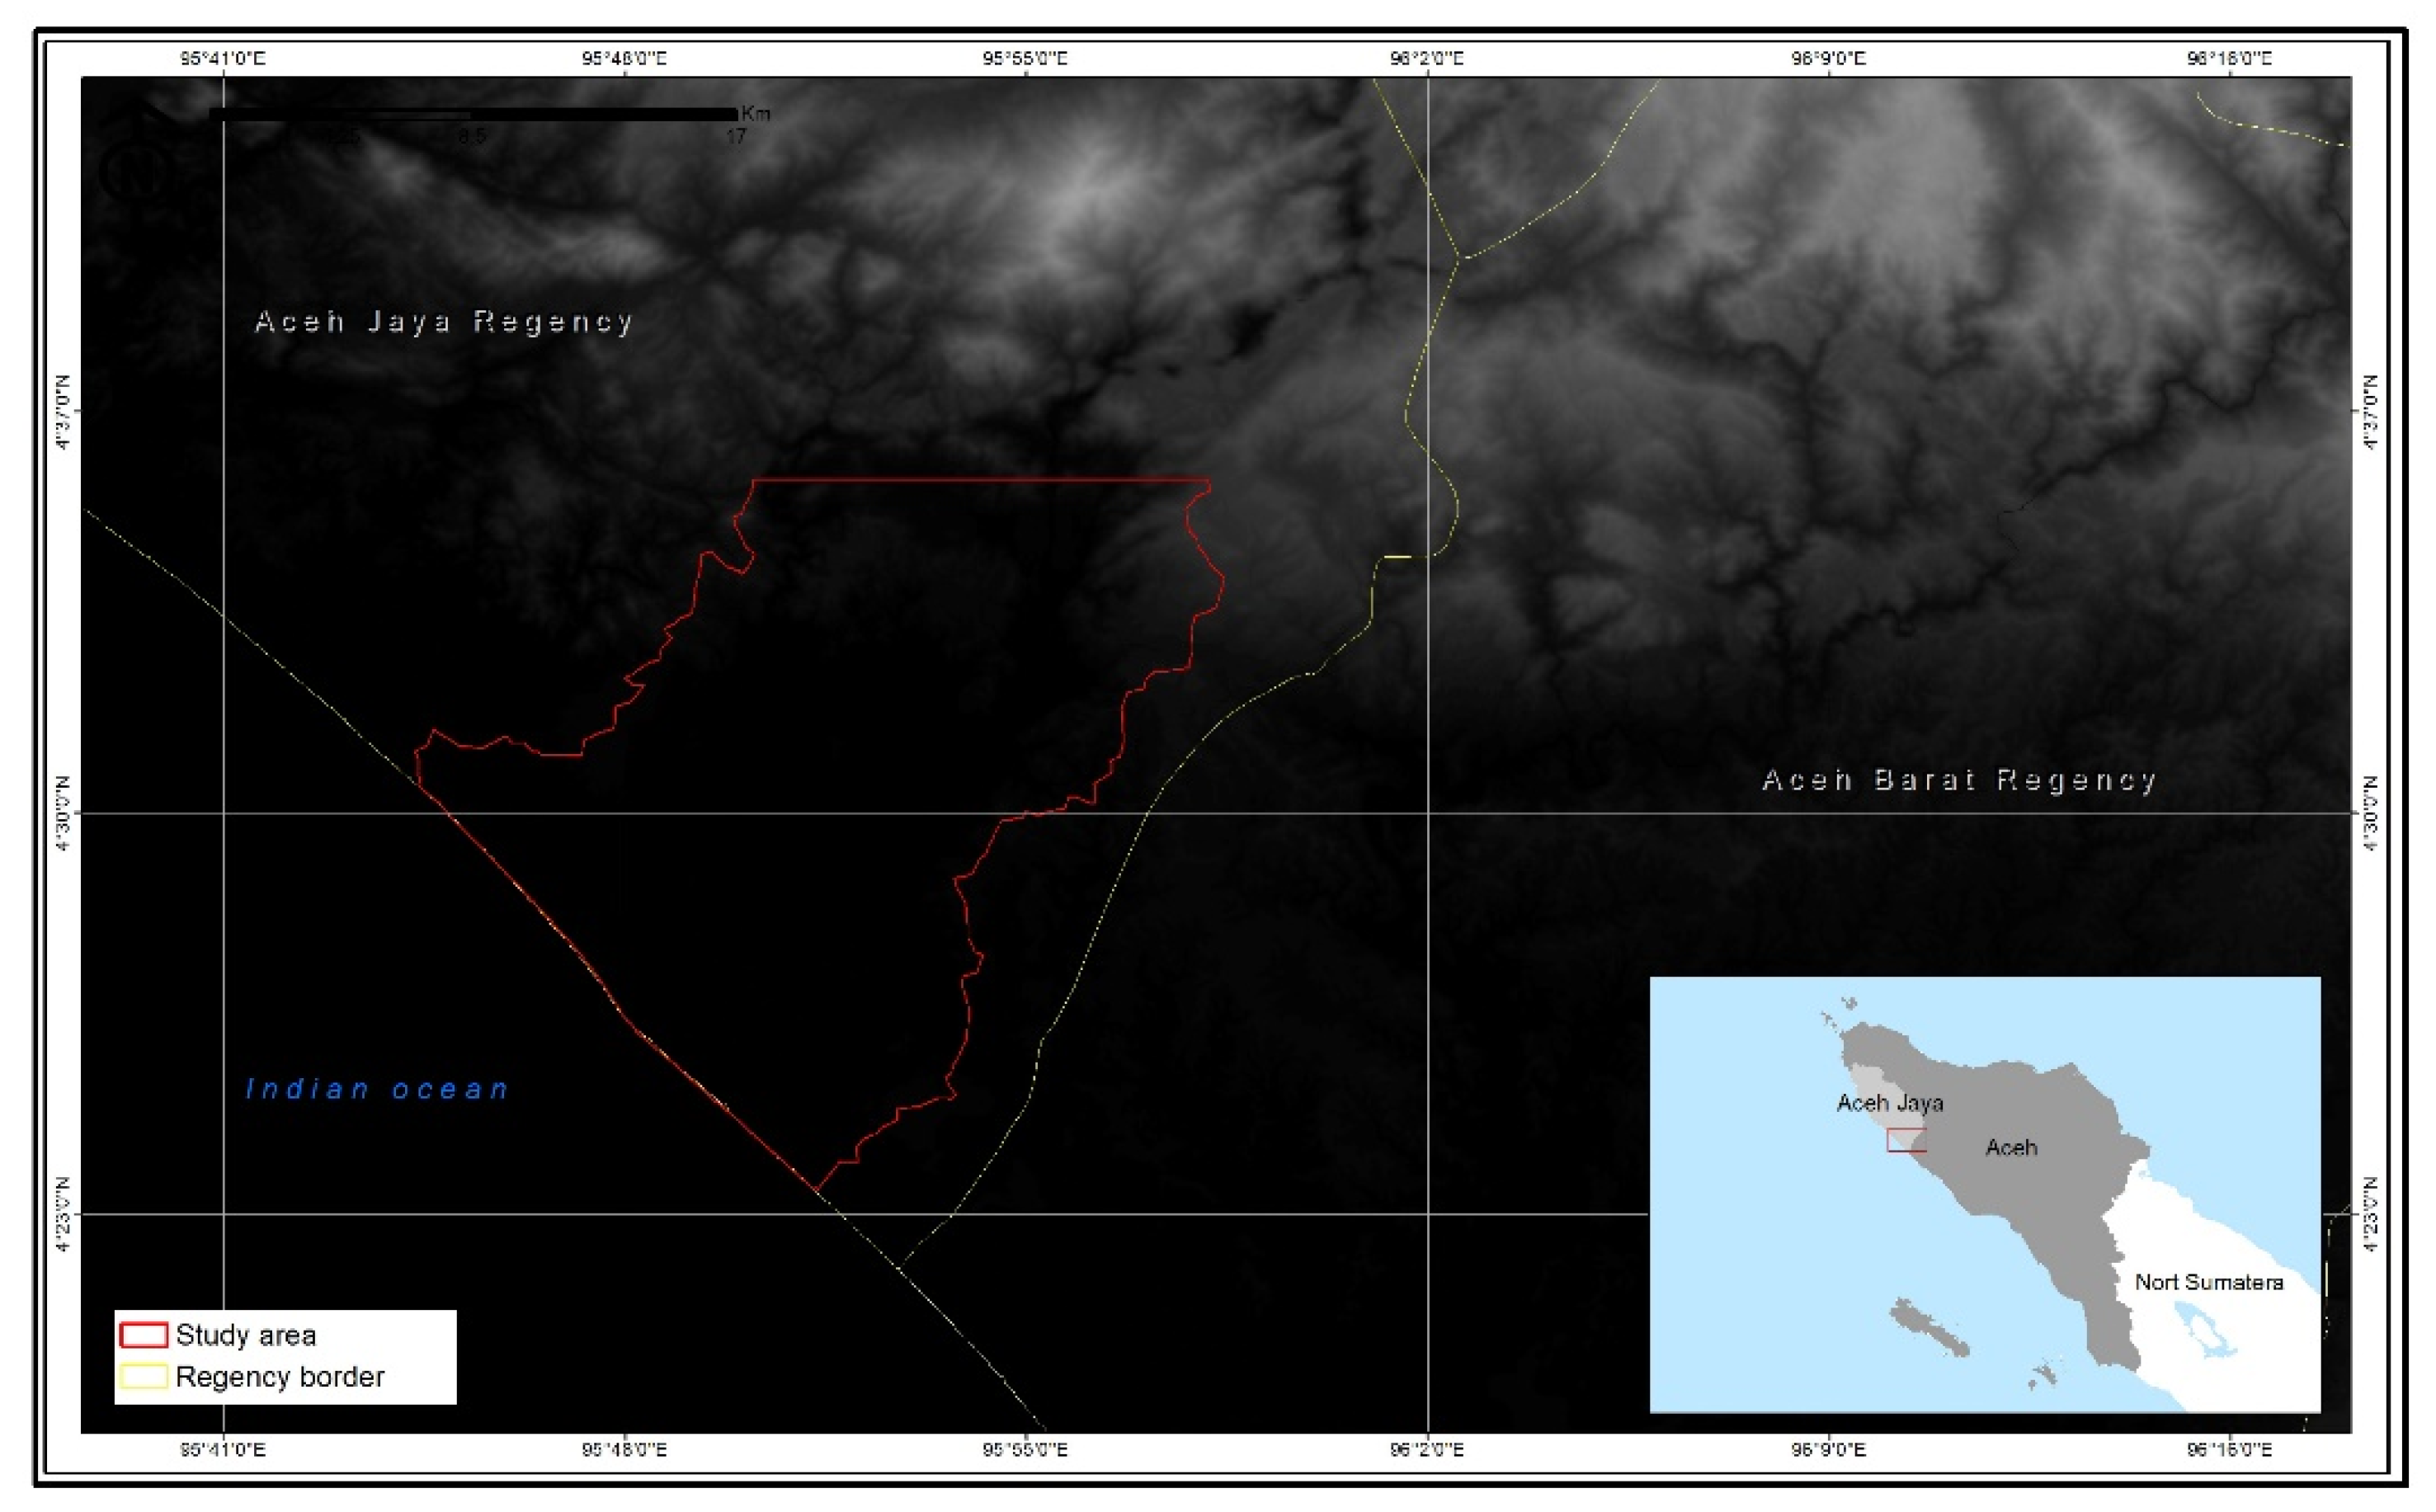
2. Study Area
3. Methods
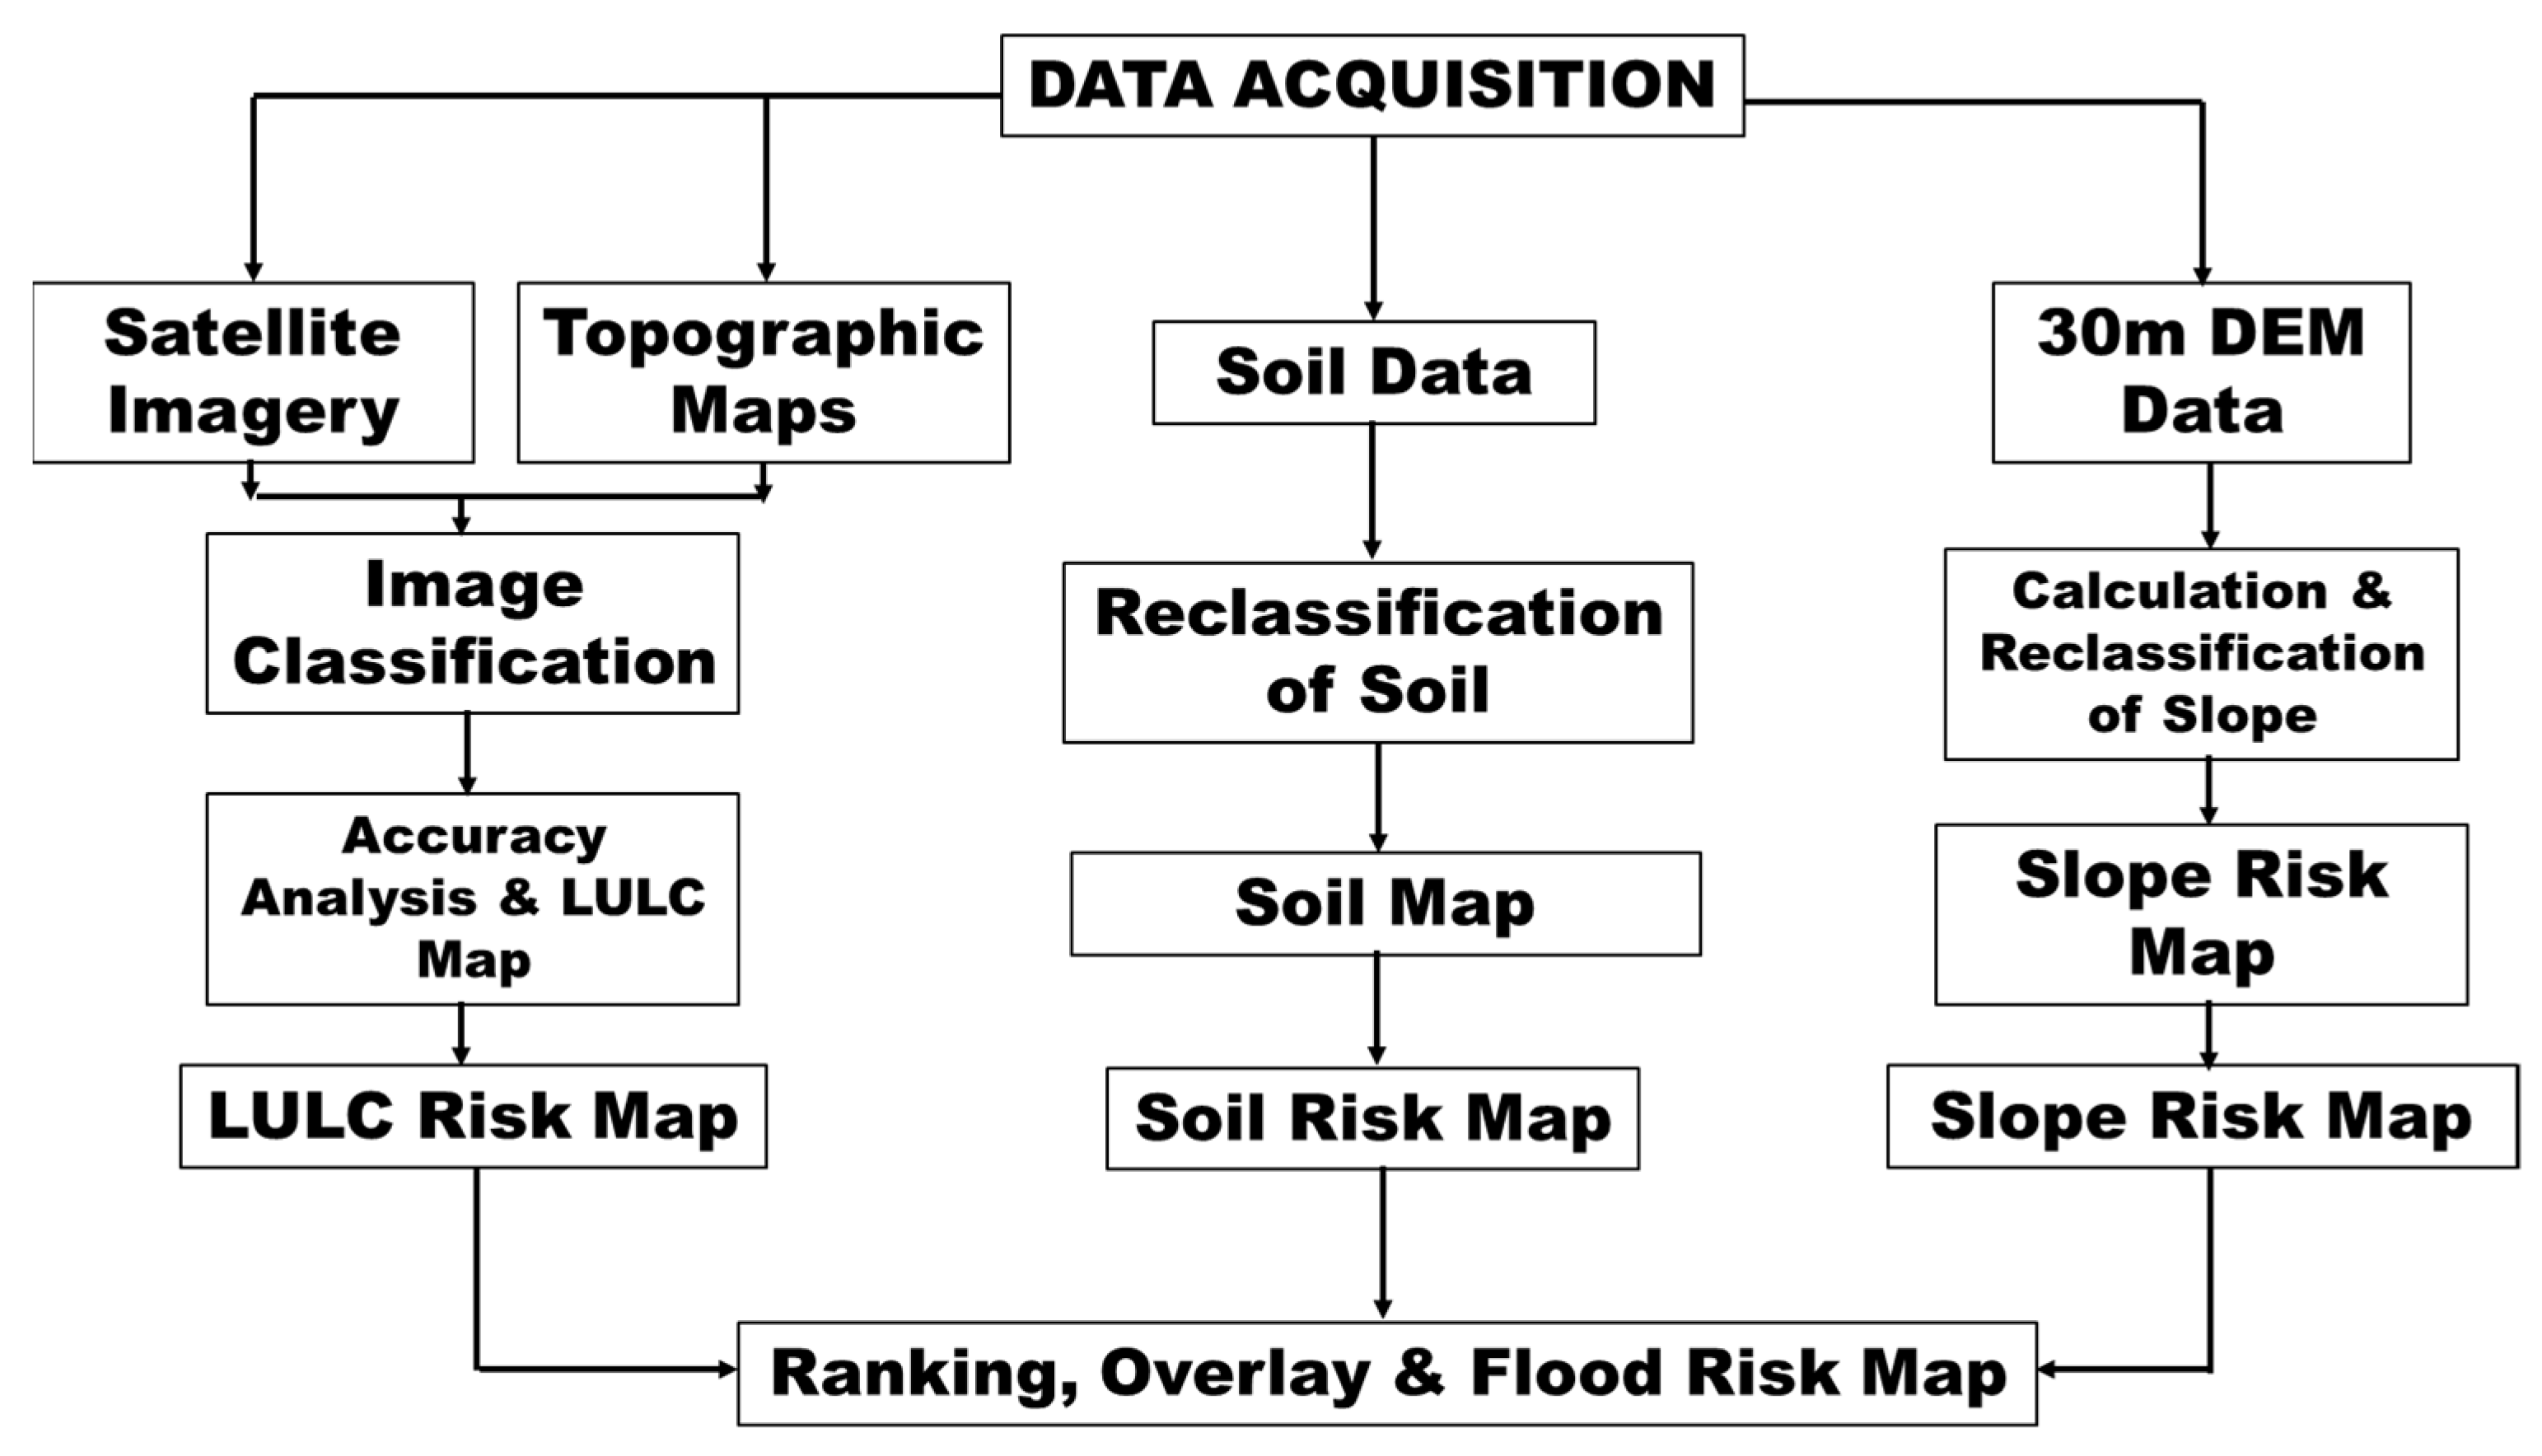
3.1. Research Design
3.2. Data Types, Sources, and Analysis
3.2.1. Data Sampling
3.2.2. Remote Sensing Data
3.2.3. DEM Data
3.2.4. Soil Data
3.2.5. Infiltration Data
3.2.6. Land Use Change
3.3. Creating Flood Risk Map
3.3.1. Flood Risk Zoning Based on LULC
3.3.2. Flood Risk Zoning Based on Soil Type
3.3.3. Flood Risk Zoning Based on Slope
4. Results and Discussion
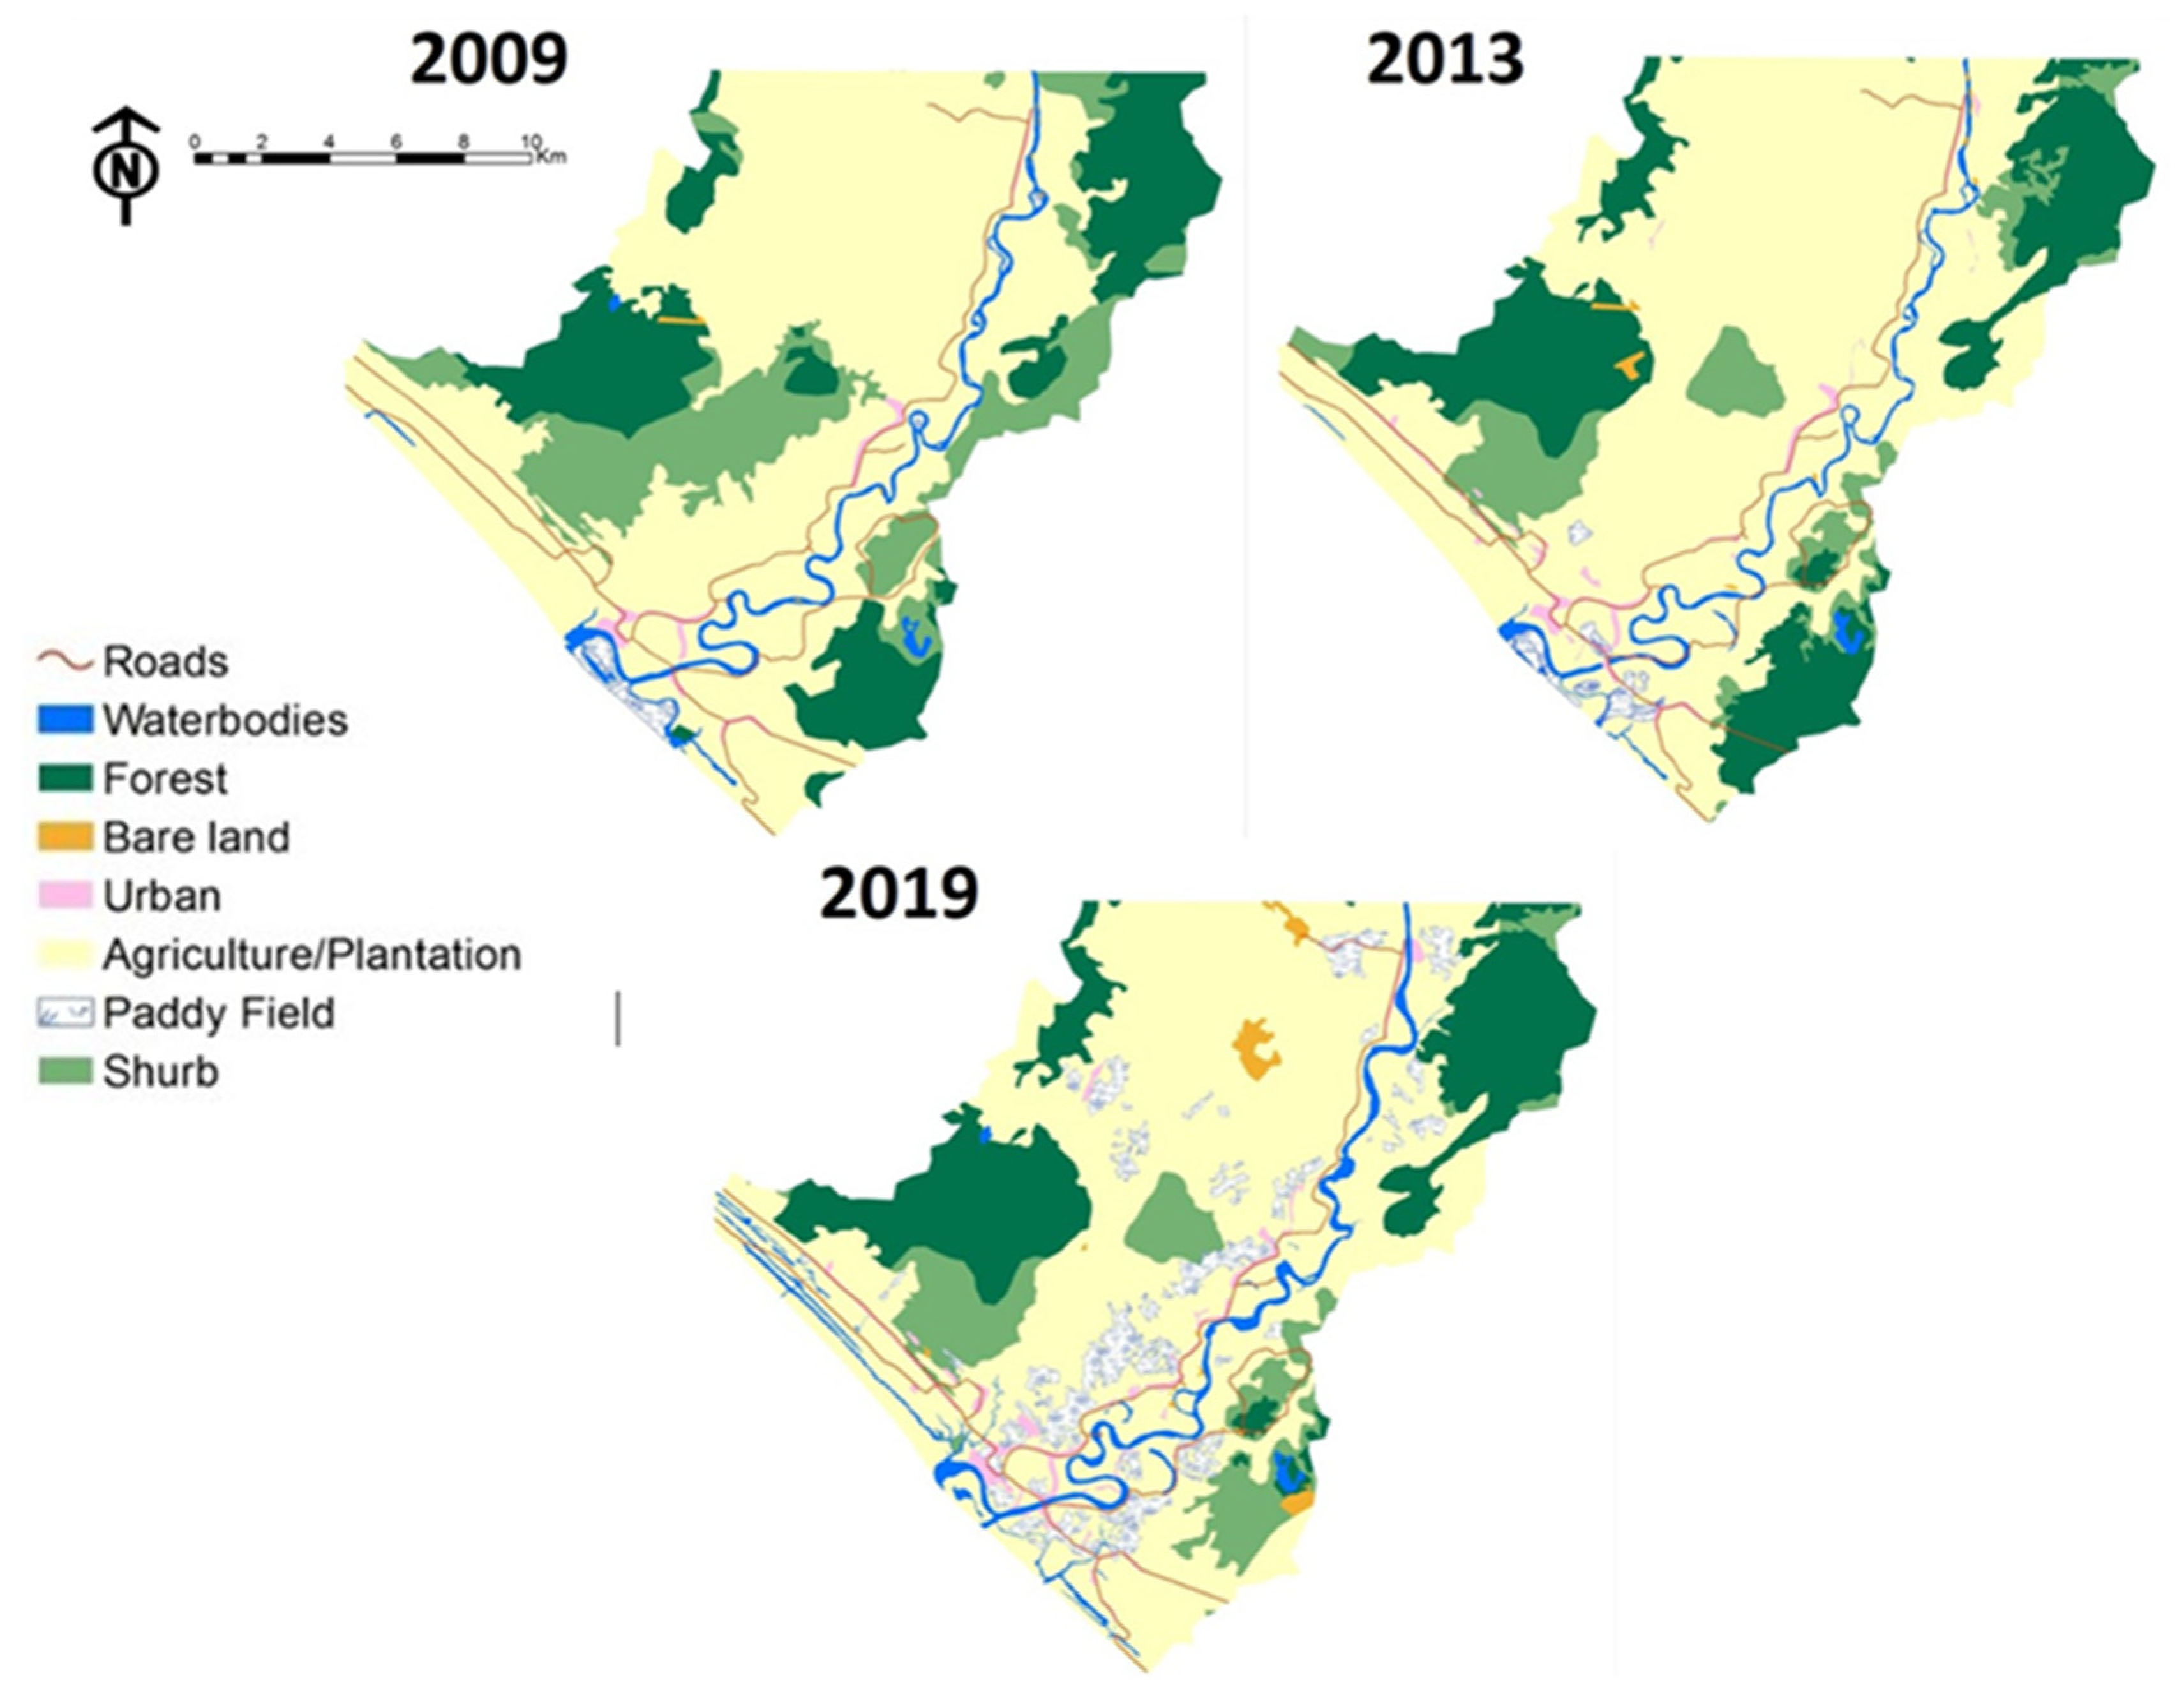
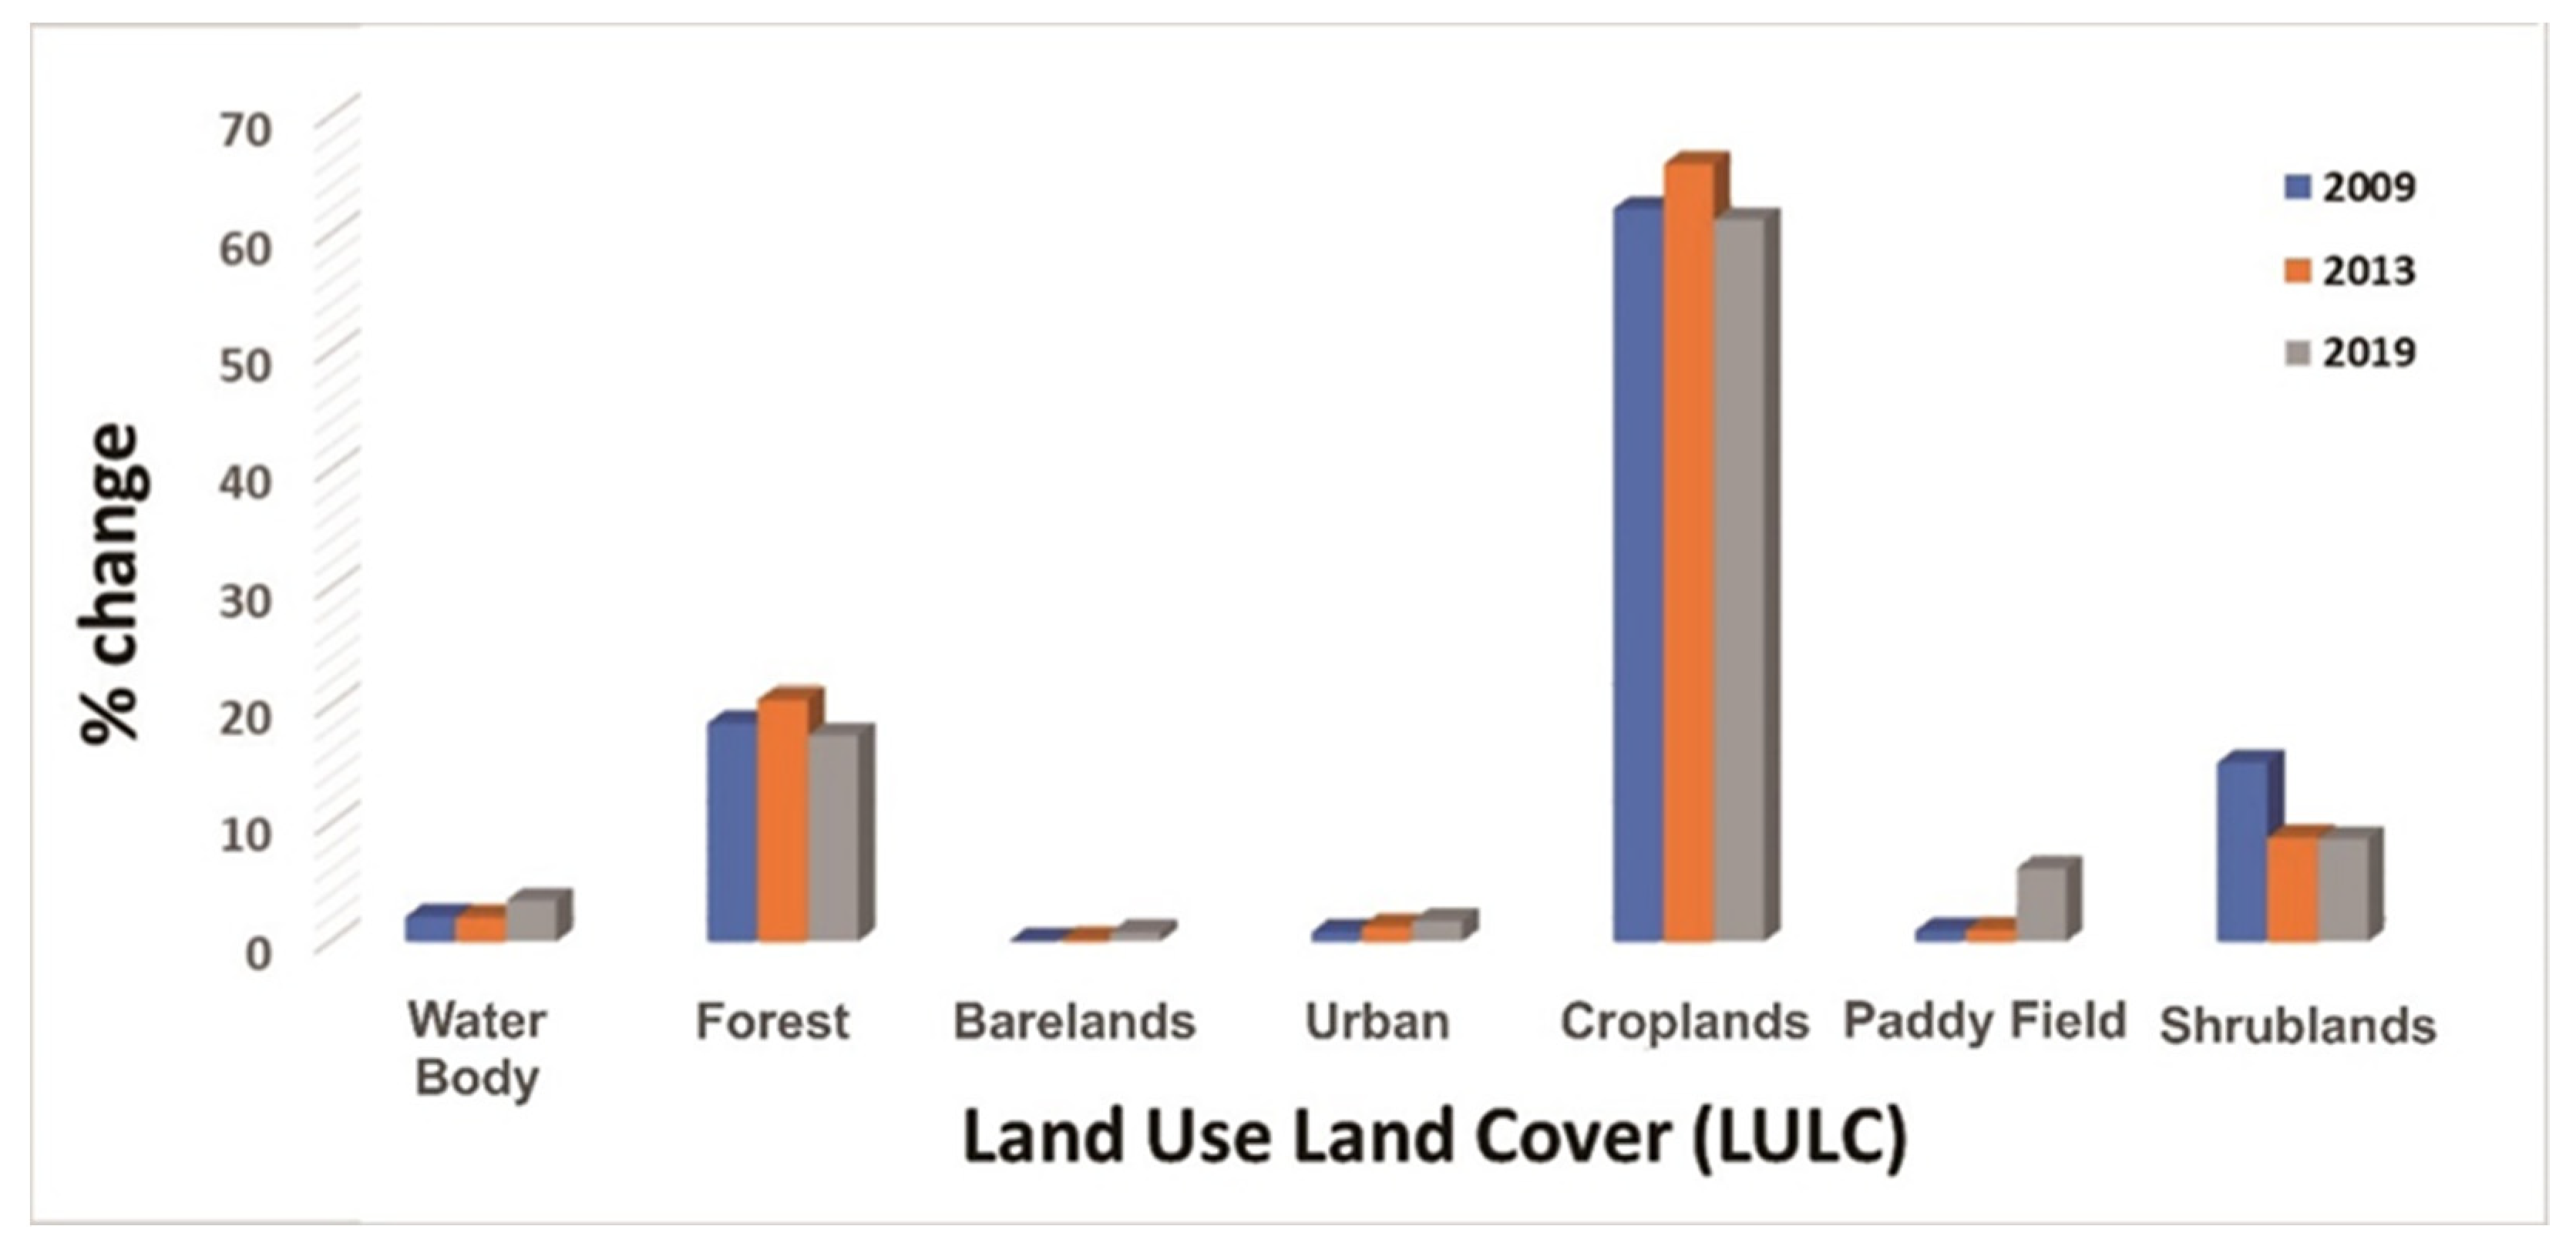
4.1. Spatial and Temporal Land Cover Change
4.2. Impact of LULC on Runoff and Infiltration Capacity
4.3. Flood Risk Zoning
4.3.1. Based on Land Cover Distribution
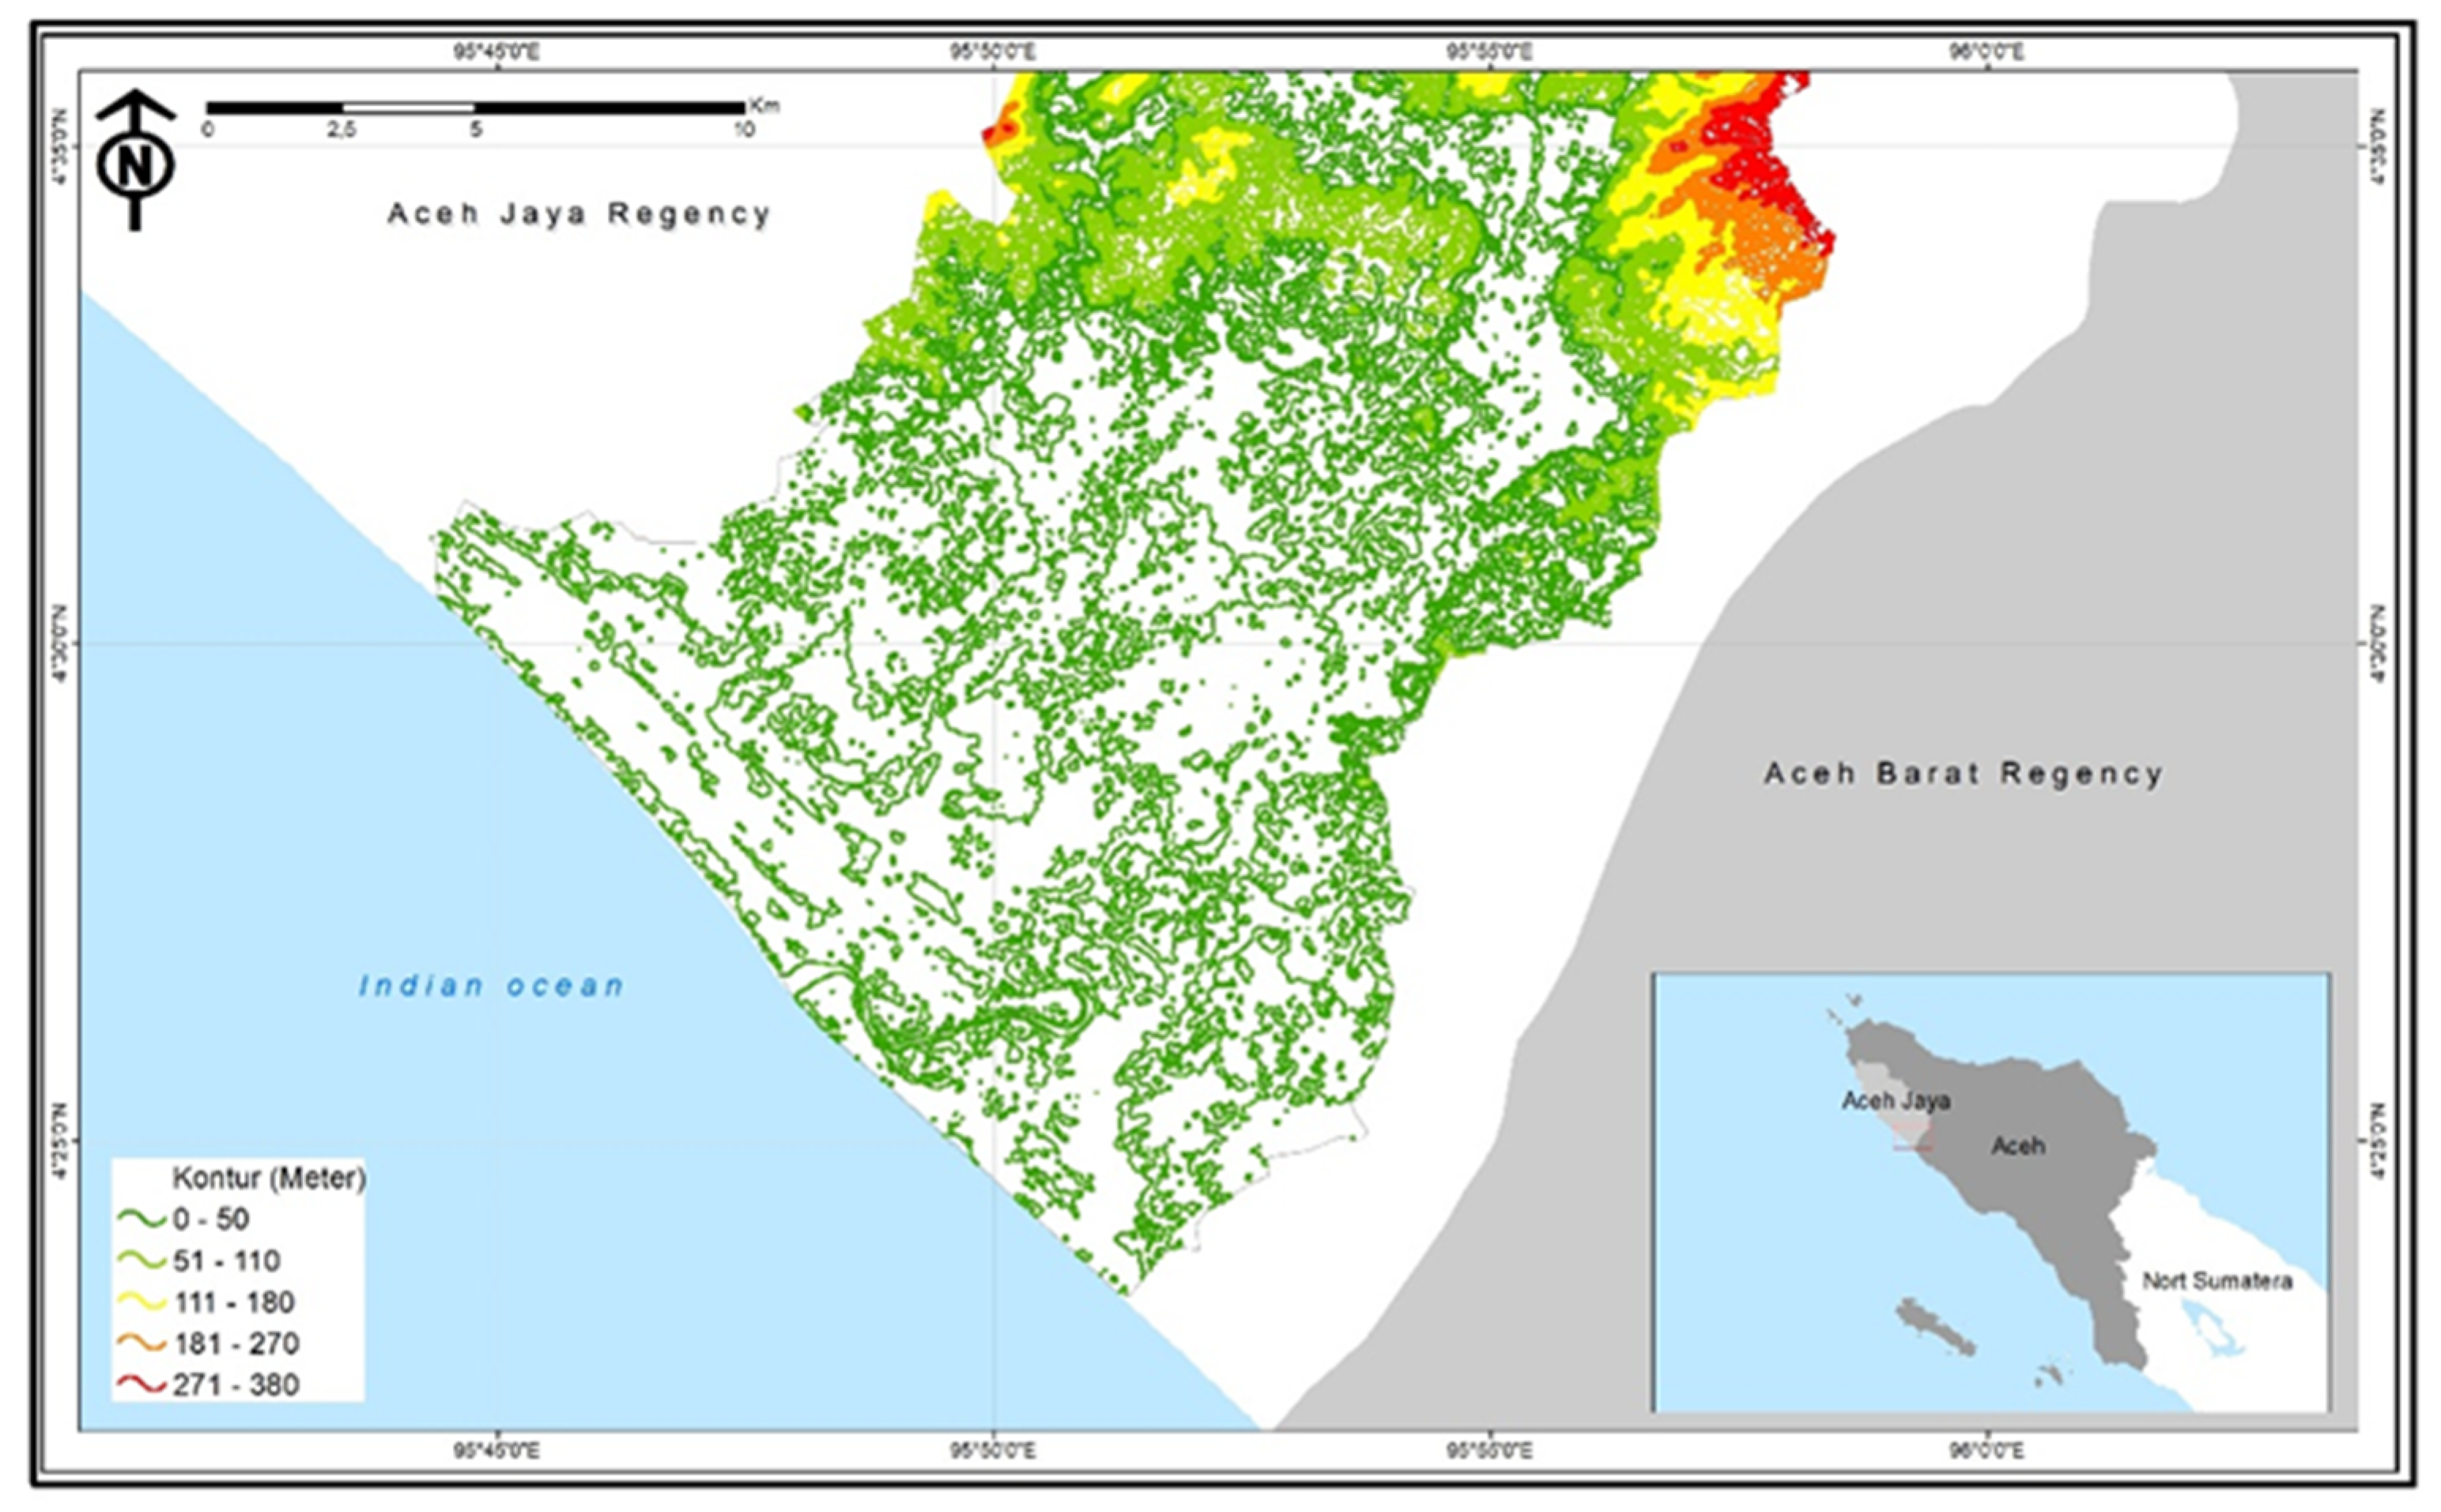
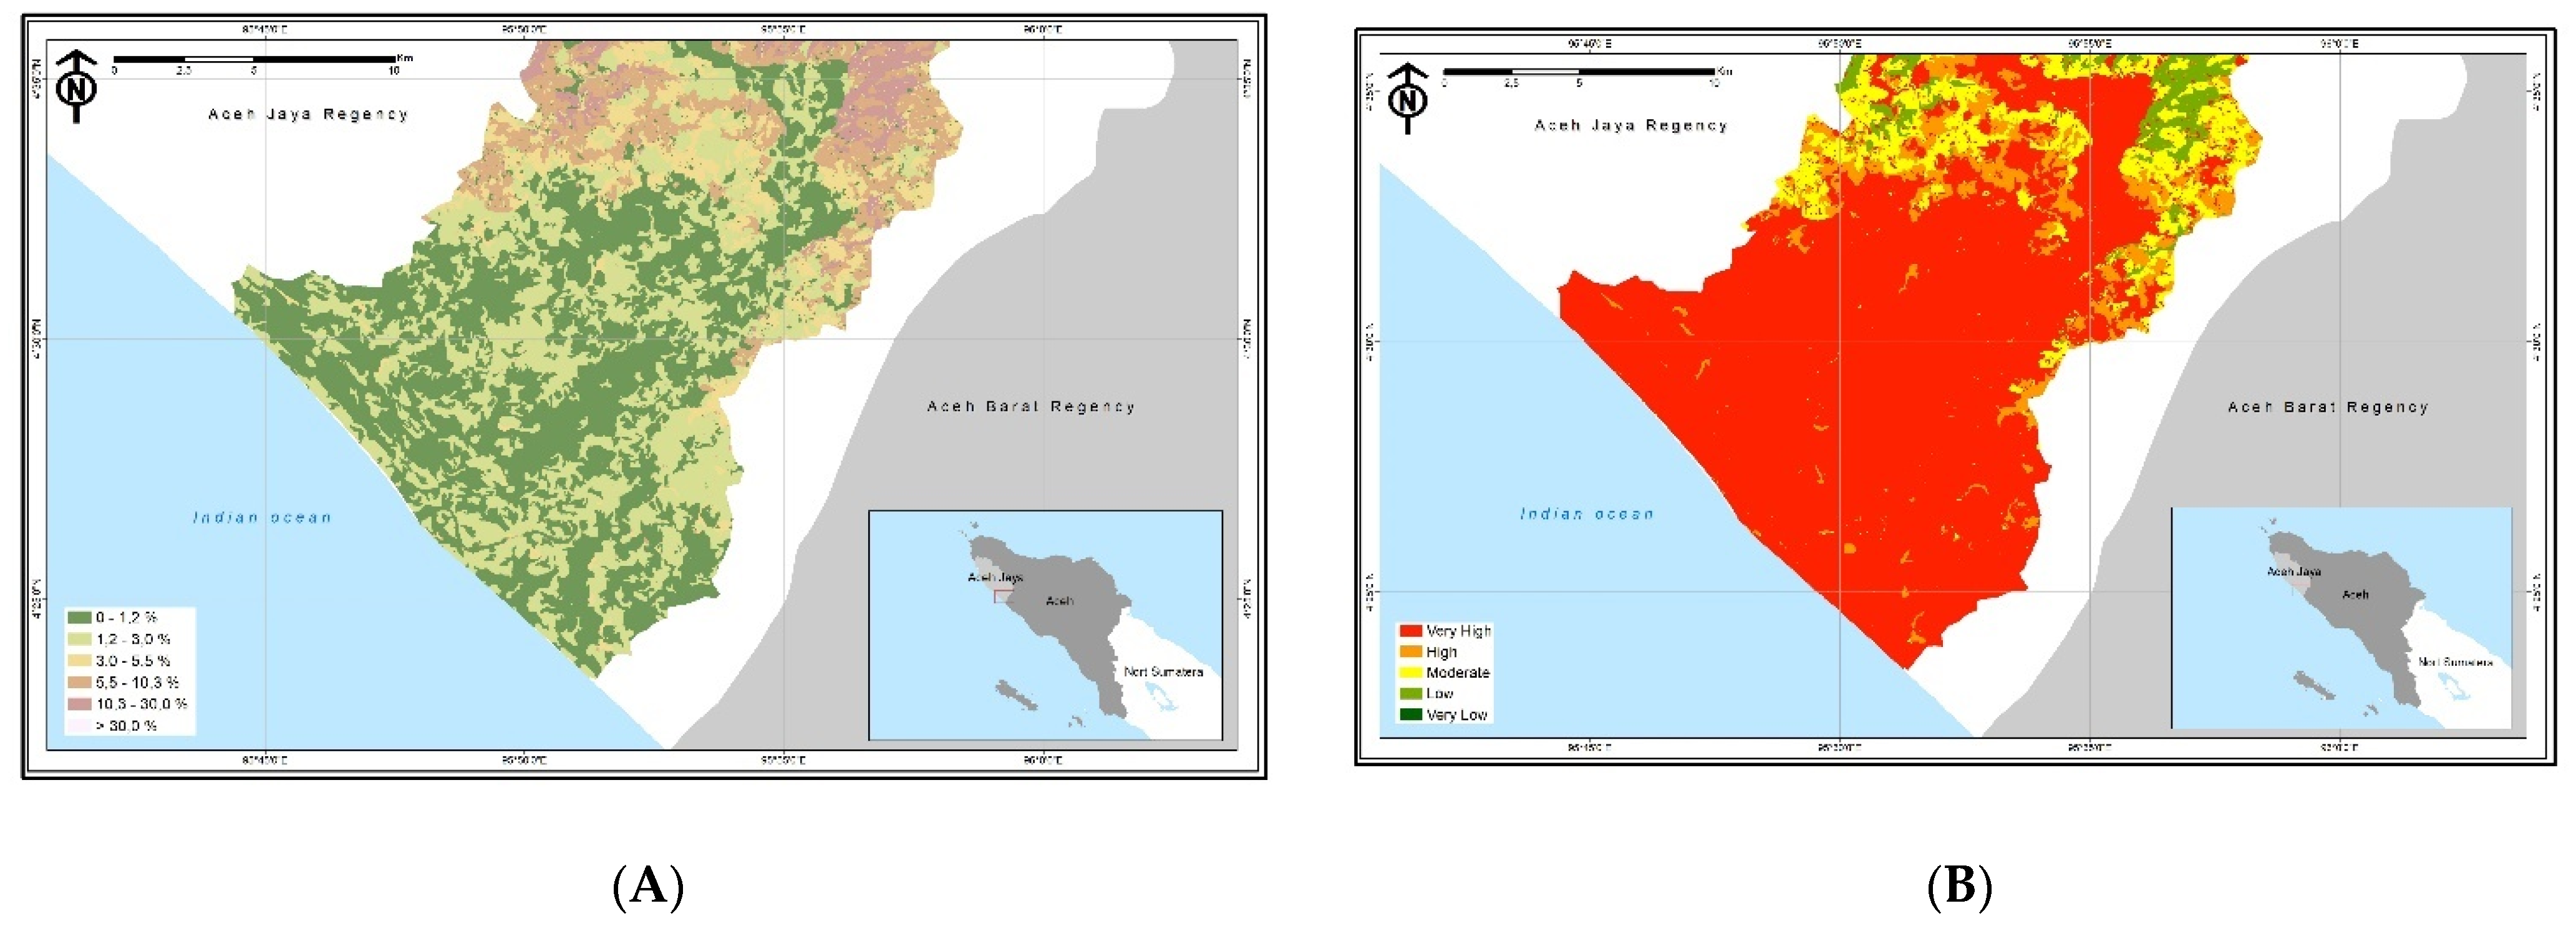
4.3.2. Based on the Distribution of Elevation and Slope
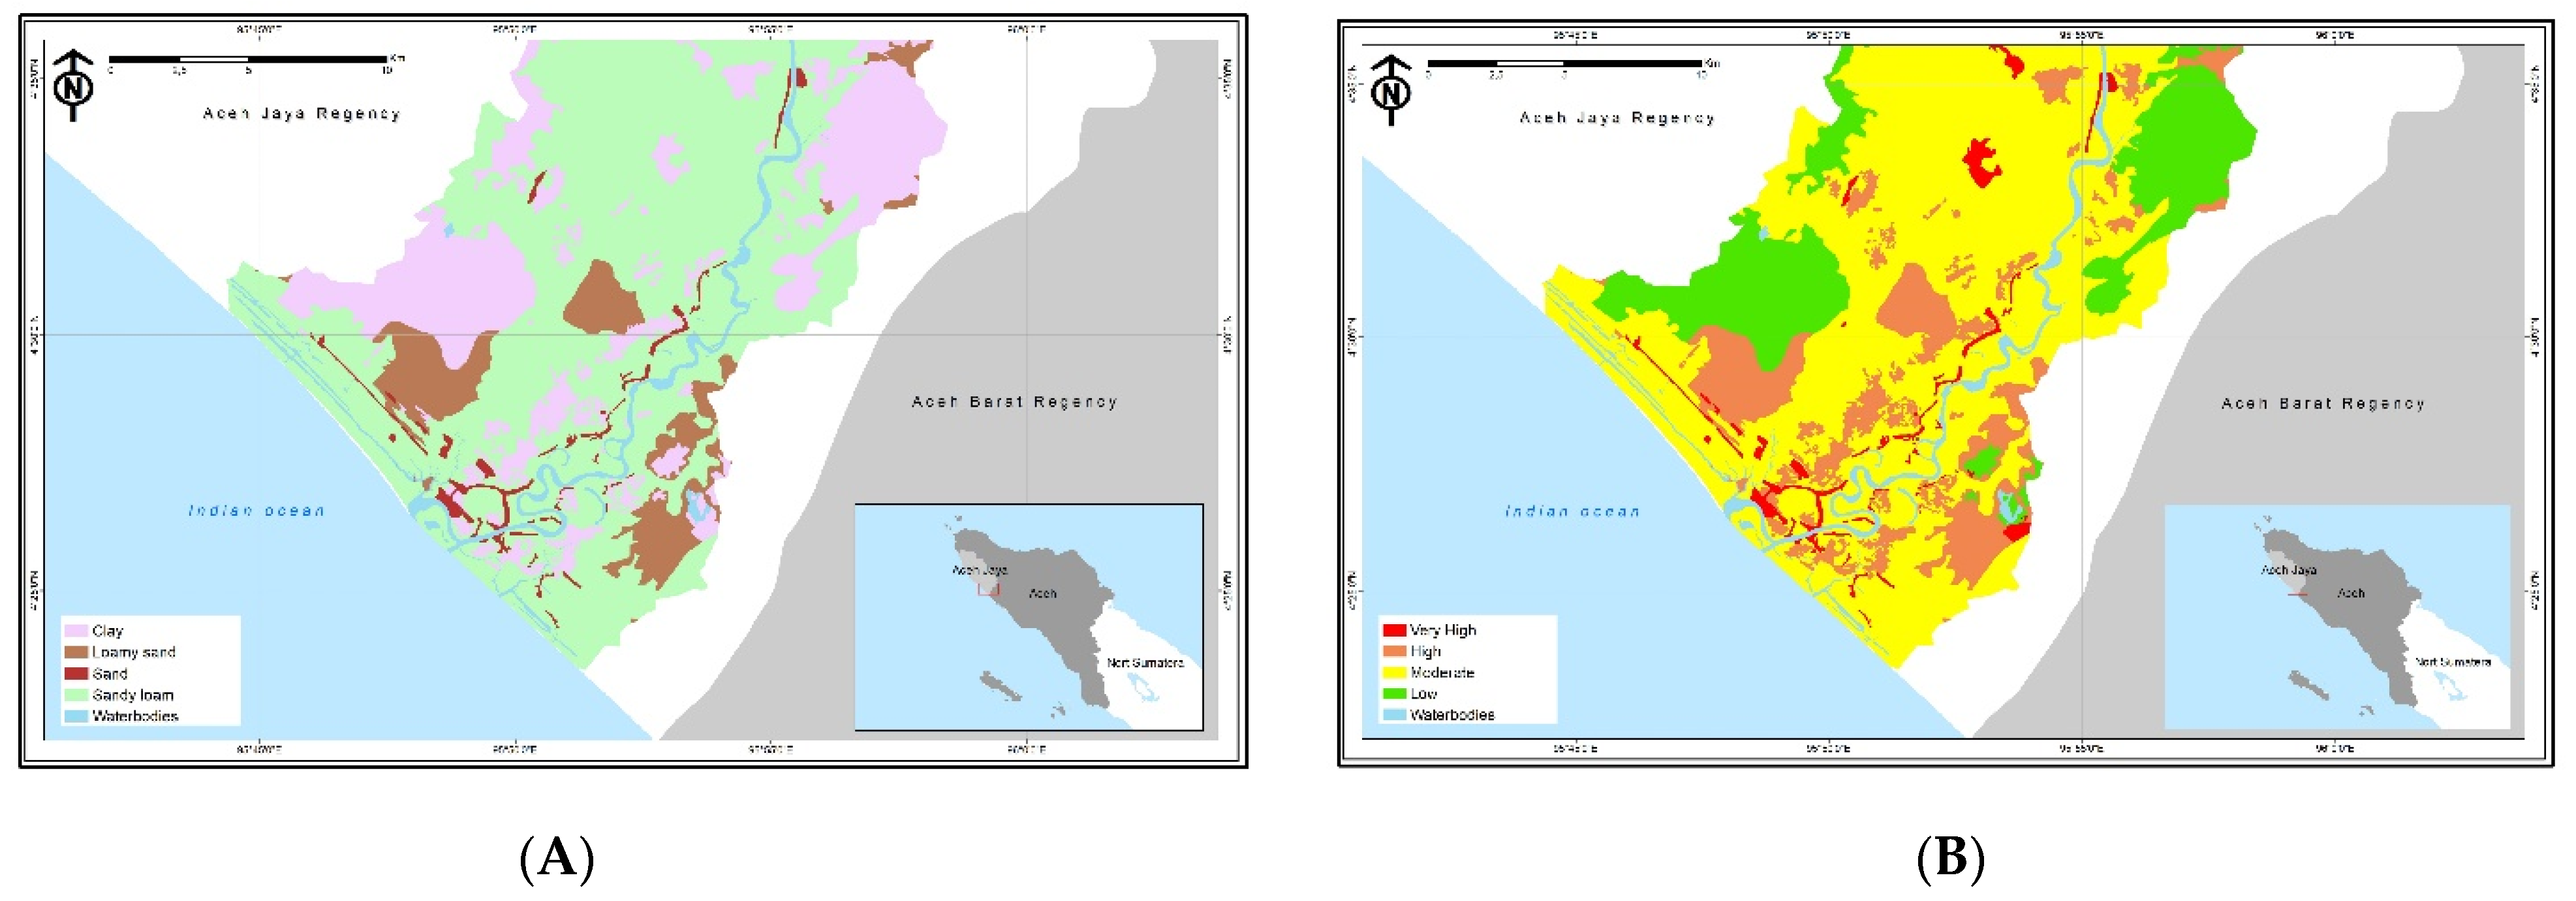
4.3.3. Based on Soil Type Distribution
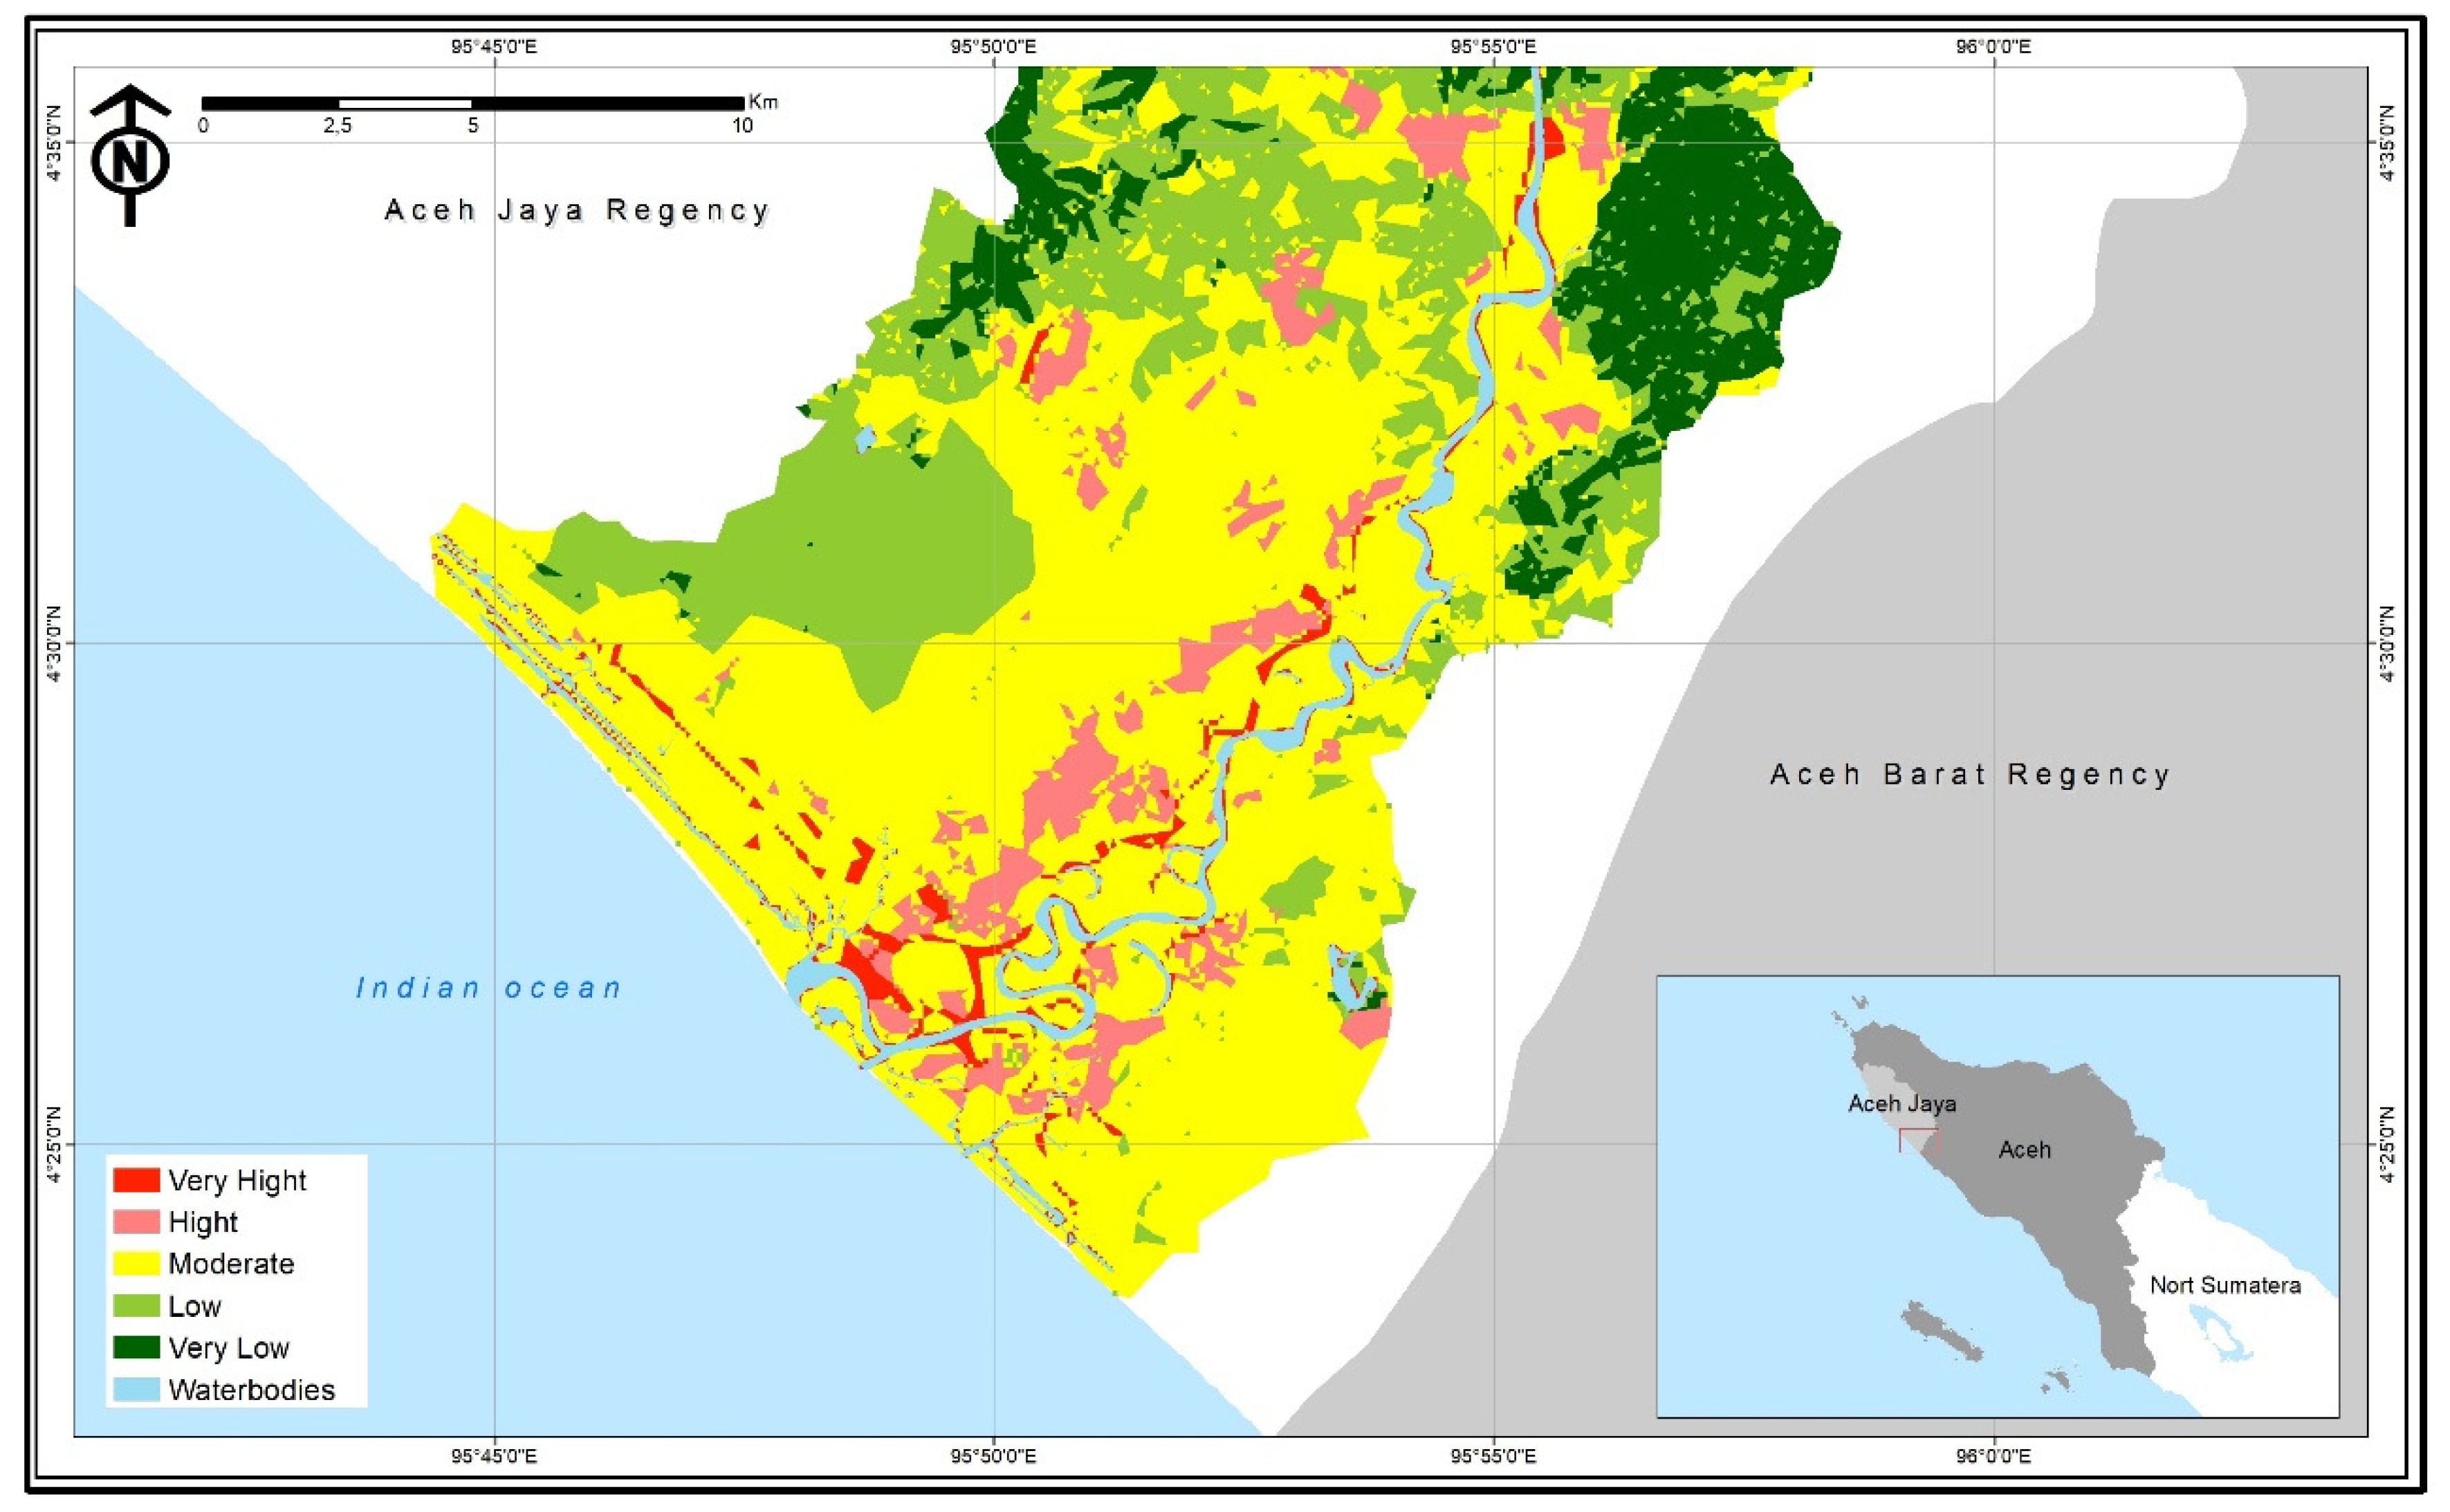
4.4. Flood Risk Map
5. Conclusions
Author Contributions
Funding
Institutional Review Board Statement
Informed Consent Statement
Data Availability Statement
Acknowledgments
Conflicts of Interest
References
- Yenni; Helmi; Hermansah. Hydrologic Characteristics, Flood Occurrence, and Community Preparedness in Coping With Floods at Air Dingin Watershed, Padang, West Sumatra. In Redefining Diversity & Dynamics of Natural Resources Management in Asia; Elsevier: Amsterdam, The Netherlands, 2017; Volume 4, pp. 157–172. [Google Scholar]
- Kadri, T.; Kurniyaningrum, E. Impact of Land Use on Frequency of Floods in Upper Bekasi Watershed, Indonesia. Int. J. Sci. Technol. Res. 2019, 8, 3328–3334. [Google Scholar]
- Narulita, I.; Ningrum, W. Extreme flood event analysis in Indonesia based on rainfall intensity and recharge capacity. IOP Conf. Ser. Earth Environ. Sci. 2018, 118, 012045. [Google Scholar] [CrossRef] [Green Version]
- Wells, J.A.; Wilson, K.A.; Abram, N.K.; Nunn, M.; Gaveau, D.L.A.; Runting, R.K.; Tarniati, N.; Mengersen, K.L.; Meijaard, E. Rising floodwaters: Mapping impacts and perceptions of flooding in Indonesian Borneo. Environ. Res. Lett. 2016, 11, 064016. [Google Scholar] [CrossRef]
- Faradiba, F. The Impact of Climate on Flood Disasters in Indonesia. Int. J. Progress. Sci. Technol. 2022, 31, 364–371. [Google Scholar]
- Lestari, S.; King, A.; Vincent, C.; Karoly, D.; Protat, A. Seasonal dependence of rainfall extremes in and around Jakarta, Indonesia. Weather Clim. Extrem. 2019, 24, 100202. [Google Scholar] [CrossRef]
- Supari, S.; Ettema, J.; Aldrian, E. Spasio Temporal Characteristic of Extreme Rainfall Events over Java Island, Case: East Java Province. Indones. J. Geogr. 2012, 44, 62–86. [Google Scholar] [CrossRef]
- Ambari, L.W. Indonesia Suffers Sixty Floodings in a Decade. Available online: https://bali.antaranews.com/berita/38426/indonesia-suffers-sixty-floodings (accessed on 27 July 2022).
- Bahri, S. Banjir Luapan di Aceh Jaya belum Surut. Available online: https://aceh.tribunnews.com/2016/10/17/banjir-luapan-di-aceh-jaya-belum-surut (accessed on 22 July 2022).
- Irham, M.; Ilhamsyah, Y.; Sugianto; Deli, A.; Syahreza, S. Is flash flood cycle? A preliminary climate study on Teunom fluvial system. IOP Conf. Ser. Earth Environ. Sci. 2019, 273, 012001. [Google Scholar] [CrossRef]
- BPDB, A. Laporan Penanggualangan Banjir Provinsi Aceh; PEMDA Provinsi Aceh: Banda Aceh, Indonesia, 2016. [Google Scholar]
- PEMDA, A.J. Rencana Strategis; PEMDA Aceh Jaya: Calang, Indonesia, 2016. [Google Scholar]
- Irham, M. The Spatial Distribution of Bed Sediment on Fluvial System: A Mini Review of the Aceh Meandering River. Aceh Int. J. Sci. Technol. 2016, 5, 82–87. [Google Scholar] [CrossRef] [Green Version]
- Irham, M.; Irpan, M.; Sartika, D.; Setiya Nugraha, G.; Dharma, D.B. Study of the suitability of rock type with the chemical typology of groundwater in the Jeunib basin, Aceh. Arab. J. Geosci. 2022, 15, 220. [Google Scholar] [CrossRef]
- Griffiths, M.L.; Drysdale, R.N.; Gagan, M.K.; Zhao, J.X.; Ayliffe, L.K.; Hellstrom, J.C.; Hantoro, W.S.; Frisia, S.; Feng, Y.X.; Cartwright, I.; et al. Increasing Australian-Indonesian monsoon rainfall linked to early Holocene sea-level rise. Nat. Geosci. 2009, 2, 636–639. [Google Scholar] [CrossRef]
- Meilianda, E.; Alfian, D.; Nisa, N.; Nurnalisa, F.Z.; Khaira, T.; Yanti, V.; Syahreza, S. Tinjauan Teknis Permasalahan dan Penanggulangan Banjir di Sungai Krueng Teunom Hilir Provinsi Aceh, Menuju Mitigasi Bencana Banjir Terintegrasi. J. Tek. Sipil 2021, 28, 51–62. [Google Scholar] [CrossRef]
- Loc, H.H.; Park, E.; Chitwatkulsiri, D.; Lim, J.; Yun, S.H.; Maneechot, L.; Minh Phuong, D. Local rainfall or river overflow? Re-evaluating the cause of the Great 2011 Thailand flood. J. Hydrol. 2020, 589, 125368. [Google Scholar] [CrossRef]
- Meyers, S.D.; Landry, S.; Beck, M.W.; Luther, M.E. Using logistic regression to model the risk of sewer overflows triggered by compound flooding with application to sea level rise. Urban Clim. 2021, 35, 100752. [Google Scholar] [CrossRef]
- Sholihah, Q.; Kuncoro, W.; Wahyuni, S.; Puni Suwandi, S.; Dwi Feditasari, E. The analysis of the causes of flood disasters and their impacts in the perspective of environmental law. IOP Conf. Ser. Earth Environ. Sci. 2020, 437, 012056. [Google Scholar] [CrossRef]
- Gan, B.R.; Liu, X.N.; Yang, X.G.; Wang, X.K.; Zhoua, J.W. The impact of human activities on the occurrence of mountain flood hazards: Lessons from the 17 August 2015 flash flood/debris flow event in Xuyong County, South-Western China. Geomat. Nat. Hazards Risk 2018, 9, 816–840. [Google Scholar] [CrossRef] [Green Version]
- Vaezi, A.R.; Bahrami, H.A.; Sadeghi, S.H.R.; Mahdian, M.H. Modeling relationship between runoff and soil properties in dry-farming lands, NW Iran. Hydrol. Earth Syst. Sci. Discuss. 2010, 7, 2577–2607. [Google Scholar] [CrossRef] [Green Version]
- Huang, J.; Kang, Q.; Yang, J.X.; Jin, P.W. Multifactor analysis and simulation of the surface runoff and soil infiltration at different slope gradients. IOP Conf. Ser. Earth Environ. Sci. 2017, 82, 012019. [Google Scholar] [CrossRef] [Green Version]
- van Heerwaarden, C.C.; de Arellano, J.V.G. Relative humidity as an indicator for cloud formation over heterogeneous land surfaces. J. Atmos. Sci. 2008, 65, 3263–3277. [Google Scholar] [CrossRef]
- Srivastava, A.; Kumari, N.; Maza, M. Hydrological Response to Agricultural Land Use Heterogeneity Using Variable Infiltration Capacity Model. Water Resour. Manag. 2020, 34, 3779–3794. [Google Scholar] [CrossRef]
- Aghsaei, H.; Mobarghaee Dinan, N.; Moridi, A.; Asadolahi, Z.; Delavar, M.; Fohrer, N.; Wagner, P.D. Effects of dynamic land use/land cover change on water resources and sediment yield in the Anzali wetland catchment, Gilan, Iran. Sci. Total Environ. 2020, 712, 136449. [Google Scholar] [CrossRef]
- Smith, P.; Cotrufo, M.F.; Rumpel, C.; Paustian, K.; Kuikman, P.J.; Elliott, J.A.; McDowell, R.; Griffiths, R.I.; Asakawa, S.; Bustamante, M.; et al. Biogeochemical cycles and biodiversity as key drivers of ecosystem services provided by soils. Soil 2015, 1, 665–685. [Google Scholar] [CrossRef] [Green Version]
- Zeiger, S.J.; Hubbart, J.A. Quantifying land use influences on event-based flow frequency, timing, magnitude, and rate of change in an urbanizing watershed of the central USA. Environ. Earth Sci. 2018, 77, 107. [Google Scholar] [CrossRef]
- Maskrey, S.; Mount, A.; Nick, J.; Thorne, C.T. Doing flood risk modelling differently: Evaluating the potential for participatory techniques to broaden flood risk management decision-making. Flood Risk Manag. 2022, 15, e12757. [Google Scholar] [CrossRef]
- Ganaie, T.A.; Jamal, S.; Ahmad, W.S. Changing land use/land cover patterns and growing human population in Wular catchment of Kashmir Valley, India. GeoJournal 2021, 86, 1589–1606. [Google Scholar] [CrossRef]
- Rimba, A.B.; Mohan, G.; Chapagain, S.K.; Arumansawang, A.; Payus, C.; Fukushi, K.; Husnayaen; Osawa, T.; Avtar, R. Impact of population growth and land use and land cover (LULC) changes on water quality in tourism-dependent economies using a geographically weighted regression approach. Environ. Sci. Pollut. Res. 2021, 28, 25920–25938. [Google Scholar] [CrossRef]
- Danandeh Mehr, A.; Akdegirmen, O. Estimation of Urban Imperviousness and its Impacts on Flashfloods in Gazipaşa, Turkey. Knowl. Based Eng. Sci. 2021, 2, 9–17. [Google Scholar] [CrossRef]
- Das, P.; Behera, M.D.; Patidar, N.; Sahoo, B.; Tripathi, P.; Behera, P.R.; Srivastava, S.K.; Roy, P.S.; Thakur, P.; Agrawal, S.P.; et al. Impact of LULC change on the runoff, base flow and evapotranspiration dynamics in eastern Indian river basins during 1985–2005 using variable infiltration capacity approach. J. Earth Syst. Sci. 2018, 127, 19. [Google Scholar] [CrossRef] [Green Version]
- da Costa Silva, J.F.C.B.; da Silva, R.M.; Santos, C.A.G.; Silva, A.M.; Vianna, P.C.G. Analysis of the response of the Epitácio Pessoa reservoir (Brazilian semiarid region) to potential future drought, water transfer and LULC scenarios. Nat. Hazards 2021, 108, 1347–1371. [Google Scholar] [CrossRef]
- Li, X.; Zhang, Y.; Ma, N.; Li, C.; Luan, J. Contrasting effects of climate and LULC change on blue water resources at varying temporal and spatial scales. Sci. Total Environ. 2021, 786, 147488. [Google Scholar] [CrossRef]
- Sahoo, S.; Dhar, A.; Debsarkar, A.; Kar, A. Impact of water demand on hydrological regime under climate and LULC change scenarios. Environ. Earth Sci. 2018, 77, 341. [Google Scholar] [CrossRef]
- Nahib, I.; Ambarwulan, W.; Rahadiati, A.; Munajati, S.L.; Prihanto, Y.; Suryanta, J.; Turmudi, T.; Nuswantoro, A.C. Assessment of the Impacts of Climate and LULC Changes on the Water Yield in the Citarum River Basin, West Java Province, Indonesia. Sustainability 2021, 13, 3919. [Google Scholar] [CrossRef]
- Abdullah, H.M.; Islam, I.; Miah, M.G.; Ahmed, Z. Quantifying the spatiotemporal patterns of forest degradation in a fragmented, rapidly urbanizing landscape: A case study of Gazipur, Bangladesh. Remote Sens. Appl. Soc. Environ. 2019, 13, 457–465. [Google Scholar] [CrossRef]
- Cazzolla Gatti, R.; Liang, J.; Velichevskaya, A.; Zhou, M. Sustainable palm oil may not be so sustainable. Sci. Total Environ. 2019, 652, 48–51. [Google Scholar] [CrossRef]
- Kim, S.; Sohn, H.-G.; Kim, M.-K.; Lee, H. Analysis of the Relationship among Flood Severity, Precipitation, and Deforestation in the Tonle Sap Lake Area, Cambodia Using Multi-Sensor Approach. KSCE J. Civ. Eng. 2019, 23, 1330–1340. [Google Scholar] [CrossRef]
- Hu, Q.; Xiang, M.; Chen, D.; Zhou, J.; Wu, W.; Song, Q. Global cropland intensification surpassed expansion between 2000 and 2010: A spatio-temporal analysis based on GlobeLand30. Sci. Total Environ. 2020, 746, 141035. [Google Scholar] [CrossRef]
- Oda, T.; Egusa, T.; Ohte, N.; Hotta, N.; Tanaka, N.; Green, M.B.; Suzuki, M. Effects of changes in canopy interception on stream runoff response and recovery following clear-cutting of a Japanese coniferous forest in Fukuroyamasawa Experimental Watershed in Japan. Hydrol. Process. 2021, 35, e14177. [Google Scholar] [CrossRef]
- Naikoo, M.W.; Rihan, M.; Ishtiaque, M. Shahfahad Analyses of land use land cover (LULC) change and built-up expansion in the suburb of a metropolitan city: Spatio-temporal analysis of Delhi NCR using landsat datasets. J. Urban Manag. 2020, 9, 347–359. [Google Scholar] [CrossRef]
- Nithila Devi, N.; Sridharan, B.; Kuiry, S.N. Impact of urban sprawl on future flooding in Chennai city, India. J. Hydrol. 2019, 574, 486–496. [Google Scholar] [CrossRef]
- Astuti, I.S.; Sahoo, K.; Milewski, A.; Mishra, D.R. Impact of Land Use Land Cover (LULC) Change on Surface Runoff in an Increasingly Urbanized Tropical Watershed. Water Resour. Manag. 2019, 33, 4087–4103. [Google Scholar] [CrossRef]
- Lacher, I.L.; Ahmadisharaf, E.; Fergus, C.; Akre, T.; Mcshea, W.J.; Benham, B.L.; Kline, K.S. Scale-dependent impacts of urban and agricultural land use on nutrients, sediment, and runoff. Sci. Total Environ. 2019, 652, 611–622. [Google Scholar] [CrossRef]
- Alayani, R.; Sugianto, S.; Basri, H. Flood Rate Assessment of the Woyla River Watershed, Aceh Province, Indonesia. Aceh Int. J. Sci. Technol. 2021, 10, 84–99. [Google Scholar] [CrossRef]
- Barredo, J.I.; Engelen, G. Land use scenario modeling for flood risk mitigation. Sustainability 2010, 2, 1327–1344. [Google Scholar] [CrossRef] [Green Version]
- Hua, A.K. Land Use Land Cover Changes in Detection of Water Quality: A Study Based on Remote Sensing and Multivariate Statistics. J. Environ. Public Health 2017, 2017, 7515130. [Google Scholar] [CrossRef] [PubMed] [Green Version]
- Rawat, J.S.; Kumar, M. Monitoring land use/cover change using remote sensing and GIS techniques: A case study of Hawalbagh block, district Almora, Uttarakhand, India. Egypt. J. Remote Sens. Space Sci. 2015, 18, 77–84. [Google Scholar] [CrossRef] [Green Version]
- Liping, C.; Yujun, S.; Saeed, S. Monitoring and predicting land use and land cover changes using remote sensing and GIS techniques—A case study of a hilly area, Jiangle, China. PLoS ONE 2018, 13, e0200493. [Google Scholar] [CrossRef]
- Antonio, P.; Carandang, L.A.B.; Dolom, P.C.; Garcia, L.N.; Magdalena, M.; Villanueva, B.; Espiritu, N.O. Analysis of Key Drivers of Deforestation and Forest Degradation in the Philippines; Deutsche Gesellschaft für Internationale Zusammenarbeit (GIZ) GmbH: Manila, Philipine, 2013. [Google Scholar]
- Boardman, J.; Vandaele, K.; Evans, R.; Foster, I.D.L. Off-site impacts of soil erosion and runoff: Why connectivity is more important than erosion rates. Soil Use Manag. 2019, 35, 245–256. [Google Scholar] [CrossRef] [Green Version]
- Chalise, D.; Kumar, L.; Kristiansen, P. Land Degradation by Soil Erosion in Nepal: A Review. Soil Syst. 2019, 3, 12. [Google Scholar] [CrossRef] [Green Version]
- Dalanhol, I.; Tabalipa, N.L.; Meireles Silva, F.C. Future Land-use and Land-cover Scenarios for Mapping Flood-prone Areas in Pato Branco City, Brazil. KnE Eng. 2020, 18, 333–341. [Google Scholar] [CrossRef]
- Gadeng, A.N.; Ramli, R.; Maulidian, M.O.R.; Aksa, F.I.; Rohmat, D.; Desfandi, M. Kajian Tipologi dan Pemanfaatan Sumber Daya Air di Provinsi Aceh. J. Ilmu Lingkung. 2020, 18, 333–341. [Google Scholar] [CrossRef]
- Badan Metereologi, Klimatologi dan Geofisika. Available online: https://www.bmkg.go.id/cuaca/prakiraan-cuaca.bmkg?Kec=Teunom&kab=Kab._Aceh_Jaya&Prov=Aceh&AreaID=5012629 (accessed on 10 March 2022).
- Badan Pusat Staistik. Aceh Jaya dalam Angka; Badan Pusat Staistik: Calang, Indonesia, 2021. [Google Scholar]
- USGS. Available online: https://www.usgs.gov/ (accessed on 20 April 2022).
- Badan Informasi Geospatial. Available online: https://www.big.go.id/ (accessed on 20 April 2022).
- BIG DEMNAS. Available online: https://tanahair.indonesia.go.id/demnas/#/ (accessed on 28 June 2022).
- Barber, A.J. The origin of the Woyla Terranes in Sumatra and the late Mesozoic evolution of the Sundaland margin. J. Asian Earth Sci. 2000, 18, 713–738. [Google Scholar] [CrossRef]
- Saxon, E.; Sheppard, S. Land Systems of Indonesia and New Guinea. Available online: https://databasin.org/datasets/eb74fe29b6fb49d0a6831498b0121c99/ (accessed on 27 July 2022).
- Boeno, D.; Gubiani, P.I.; Lier, Q.; Van, J.; Mulazzani, R.P. Estimating lateral flow in double ring infiltrometer measurements. Rev. Bras. Ciência Do Solo 2021, 45, e0210027. [Google Scholar] [CrossRef]
- Horton, R.E. An Approach Toward a Physical Interpretation of Infiltration-Capacity. Soil Sci. Soc. Am. J. 1941, 5, 399–417. [Google Scholar] [CrossRef]
- de Oliveira, C.P.; de Lima, R.B.; Alves Junior, F.T.; de Lima Pessoa, M.M.; da Silva, A.F.; dos Santos, N.A.T.; Lopes, I.J.C.; de Melo, C.L.S.-M.S.; Silva, E.A.; da Silva, J.A.A.; et al. Dynamic Modeling of Land Use and Coverage Changes in the Dryland Pernambuco, Brazil. Land 2022, 11, 998. [Google Scholar]
- Ahmad, F.; Goparaju, L.; Qayum, A. LULC analysis of urban spaces using Markov chain predictive model at Ranchi in India. Spat. Inf. Res. 2017, 25, 351–359. [Google Scholar] [CrossRef]
- Marques, A.; Martins, I.S.; Kastner, T.; Plutzar, C.; Theurl, M.C.; Eisenmenger, N.; Huijbregts, M.A.J.; Wood, R.; Stadler, K.; Bruckner, M.; et al. Increasing impacts of land use on biodiversity and carbon sequestration driven by population and economic growth. Nat. Ecol. Evol. 2019, 3, 628–637. [Google Scholar] [CrossRef]
- Li, Y.; Wu, W.; Liu, Y. Land consolidation for rural sustainability in China: Practical reflections and policy implications. Land Use Policy 2018, 74, 137–141. [Google Scholar] [CrossRef]
- Ashaolu, E.D.; Olorunfemi, J.F.; Ifabiyi, I.P. Assessing the Spatio-Temporal Pattern of Land Use and Land Cover Changes in Osun Drainage Basin, Nigeria. J. Environ. Geogr. 2019, 12, 41–50. [Google Scholar] [CrossRef] [Green Version]
- Msofe, N.K.; Sheng, L.; Lyimo, J. Land use change trends and their driving forces in the Kilombero Valley Floodplain, Southeastern Tanzania. Sustainability 2019, 11, 505. [Google Scholar] [CrossRef] [Green Version]
- Veraart, A.J.; Dimitrov, M.R.; Schrier-Uijl, A.P.; Smidt, H.; de Klein, J.J.M. Abundance, Activity and Community Structure of Denitrifiers in Drainage Ditches in Relation to Sediment Characteristics, Vegetation and Land-Use. Ecosystems 2017, 20, 928–943. [Google Scholar] [CrossRef] [Green Version]
- de Almeida, W.S.; Panachuki, E.; de Oliveira, P.T.S.; da Silva Menezes, R.; Sobrinho, T.A.; de Carvalho, D.F. Effect of soil tillage and vegetal cover on soil water infiltration. Soil Tillage Res. 2018, 175, 130–138. [Google Scholar] [CrossRef]
- Portelinha, F.H.M.; Zornberg, J.G. Effect of infiltration on the performance of an unsaturated geotextile-reinforced soil wall. Geotext. Geomembr. 2017, 45, 211–226. [Google Scholar] [CrossRef]
- Dawson, S.K.; Kingsford, R.T.; Berney, P.; Keith, D.A.; Hemmings, F.A.; Warton, D.I.; Waters, C.; Catford, J.A. Frequent inundation helps counteract land use impacts on wetland propagule banks. Appl. Veg. Sci. 2017, 20, 459–467. [Google Scholar] [CrossRef]
- Seidl, M.; Hadrich, B.; Palmier, L.; Petrucci, G.; Nascimento, N. Impact of urbanisation (trends) on runoff behaviour of Pampulha watersheds (Brazil). Environ. Sci. Pollut. Res. 2020, 27, 14259–14270. [Google Scholar] [CrossRef]
- Shrestha, S.; Cui, S.; Xu, L.; Wang, L.; Manandhar, B.; Ding, S. Impact of Land Use Change Due to Urbanisation on Surface Runoff Using GIS-Based SCS–CN Method: A Case Study of Xiamen City, China. Land 2021, 10, 839. [Google Scholar] [CrossRef]
- Mu, B.; Zhao, X.; Zhao, J.; Liu, N.; Si, L.; Wang, Q.; Sun, N.; Sun, M.; Guo, Y.; Zhao, S. Quantitatively Assessing the Impact of Driving Factors on Vegetation Cover Change in China’s 32 Major Cities. Remote Sens. 2022, 14, 839. [Google Scholar] [CrossRef]
- Wu, H.; Cheng, S.; Li, Z.; Ke, G.; Liu, H. Study on Soil Water Infiltration Process and Model Applicability of Check Dams. Water 2022, 11, 1814. [Google Scholar] [CrossRef]
- Scorpio, V.; Crema, S.; Marra, F.; Righini, M.; Ciccarese, G.; Borga, M.; Cavalli, M.; Corsini, A.; Marchi, L.; Surian, N.; et al. Basin-scale analysis of the geomorphic effectiveness of flash floods: A study in the northern Apennines (Italy). Sci. Total Environ. 2018, 640–641, 337–351. [Google Scholar] [CrossRef]
- Zhang, X.; Lin, P.; Chen, H.; Yan, R.; Zhang, J.; Yu, Y.; Liu, E.; Yang, Y.; Zhao, W.; Lv, D.; et al. Understanding land use and cover change impacts on run-off and sediment load at flood events on the Loess Plateau, China. Hydrol. Process. 2018, 32, 576–589. [Google Scholar] [CrossRef]
- Yang, J.Q.; Nepf, H.M. Impact of Vegetation on Bed Load Transport Rate and Bedform Characteristics. Water Resour. Res. 2019, 55, 6109–6124. [Google Scholar] [CrossRef]
- Tang, X.; Hong, H.; Shu, Y.; Tang, H.; Li, J.; Liu, W. Urban waterlogging susceptibility assessment based on a PSO-SVM method using a novel repeatedly random sampling idea to select negative samples. J. Hydrol. 2019, 576, 583–595. [Google Scholar] [CrossRef]
- Zhang, G.; Feng, G.; Li, X.; Xie, C.; Pi, X. Flood Effect on Groundwater Recharge on a Typical Silt Loam Soil. Water 2017, 9, 523. [Google Scholar] [CrossRef] [Green Version]


| Land Cover Type | Description |
|---|---|
| Water body | Dams, pans, seasonal/permanent rivers, ponds, marshy areas, reservoirs |
| Forest | Primary forests, plantations, forest production areas, mangroves, swamp forests, closed canopies |
| Bare lands | Large tracks of uncultivated land with scattered trees used for grazing and replanting the estate |
| Urban | Villages, commercial/residential structures, paved surfaces, roads |
| Croplands | Planted crops, irrigated crops, perennial crops |
| Paddy field | Irrigated paddy fields, seasonal paddy fields, swamp paddy fields |
| Shrublands | Trees/bushes with a height of five feet or less, open or closed canopy |
| No | Land Cover | 2009 | 2013 | 2019 | |||
|---|---|---|---|---|---|---|---|
| km2 | % | km2 | % | Km2 | % | ||
| 1. | Water Body | 6.61 | 2.13 | 6.46 | 2.08 | 11.01 | 3.54 |
| 2. | Forest | 57.61 | 18.55 | 63.80 | 20.54 | 54.51 | 17.55 |
| 3. | Bare lands | 0.37 | 0.12 | 0.63 | 0.20 | 2.56 | 0.82 |
| 4. | Urban | 2.59 | 0.83 | 4.04 | 1.30 | 5.55 | 1.79 |
| 5. | Croplands | 193.23 | 62.21 | 204.97 | 65.99 | 190.46 | 61.31 |
| 6. | Paddy field | 2.93 | 0.94 | 3.18 | 1.02 | 19.36 | 6.23 |
| 7. | Shrublands | 47.29 | 15.22 | 27.53 | 8.86 | 27.17 | 8.75 |
| Total | 310.67 | 100.00 | 310.67 | 100.00 | 310.67 | 100.00 | |
| No | Land Classification | Water Level Reading (cm) | Time (s) | Infiltration Rate (cm/s) | Soil Type |
|---|---|---|---|---|---|
| 1. | Agriculture | 0.2 | 240.12 | 0.000640 | Sandy loam |
| 2. | Forest | 0.2 | 240.12 | 0.000833 | Clay |
| 3. | Bare lands | 0.0 | 240.12 | 0.000000 | Clay |
| 4. | Paddy field | 0.3 | 360.00 | 0.000670 | Clay |
| 5. | Urban | 0.7 | 540.00 | 0.001200 | Sand |
| 6. | Shrubs | 0.1 | 420.12 | 0.000140 | Loamy sand |
| No | Slope Angle | Area (km2) | % Area |
|---|---|---|---|
| 1. | 0.0–1.2 | 132.194 | 42.56 |
| 2. | 1.2–3.0 | 105.944 | 34.11 |
| 3. | 3.0–5.5 | 27.665 | 8.91 |
| 4. | 5.5–10.3 | 33.030 | 10.63 |
| 5. | 10.3–30.0 | 11.780 | 3.79 |
| 6. | >30.0 | 0.001 | 0.00 |
| Total | 310.620 | 100.00 |
| No | Soil Type | Soil Flood Risk | Area (km2) | % Area |
|---|---|---|---|---|
| 1 | Clay | High | 20.075 | 42.56 |
| 2 | Loamy sand | High | 28.167 | 34.11 |
| 3 | Clay | Low | 56.515 | 8.91 |
| 4 | Sandy loam | Moderate | 197.452 | 0.63 |
| 5 | Clay | Very high | 2.650 | 3.79 |
| 6 | Sand | Very high | 5.757 | 0.00 |
| Total | 310.62 | 100.00 |
| No | Risk Classification | km2 | % Area |
|---|---|---|---|
| 1 | Very Low | 29.758 | 9.58 |
| 2 | Low | 68.97 | 22.21 |
| 3 | Moderate | 174.69 | 56.24 |
| 4 | High | 21.64 | 6.97 |
| 5 | Very High | 15.56 | 5.01 |
| 310.62 | 100.00 |
| No | Flood Risk | Slope (%) | Area (km2) | % Area |
|---|---|---|---|---|
| 1 | Very high | 0.0–1.2 | 132.12 | 42.56 |
| 2 | Very high | 1.2–3.0 | 105.88 | 34.11 |
| 3 | High | 3.1–5.0 | 27.65 | 8.91 |
| 4 | Moderate | 5.5–10.3 | 33.01 | 10.63 |
| 5 | Low | 10.3–30.0 | 11.77 | 3.79 |
| 6 | Very Low | >30.0 | 0.00 | 0.00 |
| Total | 310.43 | 100.00 |
Publisher’s Note: MDPI stays neutral with regard to jurisdictional claims in published maps and institutional affiliations. |
© 2022 by the authors. Licensee MDPI, Basel, Switzerland. This article is an open access article distributed under the terms and conditions of the Creative Commons Attribution (CC BY) license (https://creativecommons.org/licenses/by/4.0/).
Share and Cite
Sugianto, S.; Deli, A.; Miswar, E.; Rusdi, M.; Irham, M. The Effect of Land Use and Land Cover Changes on Flood Occurrence in Teunom Watershed, Aceh Jaya. Land 2022, 11, 1271. https://doi.org/10.3390/land11081271
Sugianto S, Deli A, Miswar E, Rusdi M, Irham M. The Effect of Land Use and Land Cover Changes on Flood Occurrence in Teunom Watershed, Aceh Jaya. Land. 2022; 11(8):1271. https://doi.org/10.3390/land11081271
Chicago/Turabian StyleSugianto, Sugianto, Anwar Deli, Edy Miswar, Muhammad Rusdi, and Muhammad Irham. 2022. "The Effect of Land Use and Land Cover Changes on Flood Occurrence in Teunom Watershed, Aceh Jaya" Land 11, no. 8: 1271. https://doi.org/10.3390/land11081271
APA StyleSugianto, S., Deli, A., Miswar, E., Rusdi, M., & Irham, M. (2022). The Effect of Land Use and Land Cover Changes on Flood Occurrence in Teunom Watershed, Aceh Jaya. Land, 11(8), 1271. https://doi.org/10.3390/land11081271