
Spatiotemporal Evolution Characteristics of Urbanization in the Xiamen Special Economic Zone Based on Nighttime-Light Data from 1992 to 2020

 ,
,
Abstract
:1. Introduction
2. Materials and Methods
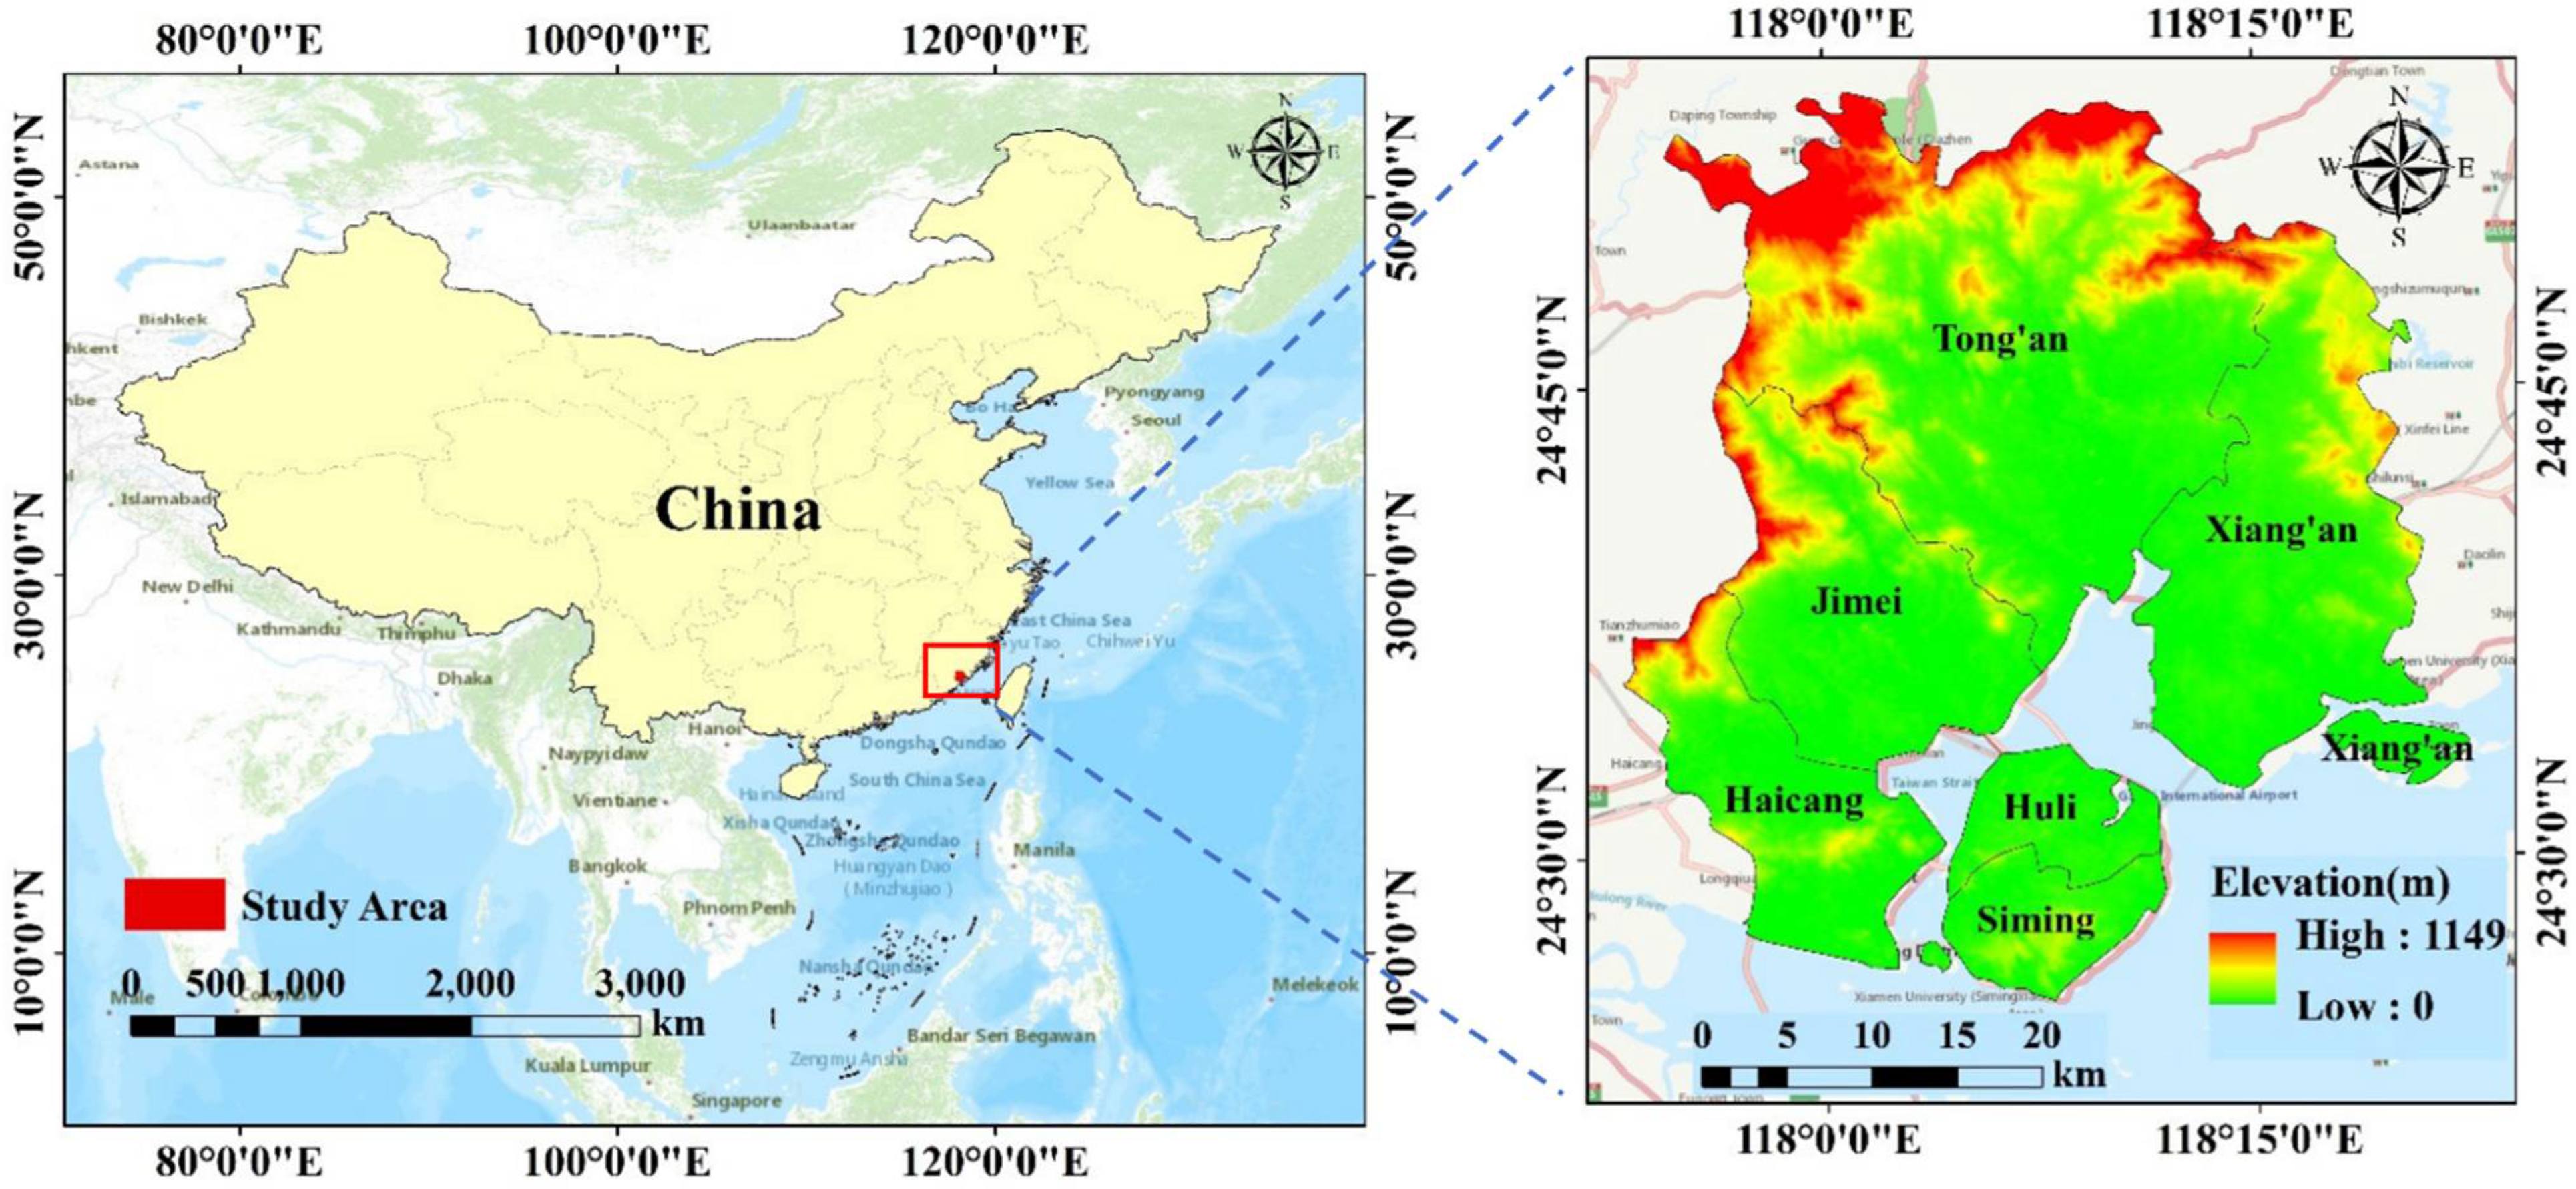
2.1. Study Area
2.2. Data Source and Processing
2.2.1. Data Source
- (1)
- NTL data
- (2)
- Other data
2.2.2. Data Processing
- (1)
- Data correction
- (2)
- Data fusion
- (3)
- Evaluation of correction results
2.3. Extraction of UB
2.4. Study of Expansion Pattern of UB
2.5. Study of the Migration of the Center of Gravity within UB
2.6. Study of Differences in Intra-City Development
2.6.1. Differences in Intracity Development
2.6.2. Relative Development within the City
3. Results
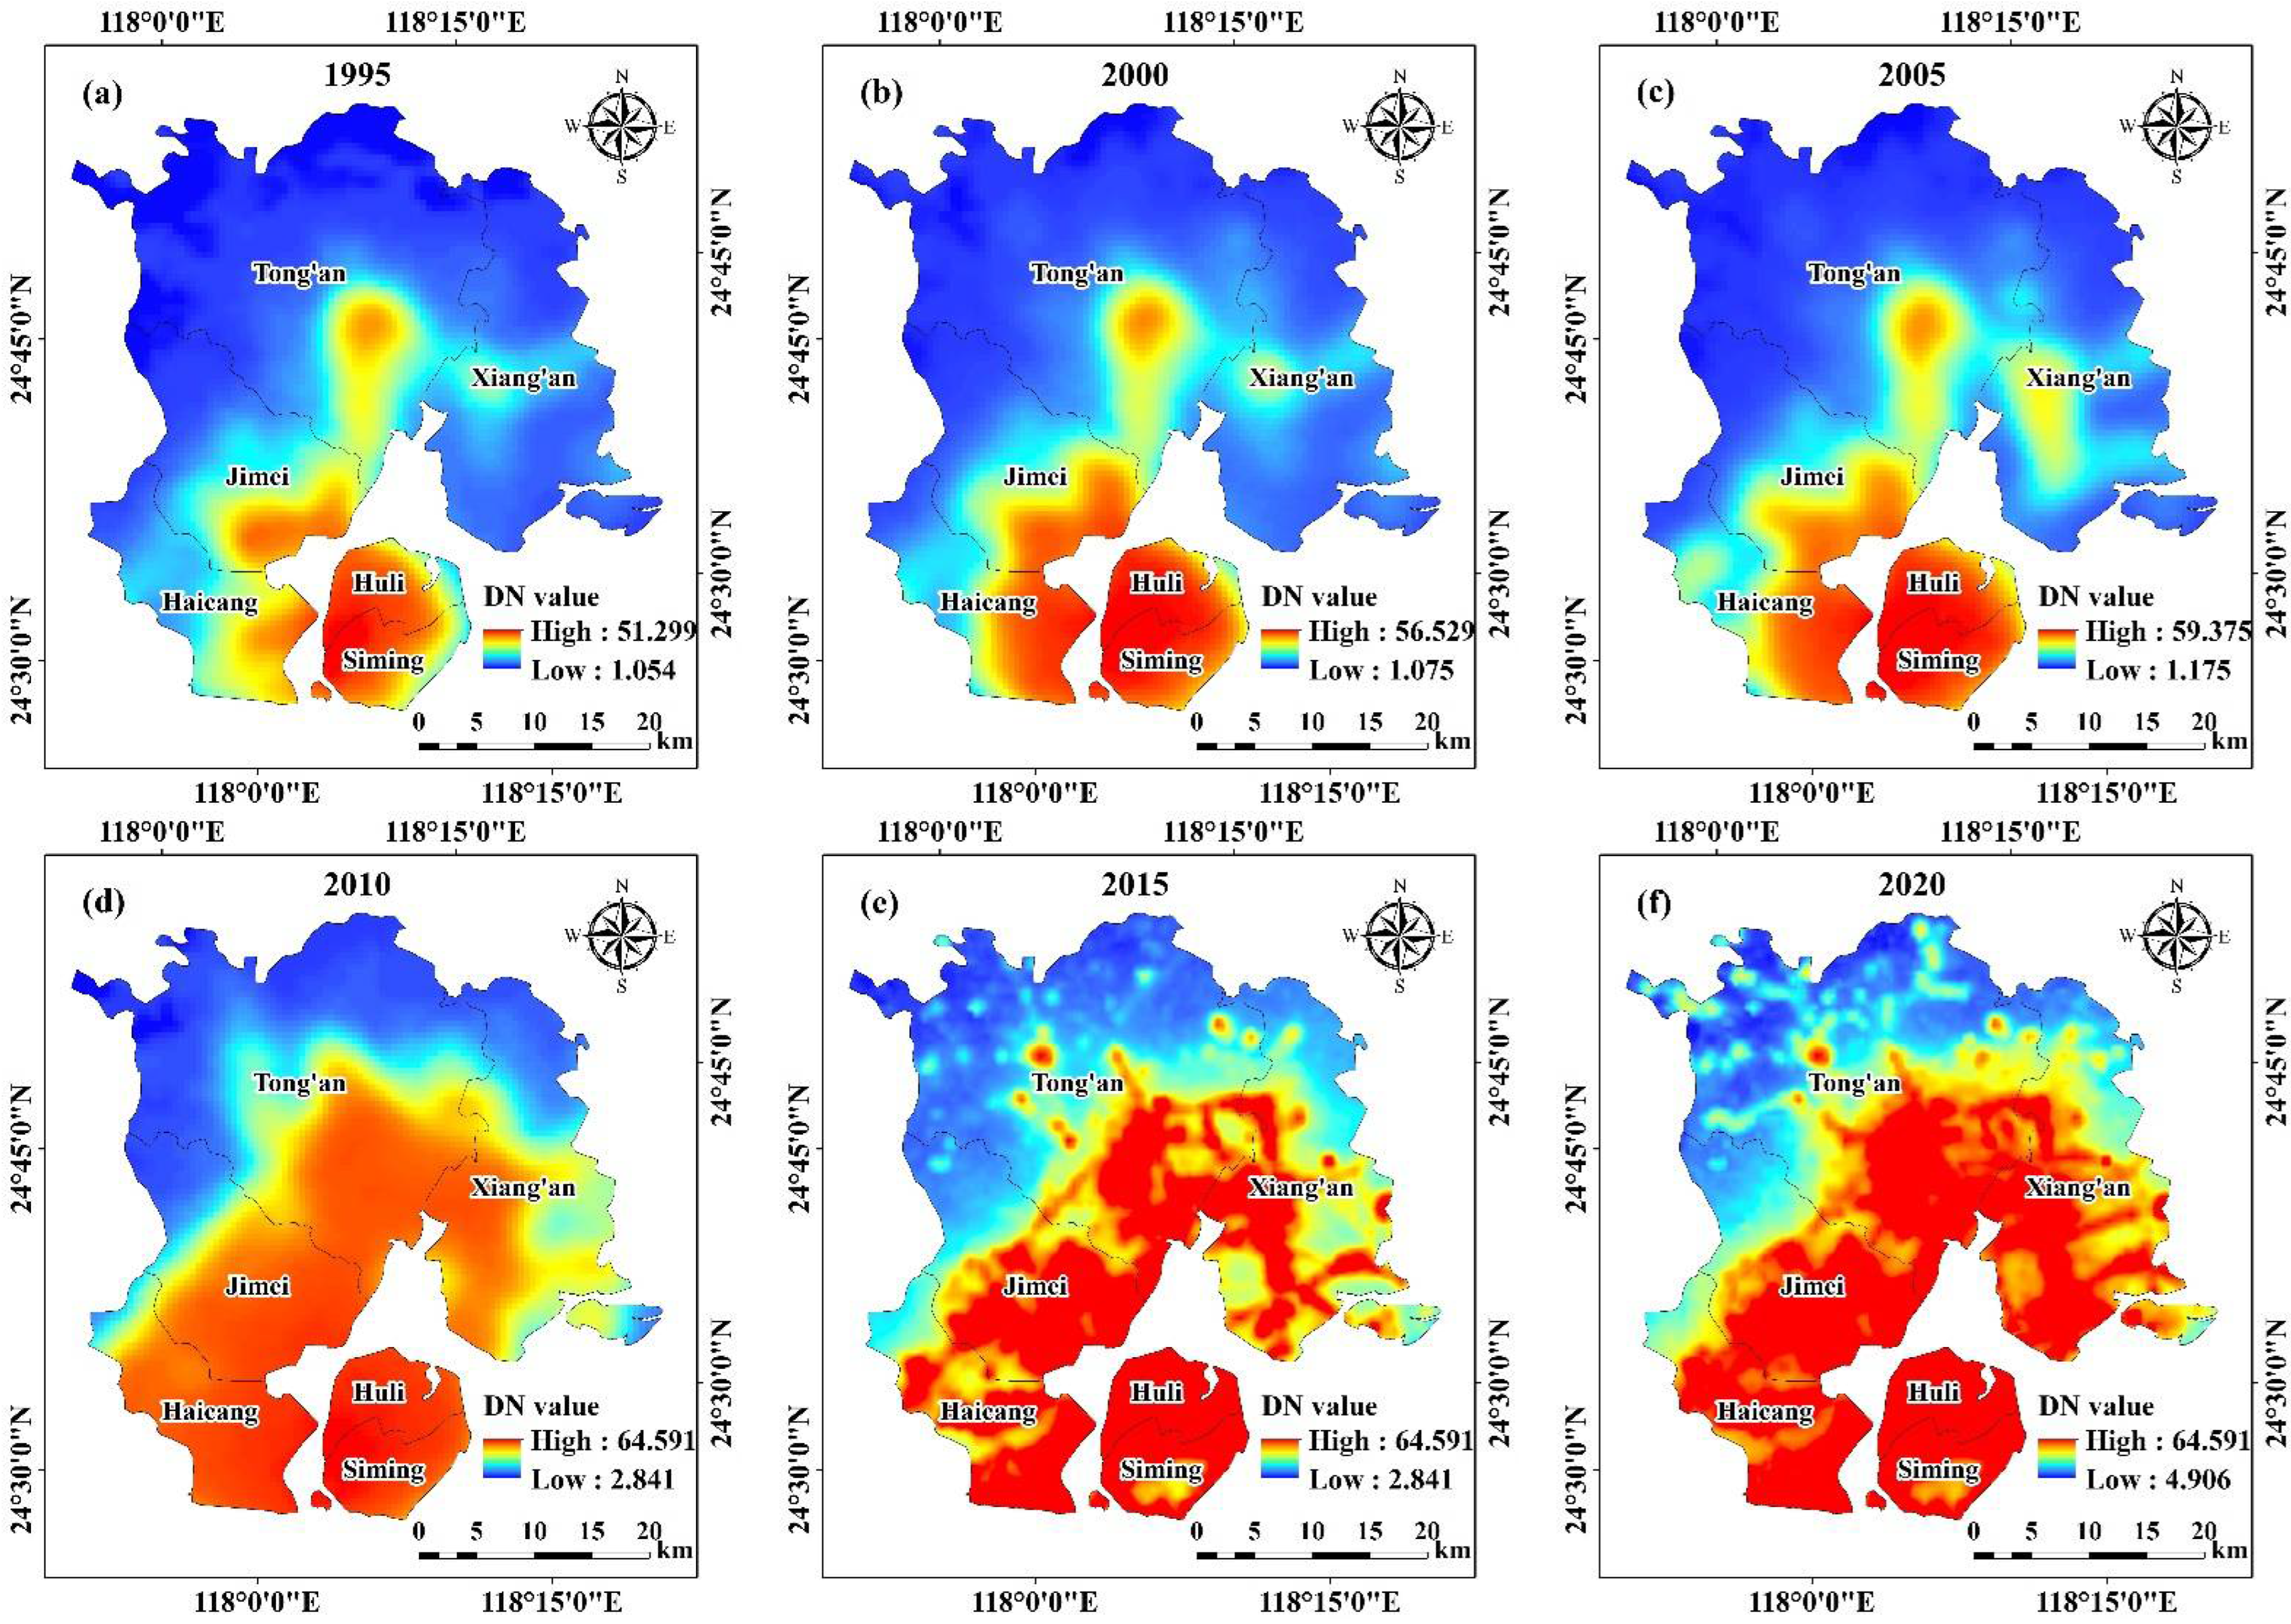
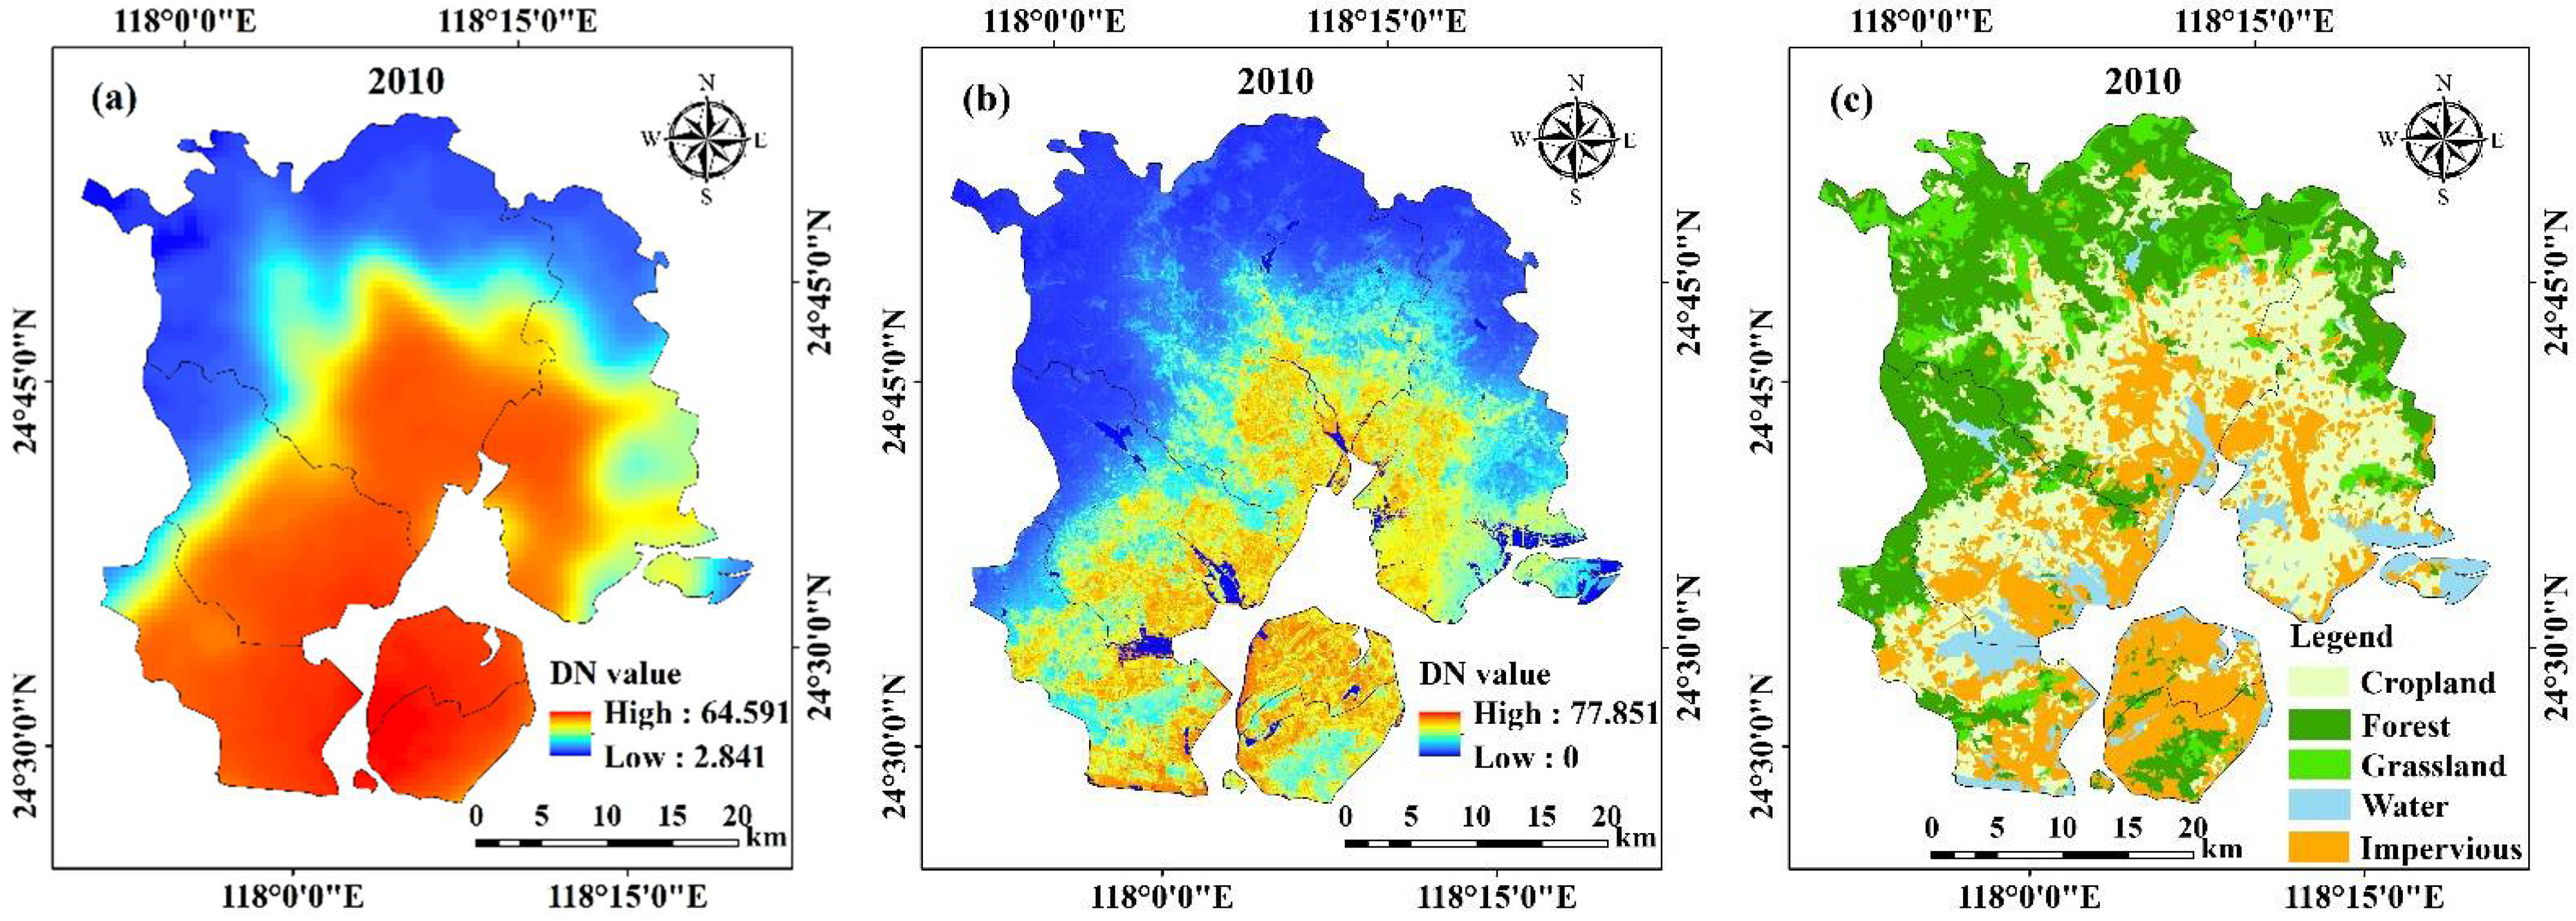
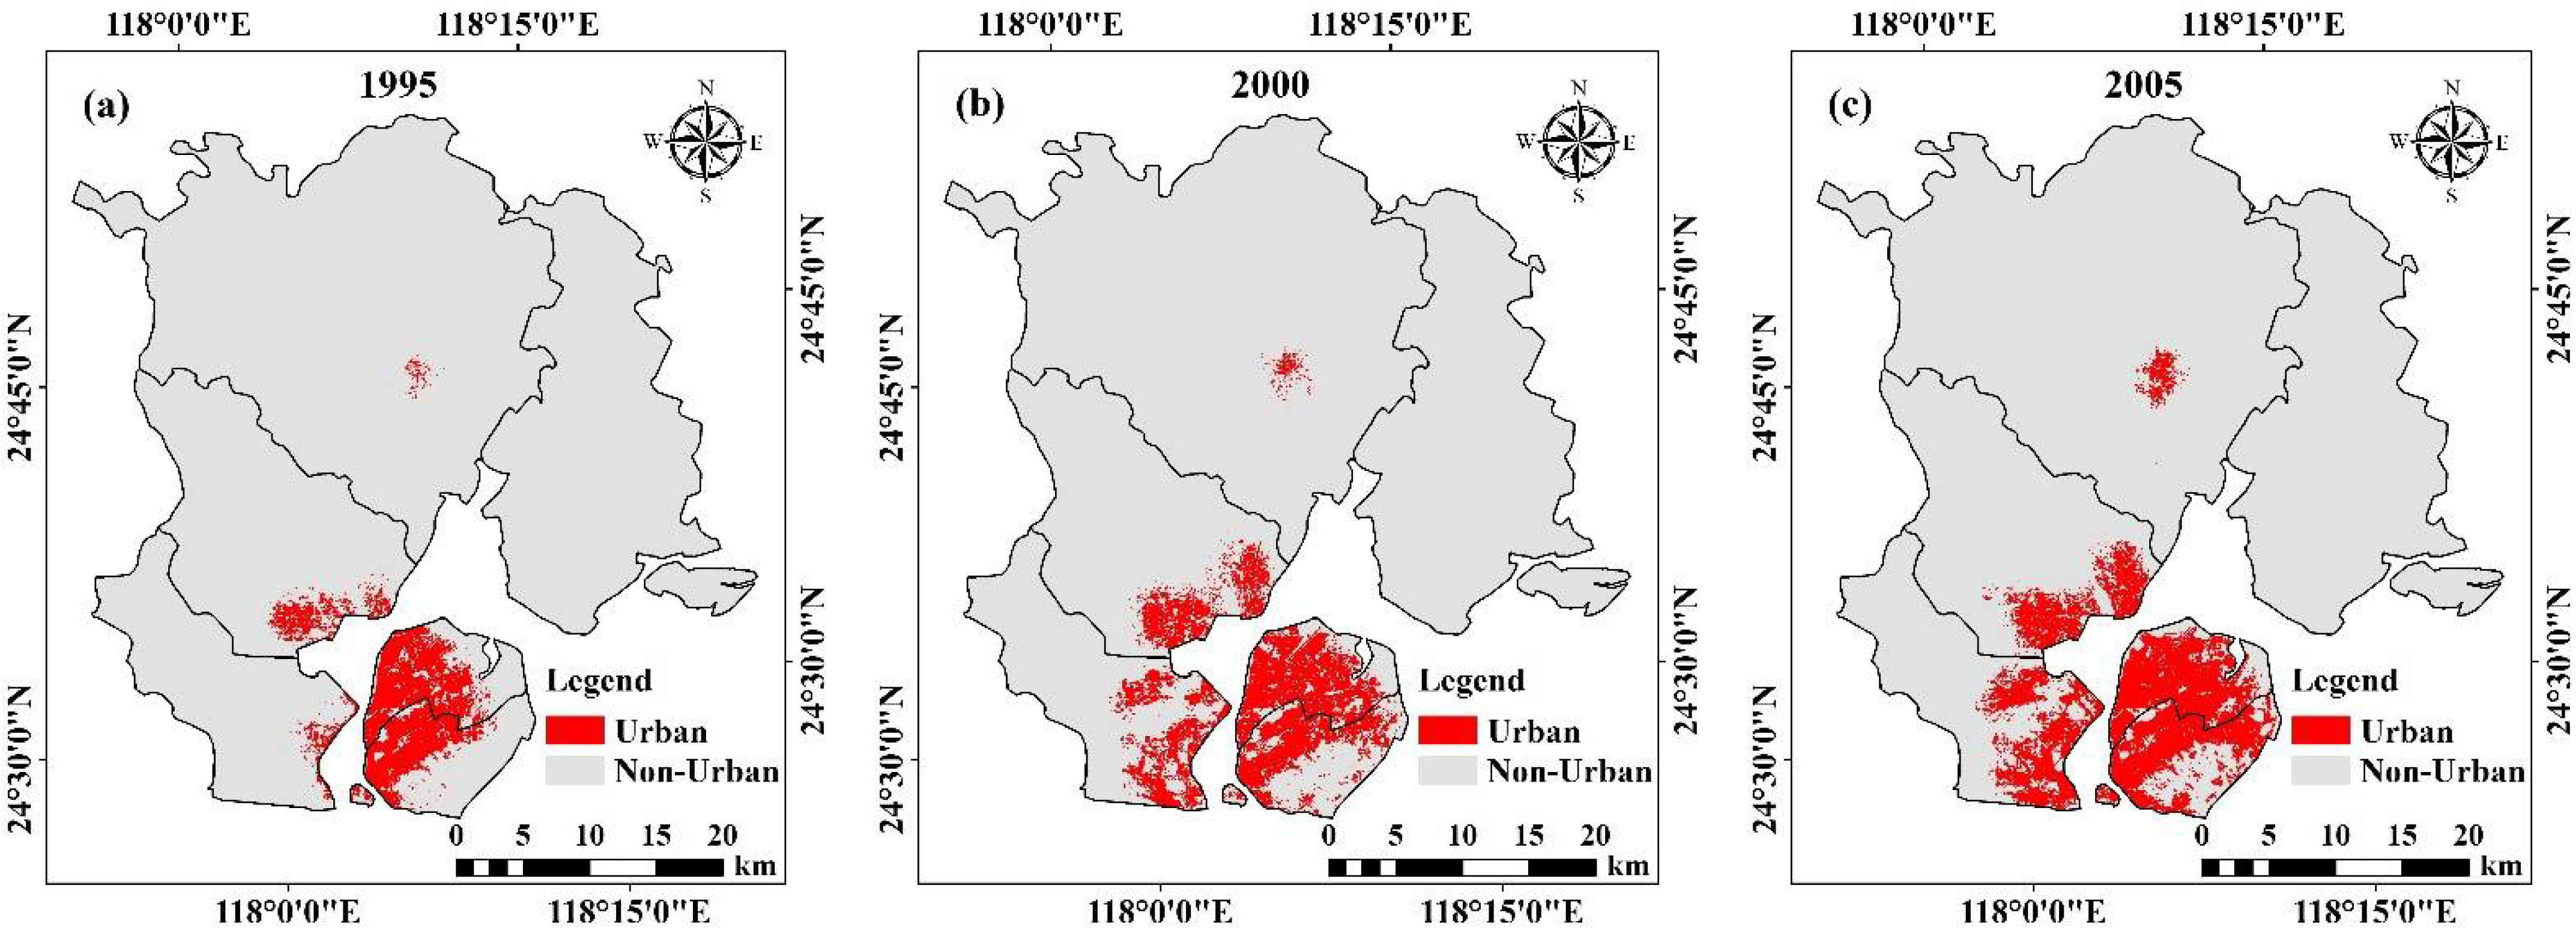
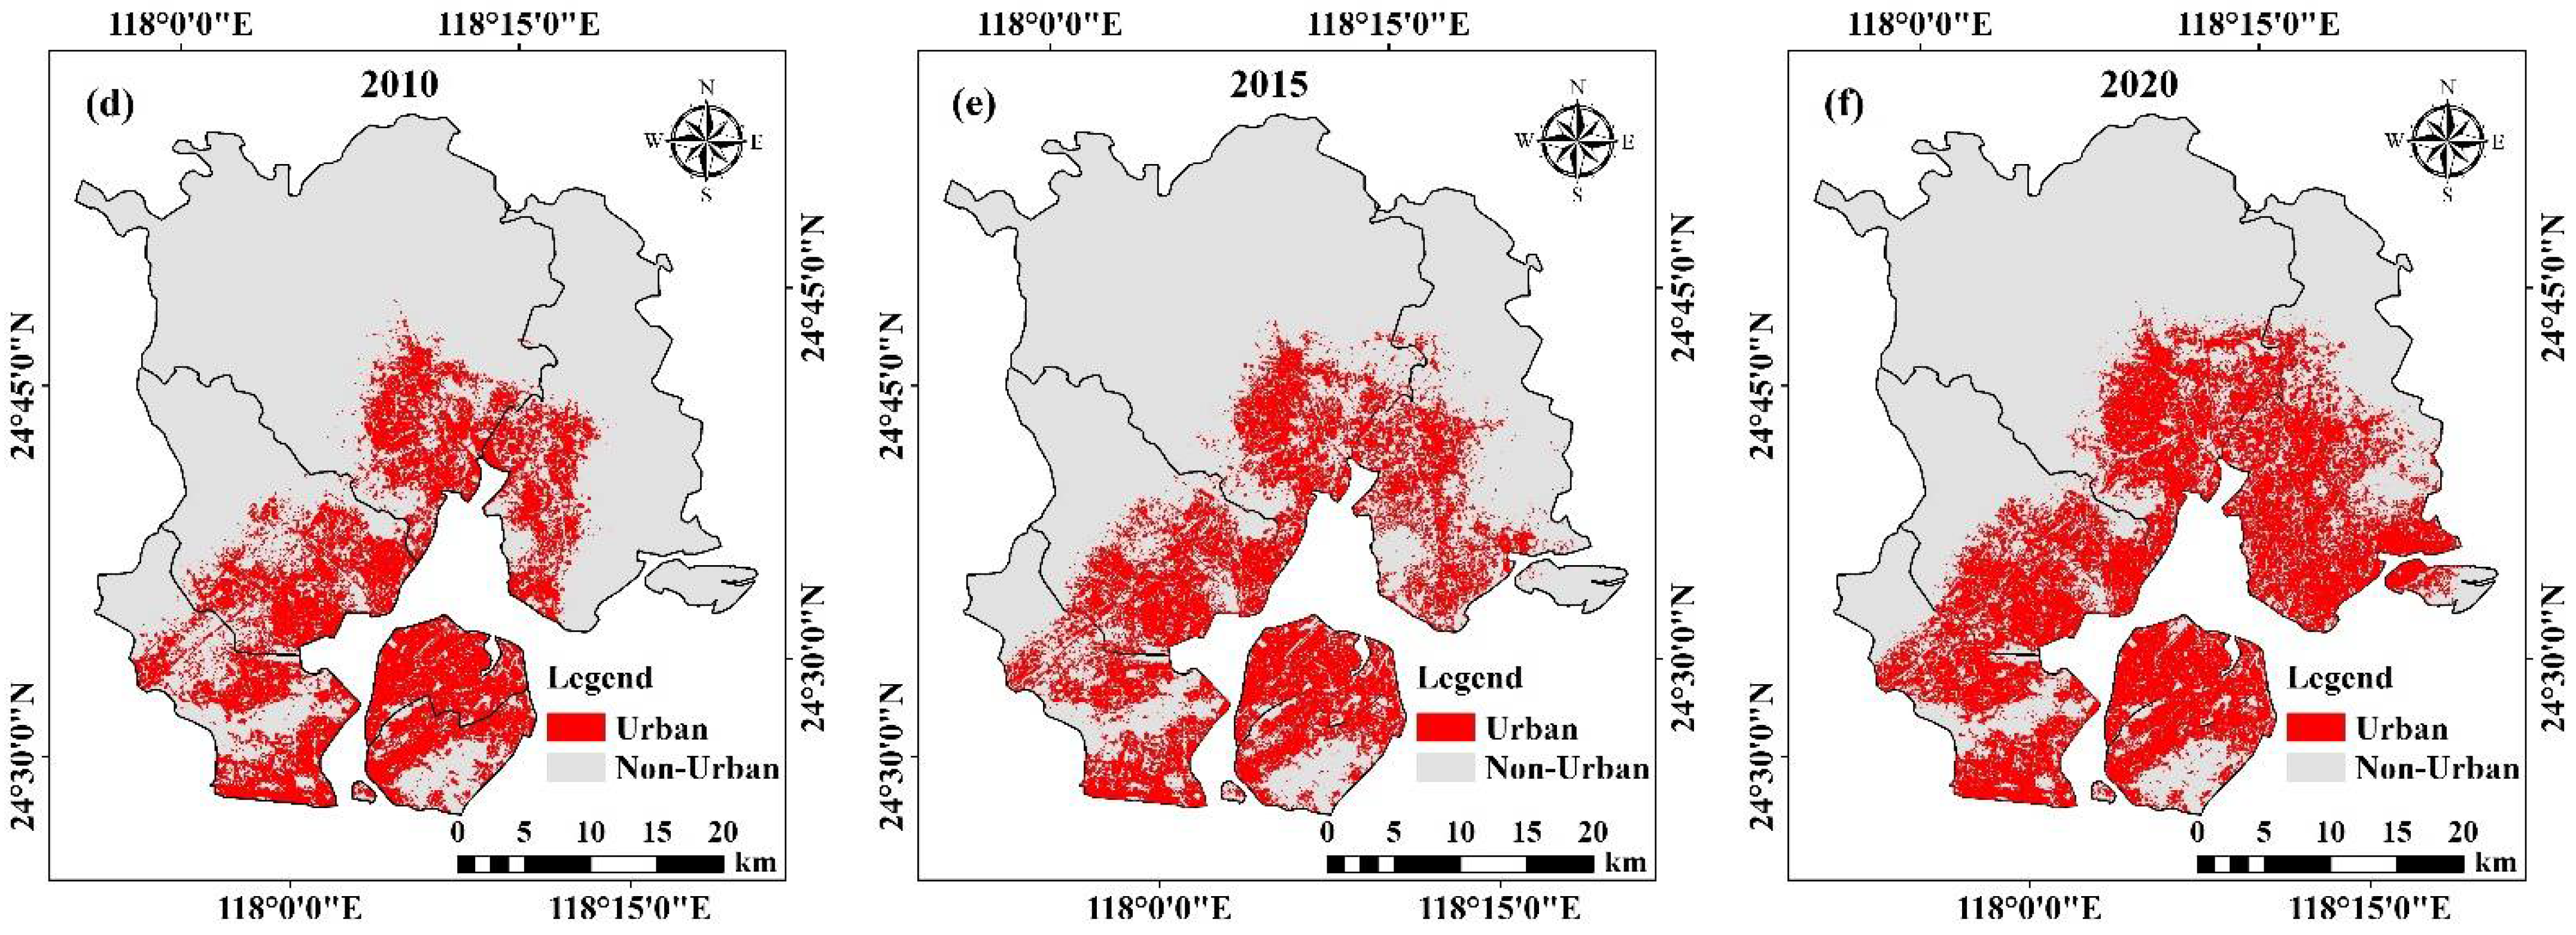
3.1. Analysis of Extraction Results from UB
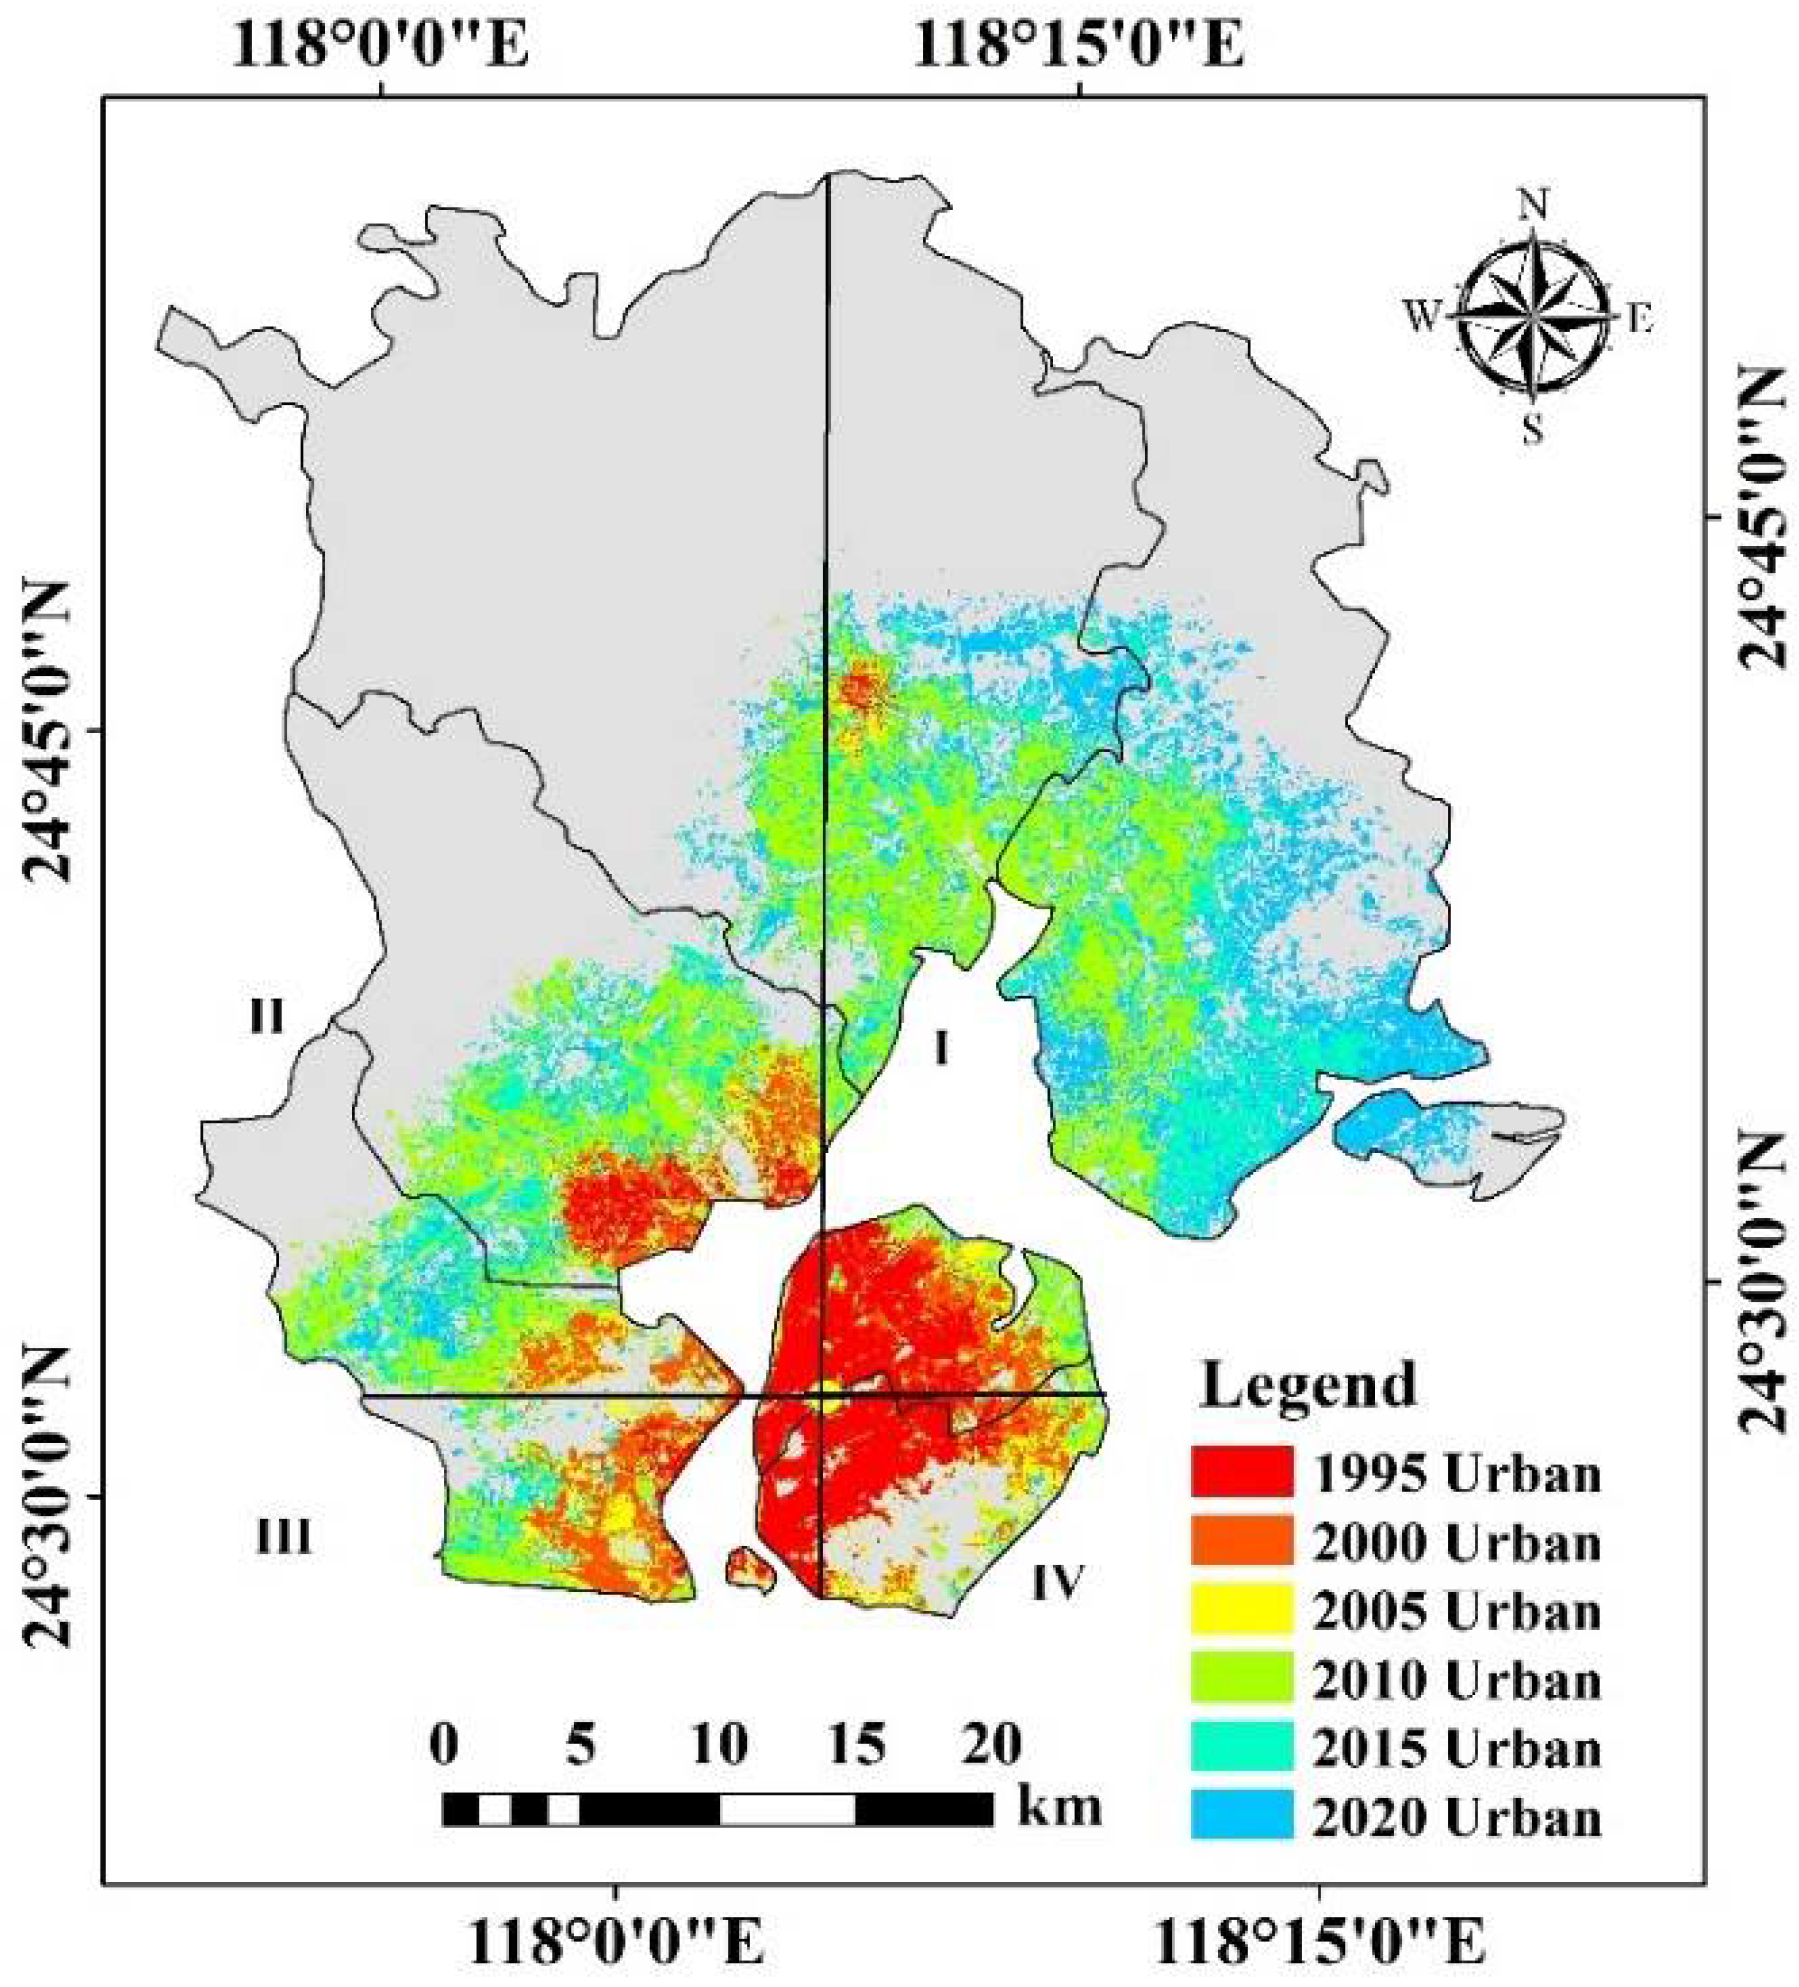
3.2. Analysis of Expansion Pattern of UB
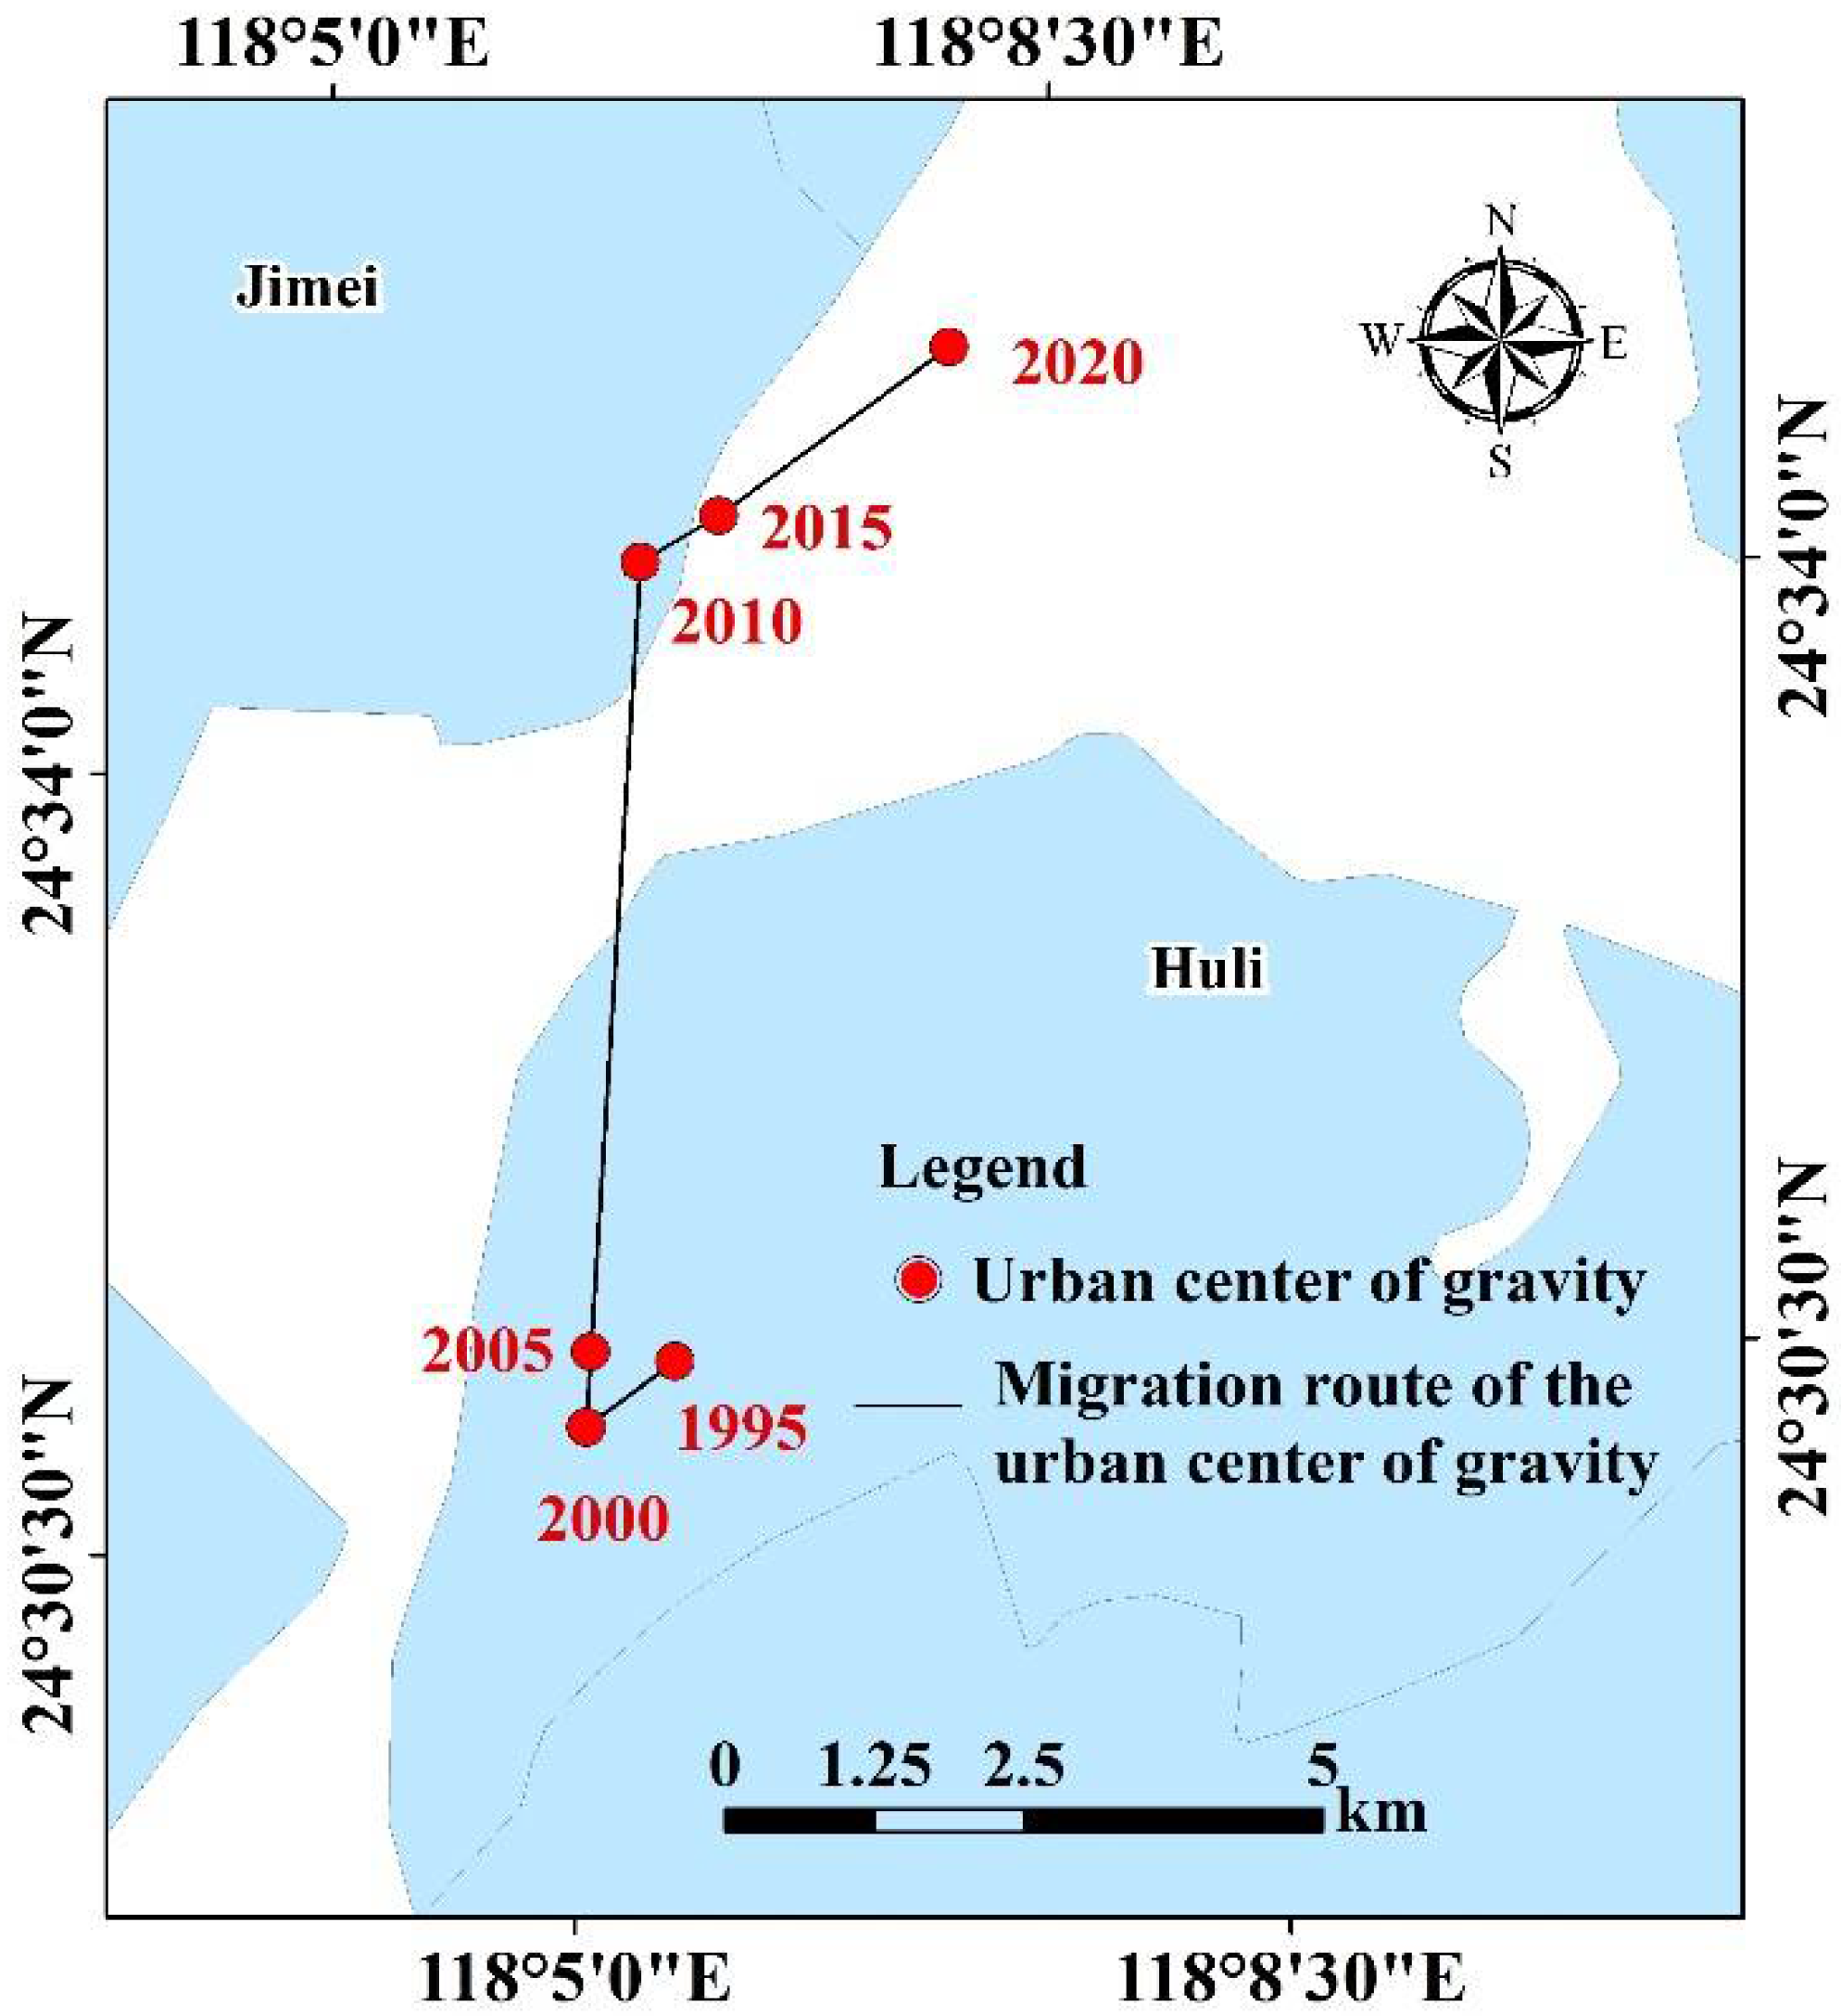
3.3. Analysis of the Migration of the Urban Center of Gravity
3.4. Analysis of Variations in Intra-City Development
3.4.1. Analysis of Variations in Urban Development
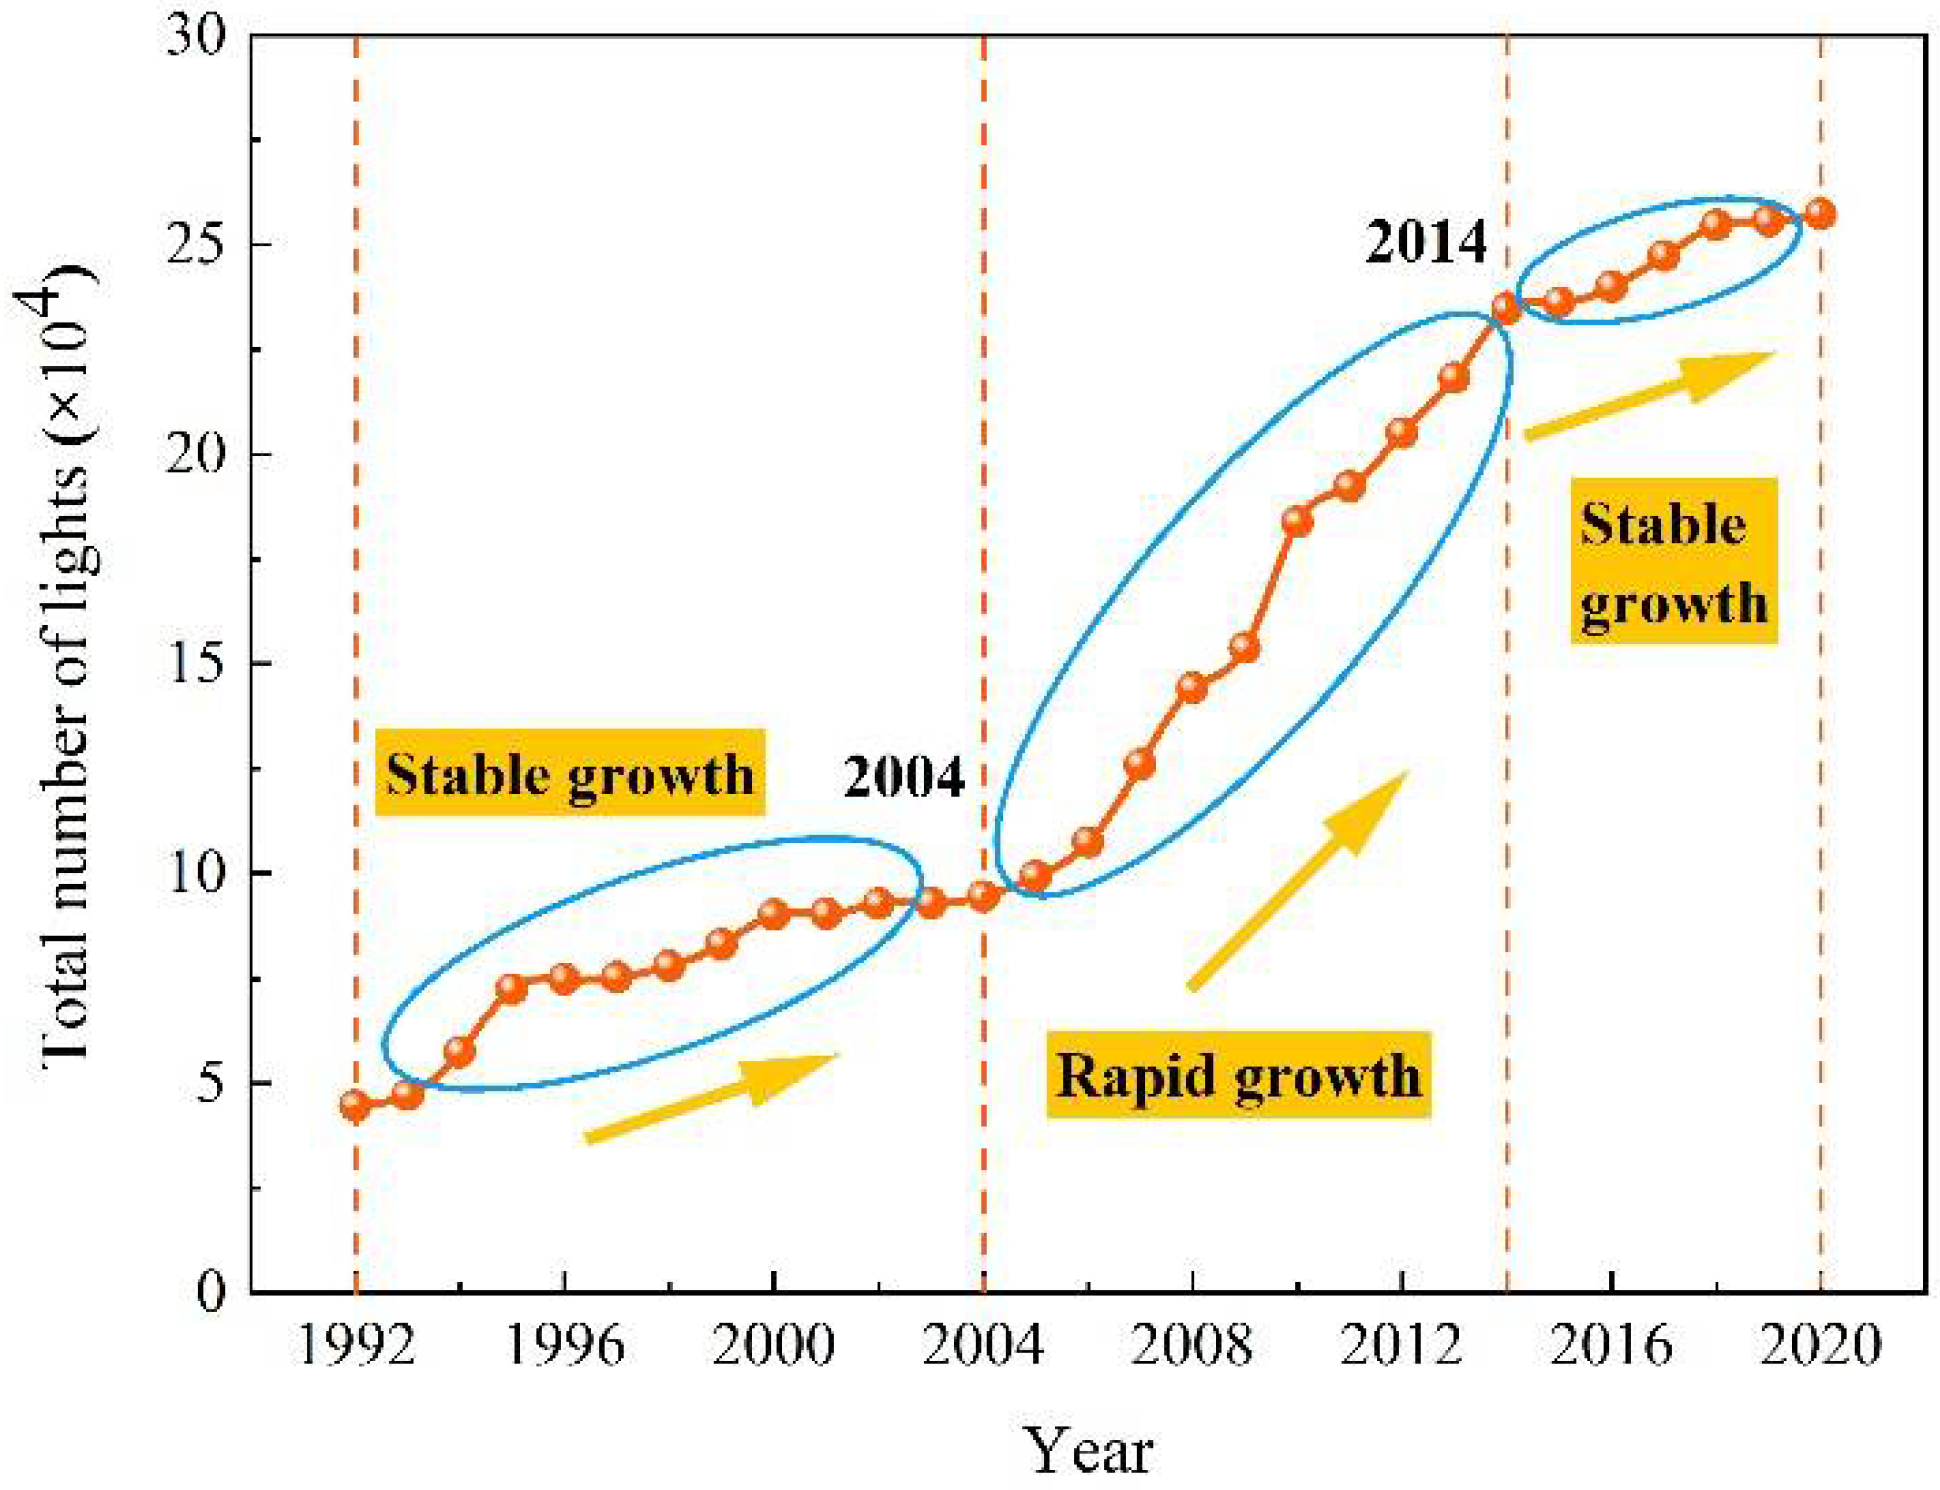
3.4.2. Analysis of the RDR
4. Discussion
4.1. Driving Force Analysis
4.2. Urban Development Proposals
5. Conclusions
Author Contributions
Funding
Institutional Review Board Statement
Informed Consent Statement
Data Availability Statement
Acknowledgments
Conflicts of Interest
References
- Bai, X.; Chen, J.; Shi, P. Landscape Urbanization and Economic Growth in China: Positive Feedbacks and Sustainability Di-lemmas. Environ. Sci. Technol. 2012, 46, 132–139. [Google Scholar] [CrossRef] [PubMed]
- Bhatta, B.; Saraswati, S.; Bandyopadhyay, D. Quantifying the degree-of-freedom, degree-of-sprawl, and degree-of-goodness of urban growth from remote sensing data. Appl. Geogr. 2010, 30, 96–111. [Google Scholar] [CrossRef]
- China’s National Bureau of Statistics. Available online: http://www.stats.gov.cn/tjsj/tjgb/rkpcgb/qgrkpcgb/202106/t20210628_1818826.html (accessed on 15 October 2021).
- Deng, J.; Ke, W.; Yang, H.; Qi, J. Spatio-temporal dynamics and evolution of land use change and landscape pattern in response to rapid urbanization. Landsc. Urban Plan. 2009, 92, 187–198. [Google Scholar] [CrossRef]
- Xiao, J.; Shen, Y.; Ge, J.; Tateishi, R.; Tang, C.; Liang, Y.; Huang, Z. Evaluating urban expansion and land use change in Shi-jiazhuang, China, by using GIS and remote sensing. Landsc. Urban Plan. 2006, 75, 69–80. [Google Scholar] [CrossRef]
- Grimm, N.B.; Faeth, S.H.; Golubiewski, N.E.; Redman, C.L.; Wu, J.; Bai, X.; Briggs, J.M. Global Change and the Ecology of Cities. Science 2008, 319, 756–760. [Google Scholar] [CrossRef]
- Yang, K.; Zhang, S.; Luo, Y.; Xu, Q.; Qu, L. The widening urbanization gap between the Three Northeast Provinces and the Yangtze River Delta under China’s economic reform from 1984 to 2014. Int. J. Sustain. Dev. World Ecol. 2018, 25, 262–275. [Google Scholar] [CrossRef]
- Elvidge, C.D.; Ziskin, D.; Baugh, K.E.; Tuttle, B.T.; Ghosh, T.; Pack, D.W.; Erwin, E.H.; Zhizhin, M. A Fifteen Year Record of Global Natural Gas Flaring Derived from Satellite Data. Energies 2009, 2, 595–622. [Google Scholar] [CrossRef]
- Liu, Z.; He, C.; Zhang, Q.; Huang, Q.; Yang, Y. Extracting the dynamics of urban expansion in China using DMSP-OLS nighttime light data from 1992 to 2008. Landsc. Urban Plan. 2012, 106, 62–72. [Google Scholar] [CrossRef]
- Zou, J.; Chen, Y.; Tian, J.; Wang, T. Construction of the Calibration Model for DMSP/OLS Nighttime Light Images Based on ArcGIS. J. Geomat. 2014, 39, 33–37. [Google Scholar]
- Cao, Z.; Wu, Z.; Kuang, Y.; Huang, N. Correction of DMSP/OLS Night-time Light Images and Its Application in China. Geogr. Inf. Sci. 2015, 17, 1092–1102. [Google Scholar]
- Zhang, Q.; Schaaf, C.; Seto, K.C. The Vegetation Adjusted NTL Urban Index: A new approach to reduce saturation and increase variation in nighttime luminosity. Remote Sens. Environ. 2013, 129, 32–41. [Google Scholar] [CrossRef]
- Wu, J.; Li, S.; Zhang, X. Research on saturation correction for long-time series of DMSP-OLS nighttime light dataset in China. J. Remote Sens. 2018, 22, 621–632. [Google Scholar]
- Xu, W.; Liang, J. Saturation correction method of DMSP/OLS nighttime lights image based on compound exponential model. Geogr. Inf. Sci. 2020, 22, 2227–2237. [Google Scholar]
- Li, X.; Li, D.; Xu, H.; Wu, C. Intercalibration between DMSP/OLS and VIIRS night-time light images to evaluate city light dynamics of Syria’s major human settlement during Syrian Civil War. Int. J. Remote Sens. 2017, 38, 5934–5951. [Google Scholar] [CrossRef]
- Dong, H.; Li, R.; Li, J.; Li, S. Study on urban spatiotemporal expansion pattern of three first-class urban agglomerations in China derived from integrated DMSP-OLS and NPP-VIIRS nighttime light data. Geogr. Inf. Sci. 2020, 22, 1161–1174. [Google Scholar]
- Liang, L.; Bian, J.; Li, A.; Feng, W.; Lei, G.; Zhang, Z.; Zuo, J. Consistent intercalibration of nighttime light data between DMSP/OLS and NPP/VIIRS in the China-Pakistan Economic Corridor. J. Remote Sens. 2020, 24, 149–160. [Google Scholar]
- Zhang, B.; Li, J.; Wang, M.; Duan, P. Mutual Correction of DMSP/OLS and NPP/VIIRS in Mainland China. Remote Sens. Inf. 2021, 36, 99–107. [Google Scholar]
- Zheng, Q.; Weng, Q.; Wang, K. Developing a new cross-sensor calibration model for DMSP-OLS and Suomi-NPP VIIRS night-light imageries. ISPRS J. Photogramm. Remote Sens. 2019, 153, 36–47. [Google Scholar] [CrossRef]
- Croft, T.A. Nighttime Images of the Earth from Space. Sci. Am. 1978, 239, 86–98. [Google Scholar] [CrossRef]
- Milesi, C.; Elvidge, C.D.; Nemani, R.R.; Running, S.W. Assessing the environmental impacts of human settlements using sat-ellite data. Manag. Environ. Qual. 2003, 14, 99–107. [Google Scholar] [CrossRef]
- Wang, C.; Wang, H.; Li, C.; Dong, R. Analysis of the spatial expansion characteristics of major urban agglomerations in China using DMSP/OLS images. Acta Ecol. Sin. 2012, 32, 942–954. [Google Scholar] [CrossRef]
- Imhoff, M.L.; Lawrence, W.T.; Stutzer, D.C.; Elvidge, C.D. A technique for using composite DMSP/OLS “City Lights” satellite data to map urban area. Remote Sens. Environ. 1997, 61, 361–370. [Google Scholar] [CrossRef]
- Shu, S.; Yu, B.; Wu, J.; Liu, H. Methods for Deriving Urban Built-up Area Using Night-light Data: Assessment and Application. Remote Sens. Technol. Appl. 2011, 26, 169–176. [Google Scholar]
- He, C.; Shi, P.; Li, J.; Jin, C.; Pan, Y.; Jing, L.; Li, Z.; Ichinose, T. Restoring urbanization process in China in the 1990s by using non-radiance-calibrated DMSP/OLS nighttime light imagery and statistical data. Chin. Sci. Bull. 2006, 51, 1614–1620. [Google Scholar] [CrossRef]
- Chen, X.; Zhang, F.; Du, Z.; Liu, R. An Unsupervised Urban Extent Extraction Method from NPP-VIIRS Nighttime Light Data. Remote Sens. 2020, 12, 3810. [Google Scholar] [CrossRef]
- Cao, X.; Chen, J.; Imura, H.; Higashi, O. A SVM-based method to extract urban areas from DMSP-OLS and SPOT VGT data. Remote Sens. Environ. 2009, 113, 2205–2209. [Google Scholar] [CrossRef]
- Zhang, Q.; Wang, P.; Chen, H.; Huang, Q.; Jiang, H.; Zhang, Z.; Zhang, Y.; Luo, X.; Sun, S. A novel method for urban area extraction from VIIRS DNB and MODIS NDVI data: A case study of Chinese cities. Int. J. Remote Sens. 2017, 38, 6094–6109. [Google Scholar] [CrossRef]
- Xu, T.; Coco, G.; Gao, J. Extraction of urban built-up areas from nighttime lights using artificial neural network. Geocarto Int. 2019, 35, 1049–1066. [Google Scholar] [CrossRef]
- Lu, D.; Tian, H.; Zhou, G.; Ge, H. Regional mapping of human settlements in southeastern China with multisensor remotely sensed data. Remote Sens. Environ. 2008, 112, 3668–3679. [Google Scholar] [CrossRef]
- Liu, Z.; Zhang, Q.; Yue, D.; Hao, Y.; Su, K. Extraction of urban built-up areas based on Sentinel-2A and NPP-VIIRS nighttime light data. Remote Sens. Land Resour. 2019, 31, 227–234. [Google Scholar]
- Sharma, R.C.; Tateishi, R.; Hara, K.; Gharechelou, S.; Iizuka, K. Global mapping of urban built-up areas of year 2014 by com-bining MODIS multispectral data with VIIRS nighttime light data. Int. J. Digit. Earth 2016, 9, 1004–1020. [Google Scholar] [CrossRef]
- Yan, Q.; Li, F.; Li, L. Research on built-up area extraction via brightness correction indexes based on two kinds of nighttime light images. Geogr. Inf. Sci. 2020, 22, 1714–1724. [Google Scholar]
- Zheng, Y.; Tang, L.; Wang, H. An improved approach for monitoring urban built-up areas by combining NPP-VIIRS nighttime light, NDVI, NDWI, and NDBI. J. Clean. Prod. 2021, 328, 129488. [Google Scholar] [CrossRef]
- Lin, J.; Liu, X.; Li, K.; Li, X. A maximum entropy method to extract urban land by combining MODIS reflectance, MODIS NDVI, and DMSP-OLS data. Int. J. Remote Sens. 2014, 35, 6708–6727. [Google Scholar] [CrossRef]
- Yu, B.; Tang, M.; Wu, Q.; Yang, C.; Deng, S.; Shi, K.; Peng, C.; Wu, J.; Chen, Z. Urban Built-Up Area Extraction from Log-Transformed NPP-VIIRS Nighttime Light Composite Data. IEEE Geosci. Remote Sens. Lett. 2018, 15, 1279–1283. [Google Scholar] [CrossRef]
- Goldblatt, R.; Stuhlmacher, M.F.; Tellman, B.; Clinton, N.; Hanson, G.; Georgescu, M.; Wang, C.; Serrano-Candela, F.; Khandelwal, A.K.; Cheng, W.H.; et al. Using Landsat and nighttime lights for supervised pixel-based image classification of urban land cover. Remote Sens. Environ. 2018, 205, 253–275. [Google Scholar] [CrossRef]
- Omurakunova, G.; Bao, A.; Jiapaer, G.; Khan, G.; Jiang, L.; Jolochieva, E. Urban growth dynamics during the period 1992–2013 in Kyrgyzstan based on DMSP-OLS nightlight satellite data. Arab. J. Geosci. 2021, 14, 1959. [Google Scholar] [CrossRef]
- Liu, F.; Zhang, Z.; Shi, L.; Zhao, X.; Xu, J.; Yi, L.; Liu, B.; Wen, Q.; Hu, S.; Wang, X.; et al. Urban expansion in China and its spatial-temporal differences over the past four decades. J. Geogr. Sci. 2016, 26, 1477–1496. [Google Scholar] [CrossRef]
- Frolking, S.; Milliman, T.; Seto, K.C.; Friedl, M.A. A global fingerprint of macro-scale changes in urban structure from 1999 to 2009. Environ. Res. Lett. 2013, 8, 024004. [Google Scholar] [CrossRef]
- Zheng, Y.; He, Y.; Zhou, Q.; Wang, H. Quantitative Evaluation of Urban Expansion using NPP-VIIRS Nighttime Light and Landsat Spectral Data. Sustain. Cities Soc. 2022, 76, 103338. [Google Scholar] [CrossRef]
- Jiang, Y.; Sun, S.; Zheng, S. Exploring Urban Expansion and Socioeconomic Vitality Using NPP-VIIRS Data in Xia-Zhang-Quan, China. Sustainability 2019, 11, 1739. [Google Scholar] [CrossRef]
- Zhao, S.; Zhou, D.; Zhu, C.; Qu, W.; Zhao, J.; Sun, Y.; Huang, D.; Wu, W.; Liu, S. Rates and patterns of urban expansion in China’s 32 major cities over the past three decades. Landsc. Ecol. 2015, 30, 1541–1559. [Google Scholar] [CrossRef]
- Schneider, A.; Woodcock, C.E. Compact, Dispersed, Fragmented, Extensive? A Comparison of Urban Growth in Twenty-five Global Cities using Remotely Sensed Data, Pattern Metrics and Census Information. Urban Stud. 2008, 45, 659–692. [Google Scholar] [CrossRef]
- Zhou, L.; Shi, P.; Chen, J.; Toshiaki, I. Application of Compound Night Light Index Derived from DMSP/OLS Data to Ur-banization Analysis in China in the 1990s. Acta Geogr. Sin. 2003, 58, 893–902. [Google Scholar]
- Li, L.; Gong, J.; Yang, J.; Li, S. Urban Spatial Pattern Evolution of Wuhan City Based on Nighttime Light. Remote Sens. Inf. 2017, 32, 133–141. [Google Scholar]
- Alahmadi, M.; Atkinson, P.M. Three-Fold Urban Expansion in Saudi Arabia from 1992 to 2013 Observed Using Calibrated DMSP-OLS Night-Time Lights Imagery. Remote Sens. 2019, 11, 2266. [Google Scholar] [CrossRef]
- Rafael, C.; Martin, D.A.; Vargas, J.F. Measuring the size and growth of cities using nighttime light. J. Urban Econ. 2021, 125, 103254. [Google Scholar]
- Xiamen Bureau of Statistics. Available online: http://tjj.xm.gov.cn/tjzl/ndgb/202105/t20210527_2554550.htm (accessed on 10 January 2022).
- Xiamen Bureau of Statistics. Available online: http://tjj.xm.gov.cn/tjzl/tjsj/jdsj/sjyb/202201/t20220127_2623790.htm (accessed on 12 March 2022).
- Li, Y.; Geng, X. RS Based Quantitative Analysis of Urban Environment: Application of Remote Sensing in Xiamen City; Peking University Press: Beijing, China, 2019. [Google Scholar]
- Xiamen Bureau of Statistics. Available online: http://tjj.xm.gov.cn/tjzl/ndgb/201803/t20180328_2091029.htm (accessed on 15 June 2022).
- Haixi Sunnews. Available online: http://dzb.sunnews.cn/html/2020-10/14/content_788624.htm?div=-1 (accessed on 10 July 2021).
- Xiamen Daily. Available online: https://epaper.xmnn.cn/xmrb/20200518/ (accessed on 18 July 2021).
- Zheng, Y.; Shao, G.; Tang, L.; He, Y.; Wang, X.; Wang, Y.; Wang, H. Rapid Assessment of a Typhoon Disaster Based on NPP-VIIRS DNB Daily Data: The Case of an Urban Agglomeration along Western Taiwan Straits, China. Remote Sens. 2019, 11, 1709. [Google Scholar] [CrossRef]
- Elvidge, C.D.; Baugh, K.E.; Kihn, E.A.; Kroehl, H.W.; Davis, E.R.; Davis, C.W. Relation between satellite observed visible near infrared emissions, population, economic activity and electric power consumption. Int. J. Remote Sens. 1997, 18, 1373–1379. [Google Scholar] [CrossRef]
- Forbes, D.J. Multi-scale analysis of the relationship between economic statistics and DMSP-OLS night light images. GIScience Remote Sens. 2013, 50, 483–499. [Google Scholar] [CrossRef]
- Zheng, Y.; Zhou, Q.; He, Y.; Wang, C.; Wang, X.; Wang, H. An Optimized Approach for Extracting Urban Land Based on Log-Transformed DMSP-OLS Nighttime Light, NDVI, and NDWI. Remote Sens. 2021, 13, 766. [Google Scholar] [CrossRef]
- Imhoff, M.L.; Lawrence, W.T.; Elvidge, C.; Paul, T.; Levine, E.; Privalsky, M.V.; Brown, V. Using nighttime DMSP/OLS images of city lights to estimate the impact of urban land use on soil resources in the United States. Remote Sens. Environ. 1997, 59, 105–117. [Google Scholar] [CrossRef]
- Shao, G.; Tang, L.; Zhang, H. Introducing Image Classification Efficacies. IEEE Access 2021, 9, 134809–134816. [Google Scholar] [CrossRef]
- Shao, G.; Tang, L.; Liao, J. Overselling overall map accuracy misinforms about research reliability. Landsc. Ecol. 2019, 34, 2487–2492. [Google Scholar] [CrossRef]
- Wu, W.; Zhao, S.; Zhu, C.; Jiang, J. A comparative study of urban expansion in Beijing, Tianjin and Shijiazhuang over the past three decades. Landsc. Urban Plan. 2015, 134, 93–106. [Google Scholar] [CrossRef]
- Yang, C.; Li, Q.; Hu, Z.; Chen, J.; Shi, T.; Ding, K.; Wu, G. Spatiotemporal evolution of urban agglomerations in four major bay areas of US, China and Japan from 1987 to 2017: Evidence from remote sensing images. Sci. Total Environ. 2019, 671, 232–247. [Google Scholar] [CrossRef]
- Wu, J.; He, S.; Peng, J.; Huang, X.; Zhang, L. Research on Spatial Characteristics of Urban Development Based on DMSP-OLS Data. Geogr. Inf. Sci. 2014, 30, 20–25. [Google Scholar]
- Liu, L. Urban sprawl metricsbased on nighttime light data for metropolitan areas. Remote Sens. Land Resour. 2018, 30, 208–213. [Google Scholar]
- Yang, Y.; Ma, M.; Ge, W. Spatial characteristics of urban development in Beijing using nighttime light data. Remote Sens. Inf. 2019, 34, 41–50. [Google Scholar]
- Zhan, X.; Pan, W.; Cai, Y.; Zheng, P. Research of urban expansion measures based on multi-source remote sensing data—A case study of Xiamen City. J. Fuzhou Univ. Nat. Sci. Ed. 2017, 45, 355–361. [Google Scholar]
- Liu, Y.; Yin, G.; Ma, L.J. Local state and administrative urbanization in post-reform China: A case study of Hebi City, Henan Province. Cities 2012, 29, 107–117. [Google Scholar] [CrossRef]
- Yearbook of Xiamen Special Economic Zone. Available online: https://www.xm.gov.cn/zwgk/tqjj/xmjjtqnj/ (accessed on 20 June 2022).
- Silva, P.; Li, L. Mapping Urban Expansion and Exploring Its Driving Forces in the City of Praia, Cape Verde, from 1969 to 2015. Sustainability 2017, 9, 1434. [Google Scholar] [CrossRef]
- Gong, J.; Hu, Z.; Chen, W.; Liu, Y.; Wang, J. Urban expansion dynamics and modes in metropolitan Guangzhou, China. Land Use Policy 2018, 72, 100–109. [Google Scholar] [CrossRef]
- Rajkhowa, R. Light pollution and impact of light pollution. Int. J. Sci. Res. 2014, 3, 861–867. [Google Scholar]
- Lyytimäki, J. Nature’s nocturnal services: Light pollution as a non-recognised challenge for ecosystem services research and management. Ecosyst. Serv. 2013, 3, e44–e48. [Google Scholar] [CrossRef]
- Chepesiuk, R. Missing the Dark: Health Effects of Light Pollution. Environ. Health Perspect. 2009, 117, A20–A27. [Google Scholar] [CrossRef]
- Zielinska-Dabkowska, K.M.; Szlachetko, K.; Bobkowska, K. An Impact Analysis of Artificial Light at Night (ALAN) on Bats. A Case Study of the Historic Monument and Natura 2000 Wisłouj’scie Fortress in Gdansk, Poland. Int. J. Environ. Res. Public Health 2021, 18, 11327. [Google Scholar] [CrossRef]
- Komal, K.; Soumya, N.; Arif, A. Studying light pollution as an emerging environmental concern in India. J. Urban Manag. 2022, 11, 392–405. [Google Scholar]
- Yang, W.; Wang, X.; Zhang, K.; Ke, Z. COVID-19, Urbanization Pattern and Economic Recovery: An Analysis of Hubei, China. Int. J. Environ. Res. Public Health 2020, 17, 9577. [Google Scholar] [CrossRef]
- Shao, Z.; Tang, Y.; Huang, X.; Li, D. Monitoring work resumption of wuhan in the COVID-19 epidemic using 261 daily nighttime light. Photogramm. Eng. Remote Sens. 2021, 87, 197–206. [Google Scholar] [CrossRef]
- Tian, H.; Liu, Y.; Li, Y.; Wu, C.-H.; Chen, B.; Kraemer, M.U.G.; Li, B.; Cai, J.; Xu, B.; Yang, Q.; et al. An investigation of transmission control measures during the first 50 days of the COVID-19 epidemic in China. Science 2020, 368, 638–642. [Google Scholar] [CrossRef] [PubMed]
- Yearbook of Xiamen Special Economic Zone. Available online: https://www.xm.gov.cn/zfxxgk/xxgkznml/gmzgan/tjnj/ (accessed on 25 July 2022).
- People.cn. Available online: http://fj.people.com.cn/n2/2022/0620/c181466-40002275.html (accessed on 25 June 2022).
- Fujian Development and Reform Commission. Available online: https://fgw.fujian.gov.cn/zwgk/xwdt/sxdt/202207/t20220705_5946182.htm (accessed on 4 July 2022).
- Zielinska-Dabkowska, K.M.; Bobkowska, K. Rethinking Sustainable Cities at Night: Paradigm Shifts in Urban Design and City Lighting. Sustainability 2022, 14, 6062. [Google Scholar] [CrossRef]
- De Miguel, A.S.; Bennie, J.; Rosenfeld, E.; Dzurjak, S.; Gaston, K.J. First Estimation of Global Trends in Nocturnal Power Emissions Reveals Acceleration of Light Pollution. Remote Sens. 2021, 13, 3311. [Google Scholar] [CrossRef]
- LED Lighting and Dark Skies. Available online: http://www.flagstaffdarkskies.org/led-lighting-dark-skies/ (accessed on 25 July 2022).
- Xiamen Municipal People’s Government. Available online: http://www.xm.gov.cn/zt/xxgcddsjjlzqhjs/pljd/202206/t20220614_2667272.htm (accessed on 25 June 2022).


| Linear Regression Parameter | Before Correction | After Correction |
|---|---|---|
| Regression model | y = 0.0745x − 2138.8 | y = 37.527x + 69,963 |
| R2 | 0.8963 | 0.9152 |
| p-value (intercept) | 7.85 × 10⁻¹⁸ | 1.98 × 10⁻¹² |
| p-value (x variable) | 9.22 × 10⁻¹⁵ | 1.56 × 10⁻¹⁶ |
| Map Data | Reference Data | ||||
|---|---|---|---|---|---|
| j = 1 | j = 2 | j = J | Map Total | UA | |
| i = 1 | |||||
| i = 2 | |||||
| i = J | |||||
| Reference total | N | ||||
| PA | |||||
| Year | PA | UA | F-Score | OA | Kappa |
|---|---|---|---|---|---|
| 1995 | 69.57% | 80.38% | 74.59% | 97.93% | 73.51% |
| 2000 | 75.51% | 72.70% | 74.08% | 97.33% | 72.67% |
| 2005 | 72.13% | 79.47% | 75.62% | 96.02% | 73.46% |
| 2010 | 70.43% | 85.94% | 77.42% | 92.51% | 72.98% |
| 2015 | 80.79% | 78.76% | 79.76% | 91.96% | 74.75% |
| 2020 | 80.29% | 83.46% | 81.85% | 90.16% | 75.09% |
| Type | Phase I 1995–2000 | Phase II 2000–2005 | Phase III 2005–2010 | Phase IV 2010–2015 | Phase V 2015–2020 | Study Phase 1995–2020 |
|---|---|---|---|---|---|---|
| Expansion area (km2) | 28.620 | 43.190 | 112.170 | 61.123 | 104.116 | 349.219 |
| Expansion speed (km2/year) | 5.724 | 8.638 | 22.434 | 12.225 | 20.823 | 13.968 |
| Expansion intensity (%) | 0.337 | 0.508 | 1.319 | 0.719 | 1.225 | 0.821 |
| Expansion contribution rate (%) | 8.194 | 12.368 | 32.120 | 17.503 | 29.814 | 100.000 |
| Year | Migration Distance (m) | Migration Speed (m/year) | Migration Angle (Degrees) |
|---|---|---|---|
| 1995–2000 | 923.52 | 184.70 | Southwest 53.41° |
| 2000–2005 | 628.23 | 125.65 | Northeast 86.70° |
| 2005–2010 | 6600.03 | 1320.01 | Northeast 86.40° |
| 2010–2015 | 759.06 | 151.81 | East-north 60.02° |
| 2015–2020 | 2380.21 | 476.04 | East-north 53.83° |
| 1995–2020 | 8757.15 | 350.29 | Northeast 74.88° |
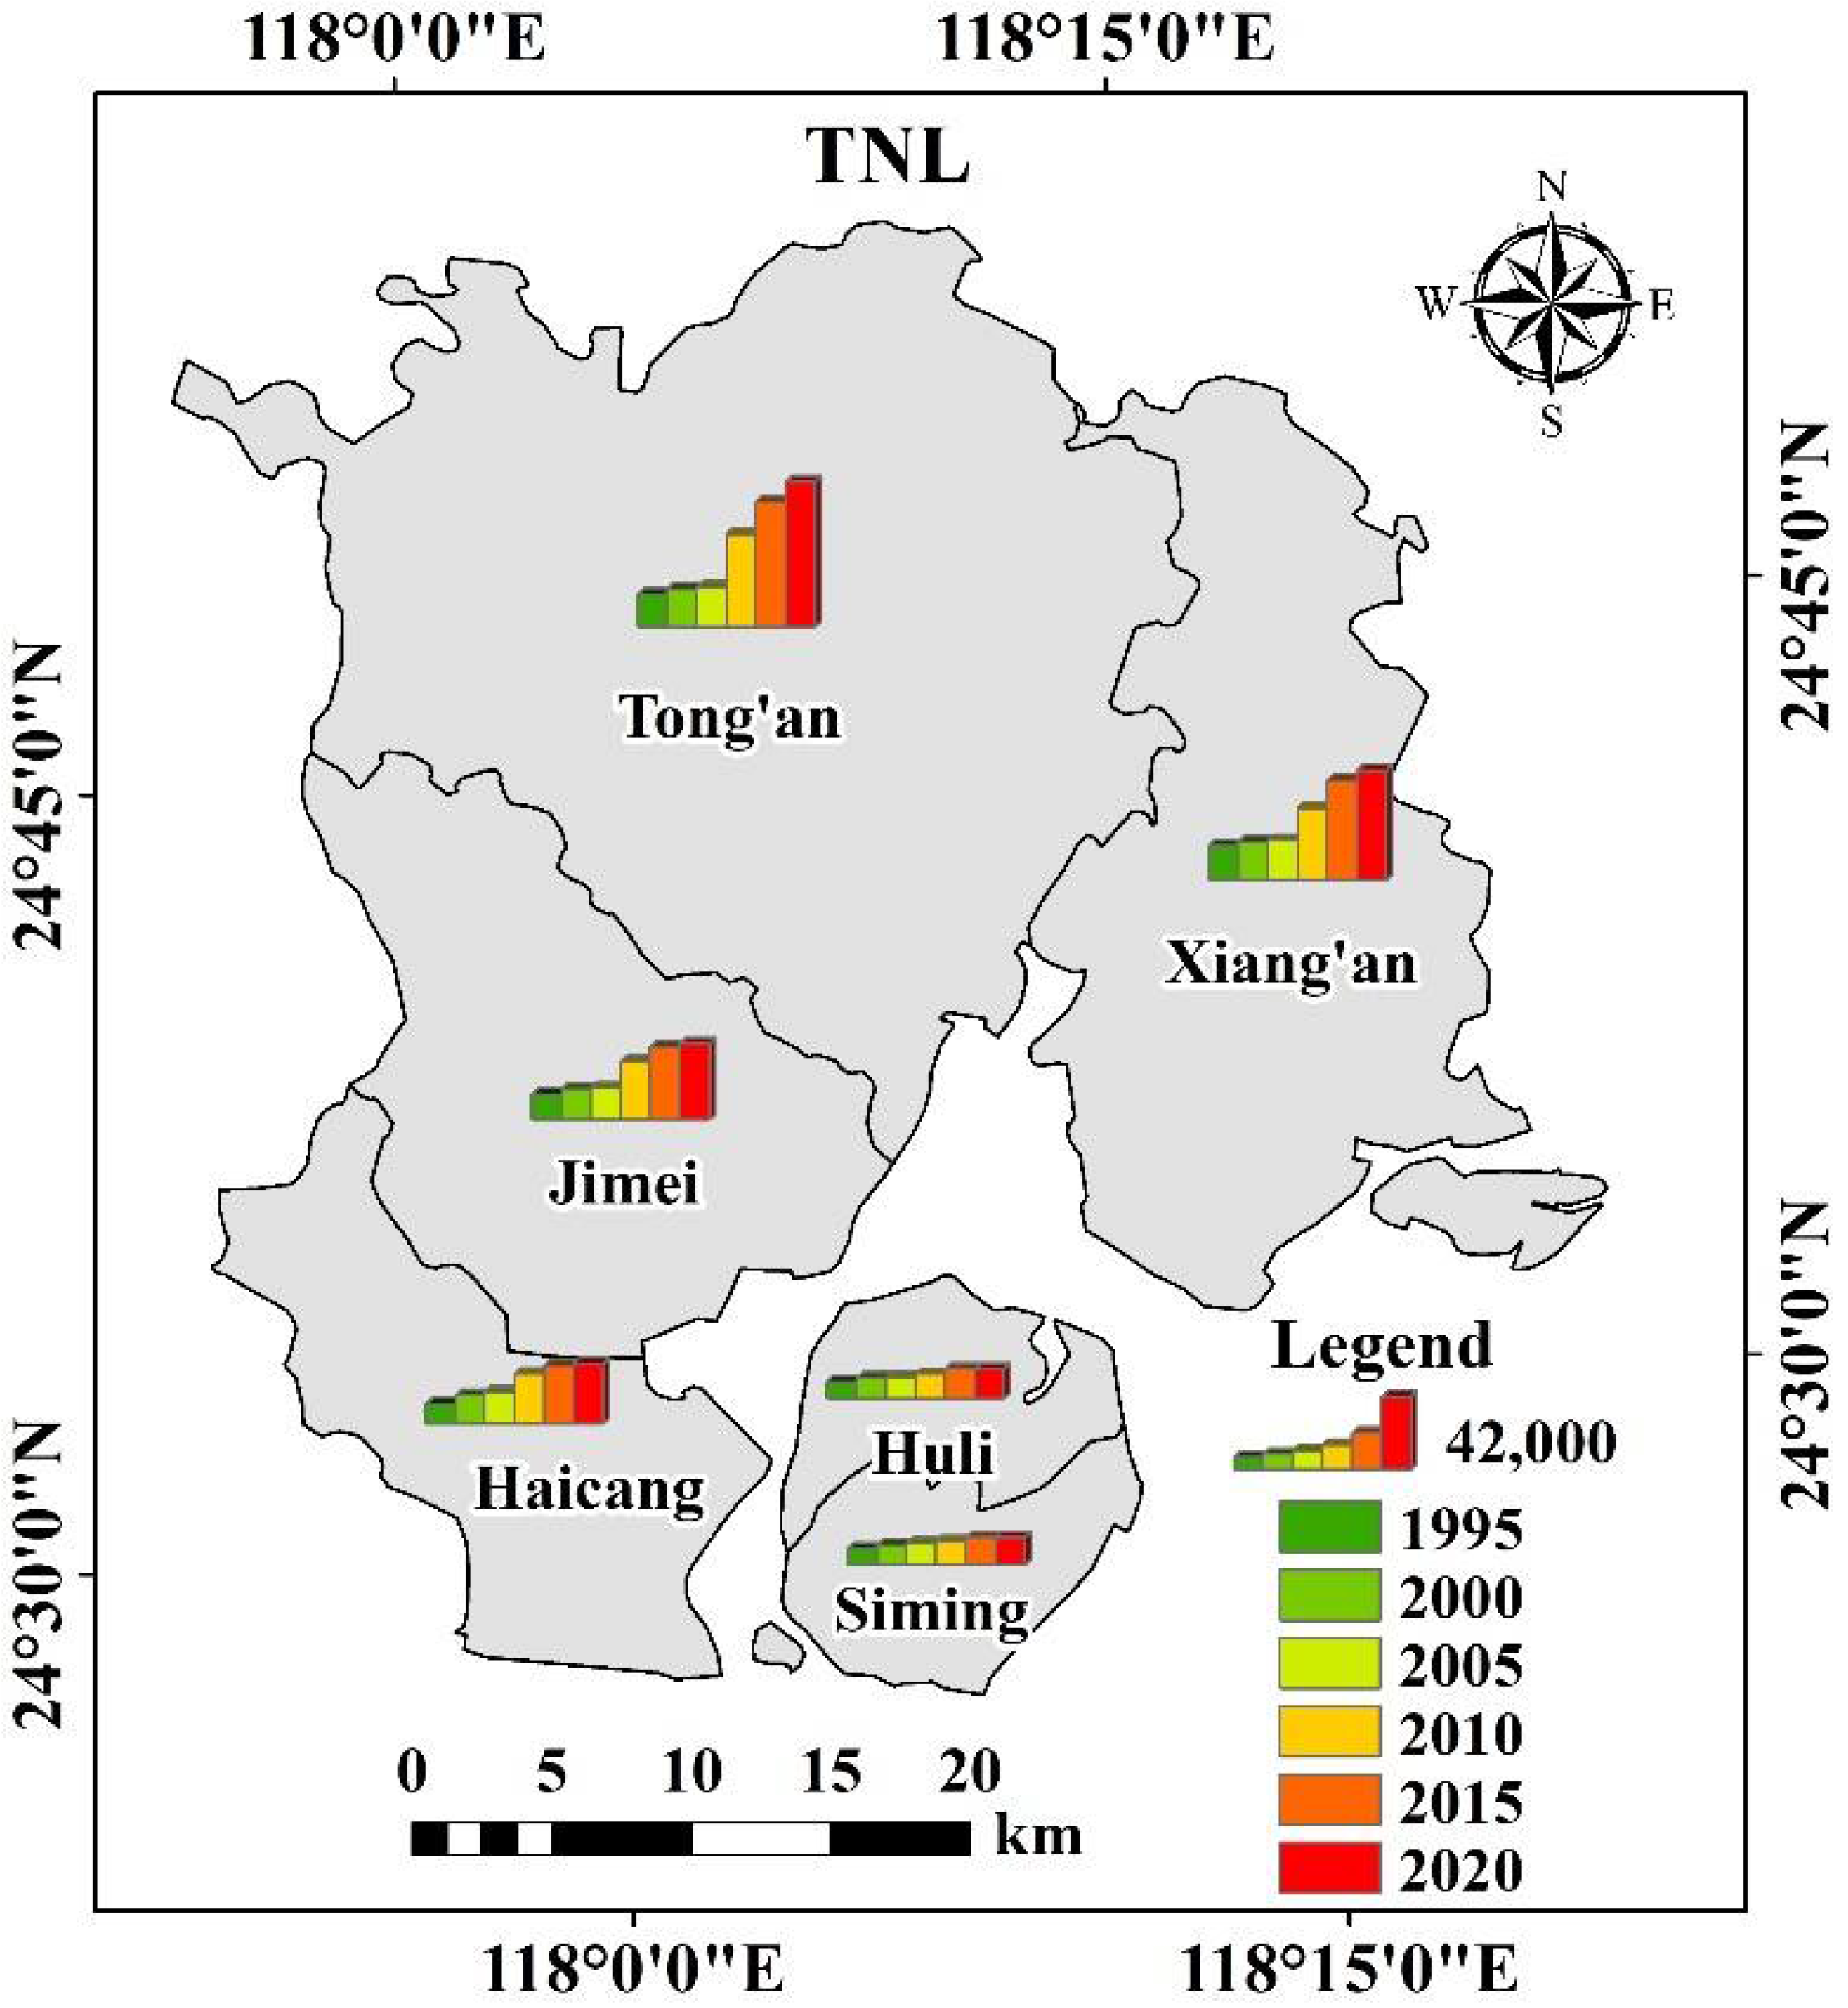
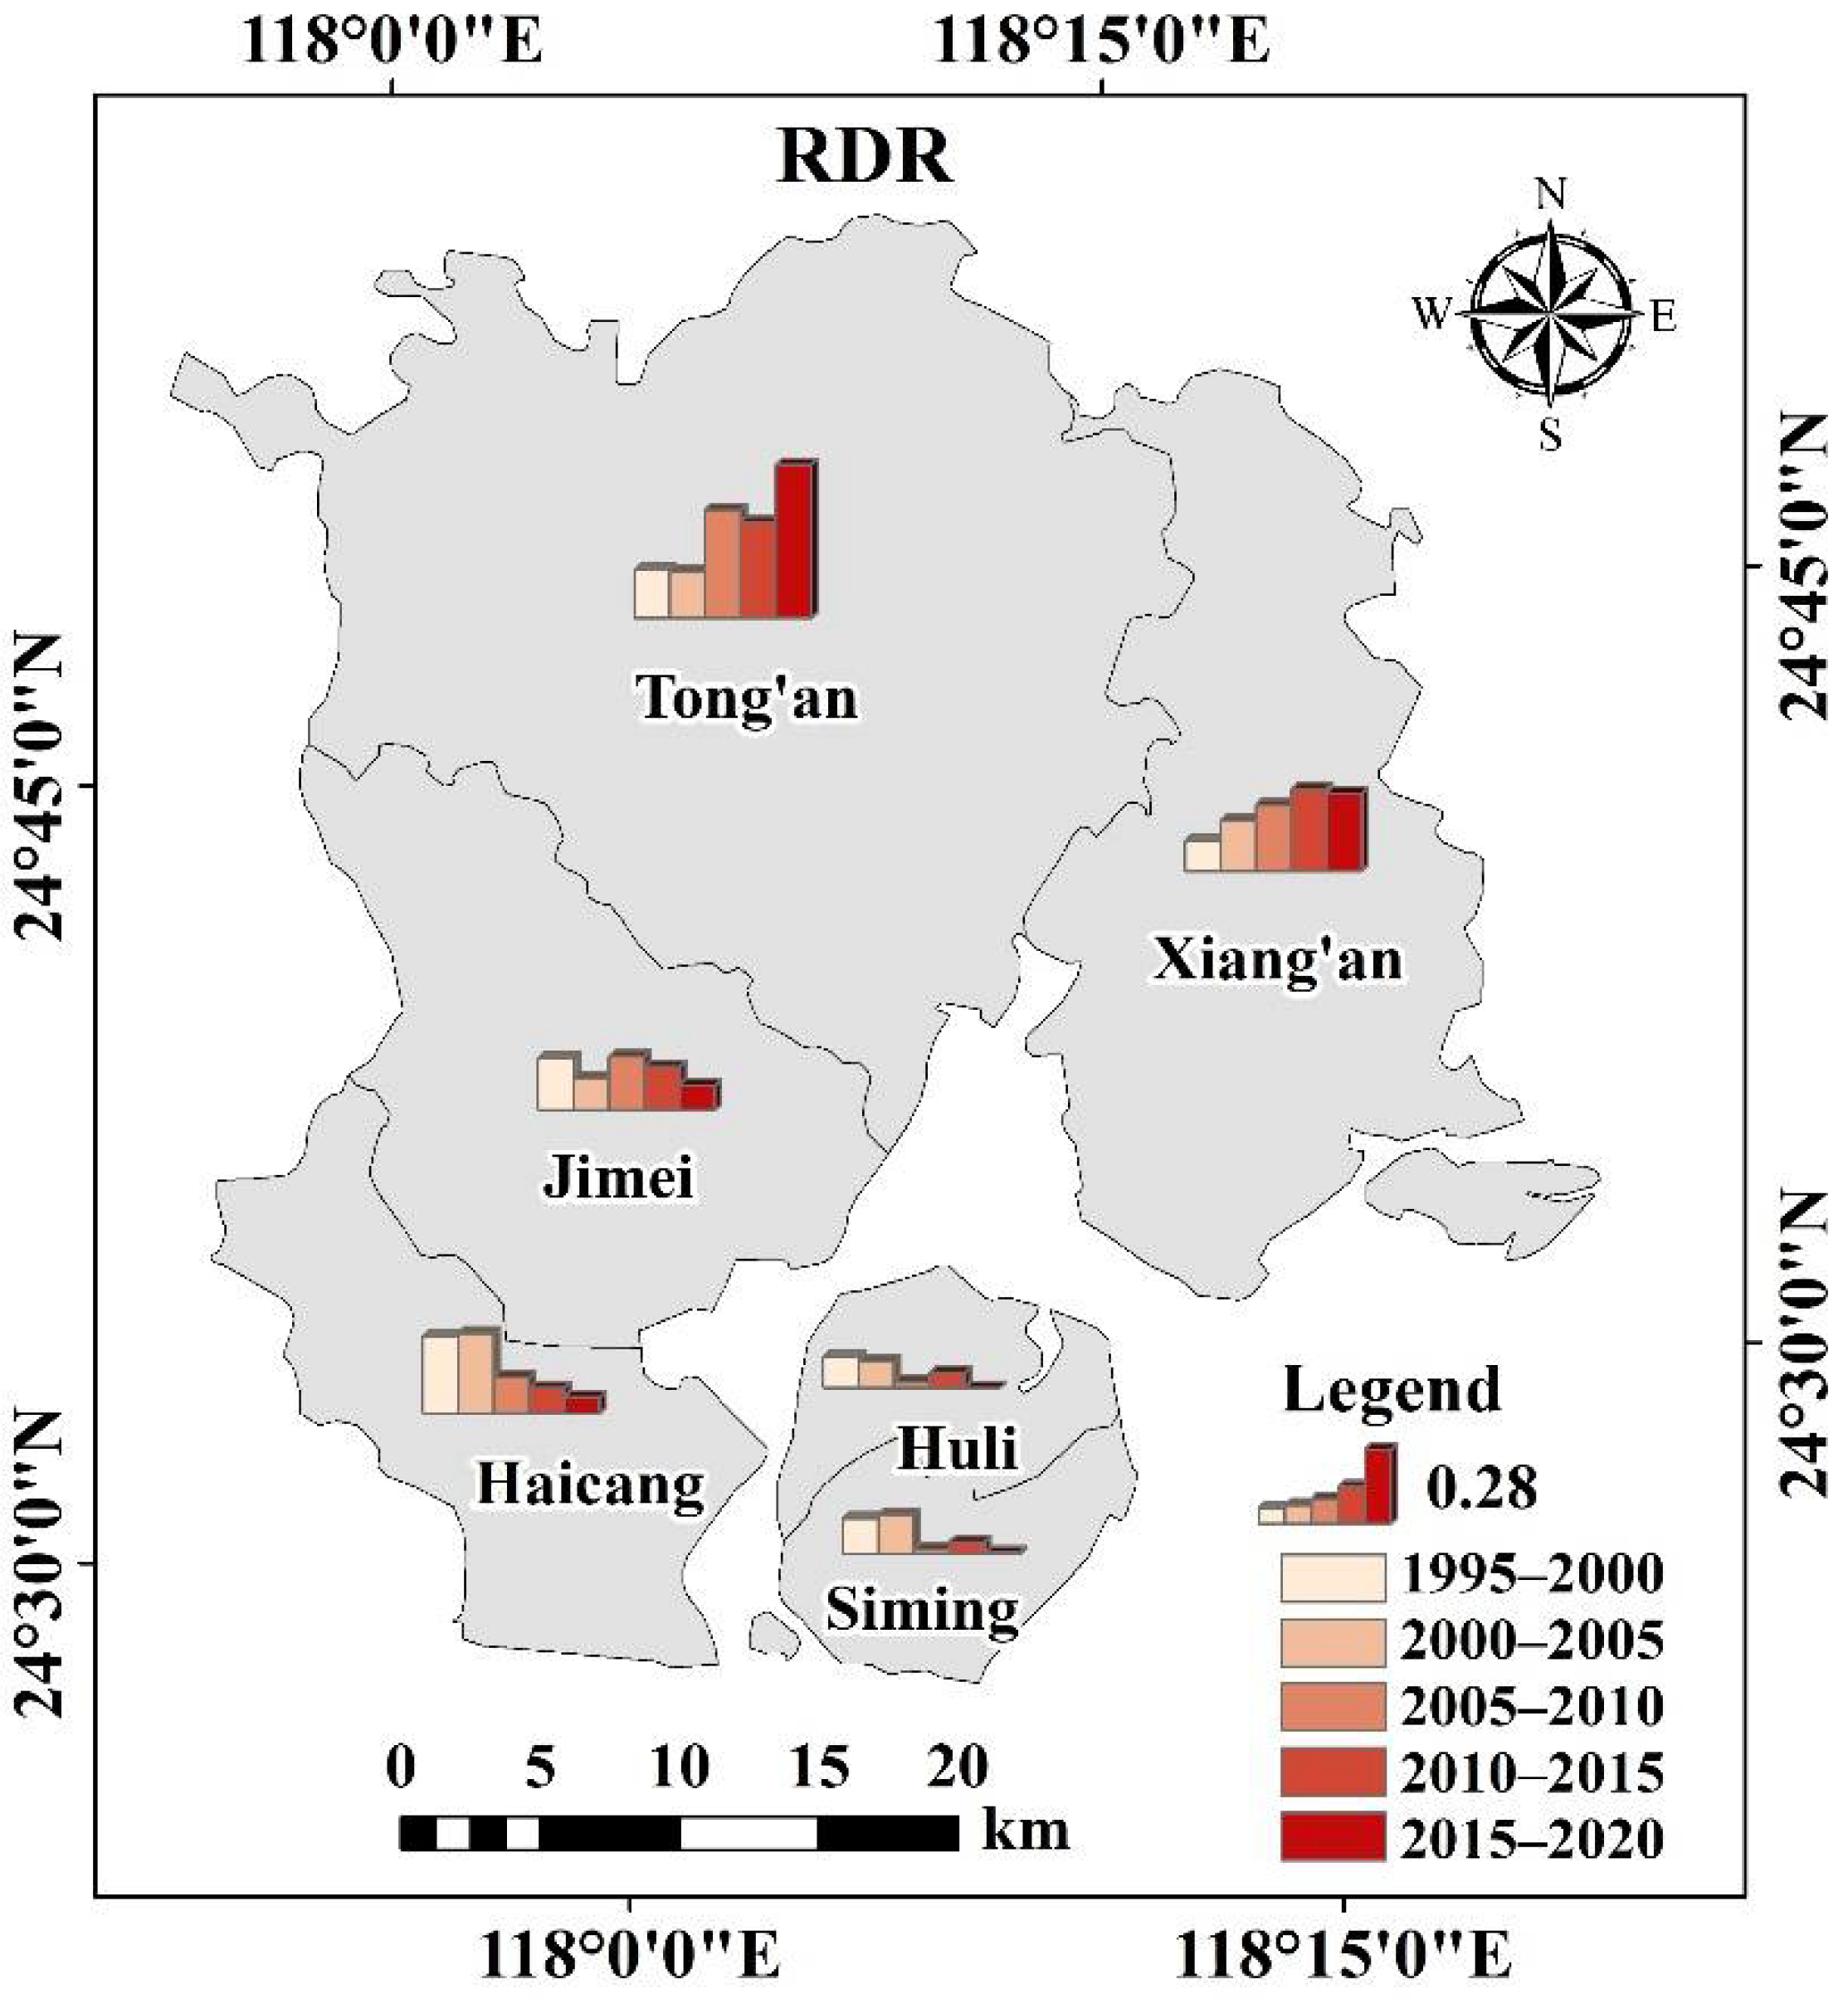
| City District | Total Number of Lights in Each District of Xiamen | |||||
|---|---|---|---|---|---|---|
| 1995 | 2000 | 2005 | 2010 | 2015 | 2020 | |
| Siming | 9147.25 | 11,429.47 | 12,236.55 | 13,417.43 | 15,644.09 | 15,735.82 |
| Huli | 9471.22 | 11,498.32 | 12,032.67 | 13,683.39 | 16,555.98 | 16,565.98 |
| Haicang | 11,454.28 | 16,431.84 | 18,075.49 | 28,413.13 | 33,295.08 | 34,538.67 |
| Jimei | 14,184.38 | 17,474.29 | 18,129.42 | 33,351.99 | 41,682.25 | 43,563.67 |
| Tong’an | 18,296.26 | 21,430.37 | 22,385.11 | 53,247.78 | 71,690.61 | 83,531.76 |
| Xiang’an | 19,894.74 | 21,872.44 | 22,907.88 | 41,616.64 | 57,327.99 | 63,330.82 |
| TNL | 82,448.13 | 100,136.73 | 105,767.12 | 183,730.37 | 236,196.01 | 257,266.73 |
| Mean | 13,741.35 | 16,689.46 | 17,627.85 | 30,621.73 | 39,366.00 | 42,877.79 |
| SD | 4150.87 | 4176.07 | 4307.64 | 14,306.49 | 20,382.84 | 24,392.90 |
| CV | 0.30 | 0.25 | 0.24 | 0.47 | 0.52 | 0.57 |
Publisher’s Note: MDPI stays neutral with regard to jurisdictional claims in published maps and institutional affiliations. |
© 2022 by the authors. Licensee MDPI, Basel, Switzerland. This article is an open access article distributed under the terms and conditions of the Creative Commons Attribution (CC BY) license (https://creativecommons.org/licenses/by/4.0/).
Share and Cite
Chai, C.; He, Y.; Yu, P.; Zheng, Y.; Chen, Z.; Fan, M.; Lin, Y. Spatiotemporal Evolution Characteristics of Urbanization in the Xiamen Special Economic Zone Based on Nighttime-Light Data from 1992 to 2020. Land 2022, 11, 1264. https://doi.org/10.3390/land11081264
Chai C, He Y, Yu P, Zheng Y, Chen Z, Fan M, Lin Y. Spatiotemporal Evolution Characteristics of Urbanization in the Xiamen Special Economic Zone Based on Nighttime-Light Data from 1992 to 2020. Land. 2022; 11(8):1264. https://doi.org/10.3390/land11081264
Chicago/Turabian StyleChai, Chunfang, Yuanrong He, Peng Yu, Yuanmao Zheng, Zhicheng Chen, Menglin Fan, and Yongpeng Lin. 2022. "Spatiotemporal Evolution Characteristics of Urbanization in the Xiamen Special Economic Zone Based on Nighttime-Light Data from 1992 to 2020" Land 11, no. 8: 1264. https://doi.org/10.3390/land11081264
APA StyleChai, C., He, Y., Yu, P., Zheng, Y., Chen, Z., Fan, M., & Lin, Y. (2022). Spatiotemporal Evolution Characteristics of Urbanization in the Xiamen Special Economic Zone Based on Nighttime-Light Data from 1992 to 2020. Land, 11(8), 1264. https://doi.org/10.3390/land11081264