Article

Coupling Coordination Analysis of the Ecology and Economy in the Yellow River Basin under the Background of High-Quality Development

1
School of Public Policy and Management, China University of Mining and Technology, Xuzhou 221116, China
2
Jiangsu Key Laboratory of Resources and Environmental Information Engineering, China University of Mining and Technology, Xuzhou 221116, China
3
College of Land Science and Technology, China Agricultural University, Beijing 100091, China
4
Institute of Territorial and Spatial Planning of Inner Mongolia, Hohhot 750306, China
*
Author to whom correspondence should be addressed.
Land 2022, 11(8), 1235; https://doi.org/10.3390/land11081235
Submission received: 14 July 2022 / Revised: 1 August 2022 / Accepted: 3 August 2022 / Published: 4 August 2022

Abstract

:
The concept of high-quality development has become the current theme of China’s economic construction. High-quality development requires maintaining a healthy and cyclical approach to economic development, which is a challenge in the original development approach. Yet, a great deal of evidence suggests that there is a strong interrelationship between economic development and the ecological environment, and developing a method to quantify this interrelationship is important for studying the extent of high-quality development. Here, we propose a new indicator system using the coupling degree model and the coupling coordination degree model to assess the coupled coordination of economic development and the ecological environment in the Yellow River basin as a whole and in each province. We found that: (1) the economic development and ecological health of the Yellow River basin exhibit a slowly increasing trend; (2) the coupling degree of the economic development and ecological environment is high, indicating that the interaction between the economy and ecology is very strong; and (3) the increasing degree of coupling and coordination reflects the trend of continuous improvement and coordination in the relationship between the economy and ecological environment, and the level of high-quality development in the basin has continuously increased. The results of this study indicate that to continue to strengthen the high-quality development in the Yellow River basin, the contradiction between the economy and ecology should be alleviated, and coordinated development of both should be achieved.

1. Introduction

To ensure the continuous harmony between people’s lives and efficient economic growth, the theme of China’s economic development has changed from the pursuit of quantity to the pursuit of quality [1], and the concept of high-quality development has gradually become the theme of China’s economic construction. High-quality development is a green and recyclable economic development model based on the concept of environmentally friendly and sustainable development [2]. Many developing countries have neglected ecological protection and have relied on the principle of environmental destruction in exchange for economic development during the historical development process [3,4]. Therefore, the balanced development of the economy and ecology has become a research hotspot in the context of high-quality development.
Academics have conducted various studies on high-quality economic development, including not only the evaluation of healthy macroeconomic development [5,6] but also the coupled development of the logistics industry and the economy [7], the impact of service industry aggregation on high-quality development [8], and the study of coordinated development of the environment and the economy. For example, LIU et al. analyzed the impact of environmental adjustment on high-quality economic development in China [9], LIN et al. studied the relationship between environmental regulations, green technological innovation and high-quality economic development [10], and LI et al. studied the spatial coupling between ecological quality and economically poor areas [11]. These studies suggest that there is a strong interrelationship between economic development and ecological protection, and sustainable development can only be achieved by attaining simultaneous economic and ecological development [12,13,14].
Existing studies mainly simulate and quantify the degree of coordinated economic and ecological development by establishing various types of evaluation models, such as the gravity model [15], the pressure–state–response model [16], and the coupling coordination degree model [17]. All these models can quantitatively evaluate the interactions of two or more subsystems. Among these methods, the coupling coordination degree model is more common, which includes two indicators, coupling degree and coupling coordination degree, and can visually reflect the degree of interrelationship between different systems, and is suitable for studies on urbanization [18], tourism development [19], and water–energy–food security [20,21], and can also be used to quantify the level of regional high-quality development. However, although these studies constructed coupled coordination models, which characterizes the relationship between economy and ecology, according to the actual problems, their results may be mis-leading and biased due to the use of too many evaluation elements. In addition, the criteria for evaluating the quality and quantity of economic development are different, and, subsequently, the corresponding coupling coordination results obtained are different. Moreover, they lack the particular specification of high-quality development; therefore, the evaluation of coupled coordination models under the scope of high-quality requirements for economic development is needed.
The Yellow River is the second largest river in China and the birthplace of the Chinese nation [22]. The changes in the development pattern of the Yellow River basin has had a great impact on human production and life [23]. In this study, we investigate the economic development and ecological status in the Yellow River basin from 2010 to 2019, as well as the degree of coupling and coordination between the two, using the Yellow River basin as the object of study and the provincial administrative unit as the statistical unit of the data. Specifically, we answer the following questions: (1) what was and is the quality of the development in the Yellow River basin? (2) Can changes in the ecological and environmental coupling coordination degree provide support for ecological security and comprehensive development decision-making in the Yellow River basin?

2. Research Methods and Data Sources

2.1. Study Area

The Yellow River is the second longest river in China, with a main stream length of about 5464 km and an east–west length of about 1900 km. The Yellow River basin is located in northern-central China, covering nine provinces and regions, including Qinghai, Sichuan, Gansu, Ningxia, Inner Mongolia, Shaanxi, Shanxi, Henan, and Shandong, with an area of about 795,000 km2 (Figure 1). The data were obtained from the statistical yearbooks, national economic and social development statistical bulletins, and environmental statistics annual reports for the provinces in the Yellow River basin.

2.2. Methods

2.2.1. Evaluation Index System

To accurately evaluate the interrelationship between the economy and the environment, two subsystems of economic development and the ecological environment were established (Table 1). To ensure the scientific nature and operability of this study [24,25,26,27], 10 indicators were selected for measurement, considering the requirements of quality economic development and the indicators used frequently in previous studies. The sustainability of economic growth required for high-quality development can be reflected by a moderate and sufficient population size, a more mature economic volume, and a larger development input; therefore, three aspects were selected for the economic development subsystem: population indicators, economic volume, and development density. These three indicators reflect the structure of the industrial development in the basin and its economic differences, as well as the existing economic strength and future economic development potential, thus reflecting the essence of high-quality development. Population density, growth rate of fixed asset investment, gross domestic product (GDP) per capita, proportion of construction land, and proportion of tertiary industry were selected as secondary indicators.
In addition, the principle of being environmentally friendly which is required for high-quality development involves reducing pollution emissions, increasing pollution treatment, and increasing the ecological quality; therefore, three aspects were selected for the ecological environment subsystem: pollution emissions, pollution treatment, and ecological construction, reflecting the degree of damage and treatment of the watershed ecology. SO2 emissions, industrial wastewater emissions, sewage treatment plant treatment rate, green space coverage in built-up areas, and per capita water resources were selected as the corresponding secondary indicators.
Among these indicators, positive indicators are represented by +, meaning that larger quantities represent better economic or ecological conditions; negative indicators are represented by −, meaning that smaller quantities are better indicators.

2.2.2. Evaluation Process

Owing to the differences in the measurements of the data for each indicator, the data needed to be standardized. In this study, the provincial administrative unit was taken as the statistical unit, the data for the nine provinces varied greatly from one year to another, and when standardization was conducted, the different standardization methods often had a greater impact on the subsequent results. To eliminate the differences in the standardization process, the method of using the highest value in the formula for the extreme difference method, which is commonly used for standardization, was used in this study (Equations (1A)–(1C)). In addition, the data were first divided into positive and negative indicators.
x i j t = x i j min x i j max x i j min x i j   Positive indicators   max x i j x i j max x i j min x i j     Negative indicators ,
Here, it indicates the standardization of the data for the nine provinces for the calendar year.
x i j is the value of the second-level indicator; and x i j t is the value after standardization.
x i j t = x i j min x i max x i min x i   Positive indicators max x i x i j max x i min x i     Negative indicators ,
This means that the data for the same province over the years are regarded as a group of standardized objects, and the differences in the data for the years for each province are standardized.
x i denotes data from the same province and different years.
x i j t = x i j min x j max x j min x j   Positive indicators   max x j x i j max x j min x j     Negative indicators ,
Here, it means that the data for different provinces for the same year are considered to be a set of standardized objects, and the differences between the data for the different provinces for the same year are standardized. x j denotes the data for the different provinces in the same year.

2.2.3. Weight Calculation

Since both the economic development subsystem and the ecological environment subsystem are comprehensive and complex systems, in this study, the coefficient of variation is used to determine the weight of each indicator. This method can reflect the relative importance of the indicators more objectively, avoid the subjectivity of experts’ assigning weights, and prevent the influence of the weights owing to the different weighting of the indicators (Equation (2)). The results are presented in Table 1.
V j = σ j x ¯ j   j = 1 , 2 , , n ω j = V j j = 1 n V j j = 1 , 2 , , n ,
V j is the coefficient of variation of index   j ; σ j is the standard deviation of index j ; x ¯ j is the average of index j ; and ω j is the weight of index j .

2.2.4. Method of Evaluating the Coupling Coordination Degree

The economic development subsystem index is
U 1 = j = 1 n ω j d × x i j t ,
The ecological environment subsystem index is
U 2 = j = 1 n ω j e × x i j t ,
ω j d is the economic development subsystem index’s weight,   ω j e is the ecological environment subsystem index’s weight.
The coupling degree model and the coupling coordination degree model are as follows:
C = 2 U 1 U 2 U 1 + U 2 ,
D = C × T 1 2 T = α u 1 + β u 2 ,
C is the coupling degree of the two systems and reflects the strength of the interactions between the systems. The range of the coupling degree is (0, 1), the closer the coupling degree is to 1, the stronger the relationship between the economy and the ecosystem is. In contrast, when the coupling degree is close to 0, the relationship between the economy and the ecosystem is not obvious [14,25].
T is the comprehensive coordination index of the two systems, and α and β are the weights of the economic and ecological systems, respectively. Since economic growth and the ecological environment are equally important in high-quality development, α = β = 0.5.
D is the coupling coordination degree of the two systems, and the range of the coupling coordination degree is also (0, 1). The higher the value of D is, the higher the level of coupling coordination development is, that is, the more coordinated the development of the economy and ecosystem is [28]. According to the relevant research, the classification of the coupling degree is shown in Table 2. The classification of the coupling coordination degree is shown in Table 3.

2.2.5. Evaluation of Development Shortcomings

To promote high-quality development in the Yellow River basin, it is necessary to study the main factors that are hindering the economic development and level of the ecological environment. The development shortcomings evaluation model aims to screen out the factors that hinder targeted development. Therefore, this issue was further analyzed using Equation (7).
Q j = ω j 1 x i j t j = 1 m ω j 1 x i j t ,
ω j is the weight of the indicator; 1 x i j t is the deviation of the indicator, that is, the gap between a single indicator and the expected goal; and Q j is the value of the impact of a single factor on the economic development subsystem and the ecological environment subsystem.

3. Results

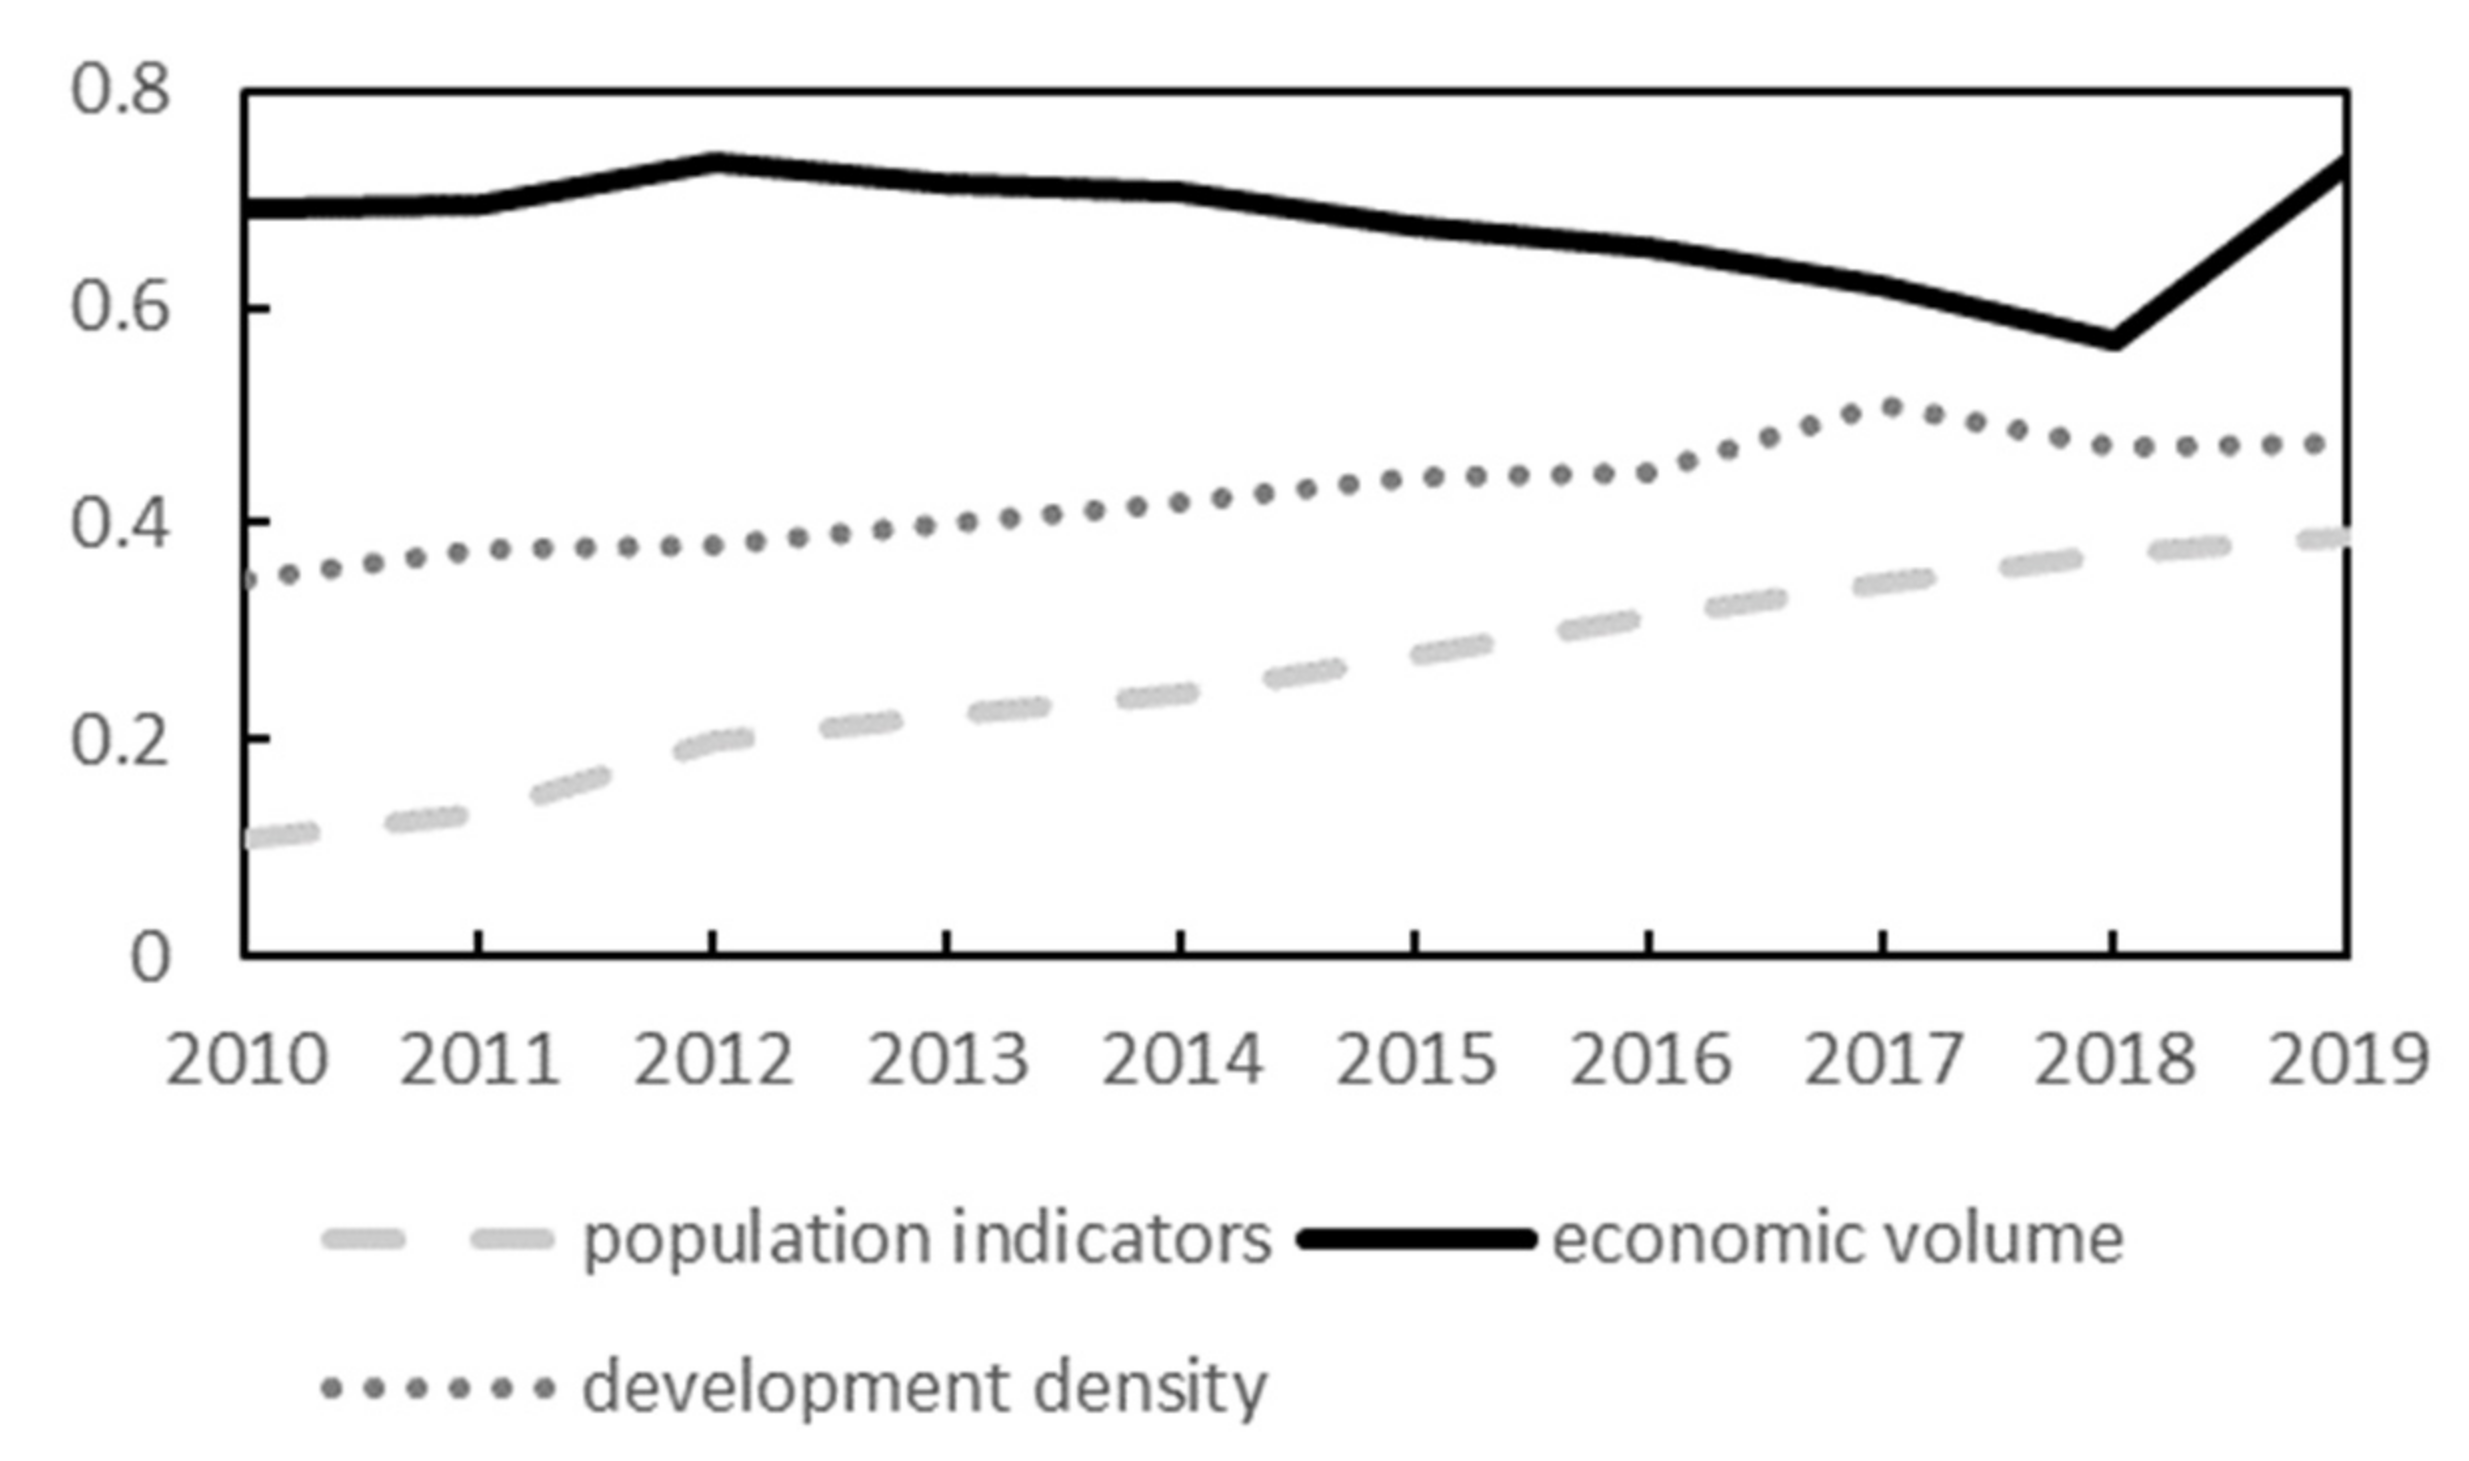
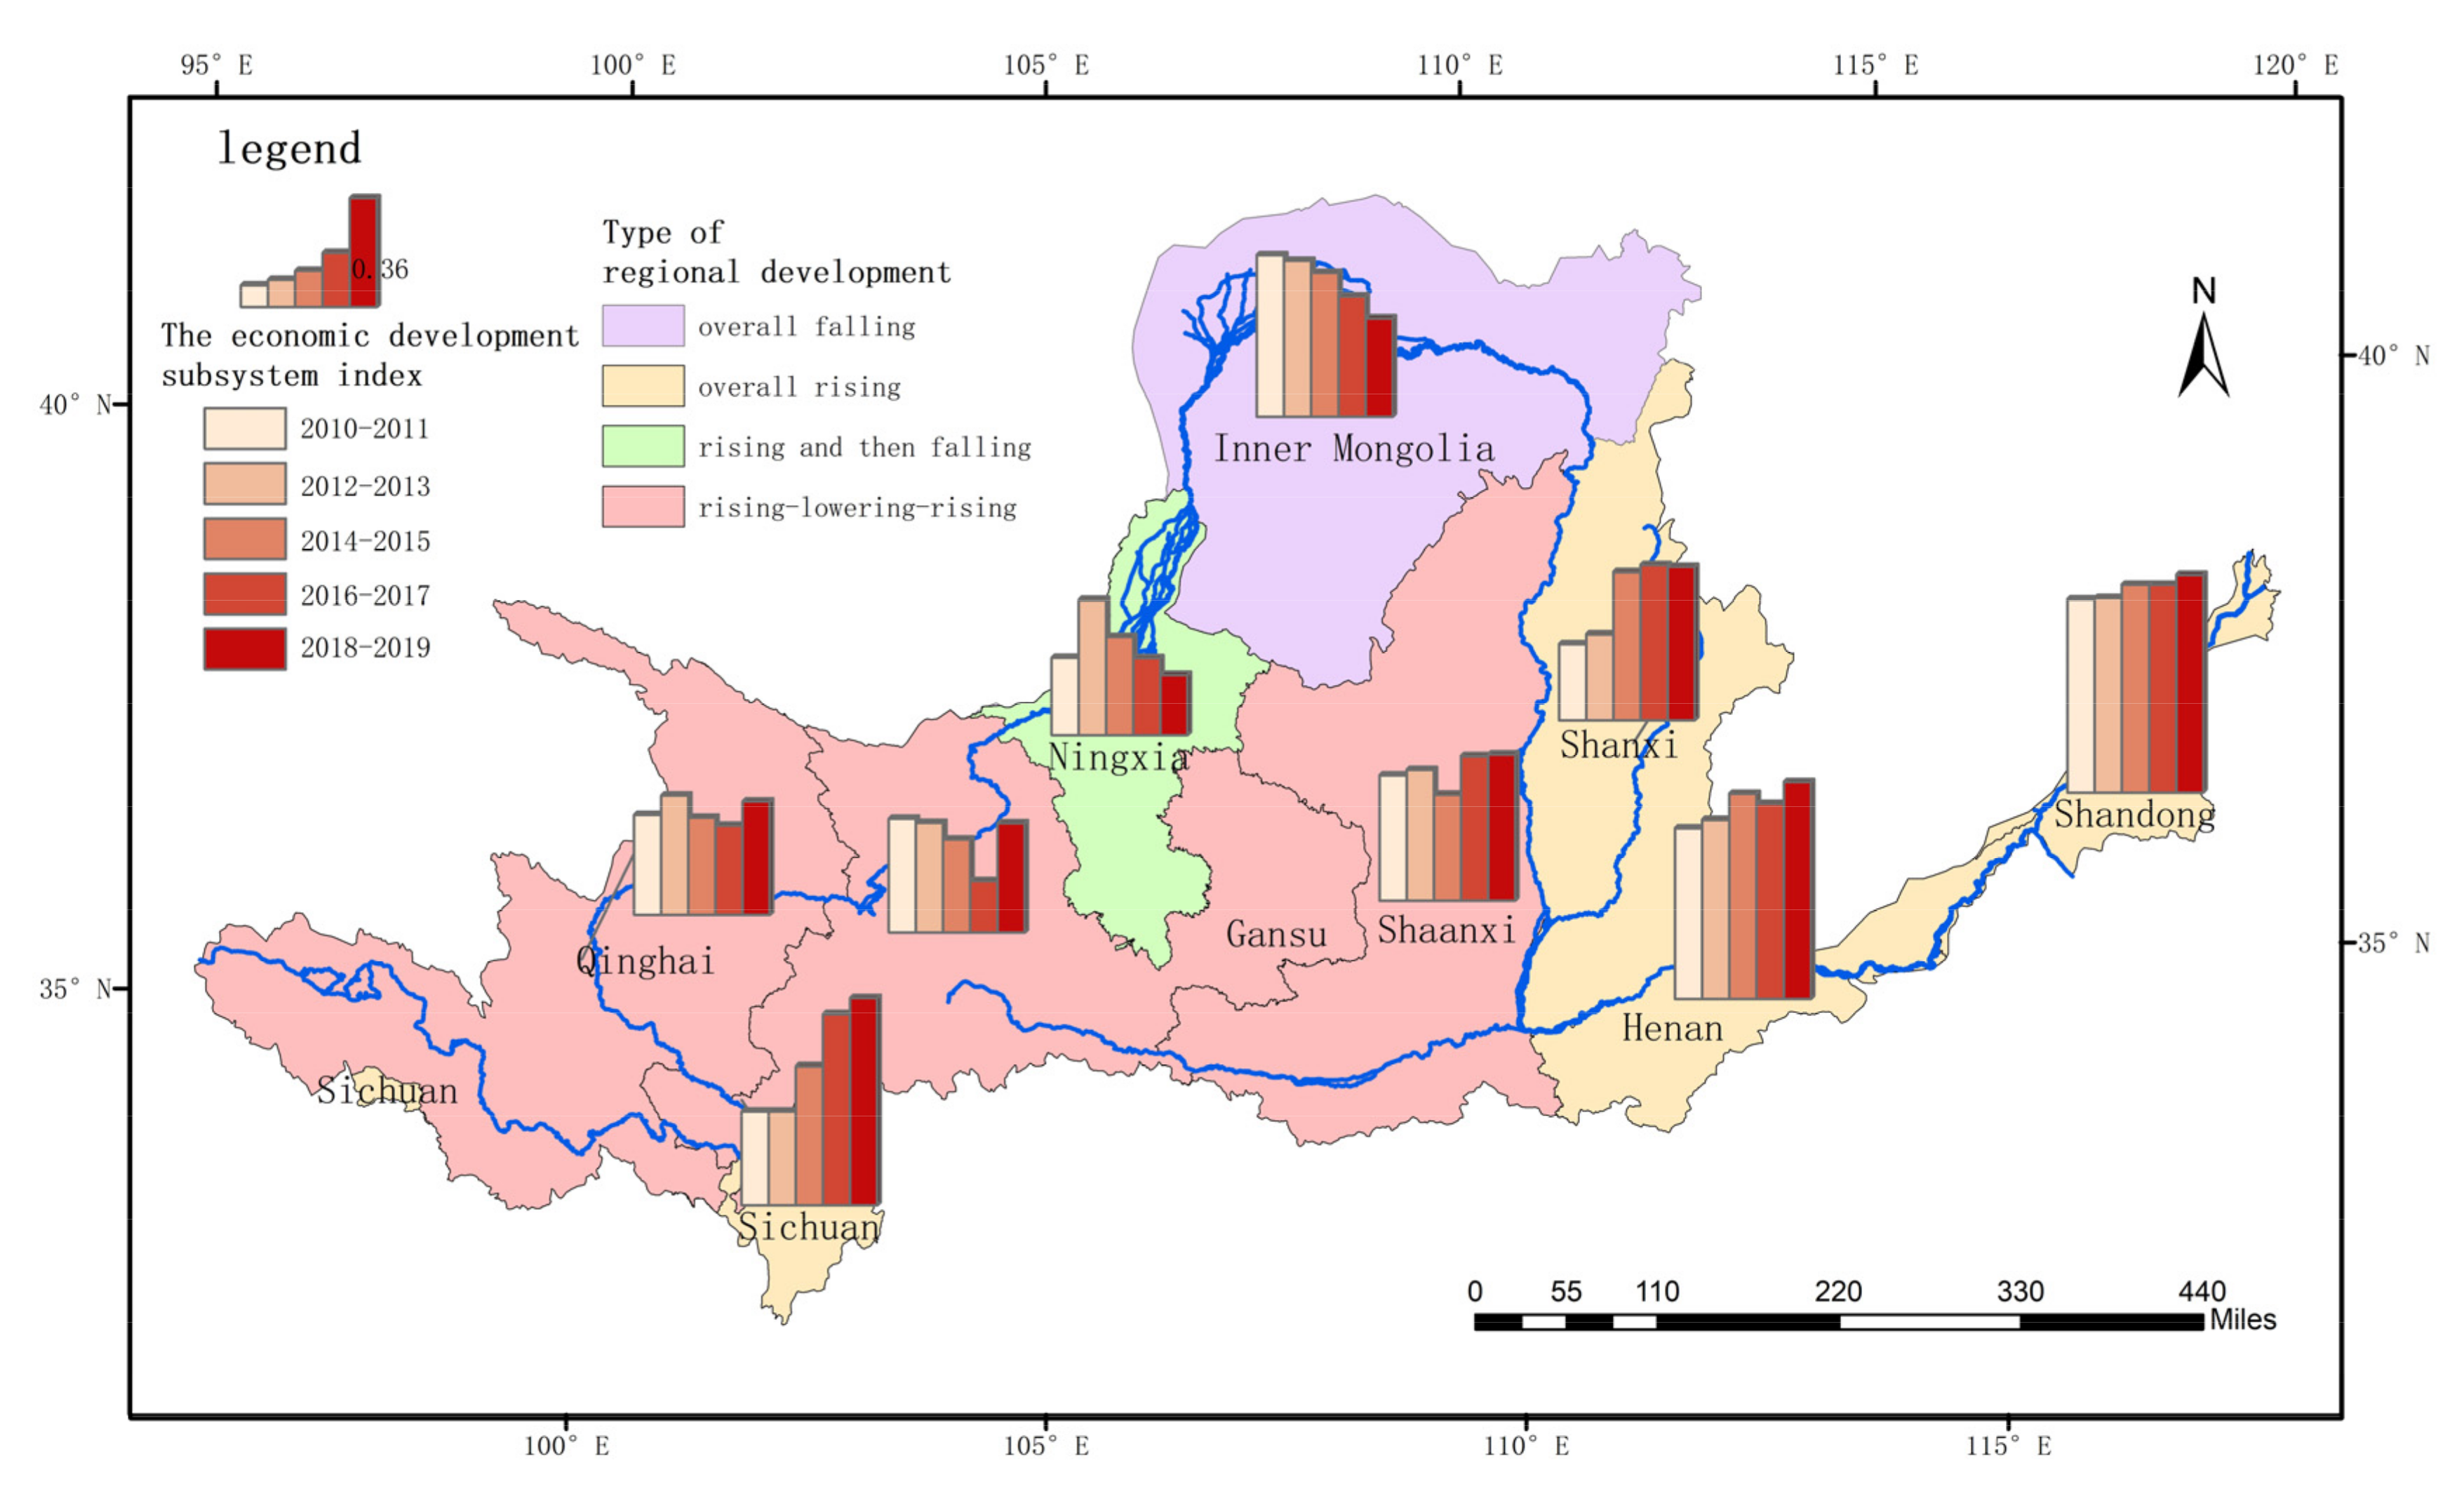
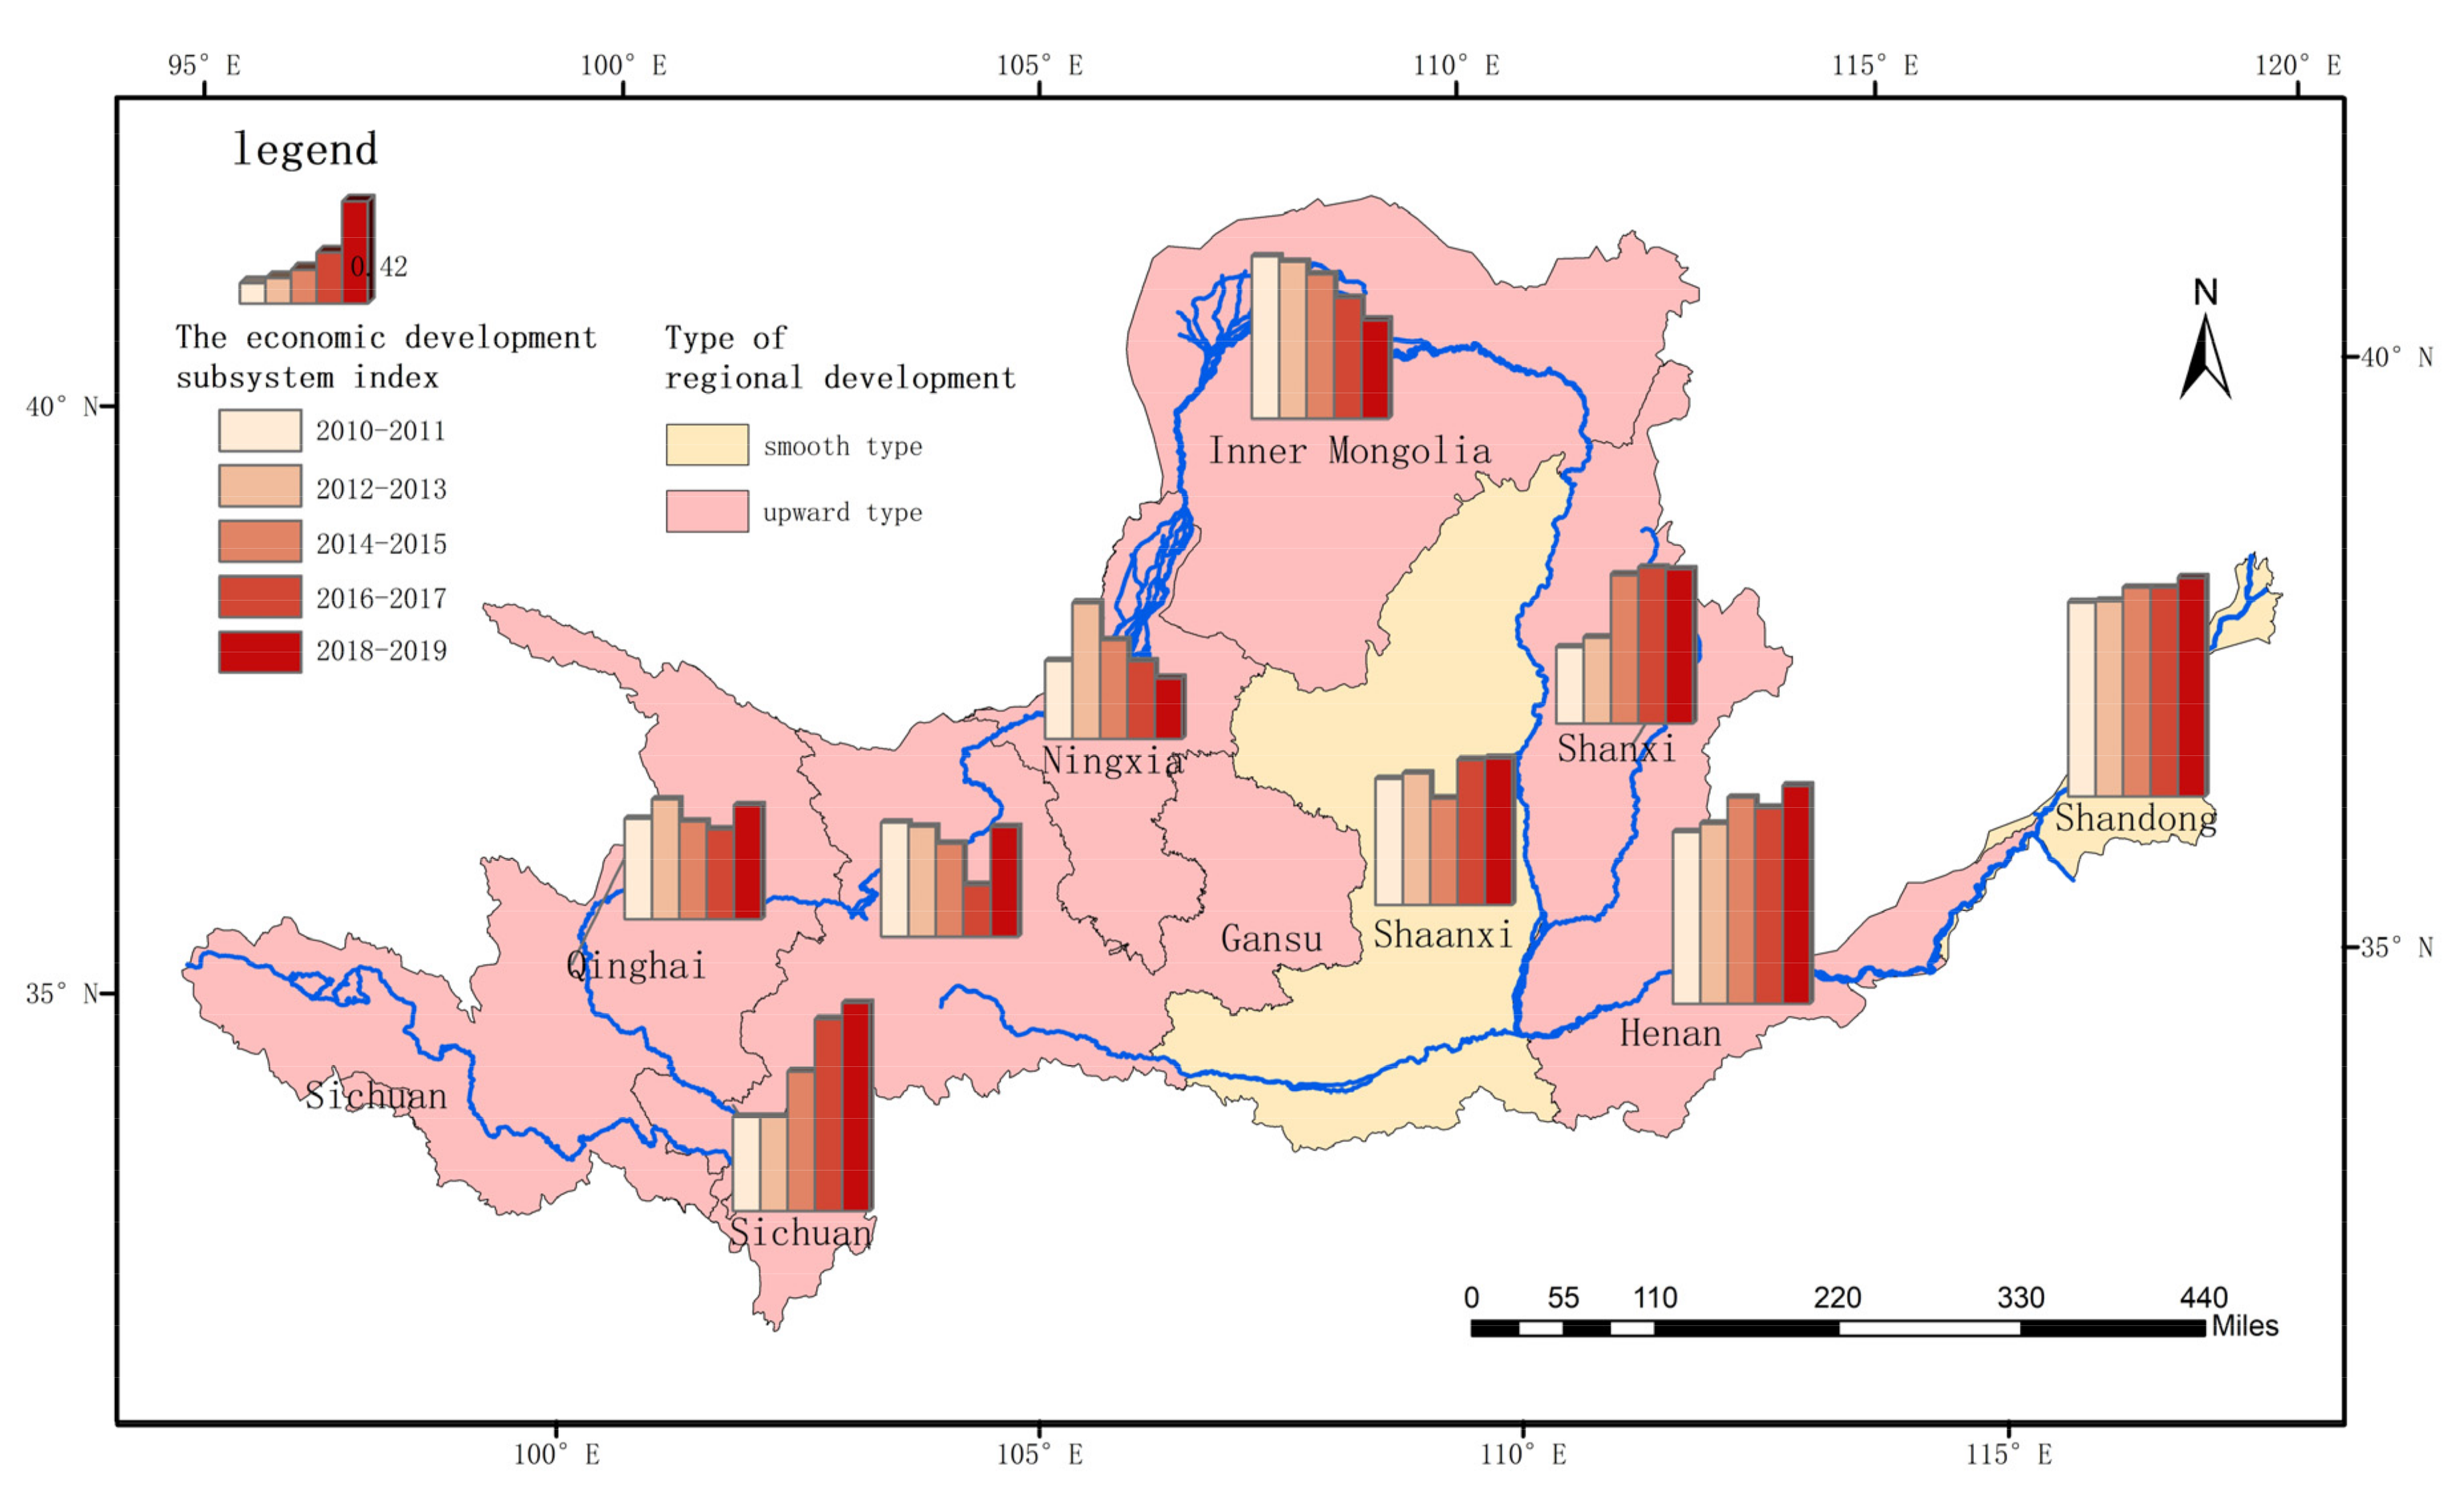
3.1. Analysis of the High-Quality Economic Development in the Yellow River Basin

Figure 2 shows the population indicators for the Yellow River basin, as well as the development of the economic volume and development density. The overall economic development in the Yellow River basin has exhibited an increasing trend over time, indicating continuous evolution of the Yellow River basin’s economy. The economic volume indicators continuously decreased between 2012 and 2018, owing to the general decline in the growth rate of the fixed asset investment during this period in each province. The industrial GDP of the Yellow River basin mainly relied on the development of mineral resources, especially coal resources, and the sharp decrease in the price of coal in China and the sharp decrease in the output value starting in 2012 led to a continuous decline in the GDP from 2012 to 2018. In 2018, China began to implement coal supply-side reform, pressing production in limited amounts, coal prices rebounded, the GDP rose, and the total economic output turned and began to increase. This indicates that, in general, the economy in the Yellow River basin was overly dependent on the mineral resource exploitation industry and the level of economic development cannot yet be regarded as high-quality development.
Figure 2 also shows that the population indicator continuously increased over time. However, in reality, the population was seriously unevenly distributed in the Yellow River basin. The population was mainly concentrated in the middle and lower reaches of the Shanxi, Henan, and Shandong provinces, with the population density in Henan Province reaching 655 persons/km2 in 2019, while the population density in Qinghai Province was only 8.4 people/km2 in 2019. This indicates that although the population did not increase significantly, the increase was mainly concentrated in the middle and lower reaches in the relatively developed basin provinces, and this uneven distribution of the population was not conducive to high-quality economic development.
The development density indicator increased slowly from 2010 to 2017, briefly declined from 2017 to 2018, and then continued to increase. The reversal in 2017 was due to the third national land survey conducted in China since 2017, which used the latest technology and the latest standards to re-survey and count land resources. This resulted in some of the original land types that were categorized in a confusing manner being reclassified as other land types, which, in turn, resulted in a larger magnitude of change in the urban area in 2018, with some provinces experiencing different degrees of shrinkage in this indicator.
The economic development in the different provinces in the Yellow River basin also varied widely, and all of provinces exhibited relatively volatile economic growth patterns (Figure 3), which can be roughly divided into four types: increasing and then decreasing, overall increasing, overall decreasing, and increasing–decreasing–increasing. The overall increasing provinces were Sichuan, Henan, Shanxi, and Shandong provinces, and Sichuan exhibited the largest average growth rate at 22%. The main reason why the overall economic levels of Sichuan and Shandong provinces were able to increase steadily is that the mineral resource development accounted for a smaller proportion of the GDP in these provinces, so that their GDPs were not as affected by the sharp drop in coal prices since 2012. The only province with an overall decreasing trend was Inner Mongolia, indicating that the intensity and density of economic development in Inner Mongolia was low. Ningxia province exhibited an initially increasing and then decreasing trend, and the decline was also larger, indicating that the quality of its economic development in recent years was not as good as in other provinces. Qinghai, Gansu, and Shaanxi exhibited increasing–decreasing–increasing trends, generally exhibiting economic growth during 2010–2014, reaching a maximum and starting to fall, and then exhibiting a better growth trend during 2016–2019, with a more volatile overall growth rate.
From the temporal perspective, by comparing the economic growth pattern in 2019 with that in 2010, it was found that the economic growth in Inner Mongolia deteriorated, that in Gansu and Ningxia it became slightly worse, and that in the other provinces it improved. The quality of the economic development in each province varied significantly, with Shandong, Sichuan, and Henan having better economic growth patterns during 2018–2019, scoring around 0.7. Inner Mongolia and Ningxia had lower levels, scoring below 0.35. Shandong Province had the best economic development pattern among the nine provinces analyzed in this study.

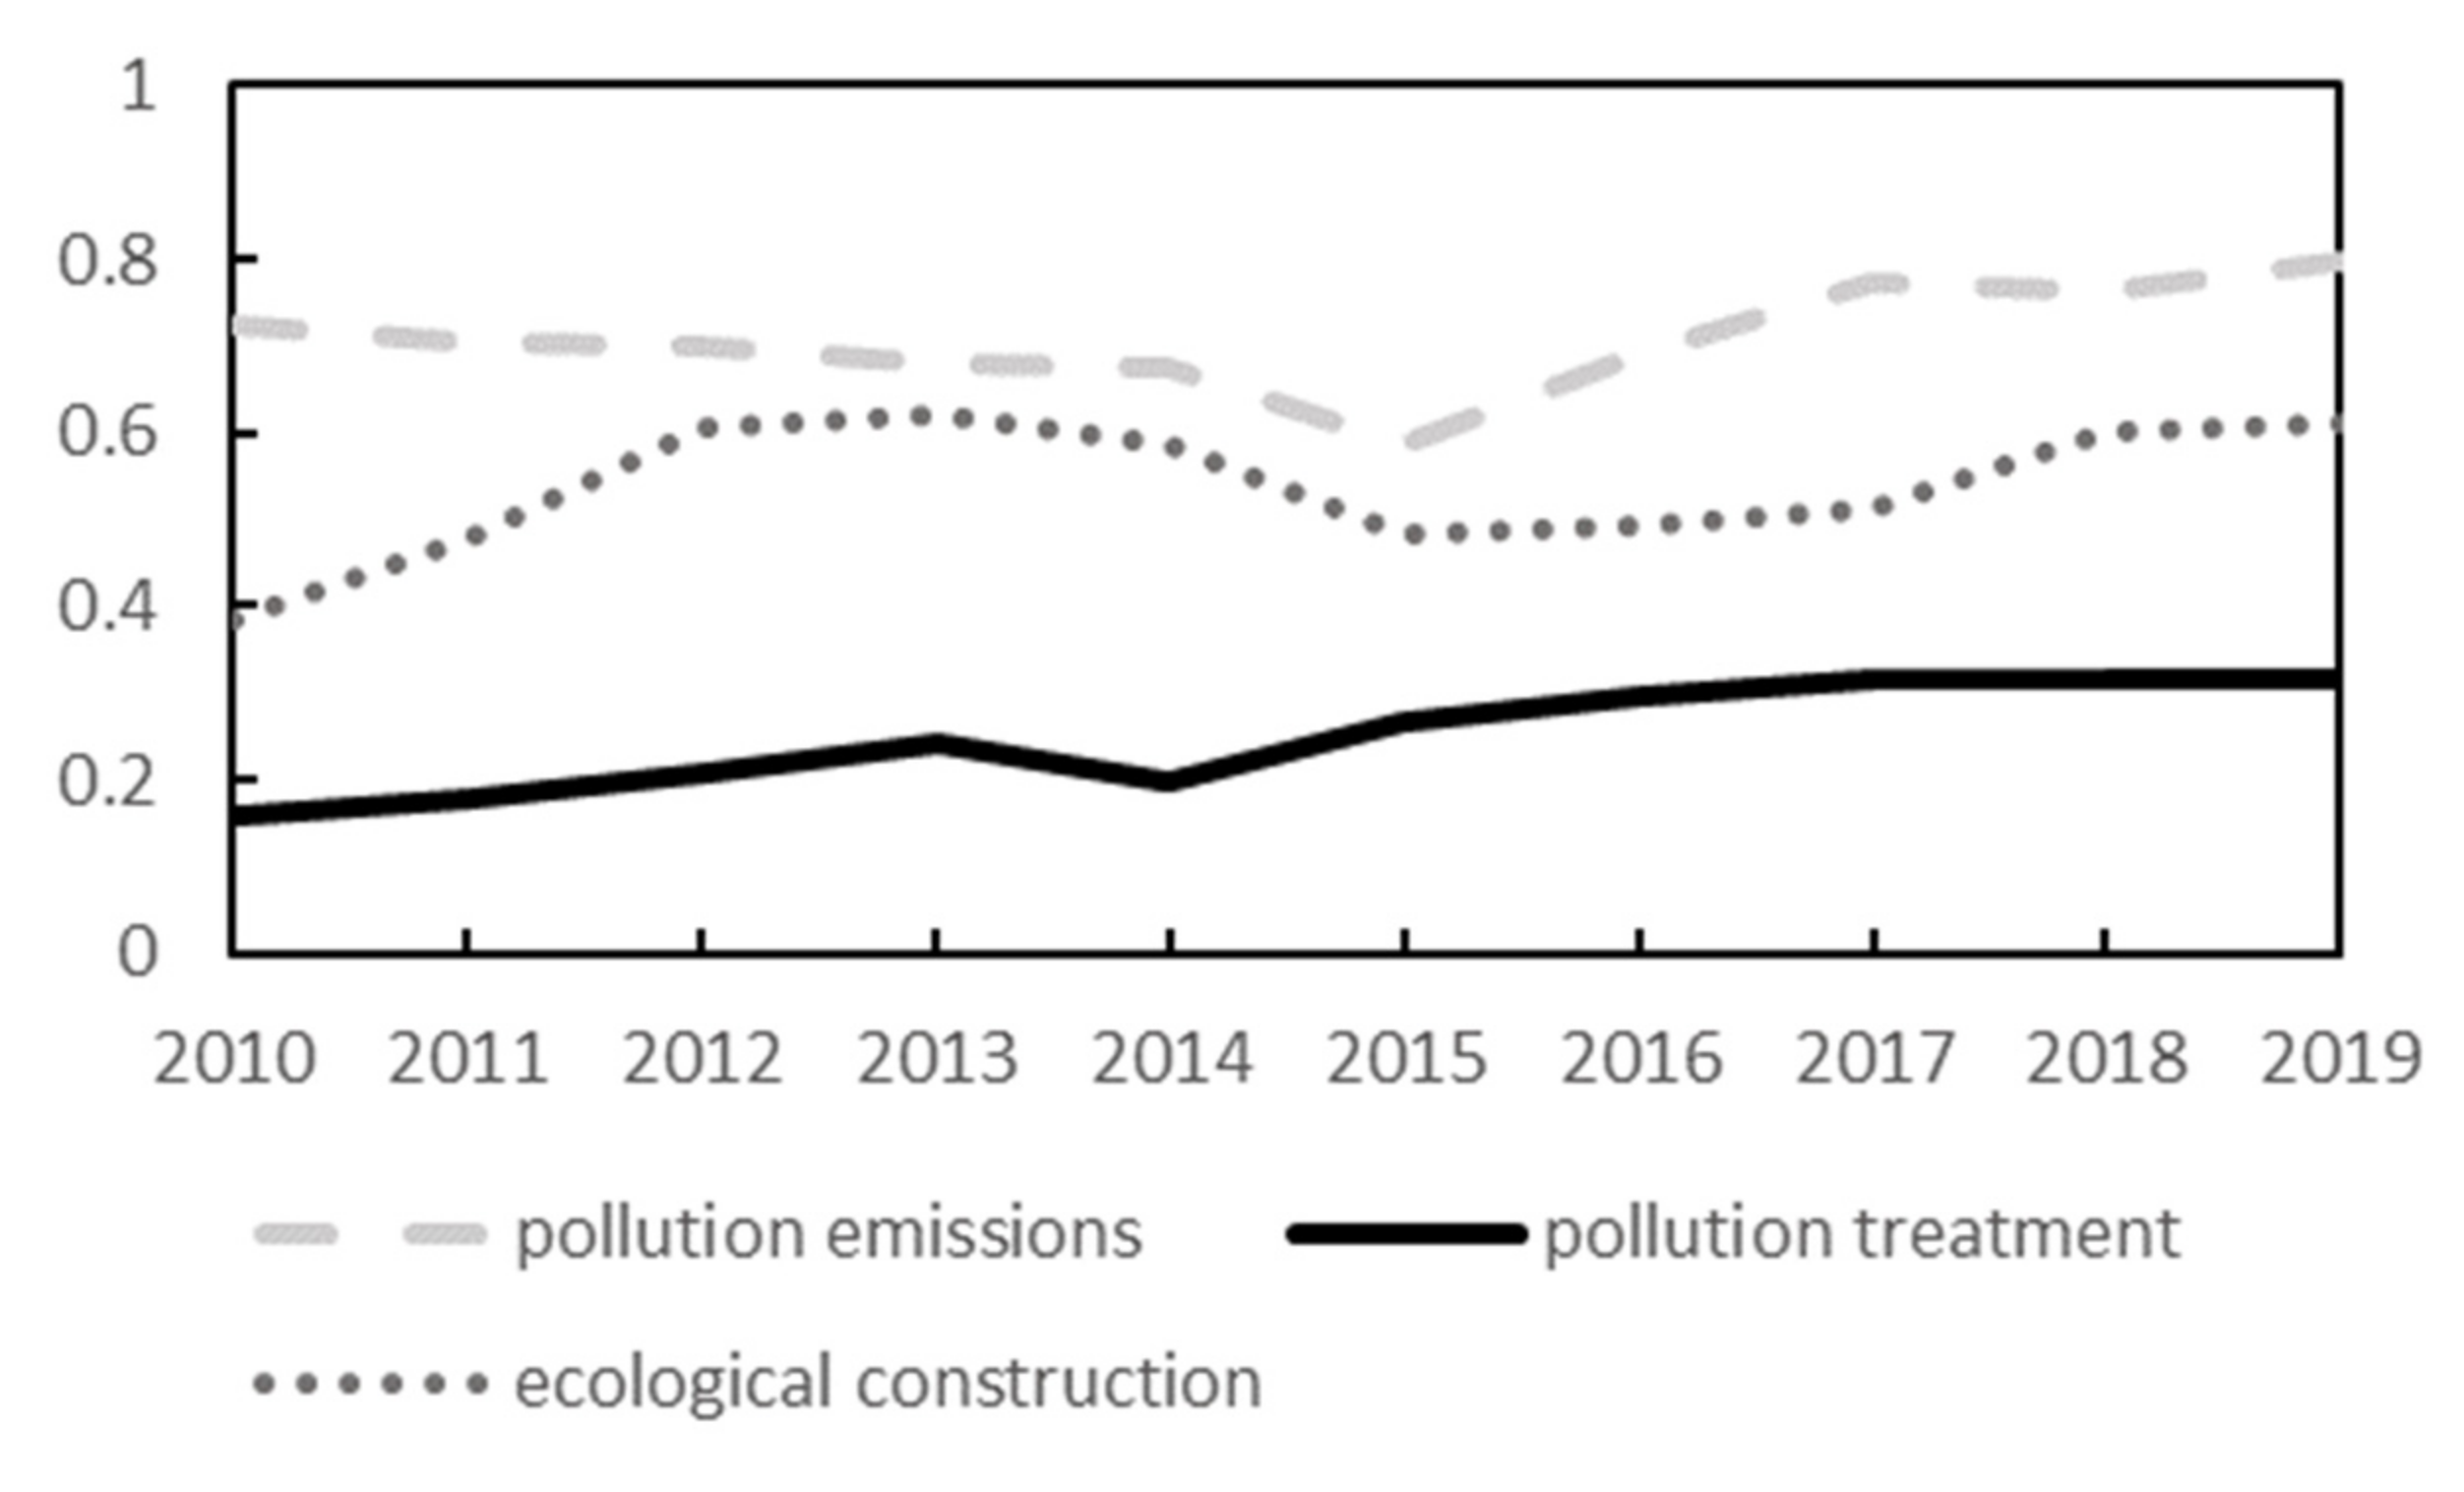
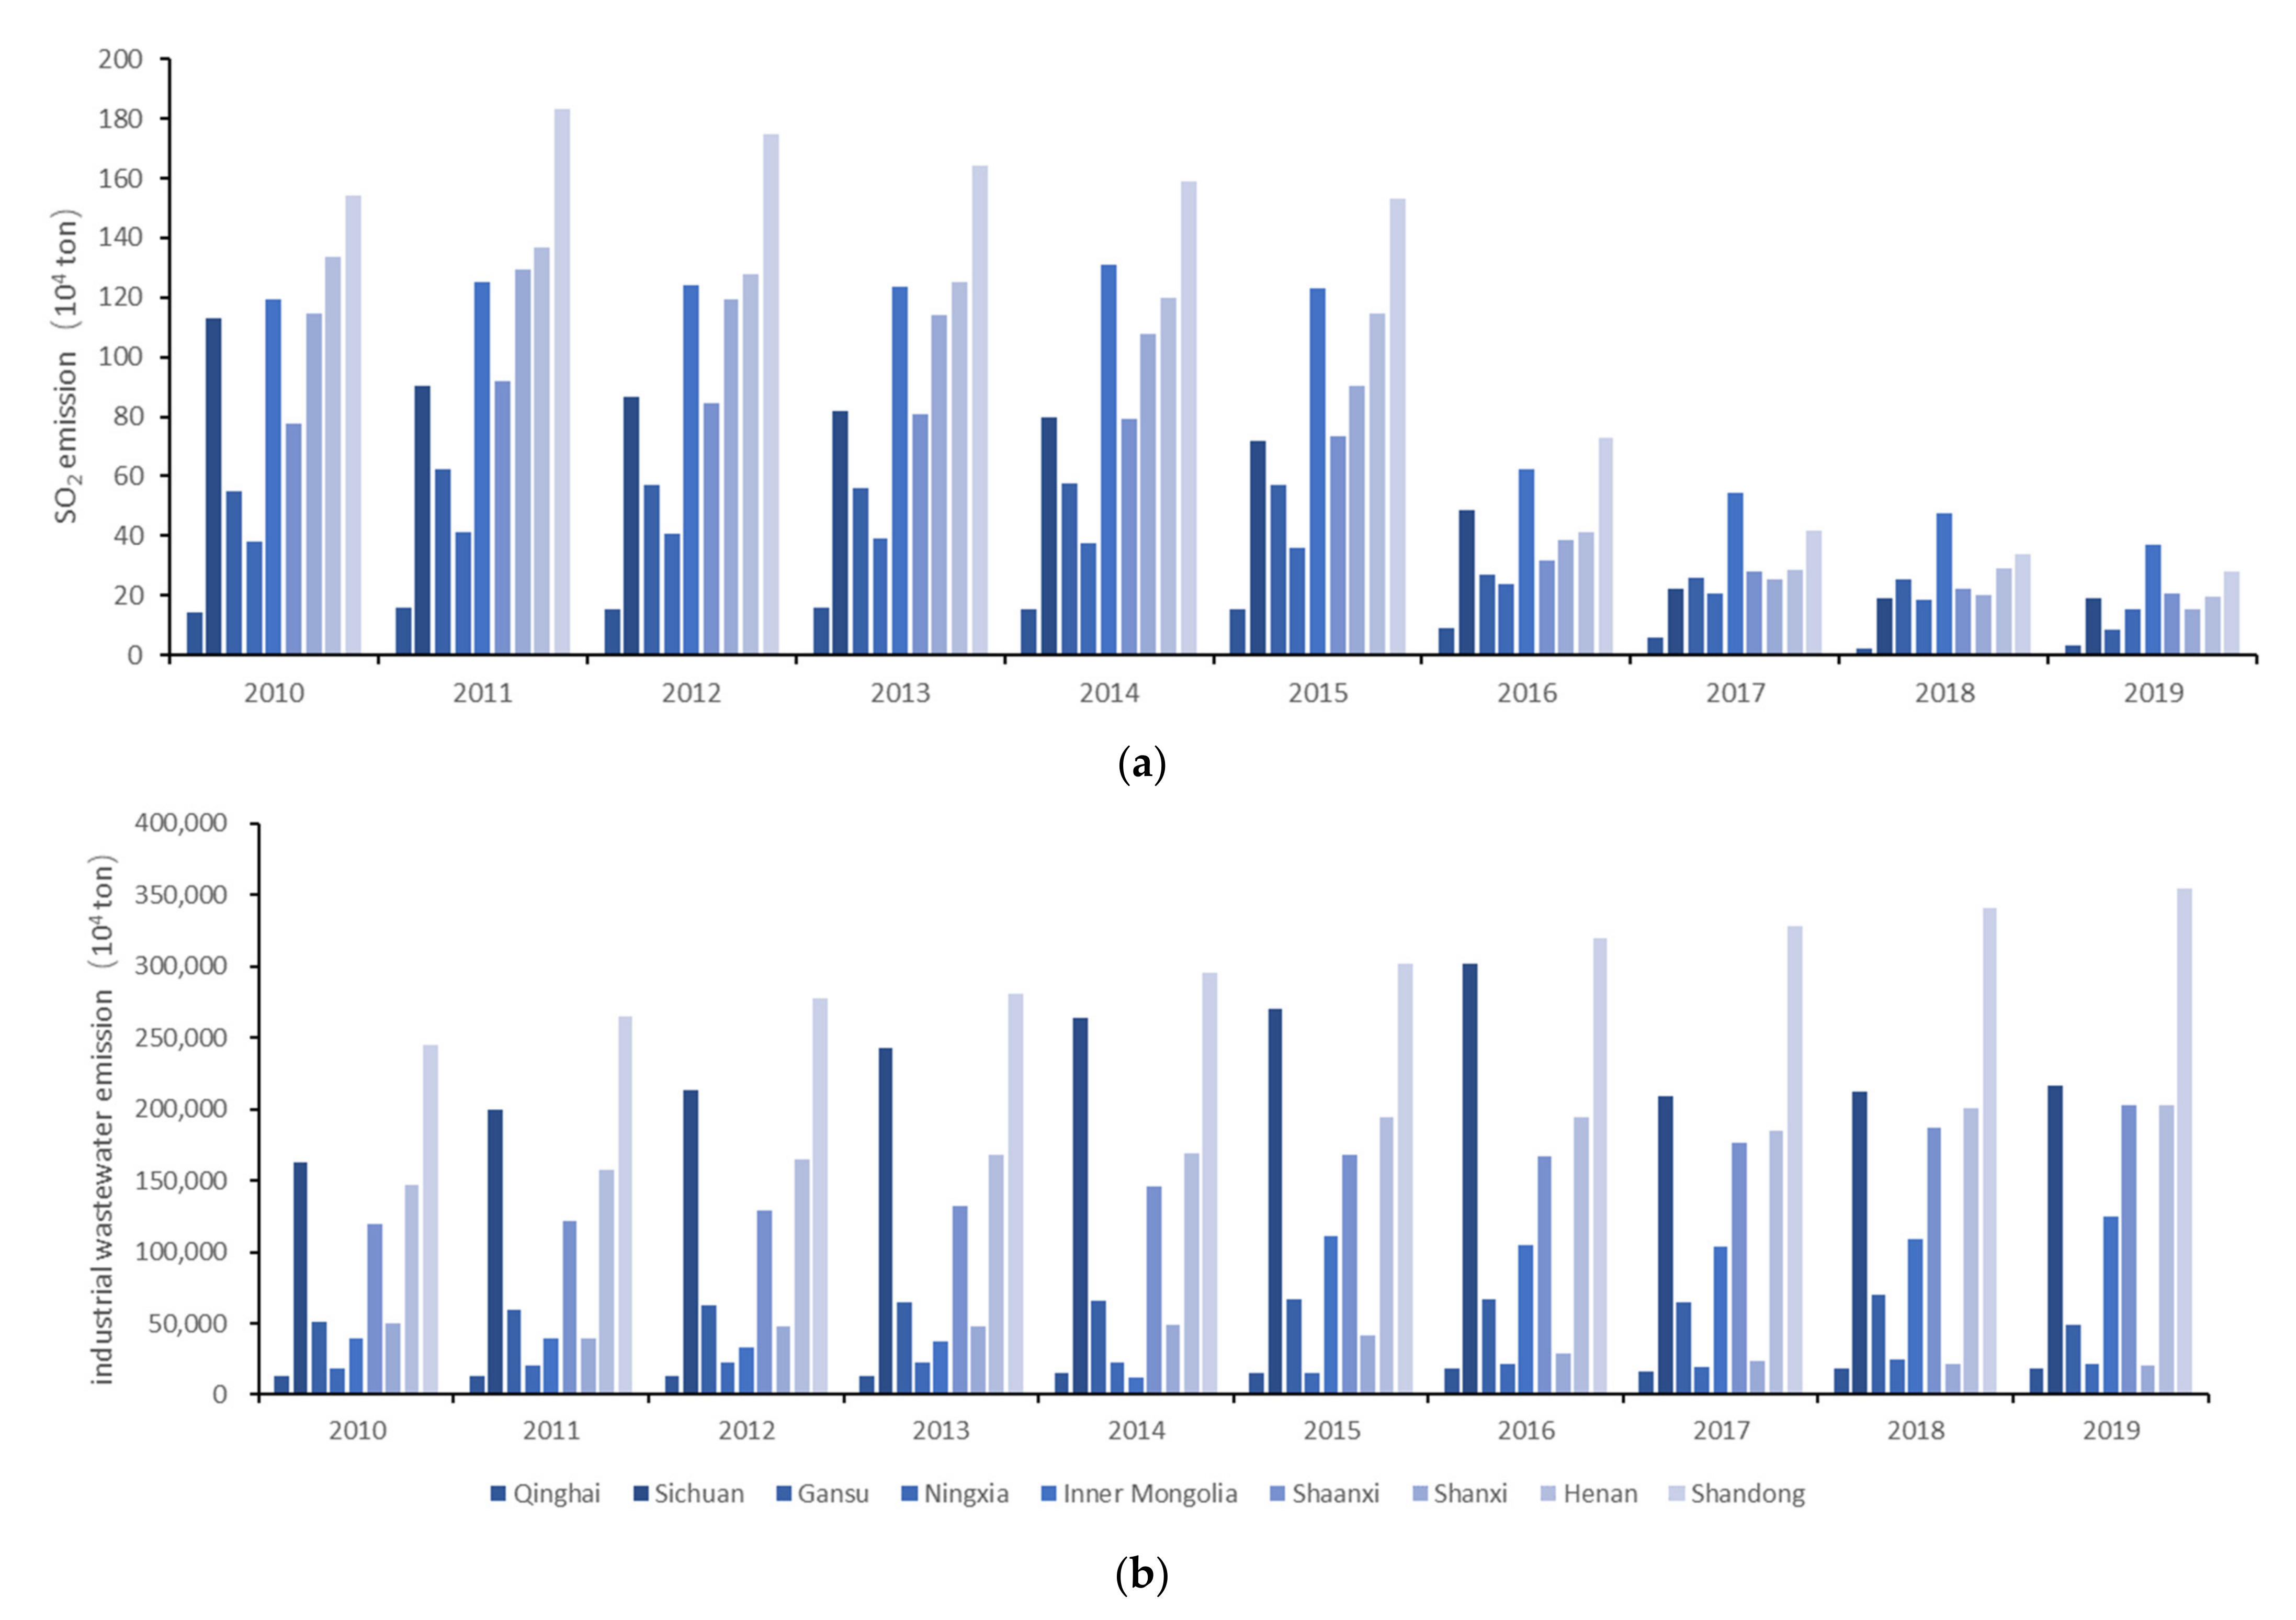
3.2. Analysis of the Ecological Situation in the Yellow River Basin

As can be seen from Figure 4, overall, the index of the ecological status of the Yellow River basin exhibited a fluctuating increasing trend from 2010 to 2019. An important inflection point in the pollution emission indicators occurred in 2015, which requires analysis of the detailed changes in the secondary indicators, i.e., the SO2 emissions and industrial wastewater emissions. Figure 5 presents the SO2 emission and industrial wastewater emissions data for each province during 2010 to 2019. As can be seen, although there were large differences in the absolute values of the SO2 emissions and industrial wastewater emissions of the provinces due to differences in their ecological foundations, the trends of both were consistent across the provinces. From 2010 to 2019, the SO2 emissions generally decreased by 8% in all of the provinces, while the industrial wastewater emissions increased, except in Gansu and Shanxi. In 2016, China began its 13th five-year plan, including strict management of energy conservation and emission reduction efforts, and governments at all levels, from central to local, have included air pollution control in their year-end assessment targets, increasing regulations while eliminating the backward production capacity. Thus, SO2 emissions have been substantially controlled since 2016, which is the main reason for the 2015 inflection point. However, the energy conservation and emission reduction efforts did not control the amount of urban and industrial sewage discharges, and although various types of sewage discharge standards have been introduced at the national level, they have only controlled the concentration and total amount of pollutants and have not controlled the amount of polluted water, so the amounts of sewage discharge in most provinces have not been controlled.
Pollution treatment indicators exhibited more significant increases during the study period, with a brief decline during 2013–2014, which was mainly due to the fact that the wastewater treatment capacity at that time could not yet keep up with the changes in the scale of water use and the lag in the construction of treatment support facilities. However, in general, as the number of sewage treatment plants increased, the treatment capacity continued to improve, and the pollution control situation in China has been significantly improved. The data show that in 2013 China only had 1736 sewage treatment plants, in 2016 the number of sewage treatment plants exceeded 2000, and the number of sewage treatment plants in China reached 2618 in 2020. In 2013, the capacity of China’s sewage treatment plants was only 124.54 million cubic meters per day, while by 2020 the treatment capacity had increased to 192.67 million cubic meters per day, and the level of pollution treatment technology had significantly improved.
The trends of the ecological construction indicators exhibit more inflection points during the study period. The rapid increase in 2010–2012 was caused by the continuous national investment in solving numerous ecological problems in the Yellow River basin since the21st century. The extensive continuation of previous ecological construction pilot projects, the implementation of several ecological restoration projects targeting the degradation of the upper Yellow River ecosystem and the soil erosion problems in the middle reaches, and the general application of new technologies have improved the ecological quality in the study area. The rapid decline in 2014–2015 was due to the decrease in rainfall over a wide area of the Yellow River basin in 2015. The average precipitation in the Yellow River basin in 2015 was 409.5 mm, i.e., a decrease of 15.9% year-on-year and 8.4% less than the average value during 1956–2000. This decrease in precipitation directly led to a decrease in run-off and reservoir storage in various places, and it also affected the groundwater level, resulting in a significant decrease in the per capita water resources, which, in turn, affected the ecological construction indicators.
However, the decreases in the ecological construction indicators from 2012 to 2019 remained at a low level, which was due to the very prominent problem of water resource conservation and intensive use in various places. For a long time, over-exploitation of groundwater in the Yellow River basin and over-use of water resources along the main tributaries of the Yellow River have occurred, jeopardizing the ecological environment in the Yellow River basin. Many surveys have shown that the significant drop in the groundwater level and the excessive diversion of water are more common in the Yellow River basin. Owing to the inconsistent scheduling of water resources, in dry years, various places along the river compete to divert water through water diversion projects, resulting in increasingly serious disruptions downstream. These changes in the data show that there are still many problems regarding the ecological environment in the Yellow River basin, and the level of regional high-quality development still needs to be improved.
As is shown in Figure 6, the trends of the ecological environment in the nine provinces in the Yellow River basin basically included two types: increasing and smooth trends. The provinces with smooth trends were Shaanxi and Shandong, in which the magnitude of the changes in the comprehensive ecological environment assessment value from 2010 to 2019 was not significant, but it did fluctuate during the decade and eventually improved slightly. The rest of the provinces exhibited increasing trends, and Gansu and Sichuan exhibited larger growth rates. These two provinces in the upper reaches of the Yellow River were both burdened with the daunting task of the ecological management of the Yellow River and strengthened the importance of resources and the environment during this decade. Thus, the results of their regional ecological management plans have been more noticeable. In 2019, the provinces in the upper reaches of the Yellow River (Gansu, Qinghai, and Sichuan) had the best ecological and environmental patterns and good development. In contrast, those of the Shaanxi and Shandong provinces were relatively low and still require further development.

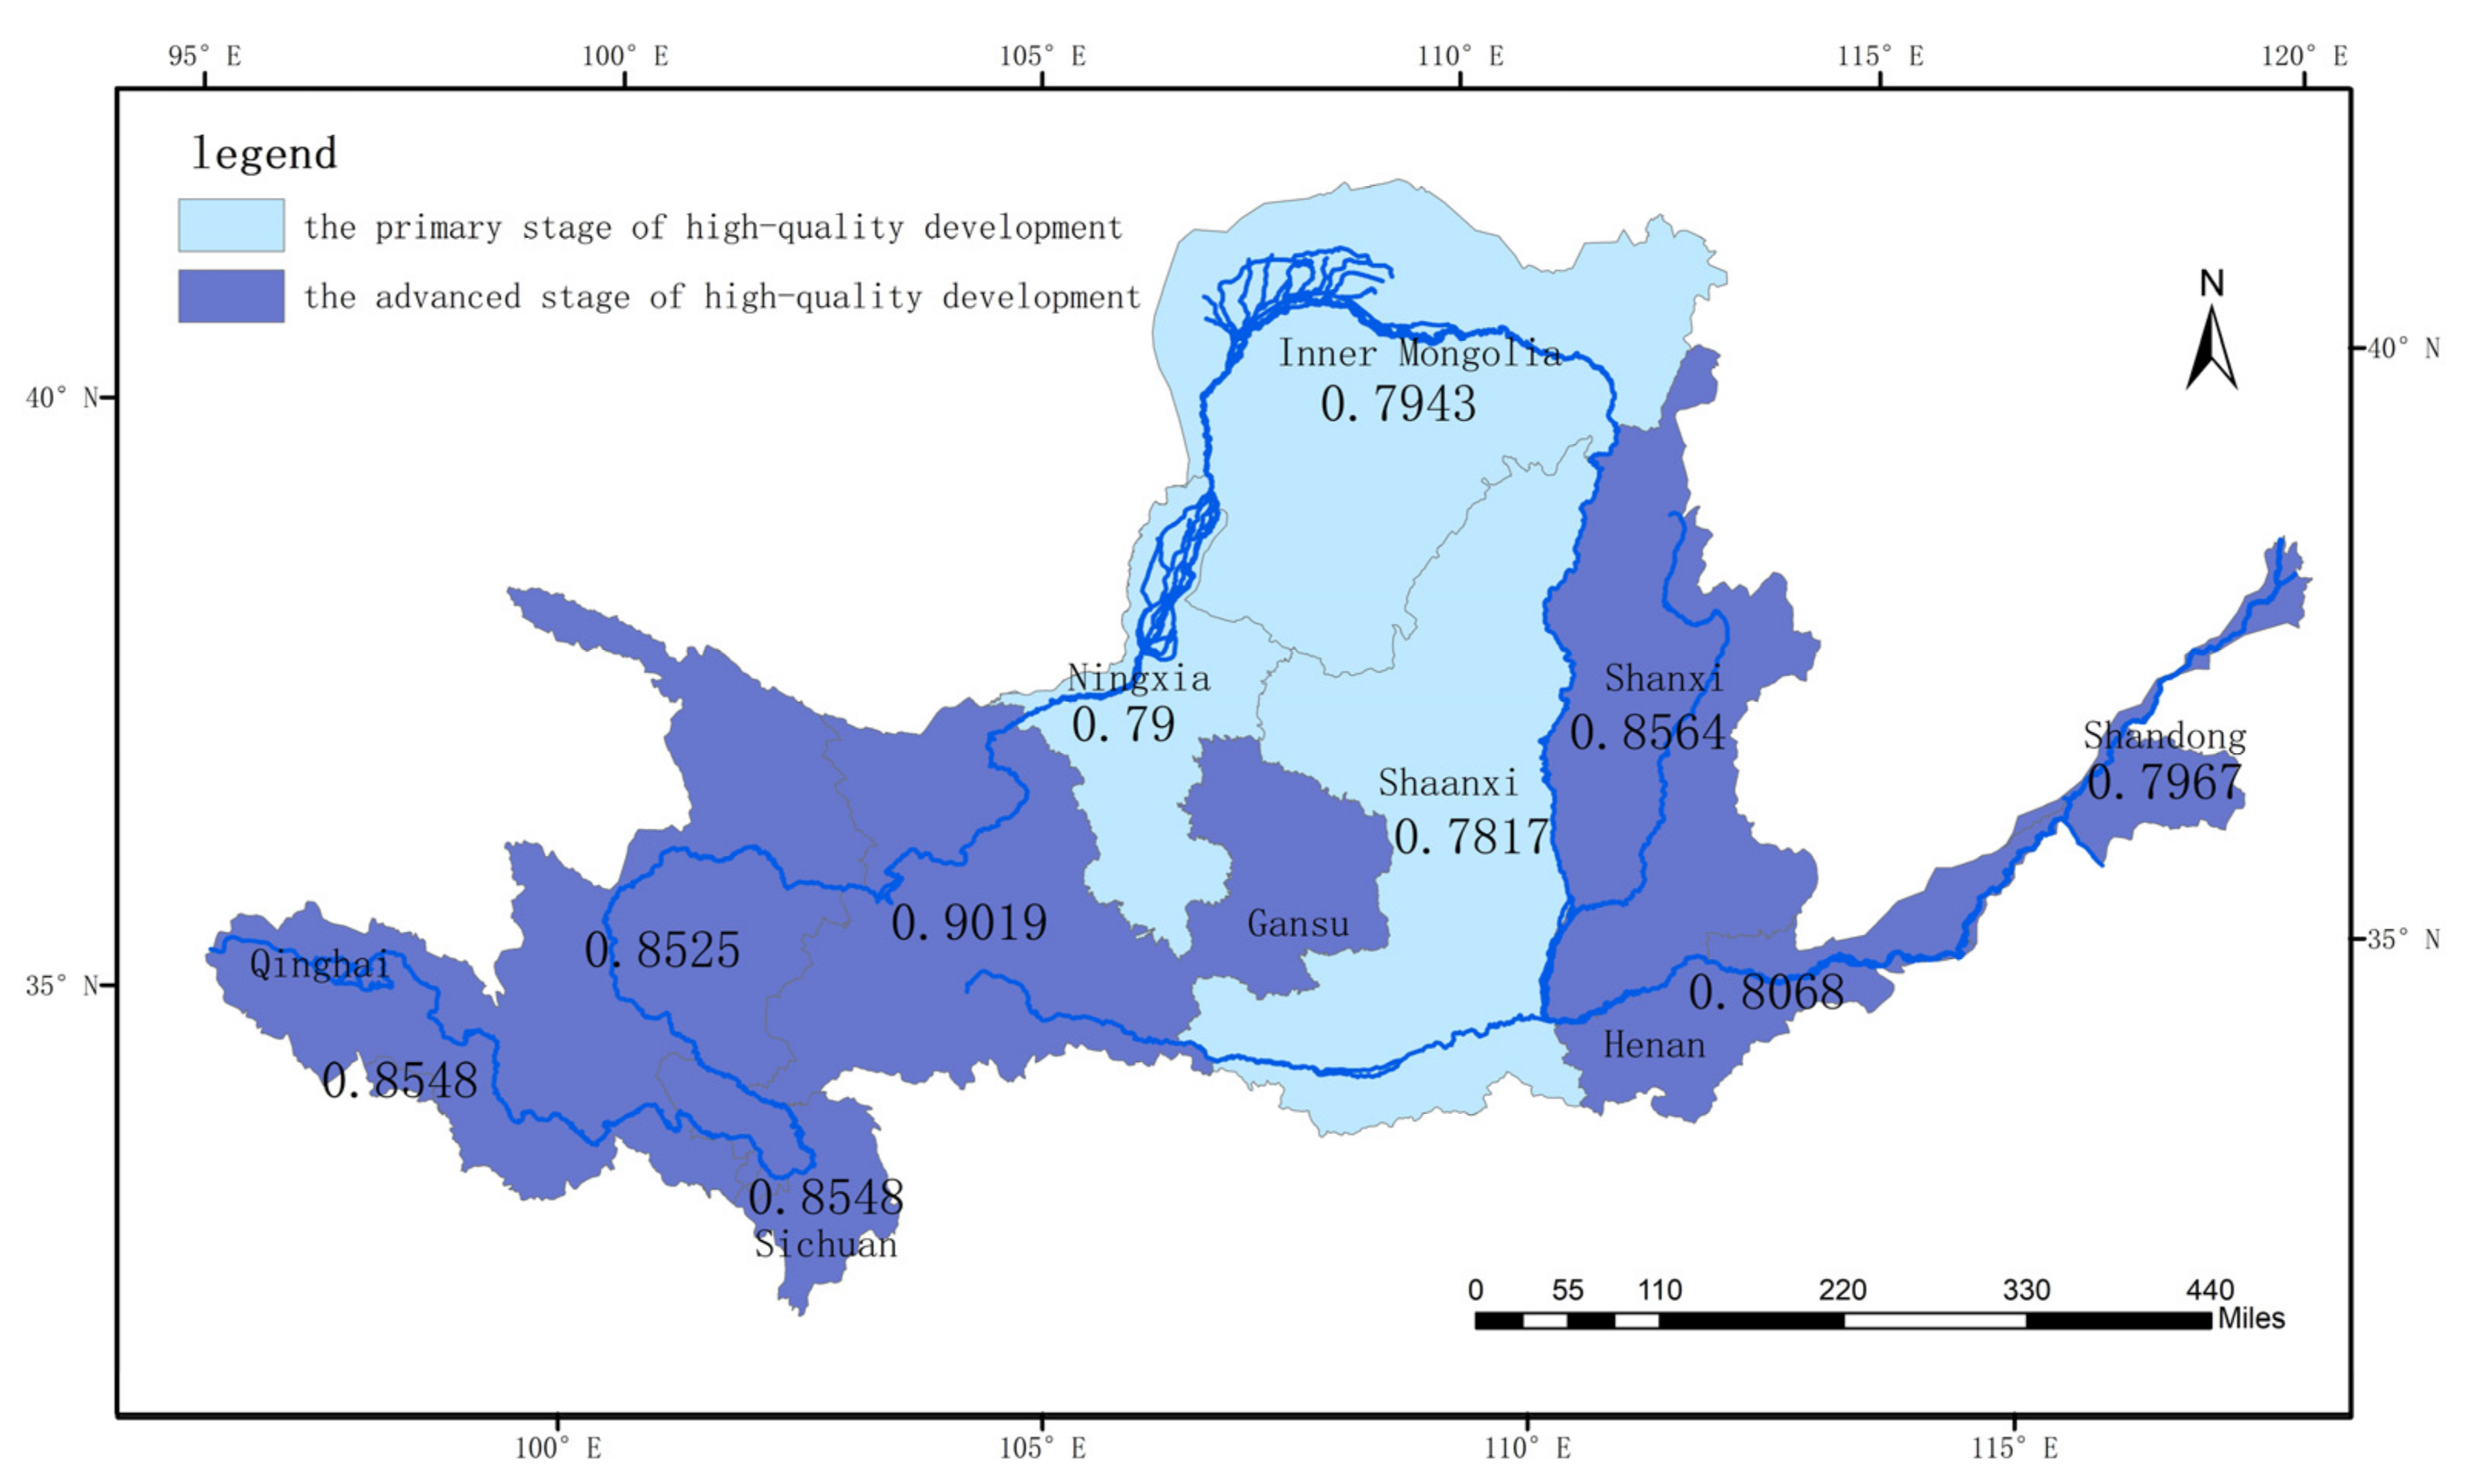
3.3. Evaluation Results of High-Quality Development in the Yellow River Basin

To better study the intrinsic relationship between the economic development and ecology in the watershed and to evaluate the level of high-quality development in the watershed, the coupling degree (C) and coupling coordination degree (D) were calculated using Equations (3)–(5) to quantify the strength of the interactions and the quality of the coordination. Figure 7 shows the trends of C and D from 2010 to 2019.
As can be seen from Figure 7, the coupling degree between the economic development and ecological environmental quality in the Yellow River basin was highly coupled (>0.9) between 2010 and 2019, but it fluctuated slightly under the three different standardization methods. The higher coupling degree indicates that the interrelationship between the economic development and ecological quality was higher, indicating that the economic development and ecological environment in the Yellow River basin were mutually constrained, and they were closely linked and inseparable.
However, the coupling coordination results obtained using the three different standardization methods are slightly different. Among them, the results of method A and method C are more similar, and the coupling coordination degree has been in the primary coordination stage (0.6–0.7), but it fluctuated slightly during the study period. In contrast, the coupling coordination degree obtained using method B fluctuated and increased during the study period, and according to the classification of the degree of coupling coordination presented in Table 3, the coupling coordination degree transitioned from the mild maladjustment to the primary coordination stage and then to the quality coordination stage in 2019. This indicates that standardization method B treats the historical data for the same province as a set of standardized objects, and it standardizes the yearly differences between the provinces. This method better highlights the coupled coordination of the economic development and ecological conditions in the basin, amplifies the differences in the development changes between the historical years in each province, and compensates for the differences in the data volume arising from the differences in the basic conditions in each province. The development of the economy and ecosystem in each province between calendar years was also the fundamental cause of the changes in the coupling coordination of the two subsystems. In addition, the results obtained using this standardized method are closer to the general conclusions of other studies on the development of the coupled coordination between the ecological and economic systems in China, that is, the coupled coordination between the economy and the ecology in China has increased over time [29,30,31]. This is also consistent with the general perception that since China proposed the new development concept of innovation, coordination, green, openness, and sharing, the new governance concept has innovatively promoted high-quality development in the Yellow River basin, and the economy and ecology have been receiving the same level of attention and have had the same development direction [32]. As the level of the quality development of the Yellow River increases, the degree of coupling and coordination should also increase.
Since the previous analysis revealed that the results obtained using standardization method B are more consistent with the actual changes, in this section we mainly analyze the coupling degree and coupling coordination degree results for each province obtained using the standardization method B. As is shown in Figure 8 and Figure 9, the coupling degree of each province in the basin was highly consistent, while the coupling coordination degree was more complicated. In general, the coupling degrees of all of the provinces were at a high level. During 2010–2011, only the Sichuan Province exhibited moderate coupling, while during the other time periods, all of the provinces were highly coupled.
Overall, the coupling coordination exhibited a fluctuating increasing trend, which is consistent with the development direction of the basin as a whole. During the first two years of the study period, only the Sichuan Province exhibited high maladjustment, five provinces exhibited mild maladjustment, and three provinces were in the primary coordination stage. During 2012–2013, two provinces (Sichuan and Shanxi) exhibited mild maladjustment, and the other provinces were in the primary coordination stage. During 2014–2015, all of the provinces were in the primary coordination stage. During 2016–2017, Shanxi Province’s coupling coordination degree entered the quality coordination stage. During 2018–2019, a total of six provinces entered the quality coordination stage, and the urban development basically achieved synchronization of economic development and ecological environmental protection.
The development history of the coupling coordination degree also differed among the provinces. These indexes for Qinghai and Gansu exhibited slightly decreasing trends during 2014 to 2015, which is the main reason why the basin-wide coupling coordination degree obtained using standardization method B did not increase during the period from 2014 to 2015. Qinghai and Gansu are located in the upper reaches of the Yellow River basin, and the Qinghai Province is also the birthplace of the Yellow River, so it has an important and special ecological status, but the economic base of these two provinces is weaker compared with the other provinces in the basin, and they face more challenges in adhering to the green ecology-oriented development path. The Sichuan Province transformed from a high level of maladjustment to an advanced level of coordination during the study period, and it was the province with the largest transformation, indicating that the Sichuan Province has increasingly focused on coordinated development of its economy and environment. The Ningxia, Shanxi, Henan, and Shandong provinces all gradually transformed from mild maladjustment to quality coordination, and the coupling coordination of their economic growth and ecological environment exhibited a stable increasing trend in the following years. In contrast, Inner Mongolia and Shanxi remained in the primary coordination stage during the study period, with little fluctuation in their coupling coordination, so they still require improvement to achieve high-quality development.
Figure 9 also shows the spatial distribution of the coupling coordination degree. There was spatial heterogeneity in the coupling coordination degree of the economy and ecology among the provinces in the study area. From 2018 to 2019, the provinces in the primary coordination stage were mainly located in the middle reaches of the basin, and the upstream and downstream provinces were basically in the advanced coupling stage, indicating that the middle reaches of the Yellow River basin faced relatively severe contradictions between environmental protection and economic development, and, thus, promoting the coordinated development of the economy and ecology is a major issue related to the high-quality development of this region.
The final result of high-quality development in the Yellow River Basin can be derived based on the evaluation results of coupling coordination degree. We consider the regions with highly coupling and primary coordination as entering the primary stage of high-quality development; the regions with highly coupling and quality coordination as entering the advanced stage of high-quality development. As can be seen in Figure 10, Inner Mongolia, Ningxia, and Shannxi are in the primary stage of high-quality development in 2018 to 2019, while the other six provinces are in the advanced stage of high-quality development.
The numbers in Figure 10 are the magnitude of the coupling coordination index. Among the six provinces entering the advanced stage of high-quality development, Gansu Province has the highest coupling coordination degree index of 0.9019, which means that the Gansu Province has the most balanced status of economic development and ecological protection, and that the Gansu Province is the most balanced and most in line with the green, recyclable, and high-quality development needs. With a population of only 58.91 people/square kilometer, the Gansu Province’s total economic volume and development density are not the highest among these provinces, but its pollution emissions are small, with the smallest SO2 emissions among all provinces in 2019 at 85,800 tons. Pollution treatment and ecological construction have also received sufficient attention, with the sewage treatment plant treatment rate, green space coverage in built-up areas, and per capita water resources compared to 2015 rose by 6%, 15%, and 61%, while the Shaanxi Province, which has the lowest coupling coordination index, changed only 4%, −3%, and 45% in these three indicators.

4. Discussion

4.1. Applicability of the Coupling Coordination Degree of the Economy and Ecology to the Evaluation of Regional High-Quality Development

There are two misunderstandings in the evaluation of regional high-quality development. One is the evaluation of the investment in ecological protection as part of economic development and the simple assumption that the economy can achieve higher quality development if the investment in ecological protection increases. The second is the separate analysis of the evaluation results of economic development and ecological protection and the assumption that the development level is high if the economic level is good and the ecological quality is good, which ignores the interaction between the two and the synergistic effect, as well as whether the development direction is consistent.
The use of coupling coordination solves these two problems very well. High-quality development requires that the sustainability of the economic operations and the health of the ecological environment exist simultaneously and are mutually reinforcing. The coupling coordination degree evaluation process treats them as two equally important subsystems, avoiding the common problem of treating environmental protection lightly and as part of the economy. The coupling coordination degree is used to evaluate the degree of coordinated development in the system, and a high coupling coordination degree indicates that the system is highly consistent and mutually reinforcing, which makes it more suitable for evaluating the actual situation of high-quality development. Therefore, based on analysis of the level of economic development and the quality of the ecological environment, in this study, the coupling coordination degree was selected to evaluate the regional level of high-quality development, considering the interactions between the two subsystems and the future development trend in a more comprehensive way.
Through the selection of the primary and secondary indicators, more consideration was also given to the positive and negative feedback effects. For example, many studies have analyzed the impact of population changes on the environment [33,34,35], and studies have also reported that environmental degradation affects population changes [36,37,38]; therefore, population indicators have more prominent interactions between the economic and ecological subsystems. In addition, relative to the population size, the population density can better eliminate the effect of regional area differences on population size, so it is more appropriate to use population density. Similarly, the economic volume and development density have more obvious positive and negative effects on the changes in the ecological environment, so we chose these indicators. In the ecological environment subsystem, pollution emissions are the main cause of ecological environmental damage, pollution treatment and ecological construction solve the problems caused by pollution emissions, and the two are mutually constrained, so they can better reflect the constraints and development of the entire ecological environment. This demonstrates the feasibility of the index system, which can also be applied to other regions and has reference value for studying the high-quality development level of the region.

4.2. Main Factors Constraining the High-Quality Development of the Yellow River Basin

Using 2010 and 2019 as the time points, Equation (7) was used to determine the development shortcomings of each province. The results are shown in Figure 11. During 2010–2019, the evaluation result of the development shortcomings of the ecological environment subsystem is 10.26%, which was slightly higher than the economic development shortcomings score of 9.7%. This indicates that the ecological environment is an important factor limiting the high-quality development of the Yellow River basin, and the provinces in the basin should make efforts to improve the ecological conditions to achieve high-quality development. During 2010–2011, the population density, SO2 emissions, sewage treatment rate, and green coverage in built-up areas were the dominant factors affecting high-quality development in the study area. In contrast, from 2012 to 2015, although the population density and SO2 emissions remained the dominant factors, the proportion of construction land and industrial wastewater emissions also rapidly became dominant factors. Beginning in 2016, the fixed asset investment, proportion of construction land, industrial wastewater emissions, and per capita water resources became the dominant factors affecting high-quality development.
Thus, in recent years, two factors in the economic development subsystem and two factors in the ecological environment subsystem have become the main influencing factors. This indicates that high-quality development is necessary to maintain balanced development of the ecology and economy. However, in fact, there is an inhibitory relationship between economic development and ecological development [39]. Excessive economic development will inevitably damage the ecology, which will constrain economic development through a series of feedback effects, such as natural disasters, environmental pollution, and resource shortages. In addition, the feedback from the ecosystem on the economic system has a certain lag [40,41]. How to bring about simultaneous economic growth while maintaining ecological stability is a great challenge in China, which is still developing and facing a difficult economic transformation.

5. Conclusions

In this study, first a system for evaluating economic development and the ecological environment was developed, and then the coupling degree and coupling coordination models were used to study the changes in the high-quality economic development in the Yellow River basin from 2010 to 2019. Unlike in most previous studies, in this study, the effects of the different standardization methods on the results were considered, and the possible interactions between the factors were taken into account more thoroughly in the selection of the indicators. The main findings of this study are as follows:
(1)
Regarding the evaluation of economic development levels and ecological conditions, there are significant differences in the development levels of the provinces in the basin, and there are significant regional differences in the grades of the economic development and ecological conditions;
(2)
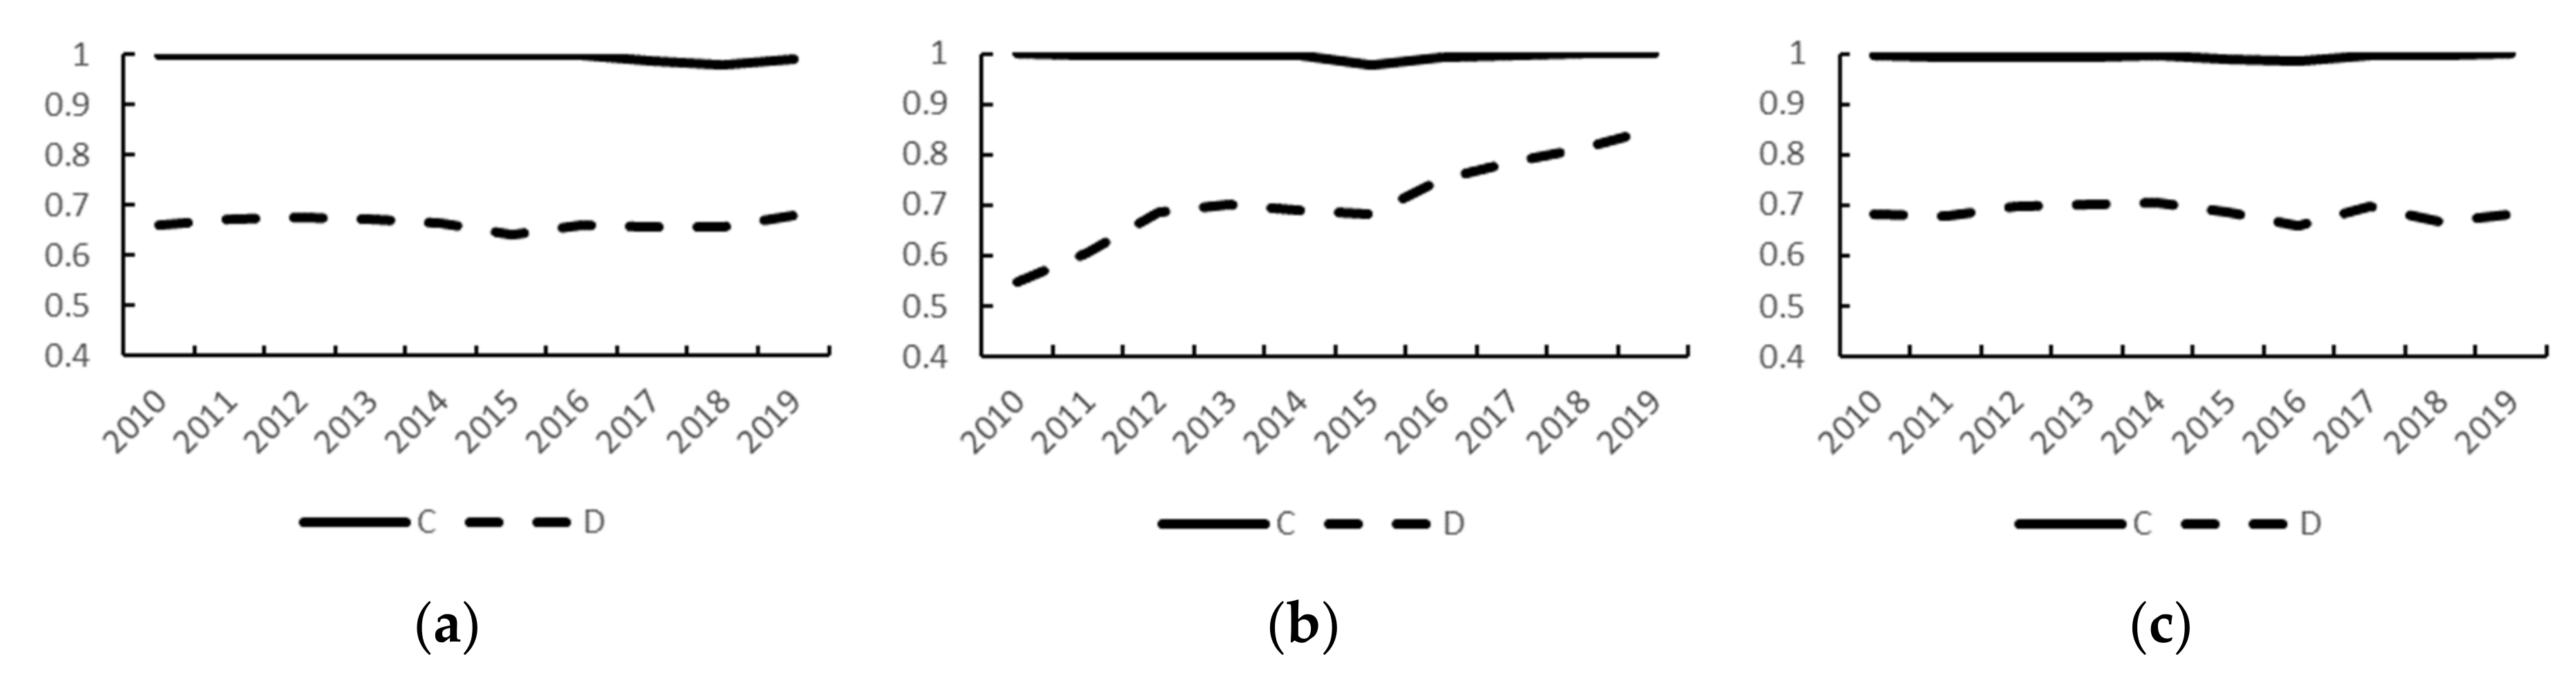
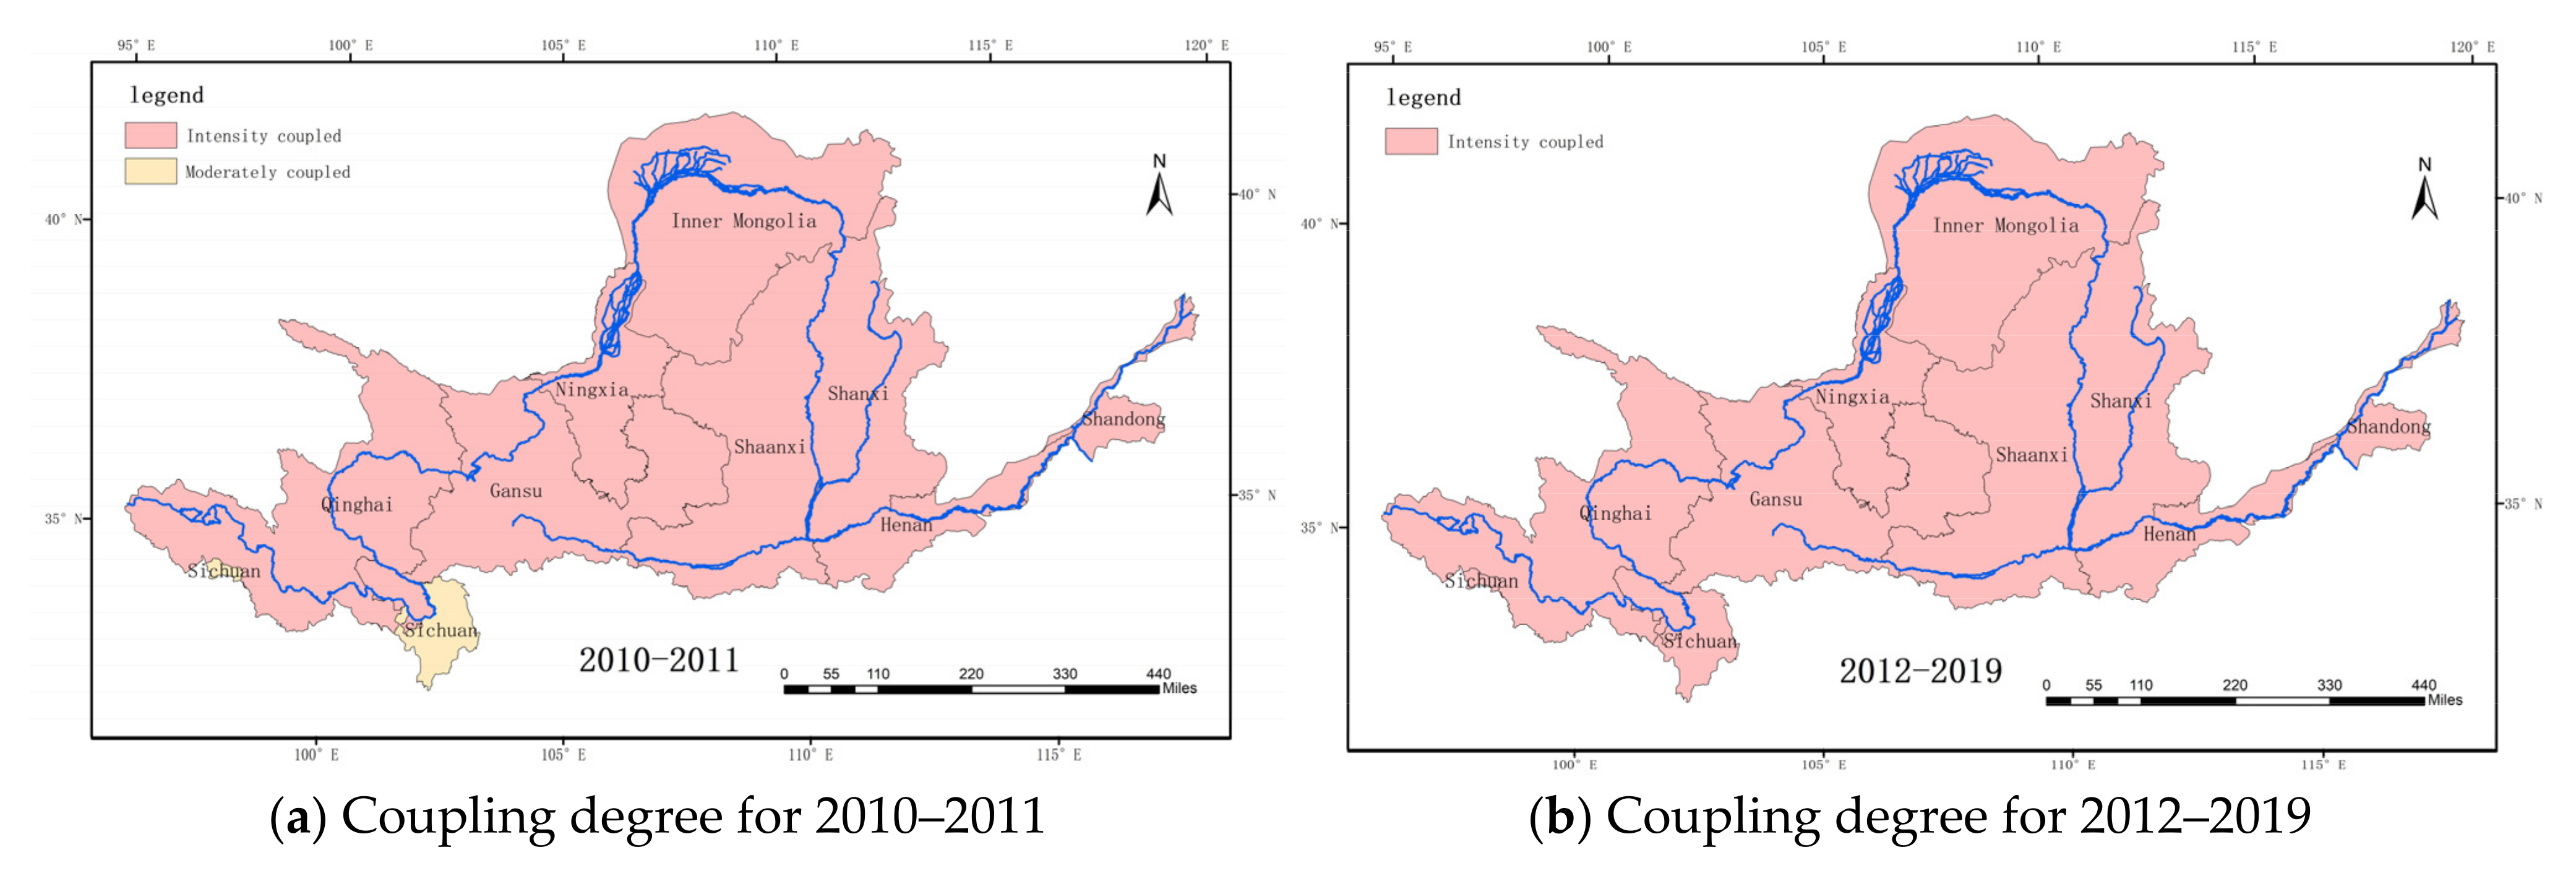
The economic development and ecological conditions in the Yellow River basin exhibit strong interactions, indicating that both are gradually developing in an orderly direction;
(3)
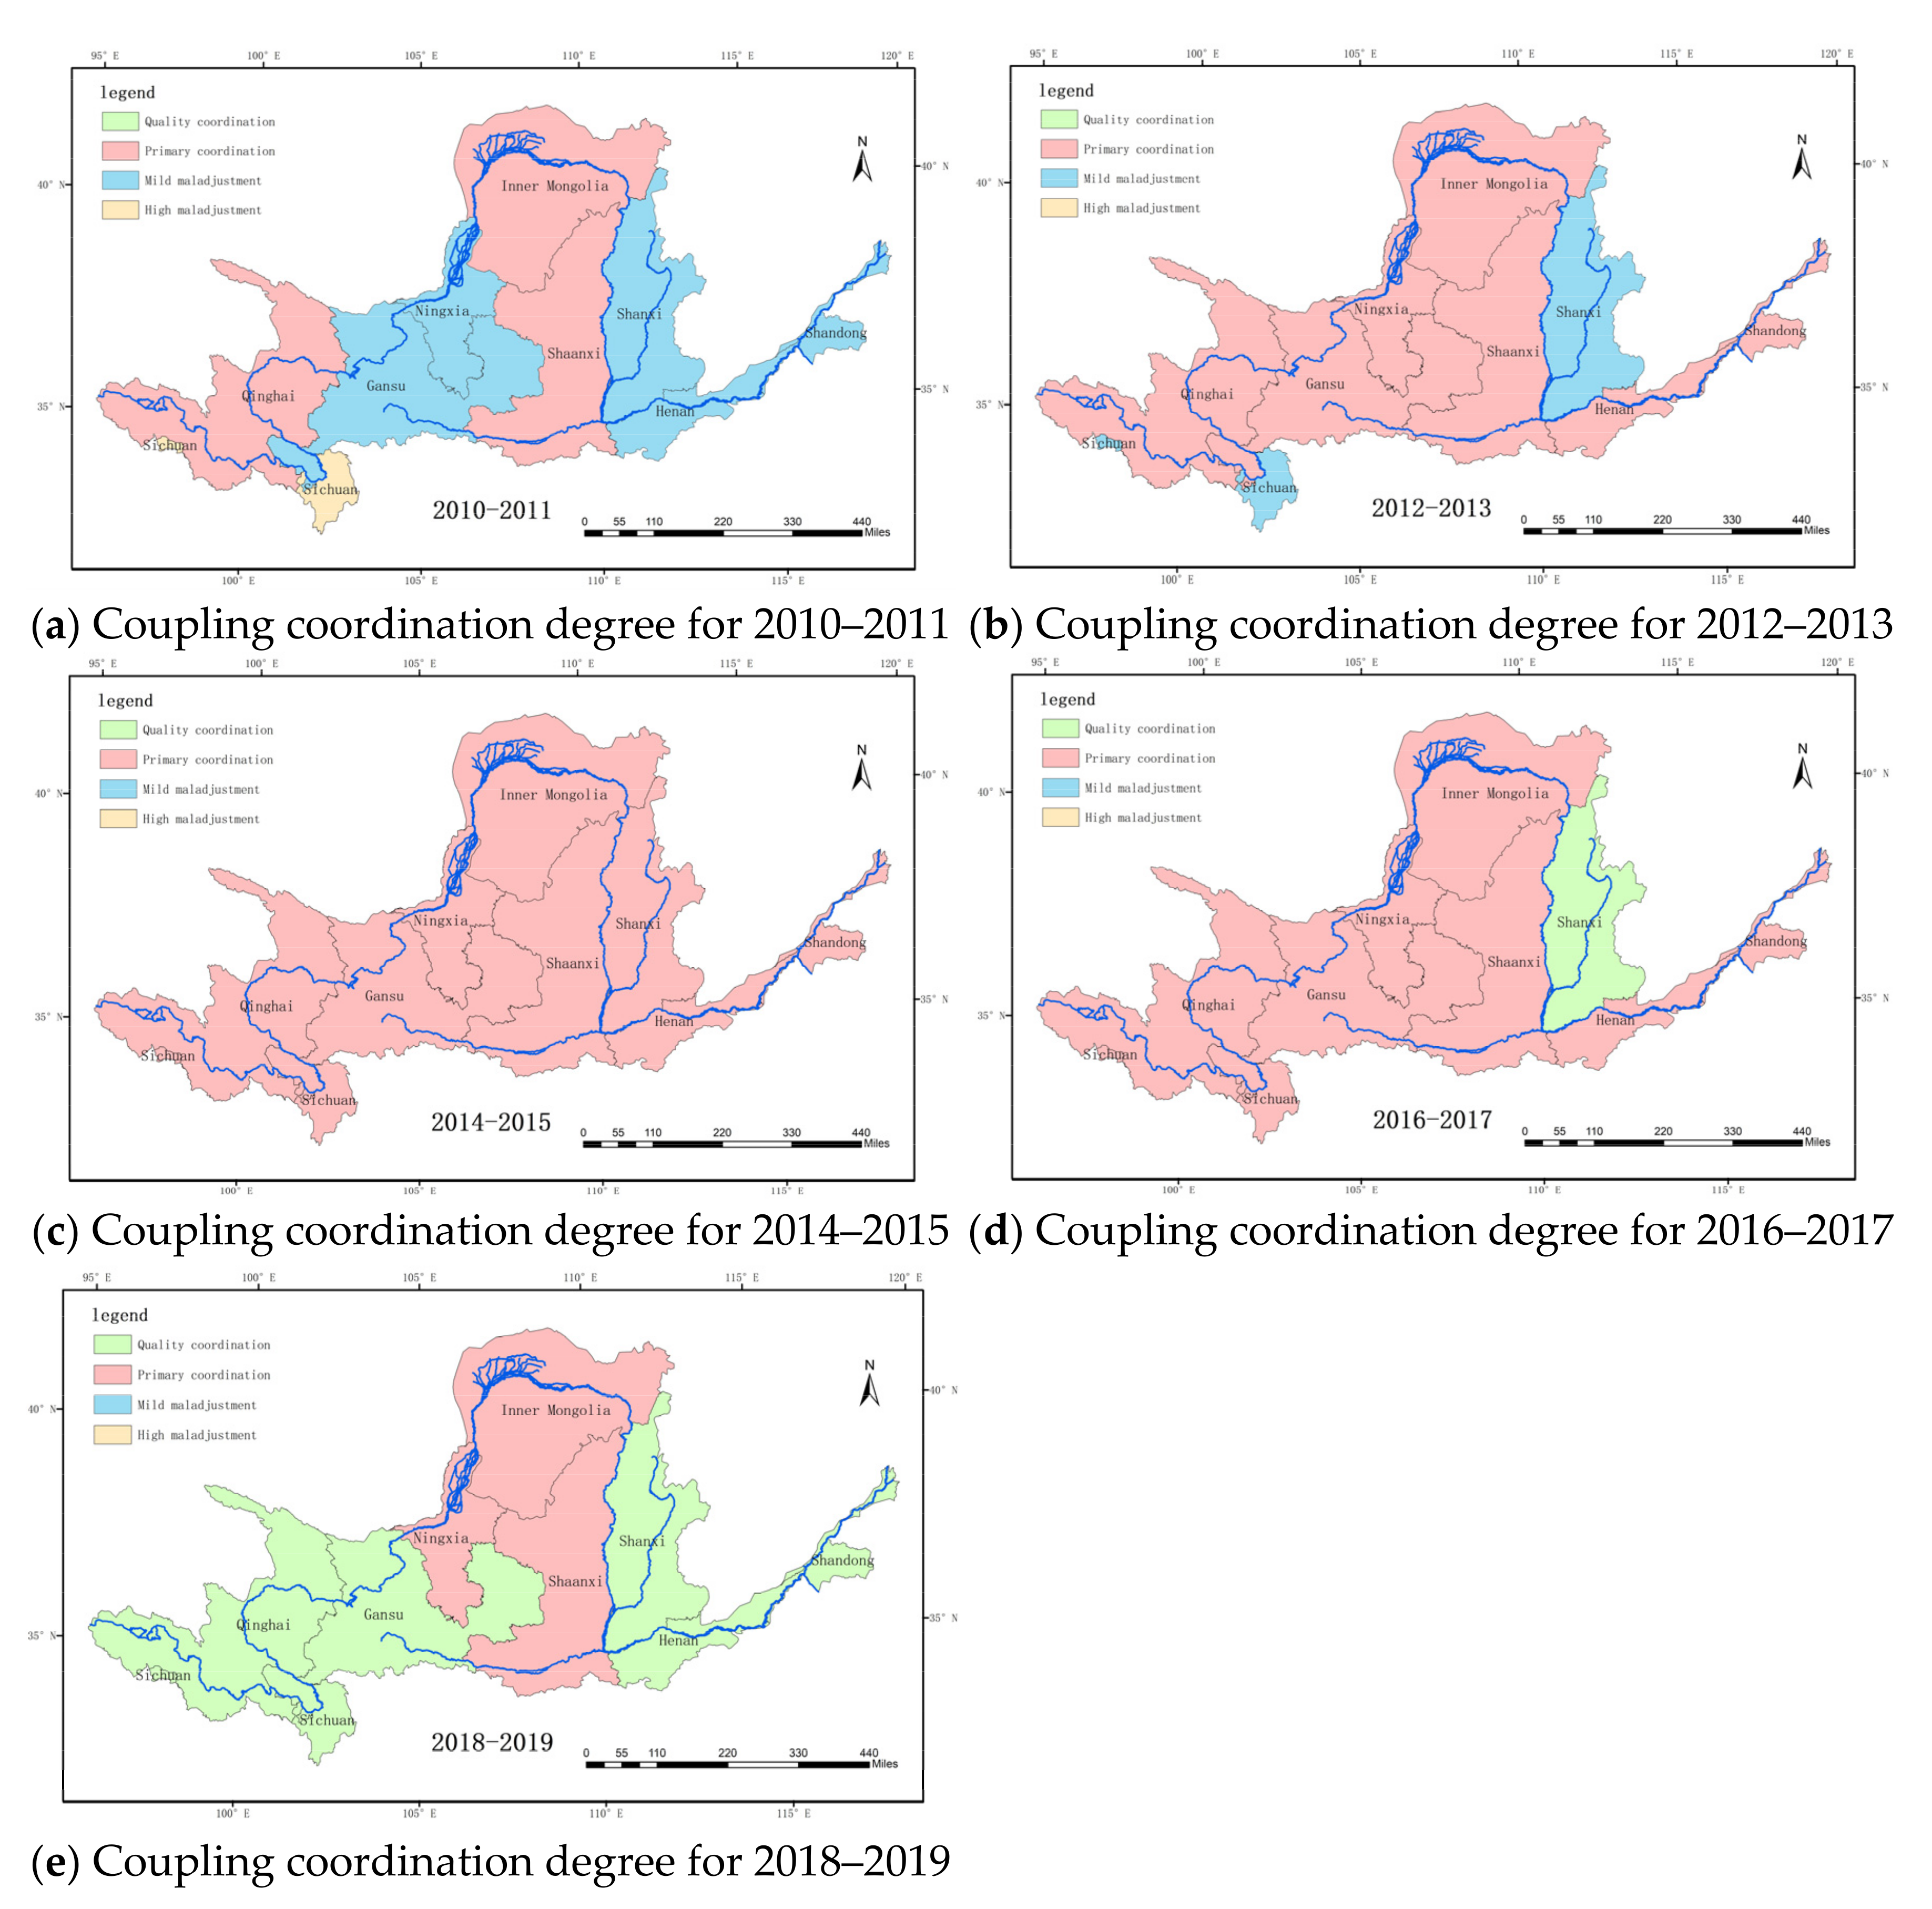
The coupling coordination degree in the basin provinces exhibit spatial heterogeneity on different time scales;
(4)
The coupling coordination degree of the economy and ecology in the Yellow River basin increased during the study period, and the coupling coordination level improved from mild maladjustment to primary coordination and entered the quality coordination stage in 2019;
(5)
The ecological environment is still an important factor limiting high-quality development in the Yellow River basin;
(6)
The improvement of the coupling coordination represents the improvement in the level of high-quality development in the Yellow River basin, and the high-quality development has entered a new stage.
The above results can help decision makers in the Yellow River basin to formulate corresponding sustainable development measures and establish and maintain a balance between economic development and the ecological environment.

Author Contributions

All authors made significant contributions to the preparation of this manuscript. Conceptualization, S.A. and S.Z.; methodology, S.A.; software, S.A.; validation, S.A. and Y.Z.; formal analysis, S.A. and S.Z.; resources, H.H. and J.L.; data curation, Y.Z. and H.X.; writing—original draft preparation, S.A.; writing—review and editing, Y.Z.; project administration, S.Z.; funding acquisition, H.H. All authors have read and agreed to the published version of the manuscript.

Funding

This research was funded by the Open Research Fund of the Jiangsu Key Laboratory of Resources and Environmental Information Engineering, CUMT, grant number JS201906, and the Science and Technology of Inner Mongolia Department Fund, grant number 2020GG0008.

Institutional Review Board Statement

Not applicable.

Informed Consent Statement

Not applicable.

Data Availability Statement

Not applicable.

Conflicts of Interest

The authors declare no conflict of interest.

References

  1. Jahanger, A. Influence of FDI characteristics on high-quality development of China’s economy. Environ. Sci. Pollut. Res. 2020, 28, 18977–18988. [Google Scholar] [CrossRef]
  2. Li, Z.; Yang, W.; Wang, C.; Zhang, Y.; Yuan, X. Guided high-quality development, resources, and environmental forcing in China’s green development. Sustainability 2019, 11, 1936. [Google Scholar] [CrossRef] [Green Version]
  3. Brock, W.A.; Taylor, M.S. Economic growth and the environment: A review of theory and empirics. Handb. Econ. Growth 2005, 1, 1749–1821. [Google Scholar] [CrossRef] [Green Version]
  4. Li, L.; Li, W. Review on the connotation, evaluation and path of industrial high quality development in the Yellow River Basin. IOP Conf. Ser. Earth Environ. Sci. 2021, 621, 12135–12136. [Google Scholar] [CrossRef]
  5. Wang, G. Evaluation and analysis of high quality economic development indicators by the analytic hierarchy process model. Sci. Program. 2022, 2022, 1042587. [Google Scholar] [CrossRef]
  6. Feng, M.; Guo, H. Research on the evaluation of high-quality economic development based on factor analysis. J. Sci. Ind. Res. India 2020, 78, 827–830. Available online: http://nopr.niscpr.res.in/handle/123456789/52221 (accessed on 4 July 2022).
  7. Yan, B.R.; Dong, Q.L.; Li, Q.; Amin, F.U.; Wu, J.N. A study on the coupling and coordination between logistics industry and economy in the background of high-quality development. Sustainability 2021, 13, 360. [Google Scholar] [CrossRef]
  8. Xu, J.; Li, Y. Research on the Impact of Producer Services Industry Agglomeration on the High Quality Development of Urban Agglomerations in the Yangtze River Economic Belt; World Congress on Services; Springer: Berlin/Heidelberg, Germany, 2022. [Google Scholar] [CrossRef]
  9. Liu, Y.; Liu, M.; Wang, G.; Zhao, L.; An, P. Effect of environmental regulation on high-quality economic development in China—An empirical analysis based on dynamic spatial Durbin model. Environ. Sci. Pollut. Res. 2021, 28, 54661–54678. [Google Scholar] [CrossRef]
  10. Lin, T.; Wang, L.; Wu, J. Environmental regulations, green technology innovation, and high-quality economic development in China: Application of mediation and threshold effects. Sustainability 2022, 14, 6882. [Google Scholar] [CrossRef]
  11. Li, J.; Wang, Y.H. Spatial coupling characteristics of eco-environment quality and economic poverty in Lüliang area. Chin. J. Appl. Ecol. 2014, 25, 1715. [Google Scholar]
  12. Tran, L. An interactive method to select a set of sustainable urban development indicators. Ecol. Indic. 2016, 12, 418–427. [Google Scholar] [CrossRef]
  13. Dang, V.T.; Wang, J.; Dang, V.T. An integrated fuzzy AHP and fuzzy TOPSIS approach to assess sustainable urban development in an emerging economy. Multidiscip. Digit. Publ. Inst. 2019, 16, 2902. [Google Scholar] [CrossRef] [PubMed] [Green Version]
  14. Li, W.; Yi, P. Assessment of city sustainability—Coupling coordinated development among economy, society and environment. J. Clean. Prod. 2020, 256, 120453. [Google Scholar] [CrossRef]
  15. Qiao, X.; Zhang, Y.X. Evolution stages of oasis economy and its dependence on natural resources in Tarim River Basin. Chin. Geogr. Sci. 2009, 19, 135–143. [Google Scholar] [CrossRef] [Green Version]
  16. Hao, X.; Zhao, C.; Liu, C.; Yu, J.; Mitrovic, S.M. Assessment of water related ecological security under changing environment in China. Environ. Eng. Manag. J. 2018, 17, 1399–1410. [Google Scholar] [CrossRef]
  17. Peng, S.; Jin, Y. Study on the coupling and coordination relationship between urbanization and ecological environment in the Yangtze River economic belt of China. IOP Conf. Ser. Mater. Sci. Eng. 2019, 562, 12110–12116. [Google Scholar] [CrossRef]
  18. Zhou, J.; Fan, X.; Li, C.; Shang, G. Factors influencing the coupling of the development of rural urbanization and rural finance: Evidence from rural China. Land 2022, 11, 853. [Google Scholar] [CrossRef]
  19. Yang, Y.; Wang, R.; Tan, J. Coupling coordination and prediction research of tourism industry development and ecological environment in China. Discret. Dyn. Nat. Soc. 2021, 2021, 6647781. [Google Scholar] [CrossRef]
  20. Qi, Y.; Farnoosh, A.; Lin, L.; Liu, H. Coupling coordination analysis of China’s provincial water-energy-food nexus. Environ. Sci. Pollut. Res. 2022, 29, 23303–23313. [Google Scholar] [CrossRef]
  21. Xu, S.; He, W.; Shen, J.; Degefu, D.M.; Yuan, L.; Kong, Y. Coupling and coordination degrees of the core Water-Energy-Food nexus in China. Int. J. Environ. Res. Public Health 2019, 16, 1648. [Google Scholar] [CrossRef] [Green Version]
  22. Zhang, Q.; Zhang, Z.; Shi, P.; Singh, V.P.; Gu, X. Evaluation of ecological instream flow considering hydrological alterations in the Yellow River basin, China. Glob. Planet Chang. 2017, 160, 61–74. [Google Scholar] [CrossRef]
  23. Lin, L.; Xu, Y.; Pang, H. Change of hydrological and meteorological elements in the Yellow River source area and its impact on ecological environment. In Proceedings of the 2nd International Yellow River Forum on Keeping Healthy Life of the River, Zhengzhou, China, 16–21 October 2005; Volume 2. [Google Scholar]
  24. Sun, Q.; Zhang, X.; Zhang, H.; Niu, H. Coordinated development of a coupled social economy and resource environment system: A case study in Henan Province, China. Environ. Dev. Sustain. 2018, 20, 1385–1404. [Google Scholar] [CrossRef]
  25. Fan, Y.; Fang, C.; Zhang, Q. Coupling coordinated development between social economy and ecological environment in Chinese provincial capital cities-assessment and policy implications. J. Clean. Prod. 2019, 229, 289–298. [Google Scholar] [CrossRef]
  26. Geng, S.; Xie, Y. Research on coupling relation between tourism economy and ecological environment of China’s sub-provincial Cities. Urban Dev. Stud. 2013, 20, 91–97. [Google Scholar] [CrossRef]
  27. Li, H.; Hu, Q.; Hu, B. Research of coordinated development between marine economy and ecological environment in Zhejiang Province—Based on the perspective of a low-carbon economy. East China Econ. Manag. 2011, 25, 11–14. [Google Scholar] [CrossRef]
  28. Cui, D.; Chen, X.; Xue, Y.; Li, R.; Zeng, W. An integrated approach to investigate the relationship of coupling coordination between social economy and water environment on urban scale—A case study of Kunming. J. Environ. Manag. 2019, 234, 189–199. [Google Scholar] [CrossRef]
  29. Liao, M.L. Study on the coupling and coordination degree of high-quality economic development and ecological environment in Beijing-Tianjin-Hebei region. Appl. Ecol. Environ. Res. 2019, 17, 11069–11083. [Google Scholar] [CrossRef]
  30. Zhao, X. Coupling study of economic value, ecological value and social value of forests. Appl. Ecol. Environ. Res. 2019, 17, 8693–8712. [Google Scholar] [CrossRef]
  31. Wang, C.; Wang, R. Study on the coupling and coordinated development of tourism economy and ecological environment in Guilin city. IOP Conf. Ser. Earth Environ. Sci. 2020, 546, 32020–32026. [Google Scholar] [CrossRef]
  32. Za, A.; Mma, A.; Mnm, B.; Knc, D. Moving towards a sustainable environment: The dynamic linkage between natural resources, human capital, urbanization, economic growth, and ecological footprint in China. Resour. Policy 2020, 67, 101677. [Google Scholar] [CrossRef]
  33. Grimm, N.B.; Faeth, S.H.; Golubiewski, N.E.; Redman, C.L.; Wu, J.; Bai, X.; Briggs, J.M. Global change and the ecology of cities. Science 2008, 319, 756–760. [Google Scholar] [CrossRef] [PubMed] [Green Version]
  34. Stoate, C.; Boatman, N.D.; Borralho, R.J.; Carvalho, C.R.; Snoo, G.; Eden, P. Ecological impacts of arable intensification in Europe. J. Environ. Manag. 2001, 63, 337–365. [Google Scholar] [CrossRef] [PubMed]
  35. Dietz, T.; Rosa, E.A. Effects of population and affluence on CO2 emissions. Proc. Natl. Acad. Sci. USA 1997, 94, 175–179. [Google Scholar] [CrossRef] [Green Version]
  36. O’Neill, B.C.; Kriegler, E.; Riahi, K.; Ebi, K.L.; Hallegatte, S.; Carter, T.R.; Mathur, R.; Vuuren, D.P. A new scenario framework for climate change research: The concept of shared socioeconomic pathways. Clim. Chang. 2014, 122, 387–400. [Google Scholar] [CrossRef] [Green Version]
  37. Peponi, A.; Morgado, P. Transition to smart and regenerative urban places (SRUP): Contributions to a new conceptual framework. Land 2020, 10, 2. [Google Scholar] [CrossRef]
  38. Parmesan, C.; Yohe, G. A globally coherent fingerprint of climate change impacts across natural systems. Nature 2003, 421, 37–42. [Google Scholar] [CrossRef] [PubMed]
  39. Lin, Y. Coupling analysis of marine ecology and economy: Case study of Shanghai, China. Ocean. Coast Manag. 2020, 195, 105278. [Google Scholar] [CrossRef]
  40. Anser, M.K.; Usman, M.; Godil, D.I.; Shabbir, M.S.; Lopez, L.B. Correction to: Does globalization affect the green economy and environment? The relationship between energy consumption, carbon dioxide emissions, and economic growth. Environ. Sci. Pollut. Res. 2021, 28, 51119. [Google Scholar] [CrossRef]
  41. Zhao, S.; Jiang, Y.; Wang, S. Innovation stages, knowledge spillover, and green economy development: Moderating role of absorptive capacity and environmental regulation. Environ. Sci. Pollut. Res. 2019, 26, 25312–25325. [Google Scholar] [CrossRef]
Figure 1. Overview of the study area.
Land 11 01235 g001
Figure 2. Trend of the economic development index in the Yellow River basin (data obtained by averaging three standardized results).
Land 11 01235 g002
Figure 3. Evaluation of high-quality economic development in the provinces in the Yellow River basin from 2010 to 2019.
Land 11 01235 g003
Figure 4. Changes in the ecological integrated indexes in the Yellow River basin (data obtained by averaging three standardized results).
Land 11 01235 g004
Figure 5. SO2 and industrial wastewater emissions in the nine provinces during the study period.
Land 11 01235 g005
Figure 6. Evaluation of the ecological situation in the provinces in the Yellow River basin during 2010–2019.
Land 11 01235 g006
Figure 7. Coupling degree and coupling coordination degree evaluation results. (a) Equation (1A), (b) Equation (1B), and (c) Equation (1C).
Land 11 01235 g007
Figure 8. Spatial distribution of the coupling degree of the economy and ecology in the Yellow River basin.
Land 11 01235 g008
Figure 9. Spatial distribution of the coupling coordination degree in the Yellow River basin.
Land 11 01235 g009
Figure 10. Yellow River basin high-quality development evaluation results.
Land 11 01235 g010
Figure 11. Degrees of the factors constraining coupled coordination of economic and ecological development in the Yellow River basin provinces.
Land 11 01235 g011
Table 1. Index system of economic development and resources of the environment.
Index SystemSubsystemsSecondary IndicatorsDescriptionIndex TypeWeights
Economic development systemPopulation indicatorsPopulation density (People/km2)Population distribution of the region+0.29
Economic volumeGrowth rate of fixed asset investment (%)Government Investment Level+0.26
GDP per capita (104 yuan)Economic level of the region+0.13
Development densityProportion of construction land (%)Level of Urbanization+0.2
Proportion of tertiary industry (%)Structure of industry+0.12
Ecological environment systemPollution emissionsSO2 emissions (104 ton)Pollutant emission in industrial production process0.18
Industrial wastewater emissions (104 ton)Pollutant emission in industrial production process0.20
Pollution treatmentSewage treatment plant treatment rate (%)Efforts on pollution abatement+0.19
Ecological constructionGreen space coverage in built-up areas (%)Efforts on afforestation of city+0.22
Per capita water resources (104 ton)Amount of water available for use+0.21
Table 2. Classification of the coupling degree.
Coupling DegreeTypeDescription
0–0.29Low coupledThe relationships between the systems are chaotic and have little correlation.
0.3–0.49Slightly coupledThere are some slight interrelationships between the systems, and changes in one system can affect the other system to some extent.
0.5–0.79Moderately coupledThe systems show positive interrelationships and influence each other’s changes.
0.8–1Highly coupledThe interrelationships between the systems are getting stronger and stronger, are gradually moving toward order, and are in a highly interactive state.
Table 3. Classification of coupling coordination degree.
Coupling Coordination DegreeTypeDescription
0–0.4High maladjustmentThe systems are gamed and little coordination exists.
0.41–0.59Mild maladjustmentThe system is on the verge of dissonance and exhibits a mild degree of incoherence.
0.6–0.79Primary coordinationThe system has some coordination relationship and has a consistent direction or process of development.
0.8–1Quality coordinationThe systems develop in a coordinated manner, exhibiting a high degree of coherence and mutual promotion.
Publisher’s Note: MDPI stays neutral with regard to jurisdictional claims in published maps and institutional affiliations.

