Article

Geomorphological and Structural Assessment of the Coastal Area of Capo Faro Promontory, NE Salina (Aeolian Islands, Italy)

1
Department of Earth Sciences, University of Turin, Via Valperga Caluso 35, 10125 Turin, Italy
2
Department of Earth, Environmental and Resources Science—DiSTAR, University of Naples Federico II, Via Vicinale Cupa Cintia 21, 80126 Naples, Italy
3
Department of Earth Sciences “A. Desio”, University of Milan, Via Mangiagalli 34, 20133 Milan, Italy
4
Department of Mathematical and Computer Science, Physical Sciences and Earth Sciences, University of Messina, Via F. Stagno d’Alcontres 31, 98166 Messina, Italy
*
Author to whom correspondence should be addressed.
Land 2022, 11(7), 1106; https://doi.org/10.3390/land11071106
Submission received: 27 June 2022 / Revised: 13 July 2022 / Accepted: 15 July 2022 / Published: 19 July 2022
(This article belongs to the Special Issue Land Modifications and Impacts on Coastal Areas)

Abstract

:
Capo Faro Promontory, located in Salina (Aeolian Islands, southern Italy), is a popular summer destination due to its volcanic morphologies, seaside, and enogastronomy. A flat area, right behind the scarp edge of a coastal cliff, hosts the Capo Faro Estate, one of the most renowned vineyards and residences on Salina Island. The promontory has been characterised in terms of geomorphological features. Remote sensing analysis, after nadir and off–nadir UAV flights, supports the field activities to explore the hazard to which the area is subjected. In particular, the coastal cliff turns out to be affected by a rapid retreat inducing landslides. Therefore, the cliff area has been investigated through a detailed stratigraphic and structural field survey. Using the generated high–resolution Digital Elevation Model, bathymetric–topographic profiles were extracted along the coastline facing the cliff. The thickness of volcanic deposits was evaluated to obtain a geological model of it. The main rock mass discontinuities have been characterised to define the structural features affecting the stability of the rock wall. The obtained results prove the contribution of such research fundamental in planning risk mitigation measures.

1. Introduction

With approximately 2300 residents, Salina is the second–most populated island of the Aeolian Archipelago (Sicily, southern Italy). It is overrun by mass tourism during the summer, reaching up to 15,000 visitors a day (based on media information and personal evaluation around the middle of August 2021). Tourists are interested in its worth for volcanic morphology, its three quaint coastal villages, and its enogastronomy, the reasons why Salina and the other six islands of the Archipelago are included in the World Heritage List. Being the most fertile of the Aeolian Islands, high–quality grapes are grown, from which the renowned wine “Malvasia” is obtained and exported all over the world. Furthermore, local people and visitors flock to the Salina beaches, often of limited width to manage all the bathers. As with the other six “sister” islands, Salina presents a considerable number of embayed pocket beaches [1,2,3], which are highly attractive due to the difficulty of access that often offers more discretion. The pocket beaches are backed by vertical cliffs a dozen metres high, as a consequence of the erosive process due to waves and weathering [4]. In this context, the geomorphological evolution induces a rapid cliff retreat, which triggers rockfalls and topples exploiting the discontinuities network [5,6,7] in the volcanic rock mass (e.g., joints and faults). Techniques in all fields of geology have been already explored in similar cases in the southern Italian peninsula [8,9,10,11,12,13], to define the hazardous conditions that could even provoke injuries or fatalities. Assessing these conditions, it is possible to find the best solution to address the risk mitigation measures or to fix them where they become ineffective, in a broad scenario of coastal management [14,15,16].
In this paper, the approach to this issue integrates geomorphology, morpho–stratigraphy, and structural geology. It deals with the hazard assessment of a coastal cliff in Capo Faro Promontory, in the north–eastern part of Salina Island, in the vicinity of Capo Faro Estate residence and vineyard. The aim was to provide valid support to future risk mitigation interventions, suggesting prevention tools to slow down the natural retreat process and to simultaneously secure the beach from sudden gravitational phenomena.

2. Geological Setting

2.1. The Aeolian Geodynamics

Salina belongs to the Aeolian volcanic province, consisting of seven islands and several seamounts. The volcanic arc extends for about two hundred kilometres, around the seamount Marsili and the homonymous basin, with the concave part pointing towards the centre of the Tyrrhenian Sea (Figure 1). This constitutes a key area to unravel the geodynamic framework of this Mediterranean sector, the regional tectonic trends, and Africa–Europa subduction–related processes. The subaerial zones of the eruptive complex (the islands) have formed in the last 250,000 years, while the submerged parts are older: the oldest, about 1.3 million years, is the submarine volcano Sisifo, to the northwest of the island of Alicudi. Volcanism is still active at Stromboli and Vulcano and dormant at Panarea and Lipari; in the other islands the volcanic activity ceased between 10,000 and 30,000 years ago [17,18].
The geodynamic interpretation of Aeolian volcanism is controversial and is still debated today. According to some authors [19,20,21,22], the Aeolian islands represent a volcanic arc in an advanced evolutionary stage due to the geochemical affinity and the presence of very deep seismicity (>500 km) in the southern Tyrrhenian Sea. The arc is linked to the active subduction of the Ionian plate under the Calabrian arc. Conversely, other authors [23,24,25,26] state that the subduction stopped about 1 My ago, when both the Calabrian arc and the Apennine chain were affected by extensional tectonics, which lead to the opening of the Tyrrhenian back–arc basin, and by a general uplift. From this perspective, the Aeolian Islands would represent volcanism linked to post–collisional extension processes in a compressive margin. Three different sectors can be identified by different volcanic age and structural domains [27]: (i) the Western sector (1.3 My–0.05 My) located near the Sisifo–Alicudi Fault System (SA in Figure 1; WNW–ESE direction and transpressional regime) [28]; (ii) the Central sector (0.4 My–current) around the Tindari–Letojanni Fault System (TL in Figure 1; NNW–SSE direction and mixed regime, transpressional in its north–western sector and transtensional in the south–eastern one; (iii) the Eastern sector (0.8 My–current) characterised by a NE–SW fault system (extensional regime). The TL crosscut the SA and the extensional NE–SW fault system. The Moho discontinuity is shallower moving eastward, at depths greater than 25 km [17]. The distribution of the earthquake hypocenters and, above all their depth, suggests the presence of a Benioff plane inclined ~50–60° and dipping toward NW, located along the Ionic edge of Calabria. In addition, tomographies performed in the southern Tyrrhenian Sea show the presence of a cold lithosphere (anomalous positive velocities) diving towards NW [29]. Two domains can be distinguished from the seismological point of view: one characterised by shallow and deep seismicity (to the east) and one with exclusively shallow seismicity (to the west) [30].
Figure 1. The geographical framework of the Aeolian Islands in the southern Italian peninsula in the upper panel. Salina is in the Central sector of the archipelago and is the subaerial expression of a mostly submerged volcanic system at the intersection between SA and TL fault systems. In the lower panel, simplified geological map with the main synthems of Salina Island (modified from [31]).
Land 11 01106 g001

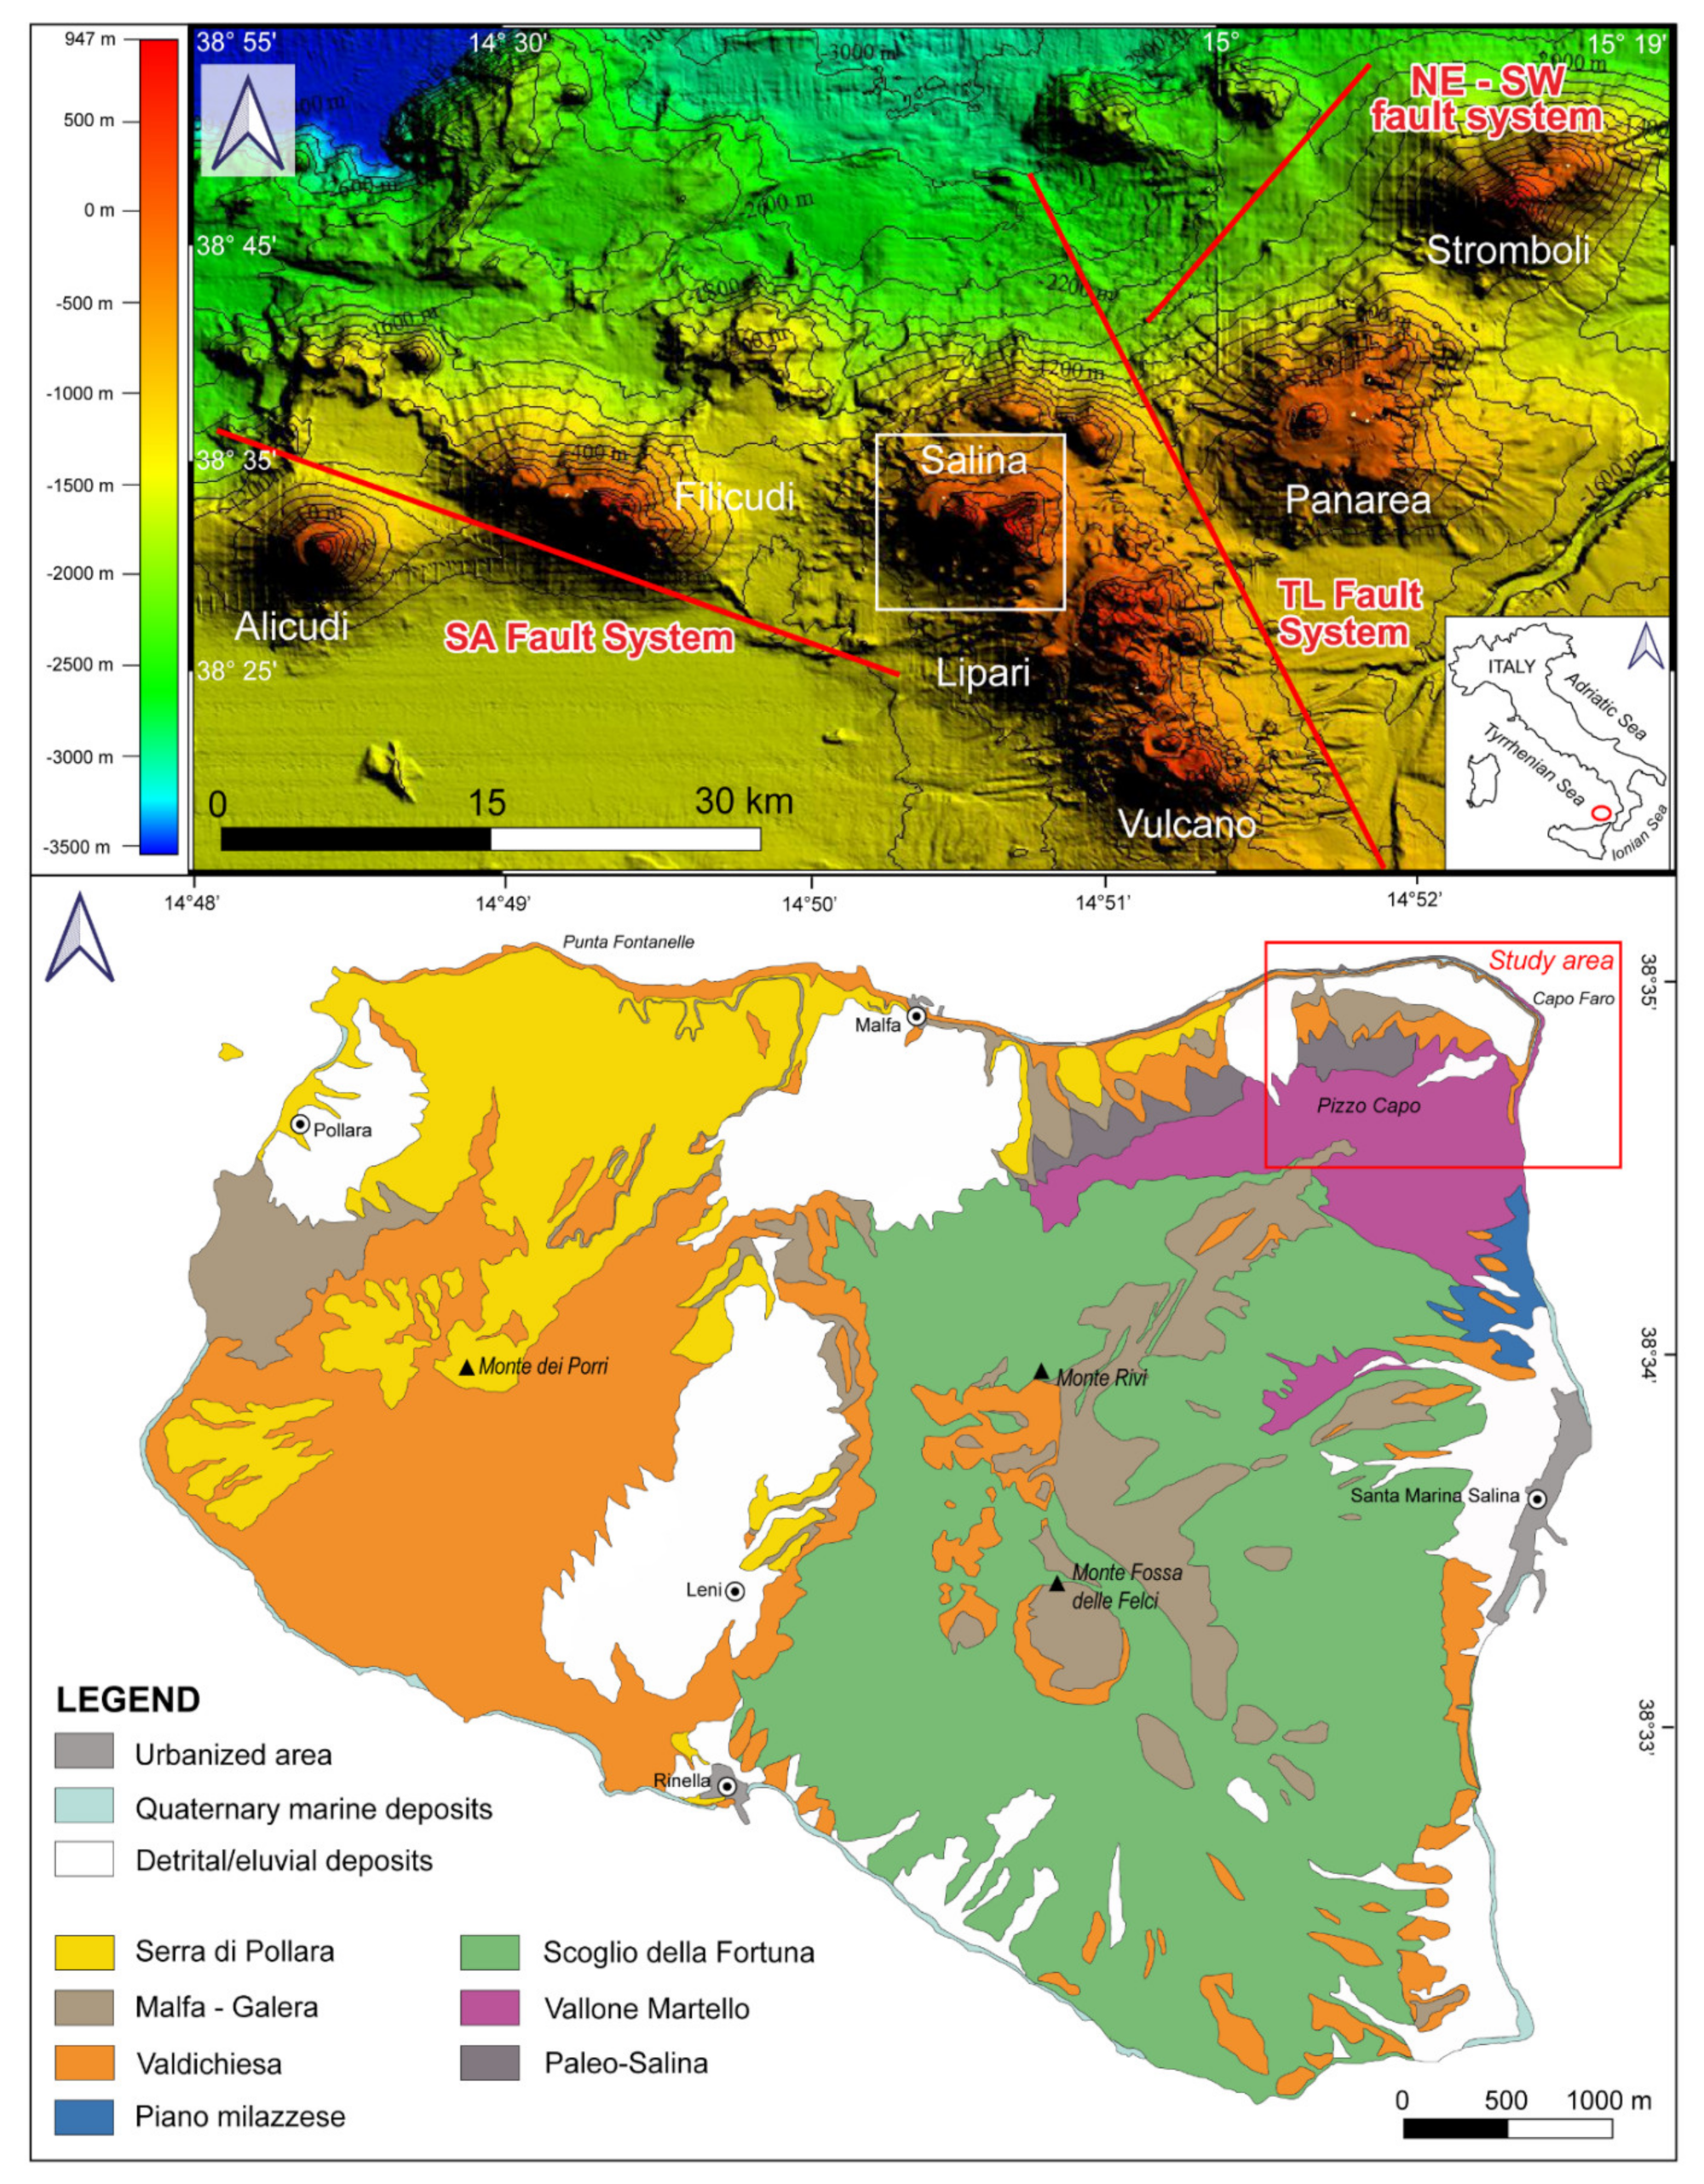
2.2. Salina Volcanological Evolution

The island, with a total surface area of 26.4 km2 and an altitude of 968 m a.s.l. (Monte Fossa delle Felci), is the subaerial expression of a volcanic complex (80–85% of the entire volume), situated in the Central sector (see Section 2.1), at the intersection between the arc–shaped structure of the archipelago and the NNW–SSE elongated Salina–Lipari–Vulcano volcanic belt, in correspondence with TL (Figure 1). The volcanic activity of Salina Island is controlled by both the local and regional tectonic framework [17,27,32,33,34,35,36]. The dominant geomorphological feature is represented by two twin stratocones, Monte dei Porri (859 m a.s.l.), located in the western sector, and Monte Fossa delle Felci, located in the south–eastern one, separated by a low–level area oriented N–S, with a rather complex structure. The two stratocones preserve a regular conical shape, similar in size and topography, giving the island a peculiar morphology.
The subaerial activity has evolved through six eruptive epochs during the Middle–Late Pleistocene [32], individuated by the identification and dating of marine terraces, erosional surfaces, and chronostratigraphic guide levels, by means of which geological maps of the island have been produced [31,37]. Five of the six periods belong to a central stratovolcano: (I) Pizzo Corvo (n.d.), (I–II) Pizzo Capo (ca. 244–226 ky), in Capo Faro Promontory, and (III) Monte Rivi (ca. 160–131 ky) which are barely recognisable from a morphological point of view, while (IV) Monte Fossa delle Felci (ca. 147–121 ky) and (V) Monte dei Porri (ca. 70–57 ky) are both almost perfectly preserved [38,39]. The most recent sixth eruption occurred on the north–western corner of the island between 30 and 15.6 ky ago and formed a semi–circular crater near the small village of Pollara. It represents an explosive large crater of about 1.5 km in diameter [40,41], whose activity produced widespread pumice deposits. Half of the tuff ring lies just above sea level. The only remains of the endogenic activities are post–volcanic phenomena such as gurgling and thermal springs, caused by the emission of underwater hydrogen sulphide and vapours. An uplift of the seafloor may occur at the peak of their activity.

2.3. Capo Faro Promontory Structural Features and Stratigraphy

The study area is in the NE coastal sector of Salina, at the Capo Faro Promontory, whose area is mostly covered by the lithological products of the Pizzo Capo and Monte dei Porri eruptive periods. Among the earlier volcanic events affecting Salina Island, the Pizzo Capo one originated from a NE–SW fissure belonging to the NE–SW extensional system, that affected the entire eastern sector of the Aeolian archipelago (see Section 2.1) [17,27,32]; alternatively, other authors [42] considered the Pizzo Capo activity as an expression of a radial dyke propagating from a central conduit. The Monte dei Porri activity developed in a tectonic context compatible with the TL fault system [33,43]. Moreover, the position of the later Pollara crater (NW of Salina) may suggest an NNW–SSE alignment with the Monte dei Porri cone, thus enforcing the hypothesis of the tectonic influence of the TL in the volcanic evolution (i.e., the westward shifting of the eruptive events; [32]). Furthermore, the fault systems present in this area might have been the cause of several collapse events which affected the Salina Island: (i) the collapse of the Salina Island from Monte Rivi to Pizzo Capo along a NE–SW structural discontinuity causing an asymmetric morphology of the edifice and (ii) the NW–dipping sector collapse of the NW flank of Monte dei Porri [42,43]. Specifically, in Capo Faro Promontory eleven units crop out, as described in [31,32] (Table 1).

3. Materials and Methods

An area of about 1.3 km2 in the north–eastern sector of Salina Island has been investigated through a geomorphological survey flanked by UAV flights in a 0.31 km2 target area in proximity of the coastal cliff. A morpho–stratigraphic characterization and a structural analysis of discontinuities were performed to model the cliff. The collected data were processed to understand the triggering conditions of geomorphological hazards.

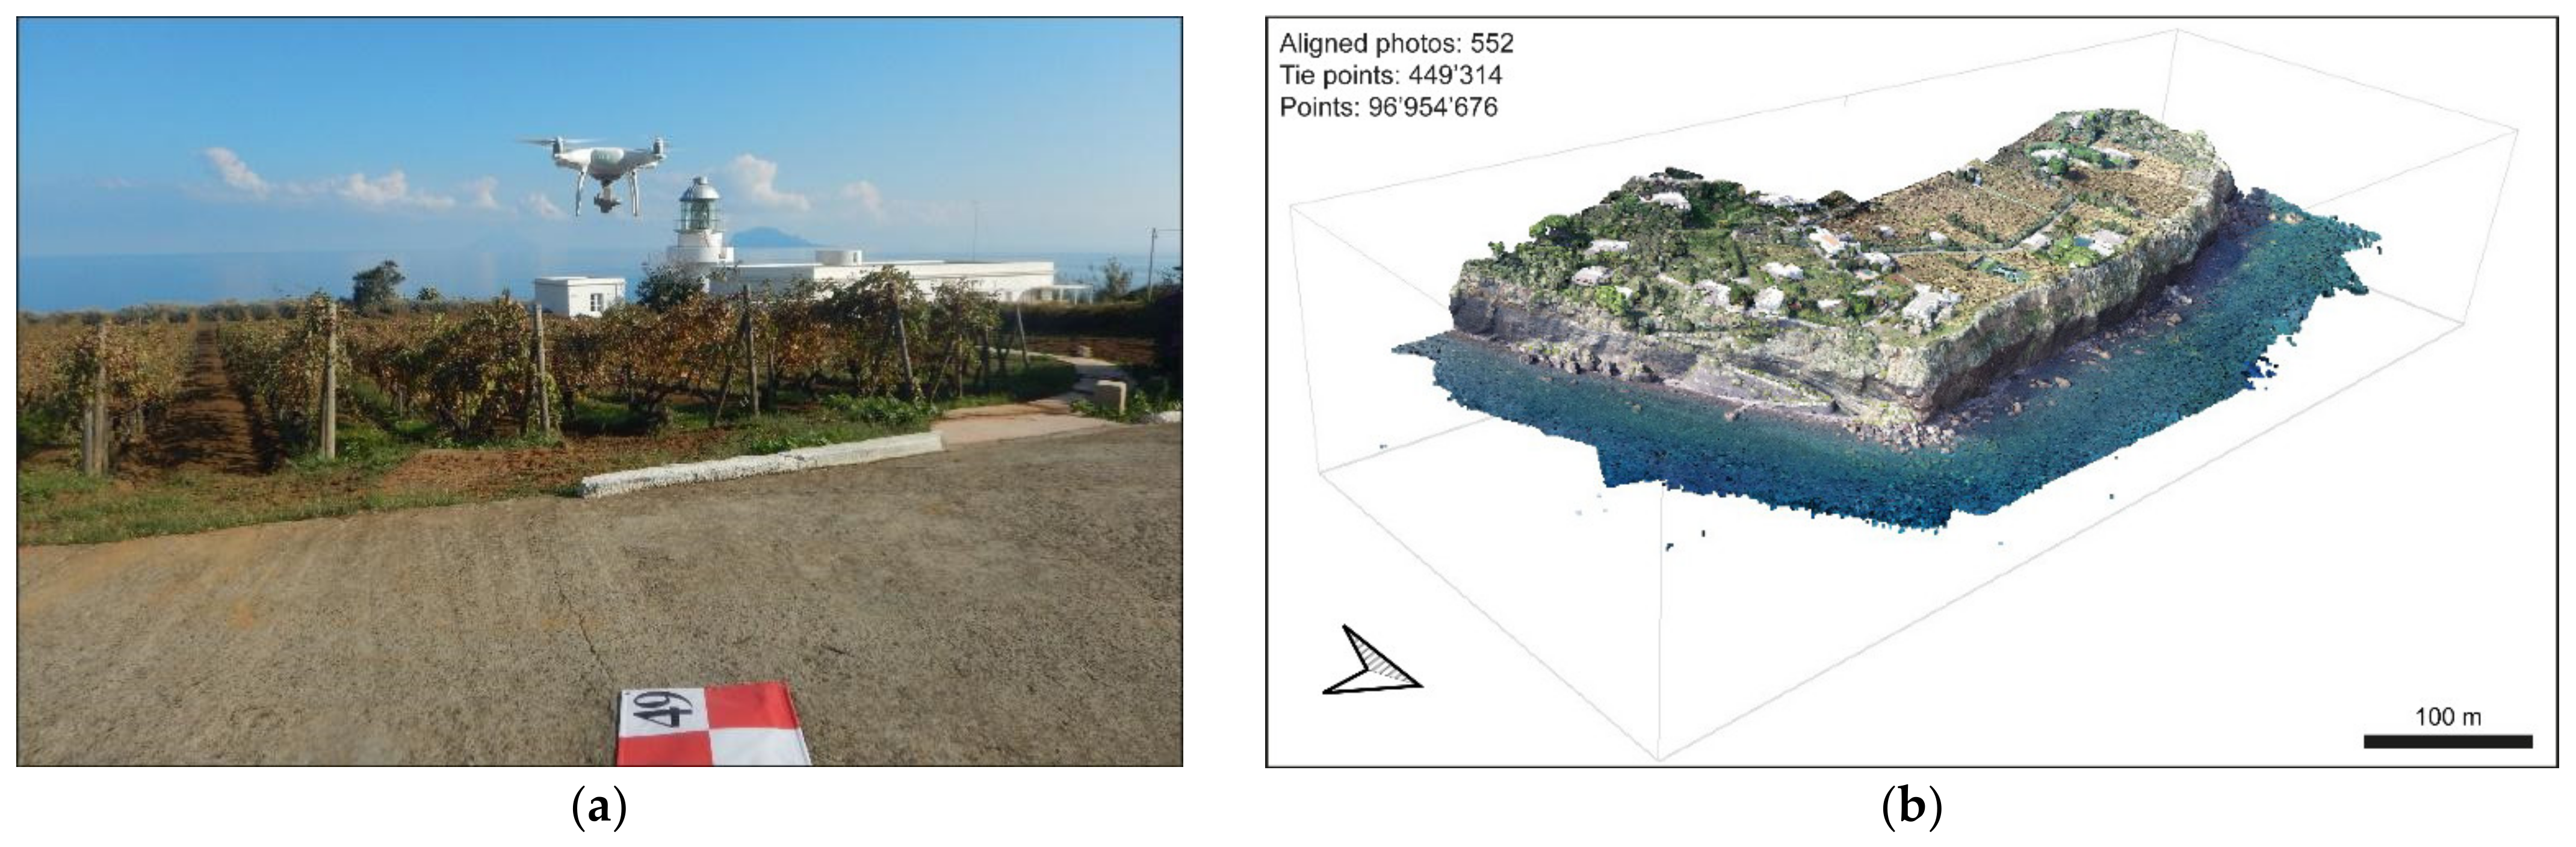
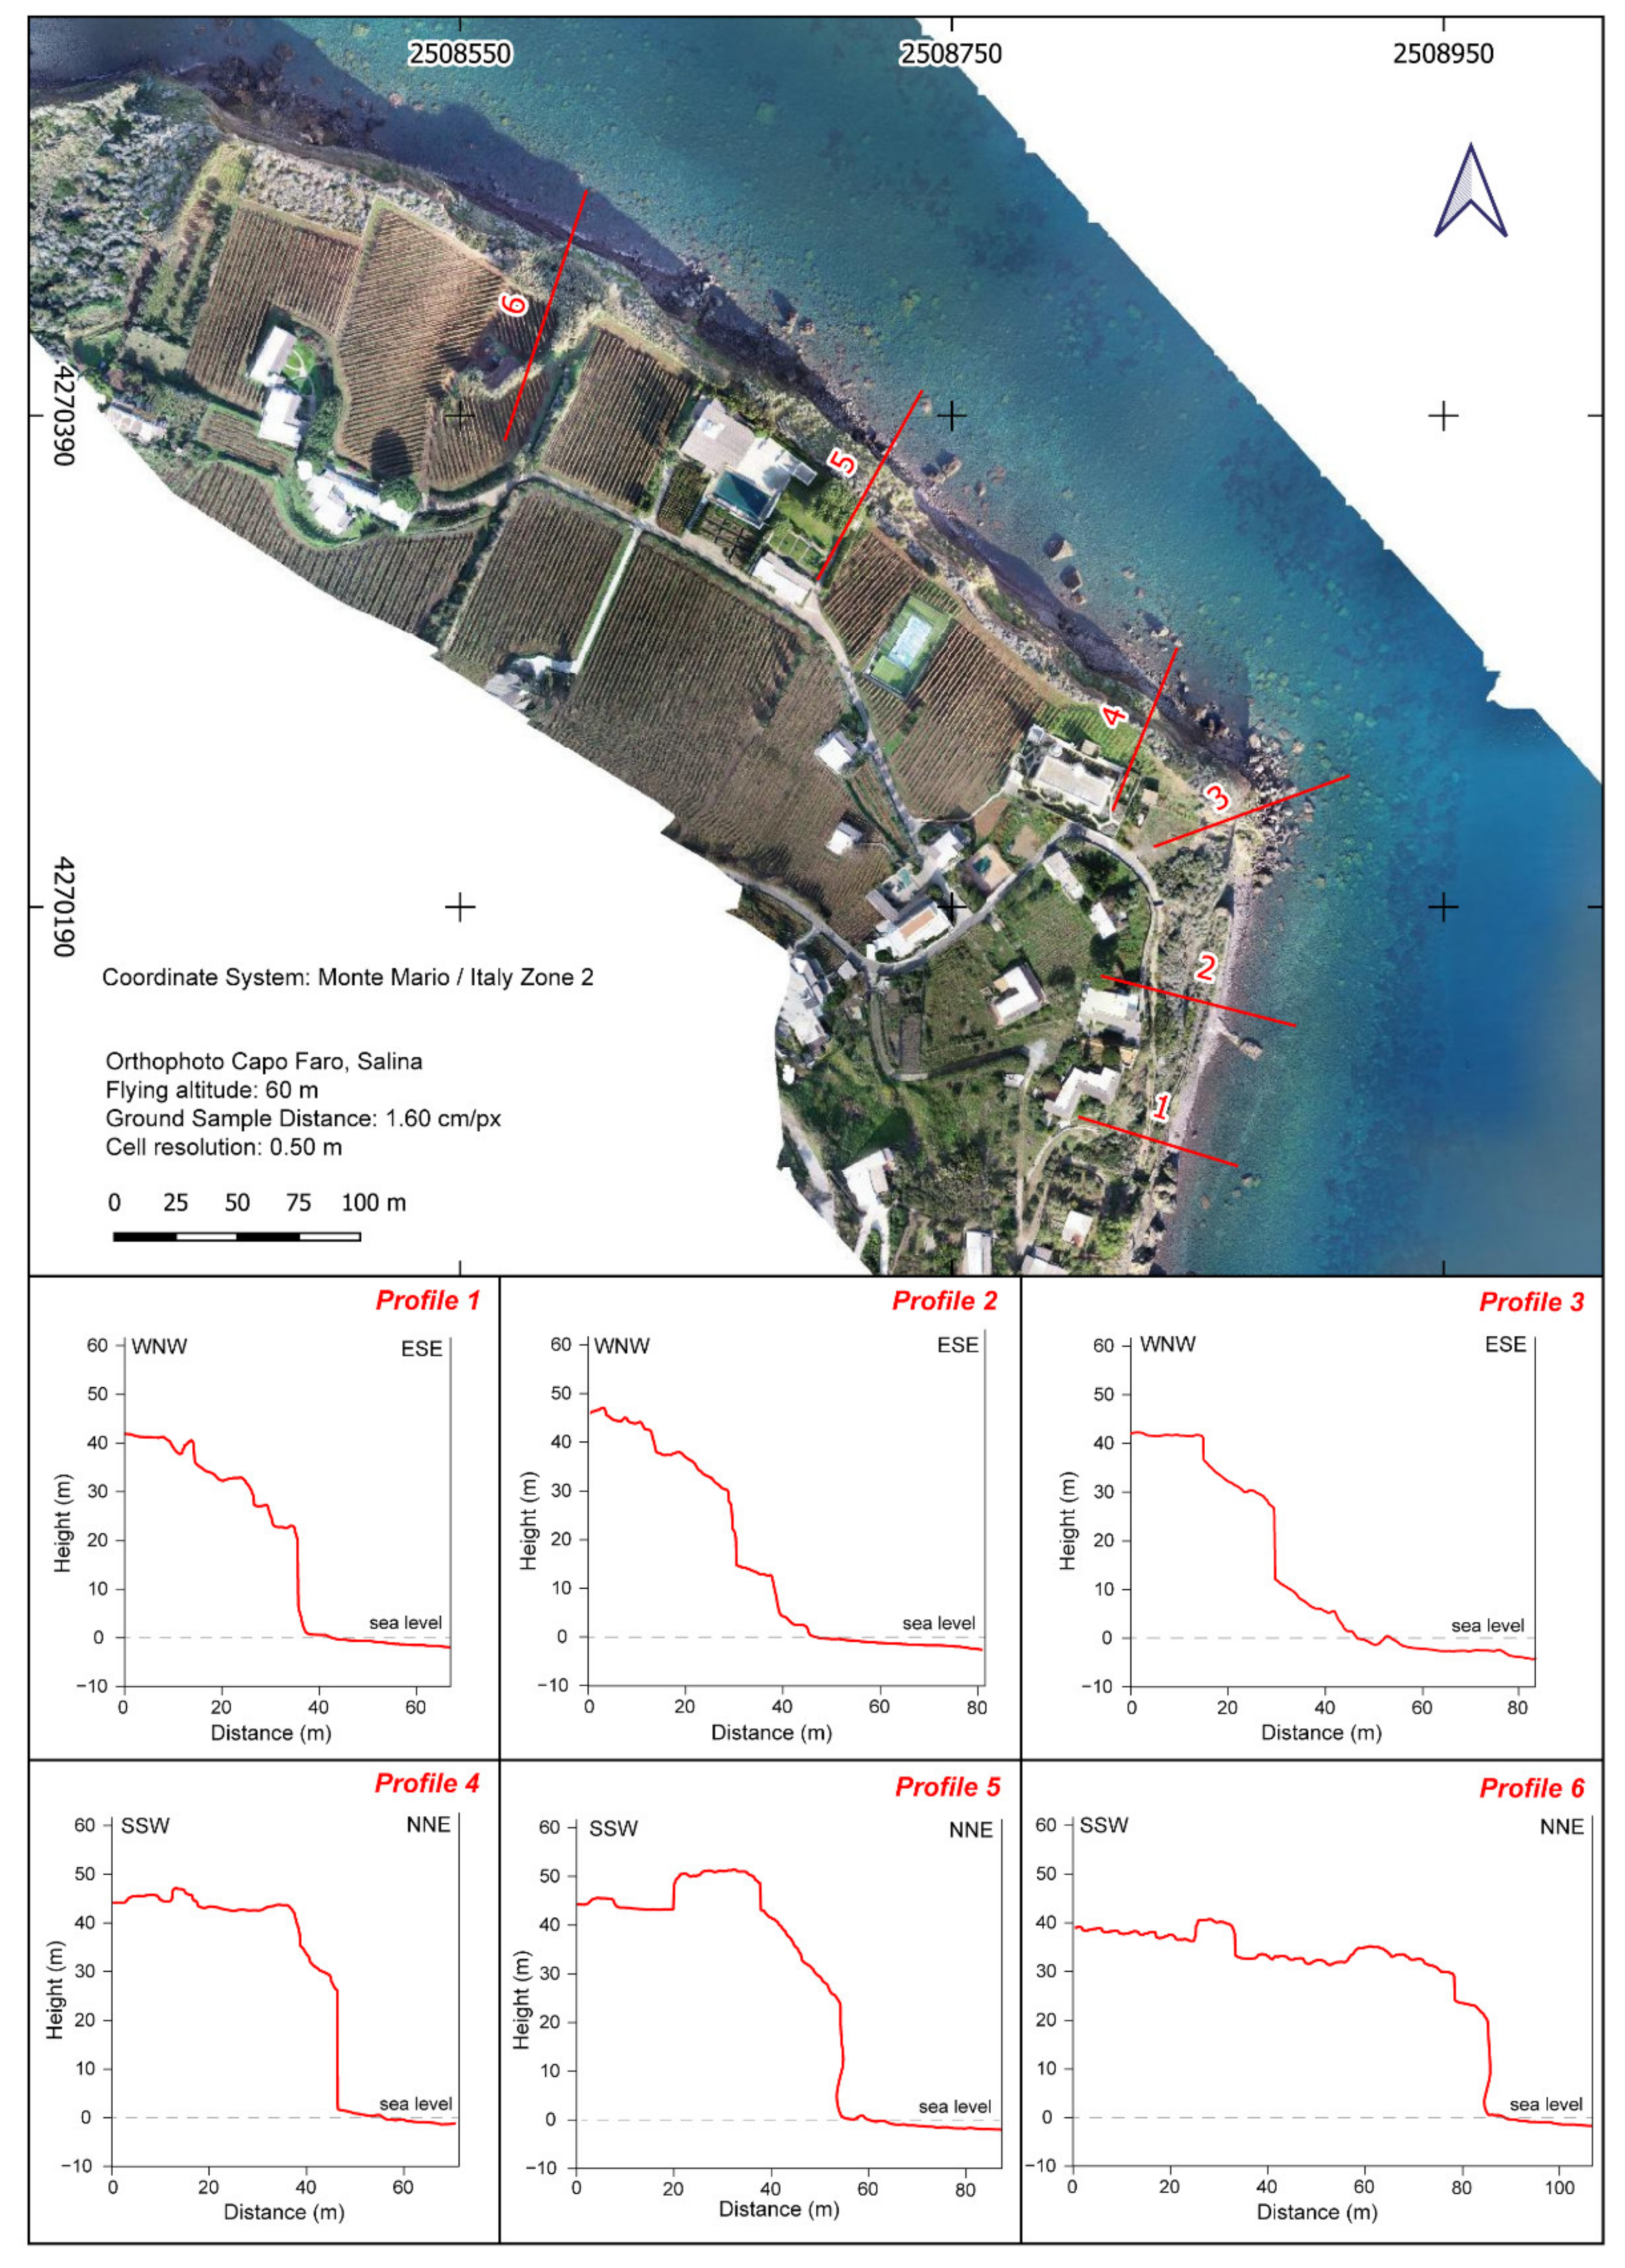
3.1. Field Survey and UAV Flights

The field activities took place during the end of summer 2021 along the Capo Faro Promontory based on the identification of the outcropping units according to [31]. The geomorphological field survey has been conducted using the 1:10,000 topographic base of CTR (Carta Tecnica Regionale, “Sezione n. 581020bis Isola di Salina, Regione Siciliana 1994”) coupled with a 10 m resolution DEM (Digital Elevation Model, TINITALY; [44] (and references therein), from which the slope acclivity has been extracted in QGIS environment. Gravitational phenomena affecting or that could potentially occur in the area have been described by referring to the [45] classification.
After drawing a geomorphological map, the collection of information about morphology and geology has been necessary for the proximity of the cliff to evaluate the hazard affecting the rocky coastline. Hence, the stratigraphy of the outcropping units in terms of lithologies and their resistance properties has been evaluated. Due to the difficulties to investigate on the field a vertical cliff 40–60 metres high, nadir and off–nadir UAV flights have been conducted with good light exposure to be sure to have the same parts of the cliff in the shadow. The results of such stratigraphical investigations allow us to refine the known–in–literature thickness of deposits to obtain a geological model of the cliff as accurate as possible.
Structure–from–Motion (SfM) and Multi–View–Stereo (MVS) approaches have been used to obtain a 3D reconstruction of the tip of the Capo Faro Promontory. The two methods are based on combining photogrammetric notions and vision algorithms to compute 3D images as better explained in [46]. A dataset of overlapping pictures of the study cliff and its surface is necessary to run them. About seven hundred pictures have been shot with a Drone, a Phantom 4 Pro equipped with a 20 M pixels camera, 1 CMOS sensor with an 84° 8.8 mm/24 mm Field of View (FoV), from an altitude of 60 m and with a Ground Sampling Distance of 1.60 cm/pixel (Figure 2a). The collected data has been post–processed by Agisoft Metashape software. By using the SfM algorithm [47] 552 pictures have been aligned producing (i) a dense point cloud of the investigated cliff (Figure 2b); (ii) the internal calibration parameters [48] and (iii) the spatial distribution of the pictures. This procedure allowed the building of the 50 cm/pixel resolution ortho–mosaic, the 12 cm cell resolution Digital Elevation Model (DEM) and the textured 3D model.
From the high–resolution DEM, six profiles have been extracted through the QGIS plug–in Profile Tool. They have been traced longitudinally to the coastline and are partly topographic, partly bathymetric. For two of them, two geological cross–sections have been drawn using the collected stratigraphic field data.

3.2. Structural Analysis

The structural analysis has been conducted starting from a structural field survey by measuring the discontinuities orientations (i.e., dip direction and dip) on vertical coastal–cut exposures. The dataset consists of 148 faults with various displacements. The structural elements have been plotted on a lower hemisphere equal angle stereograph using the software Dips® 6 (RocScience; University of Toronto, Canada) dividing the planes into different families, each one named with the suffix K–. Moreover, with the above–mentioned software, the Markland Test [49] on two different orientated sub–vertical cliff–exposures has been performed to assess the influence of the measured discontinuities on gravitational phenomena triggering. The Markland Test was aimed at the evaluation of rock–fast events such as planar and wedge sliding, and toppling (both direct and oblique). These gravitational phenomena occur when an equilibrium condition is exceeded. Planar sliding is the failure of a rock mass along a plane, while wedge sliding occurs along the intersection line between two discontinuities. All the discontinuities and intersection lines between planes exceeding the frictional angle (φ′) are potential causes of planar and wedge sliding. The toppling to occur needs: (i) discontinuity dip direction parallel to the slope (20° of interval); (ii) discontinuity dipping toward the slope; (iii) the poles of the discontinuities must have a dip minor than the dip slope minus the frictional angle of the toppling planes [50,51]. This could be better explained by the overcoming of the frictional angle (see the Appendix A for calculation details).

4. Results

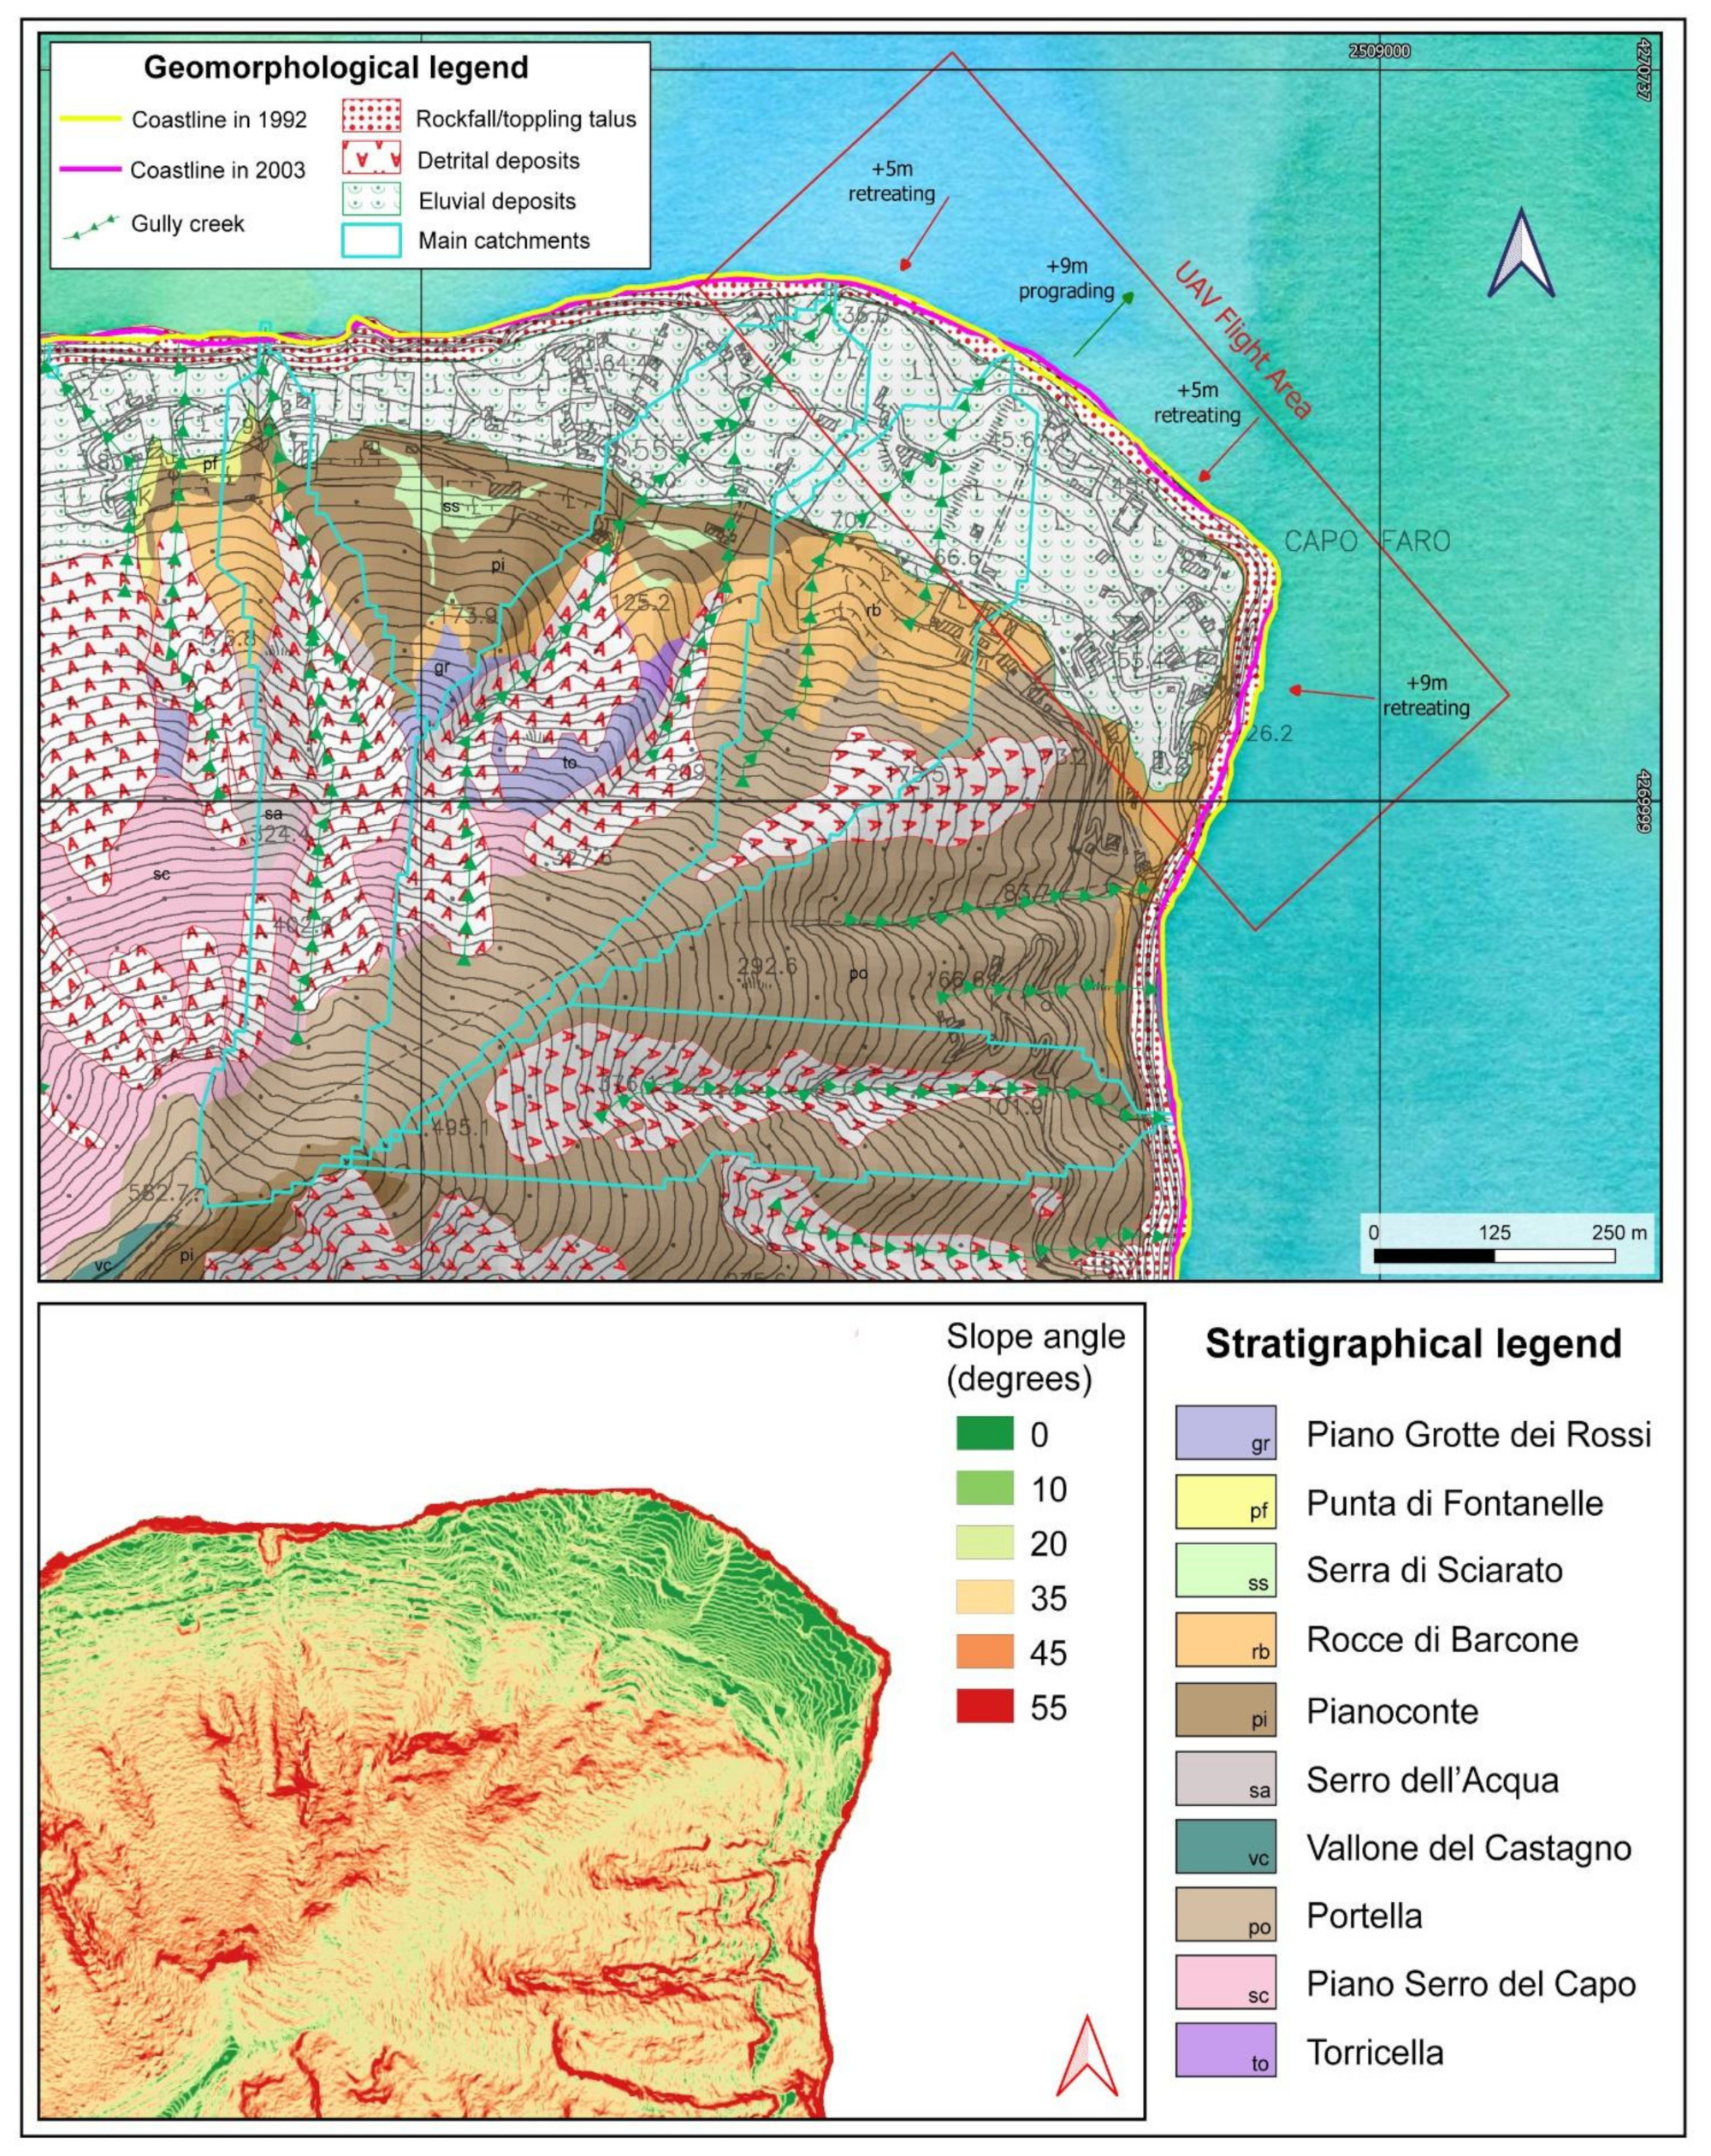
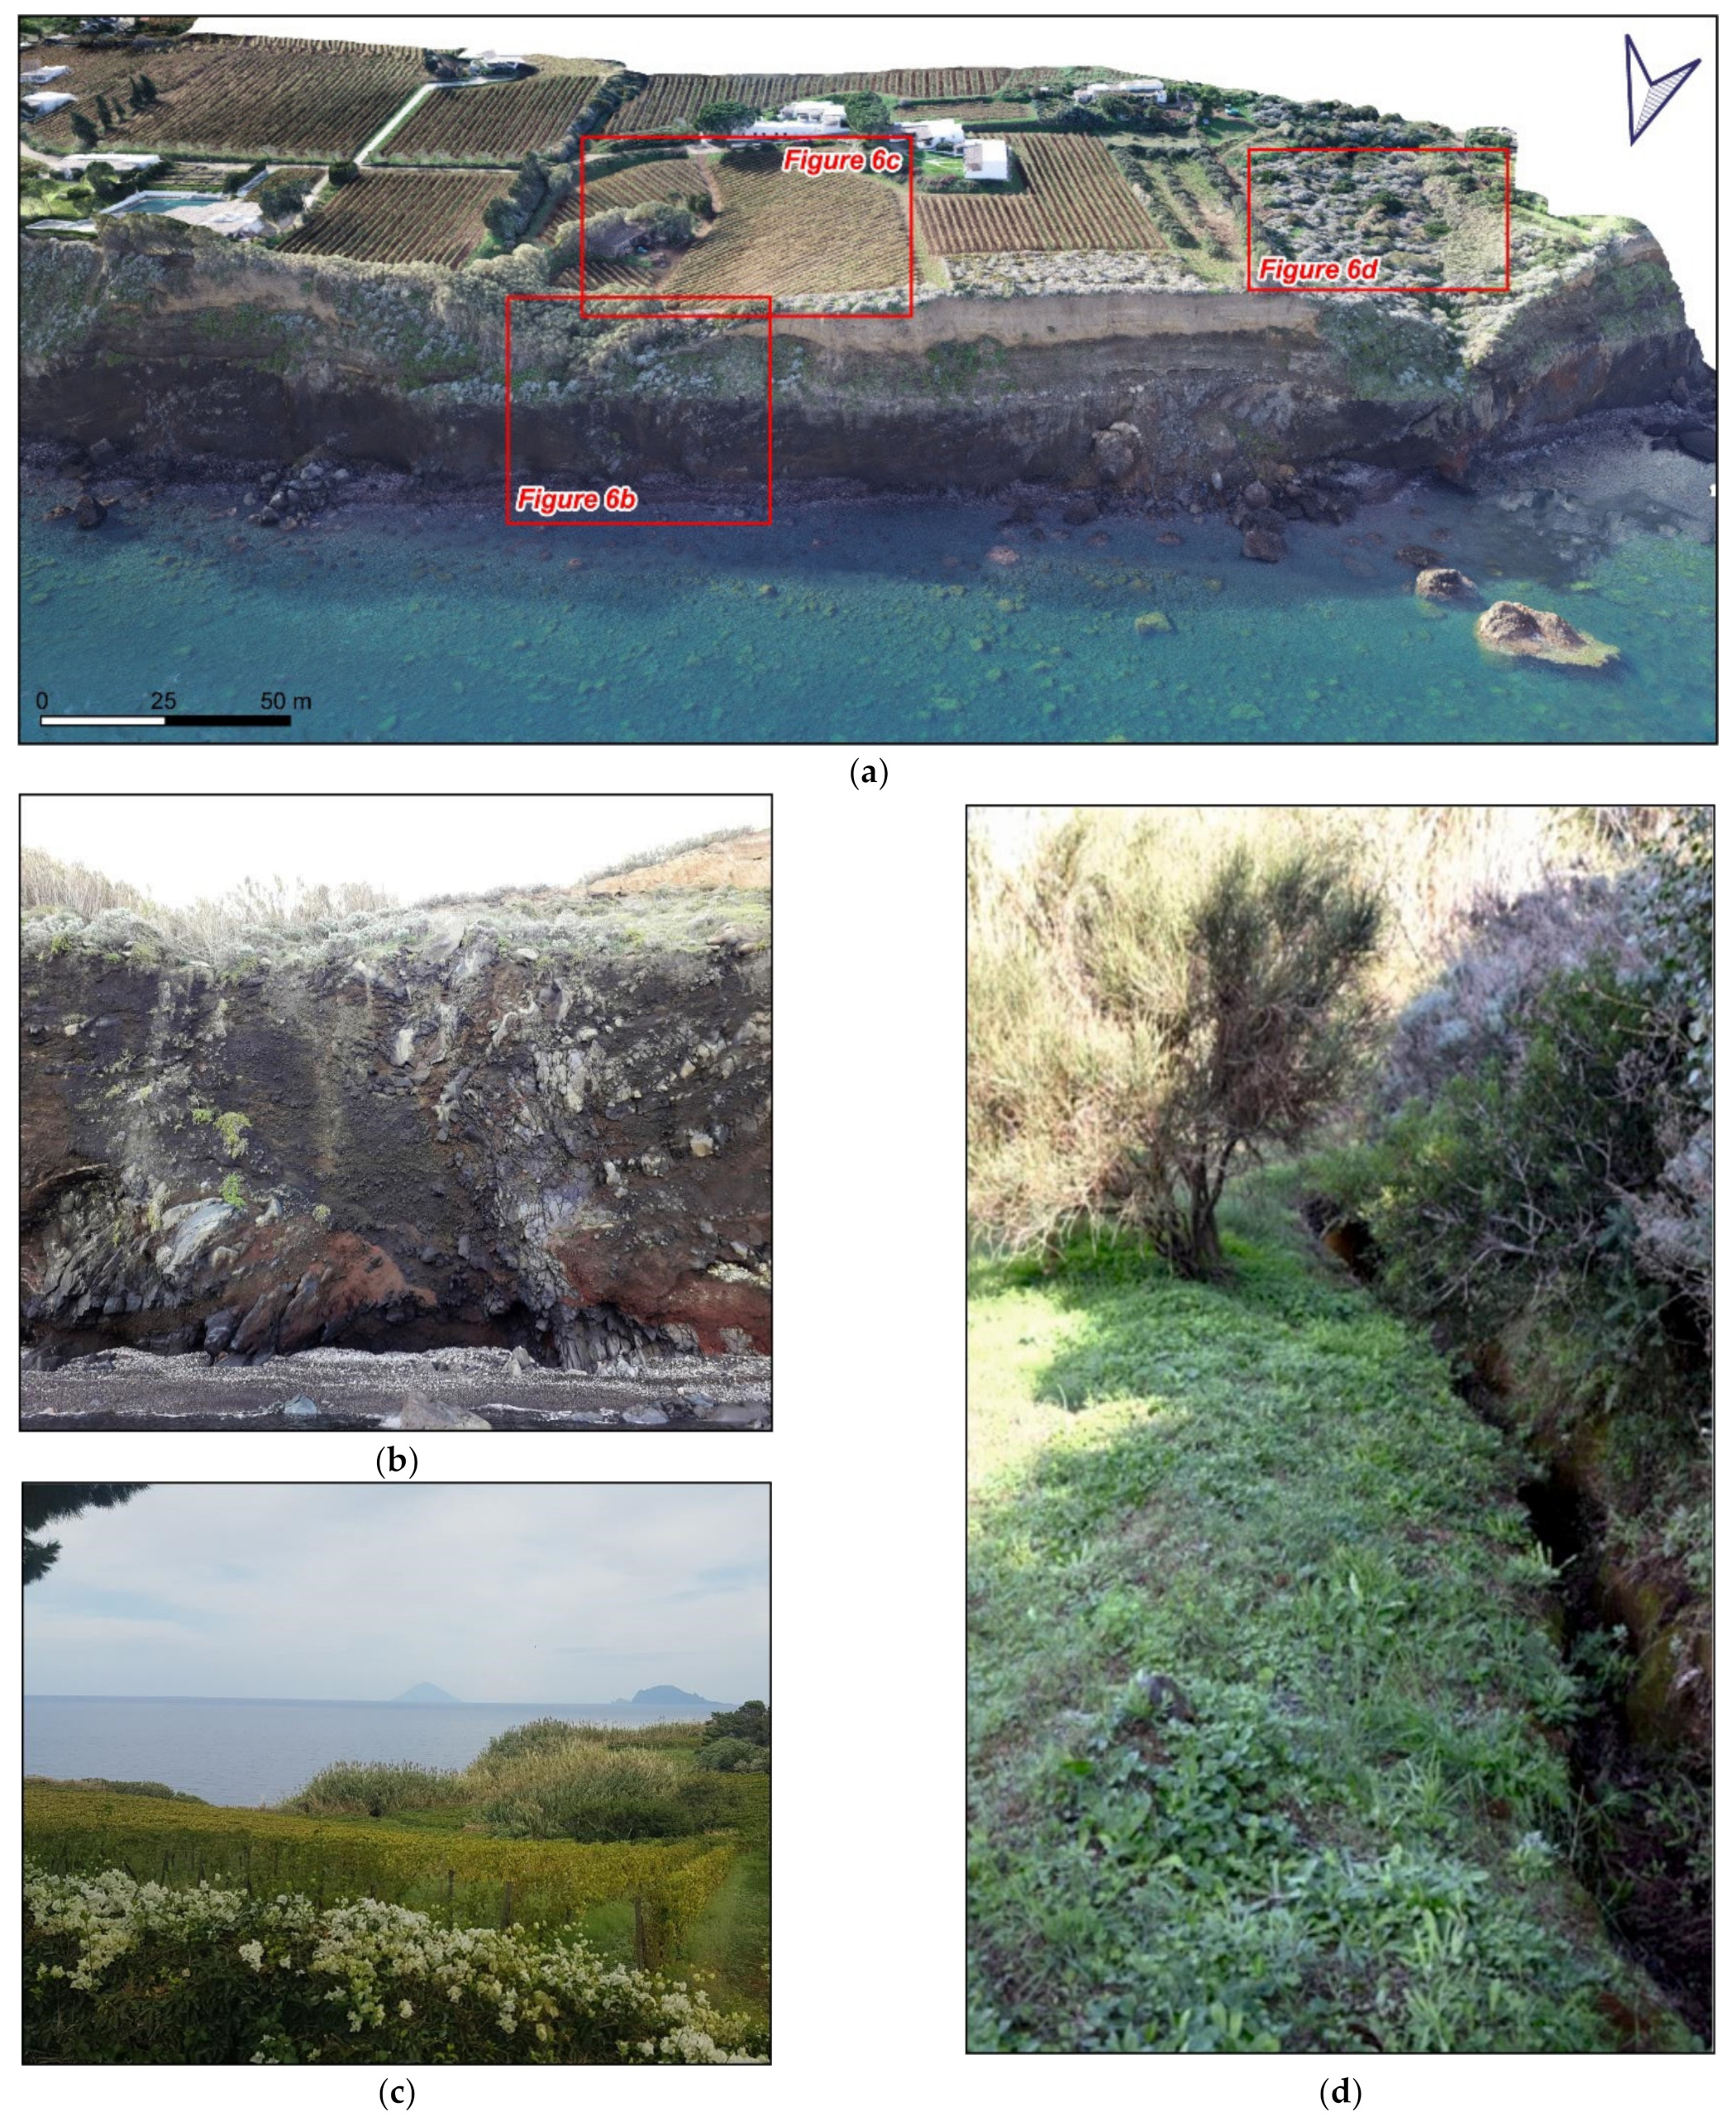
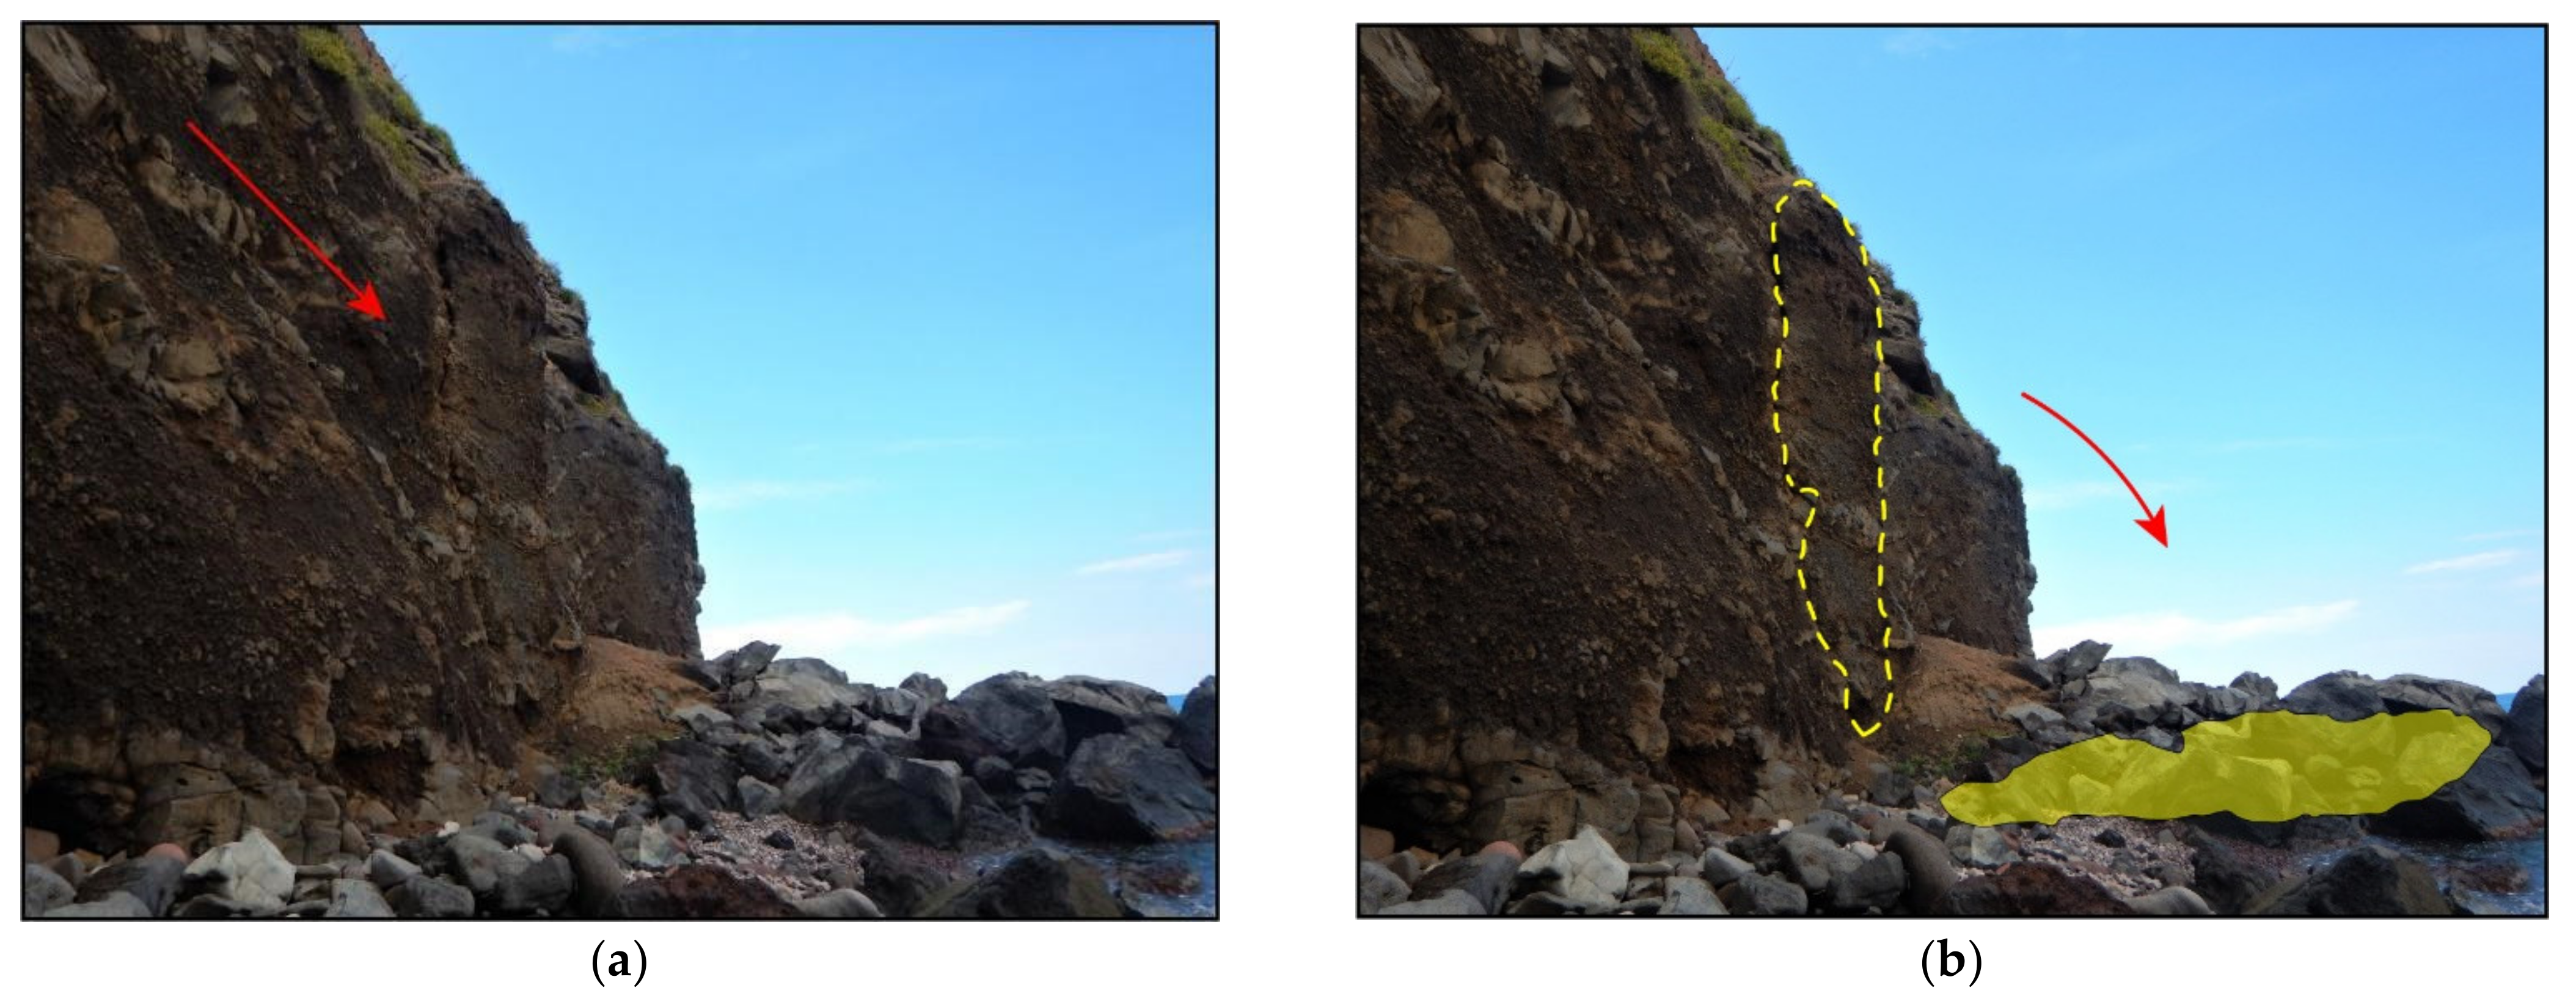
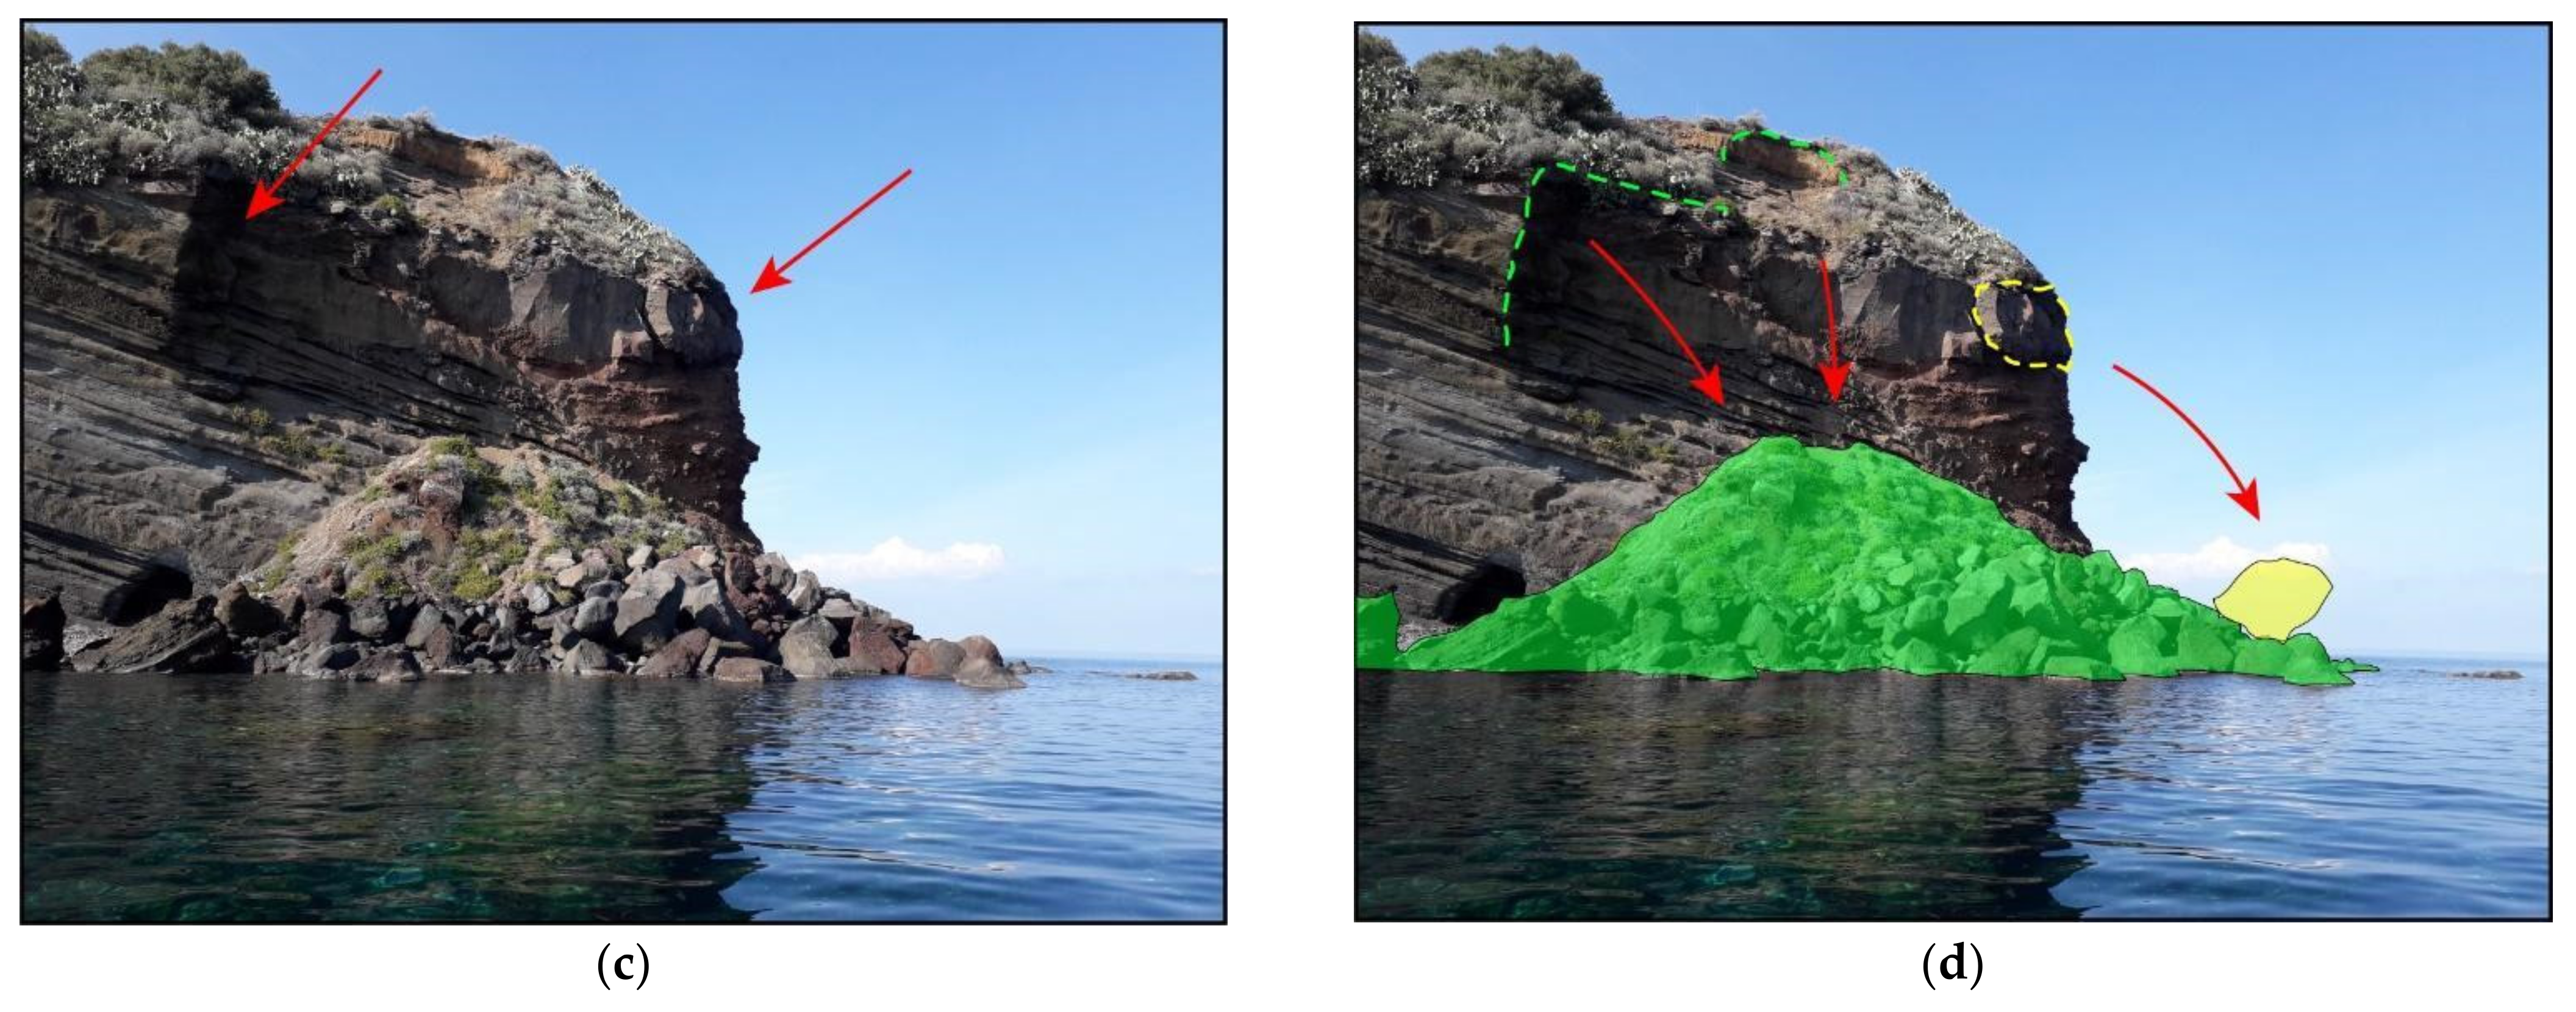
4.1. Geomorphological Features

The Capo Faro Promontory is characterised by a strip of flat surface where buildings, a lighthouse and the Capo Faro Estate with its vineyard are located (Figure 3). This small plateau is interrupted to the north–east and south–east by a 40–60 m–high coastal cliff (Figure 4a), and to the south–west by the north–eastern slope of the Pizzo Capo stratovolcano.
The intensity of morphogenetic processes relates to the recent dynamic context of the active volcanic area. The volcanic products are characterised by high erosion rates. The water and the gravity are the prevalent morphogenetic agents, as testified by a high–energy hydrographic network and by debris deposits widespread over the slope of Pizzo Capo. Both the watercourses and the detrital accumulation zones feature a radial pattern around the Pizzo Capo cone and reveal an accelerated erosion. Then, in the study area, the river pattern has an extremely low drainage density, influenced by the high permeability of the outcropping rocks. The watercourses are mostly characterised by narrow and elongated first–order talwegs which converge to form short second–order creeks. The main basin areas are limited in size (Figure 3). The incised deep gullies become less accentuated only in the proximity of the plateau facing the cliff.
The gravitational phenomena, dominant on slope acclivity >35°, are: (i) rockfalls in the sub–vertical head of the narrow channels and along their sides; (ii) debris flows along the channels with the associated debris cones in sub–aerial environment, often truncated by the active coastal cliff; (iii) rockfalls, topplings (Figure 4b) and rock avalanches (Figure 4c) affecting the frontal portion of the cliff (Figure 4b). The presence of detachment surfaces and cavities on the cliff, in addition to the disseminated boulders of remarkable size standing on the beach (Figure 4d), suggests the system is in retreat. On the other hand, the coastal area of the Capo Faro Promontory is susceptible to storm surges from N–NW which generate a very etched swash line 4–5 m above the foot of the escarpments (Figure 5). The speed of the phenomenon of dismantling is evident in the rapid retreat of the drainage system (Figure 6a). In particular, the morphological jumps of the riverbeds (hanging valleys) near the cliff edge (Figure 6b,c) show how this process is sometimes faster than the incision of the ditches (Figure 6d). They thus remain suspended.
Figure 3. The geomorphological map focused on coastal rockfall/toppling talus, on the detrital cover characterising the slope which shows the hydrography of Capo Faro Promontory. The boundaries of the river basins that encompass the main creeks have been traced. The evolution of the coastline between 1992 and 2003 has been shown with the estimate of its variation (taken from Piano Assetto Idrogeologico (PAI), https://www.sitr.regione.sicilia.it/pai/, accessed on 26 June 2022). The red arrows show the retreating next to Capo Faro cliff, the green ones show the prograding coastline in correspondence with the mouth of a little impluvium. The stratigraphy has been taken from [31]. The lower–left of the figure shows the slope gradient map.
Land 11 01106 g003
Figure 4. (a) The 3D model, generated after dense point cloud extraction by UAV photogrammetric flight through Agisoft Metashape, shows the flat area on which vineyards and buildings are located. It is bounded by an unstable coastal cliff with gravitational phenomena threatening the pocket beaches. (b,c) shooting areas are indicated by red squares; the yellow circle shows the zoomed 3D of Figure 6a; (b) Two large detachment surfaces and cavities of recent rockfalls characterising the cliff in question. The boulders in the foreground have an estimated size (through the dense point cloud) of about 1000 m3; (c) The eastern part of the sea cliff from the boat shows the impressive rock avalanche with the subsequent 30 m retreating at the tip of Capo Faro Promontory occurred in 2011. (d) shooting area is indicated by a red square; (d) A projecting big boulder (dashed yellow line) on the top of the scarp where a recent rockfall creates a detachment surface (dashed green line) parallel to the scarp. A red line indicates an open fracture in pyroclastic deposits.
Land 11 01106 g004
Figure 5. The 2D orthophoto, generated by a 60 m altitude UAV flight, on which six topographic profiles have been traced. As highlighted by profiles 4 and 5, the relief energy is higher in correspondence with the Capo Faro vineyard and the Capo Faro Estate, respectively. Profiles 3, 4 and 5 show a clear vertical cliff. Profiles 5 and 6 evidence the etched swash line at about 5 m a.s.l.
Land 11 01106 g005
Figure 6. (a) 3D textured model focused on the intense gully erosion affecting the flat land right behind the edge of the coastal cliff. (bd) shooting areas are indicated by red squares; (b) Hanging valley at the outlet of a wide channel. The erosive action of water caused the alteration of the pyroclastic deposits of the cliff; (c) The vineyard of Capo Faro Estate gently slopes into the hanging valley of (b); (d) The deep groove of a gully caused by runoff water.
Land 11 01106 g006

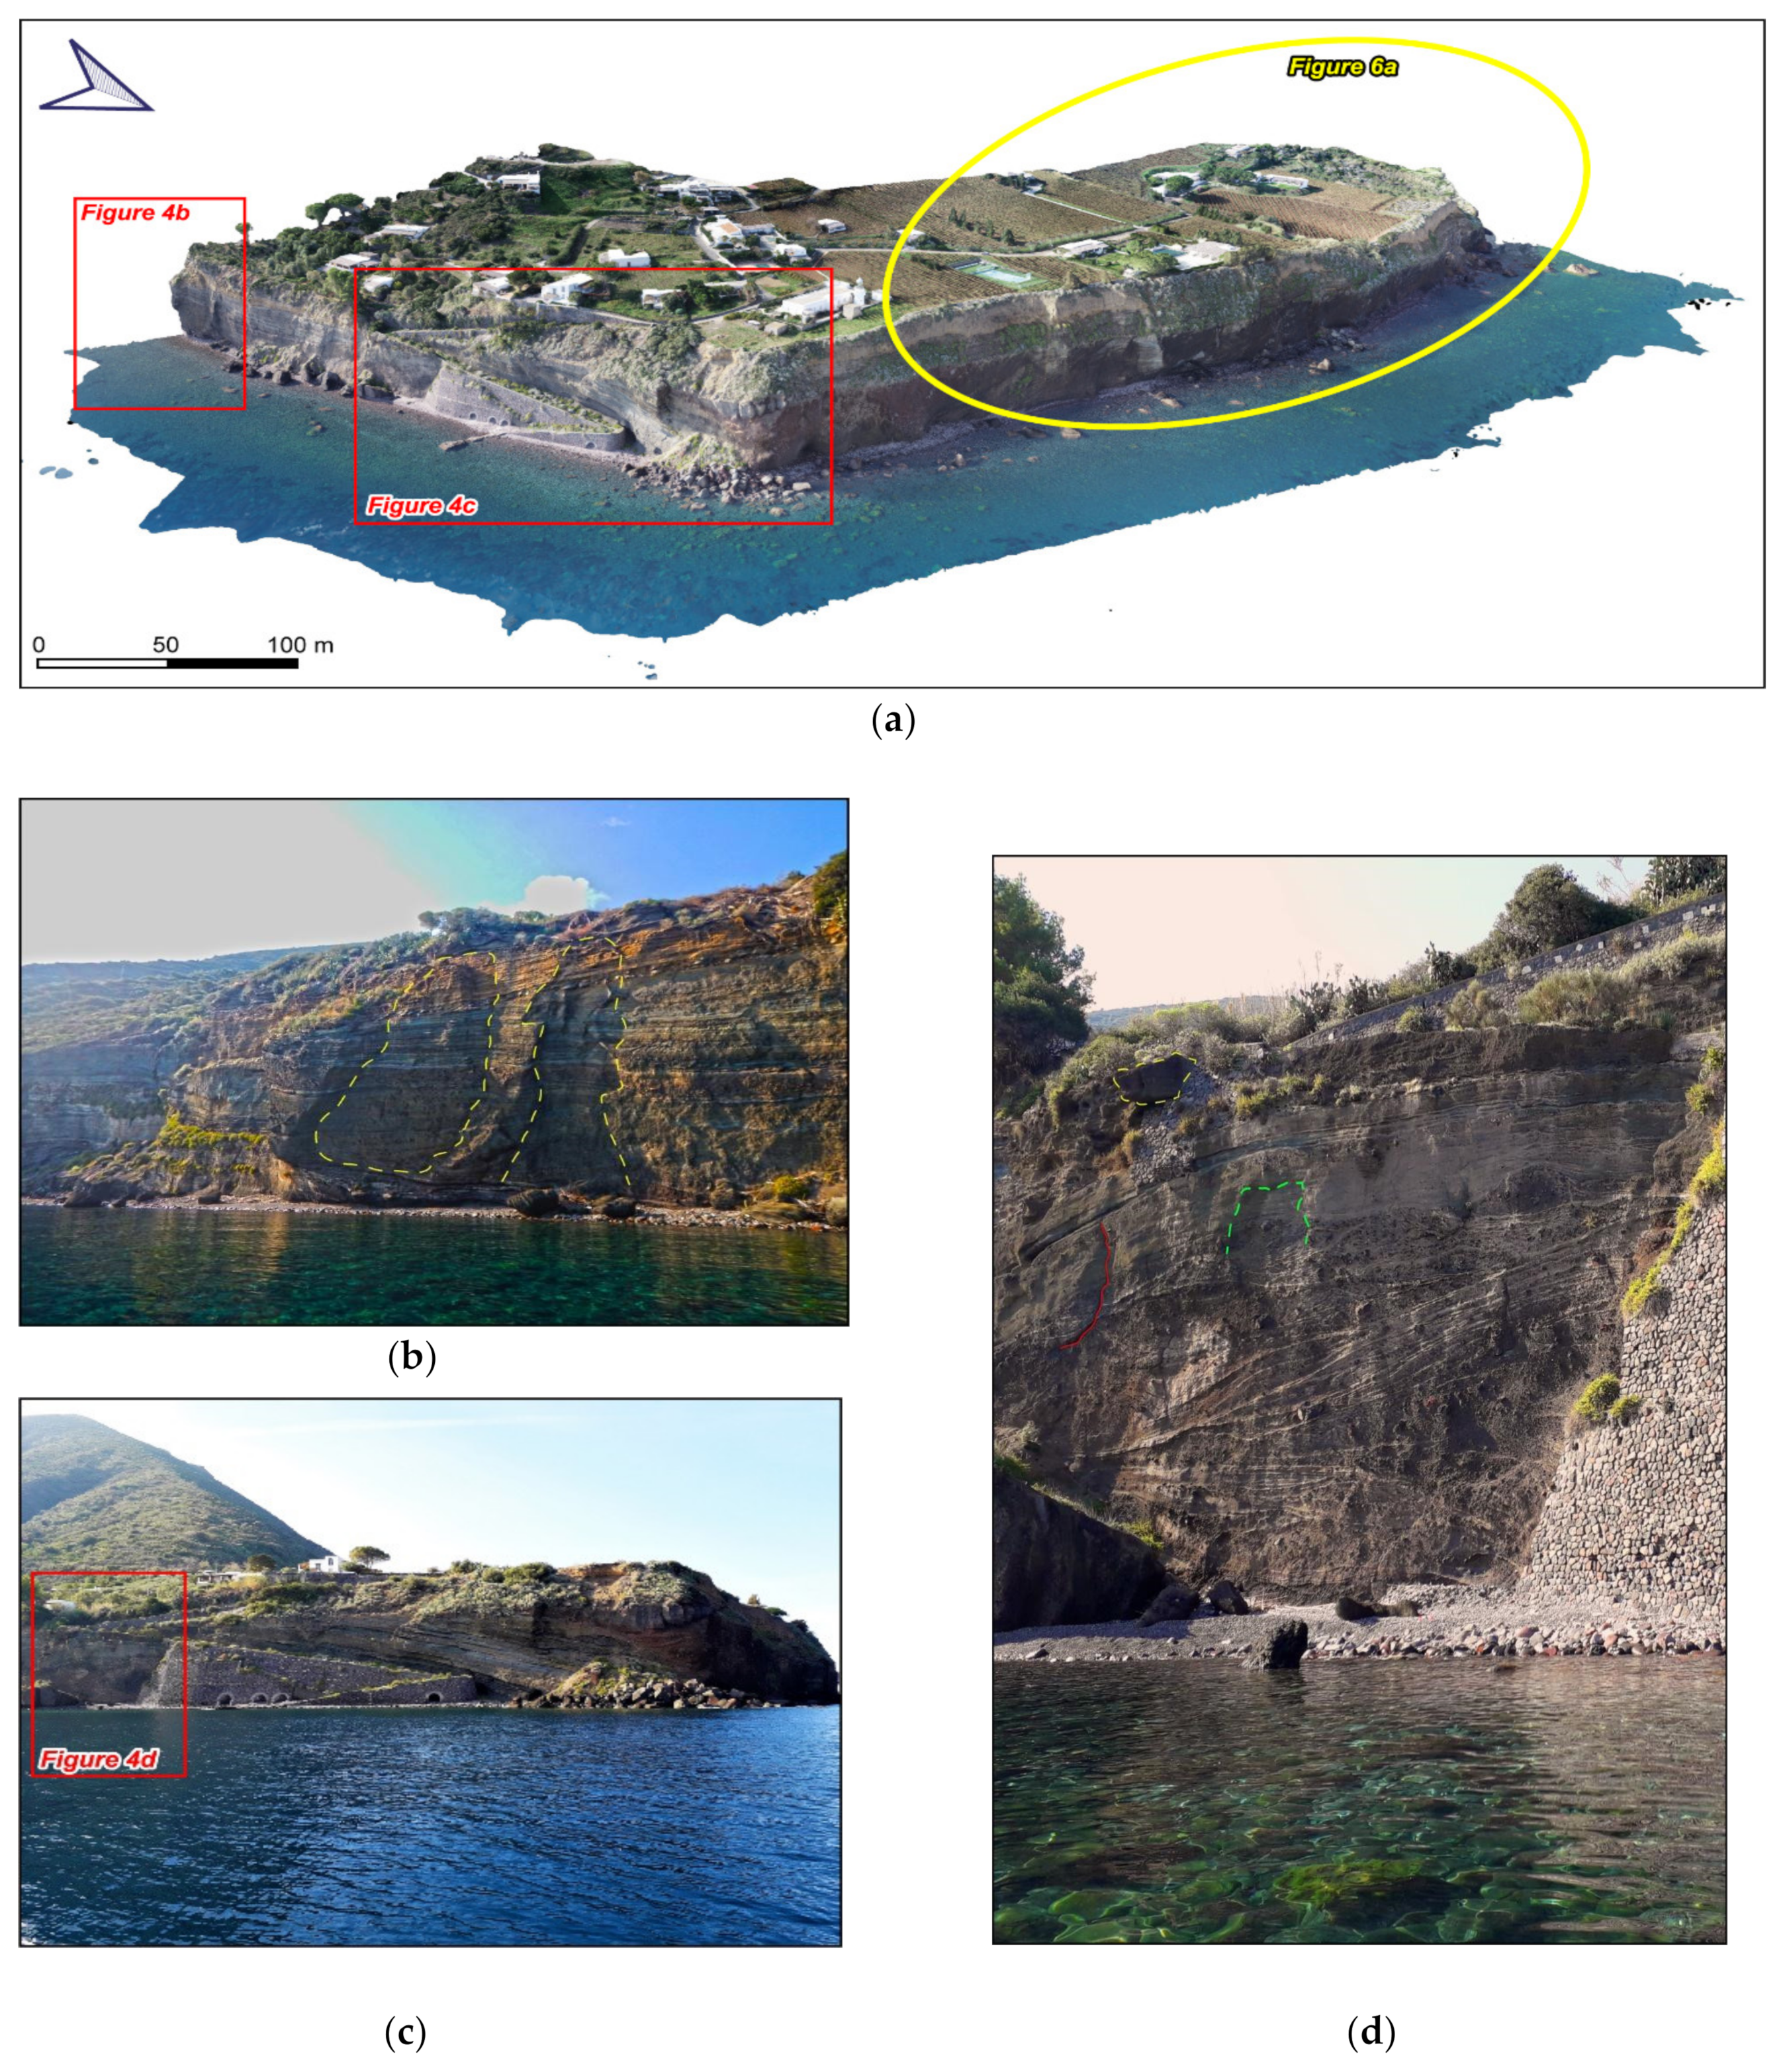
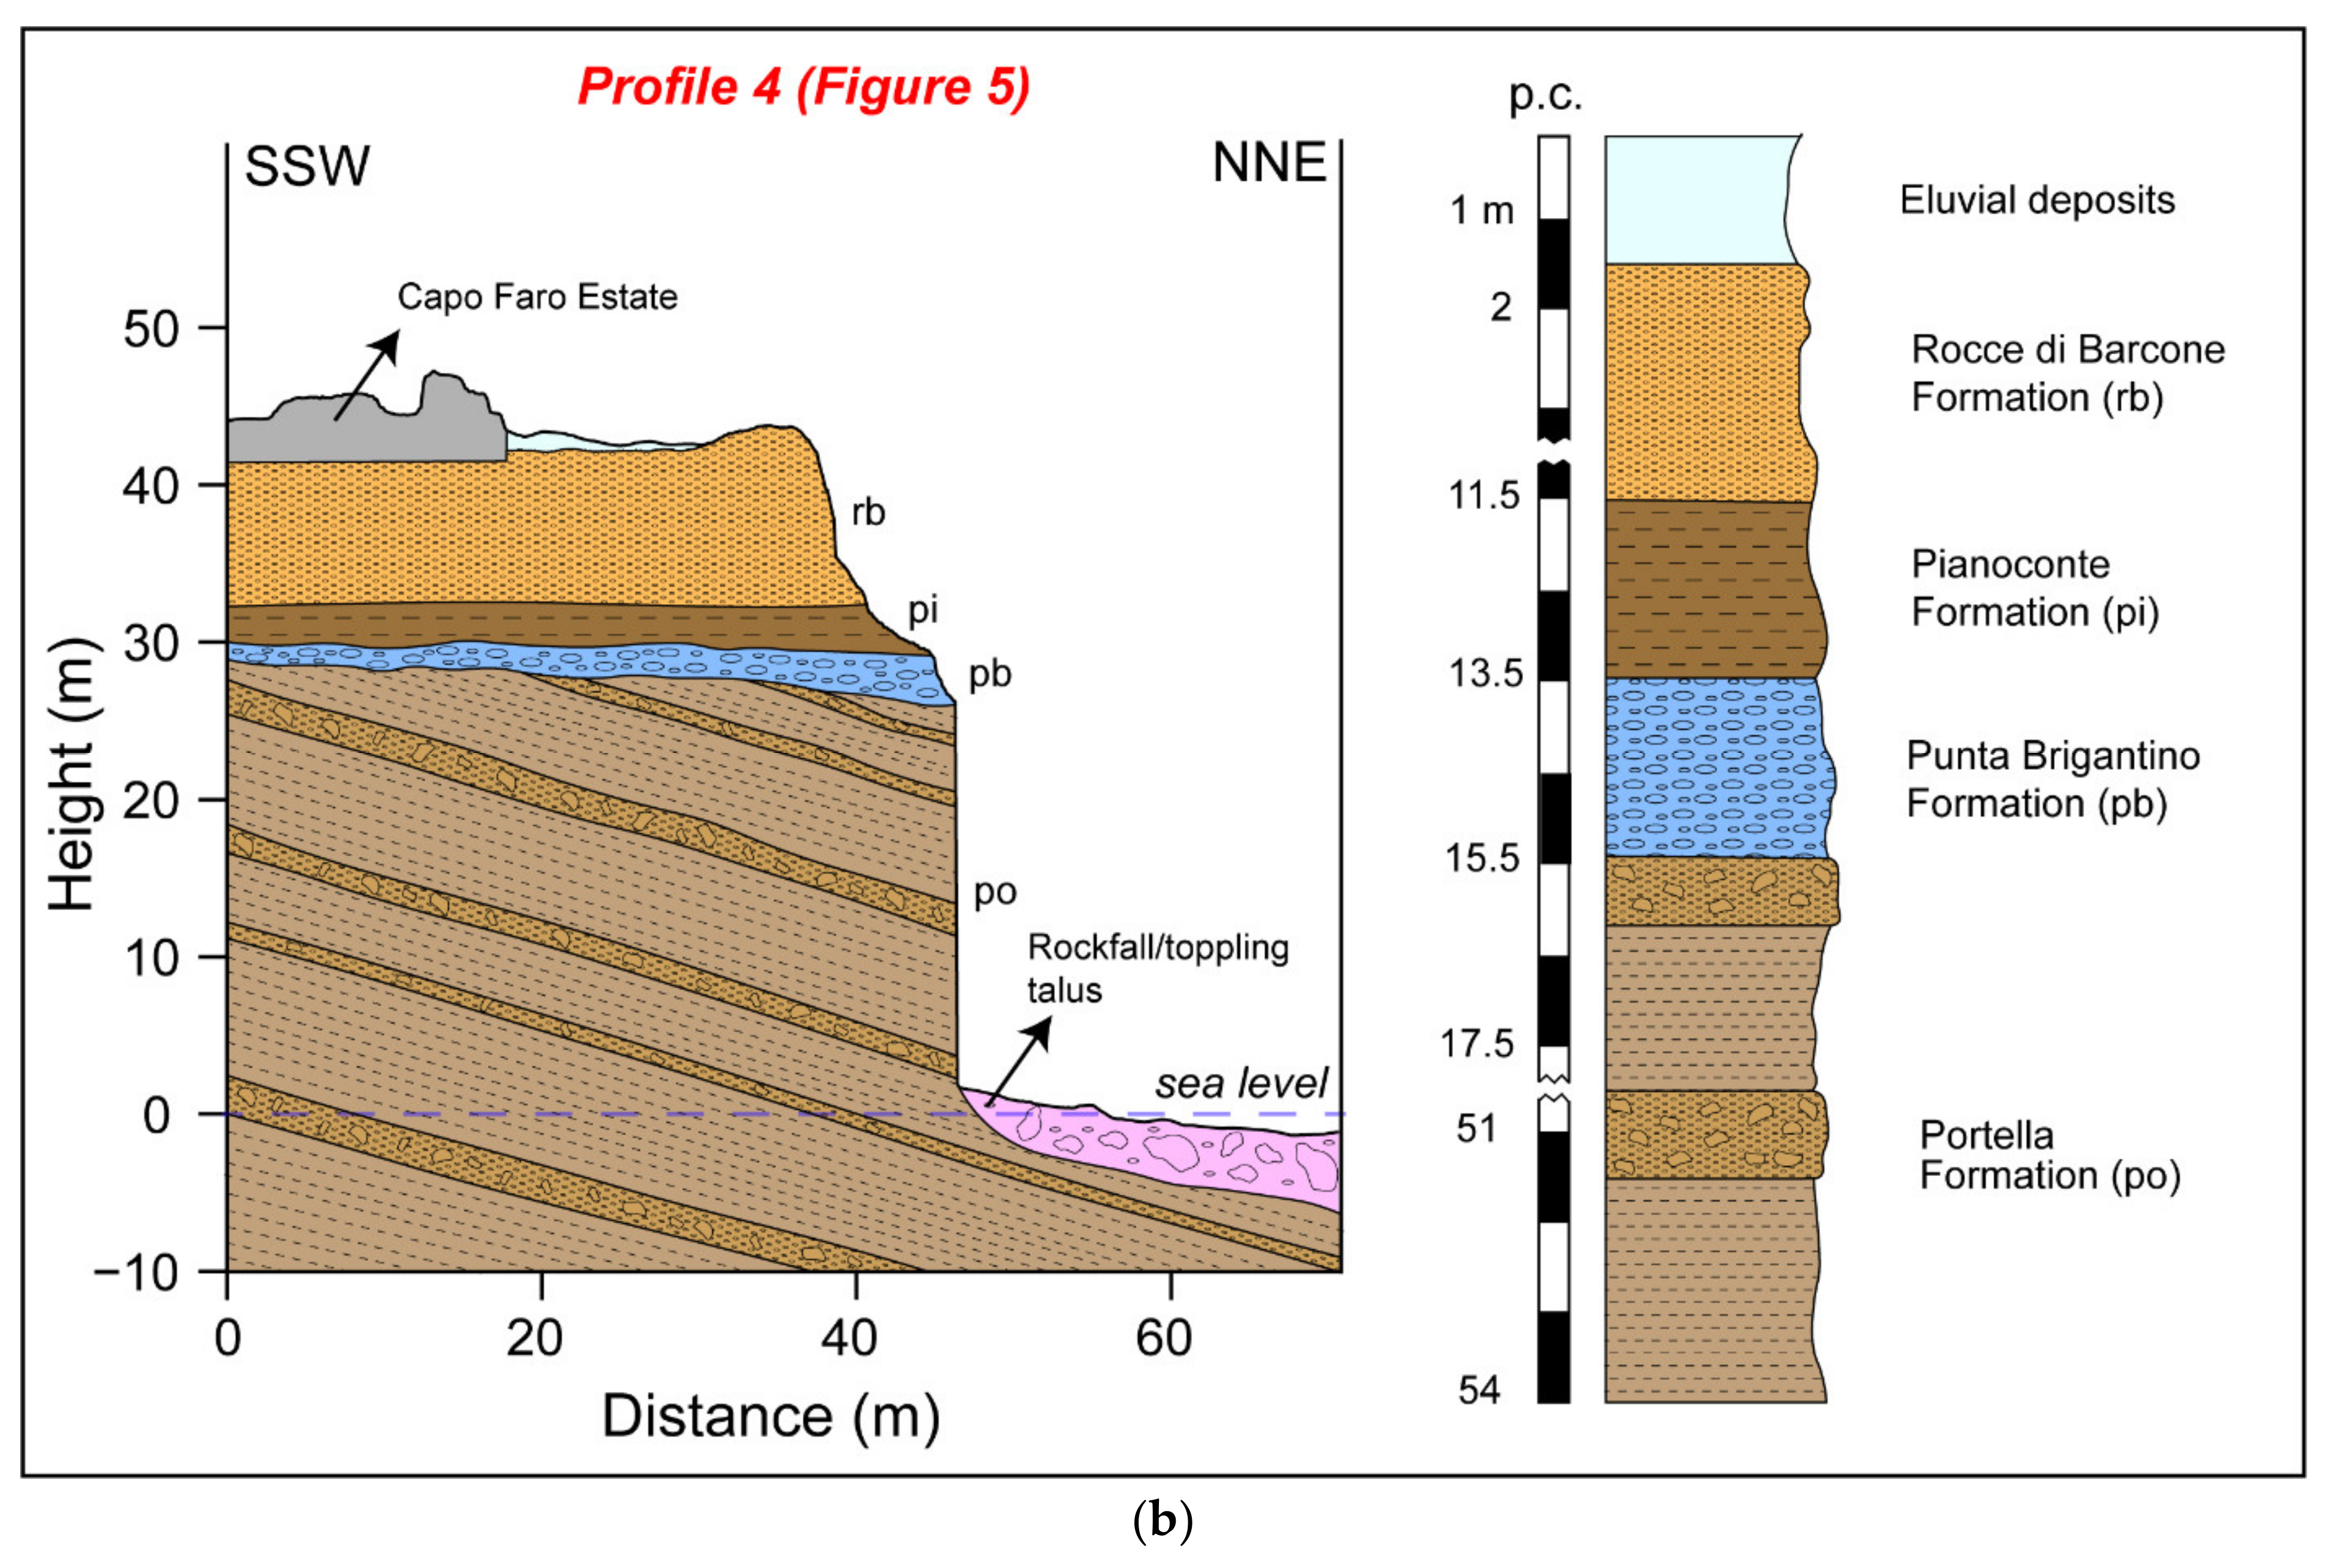
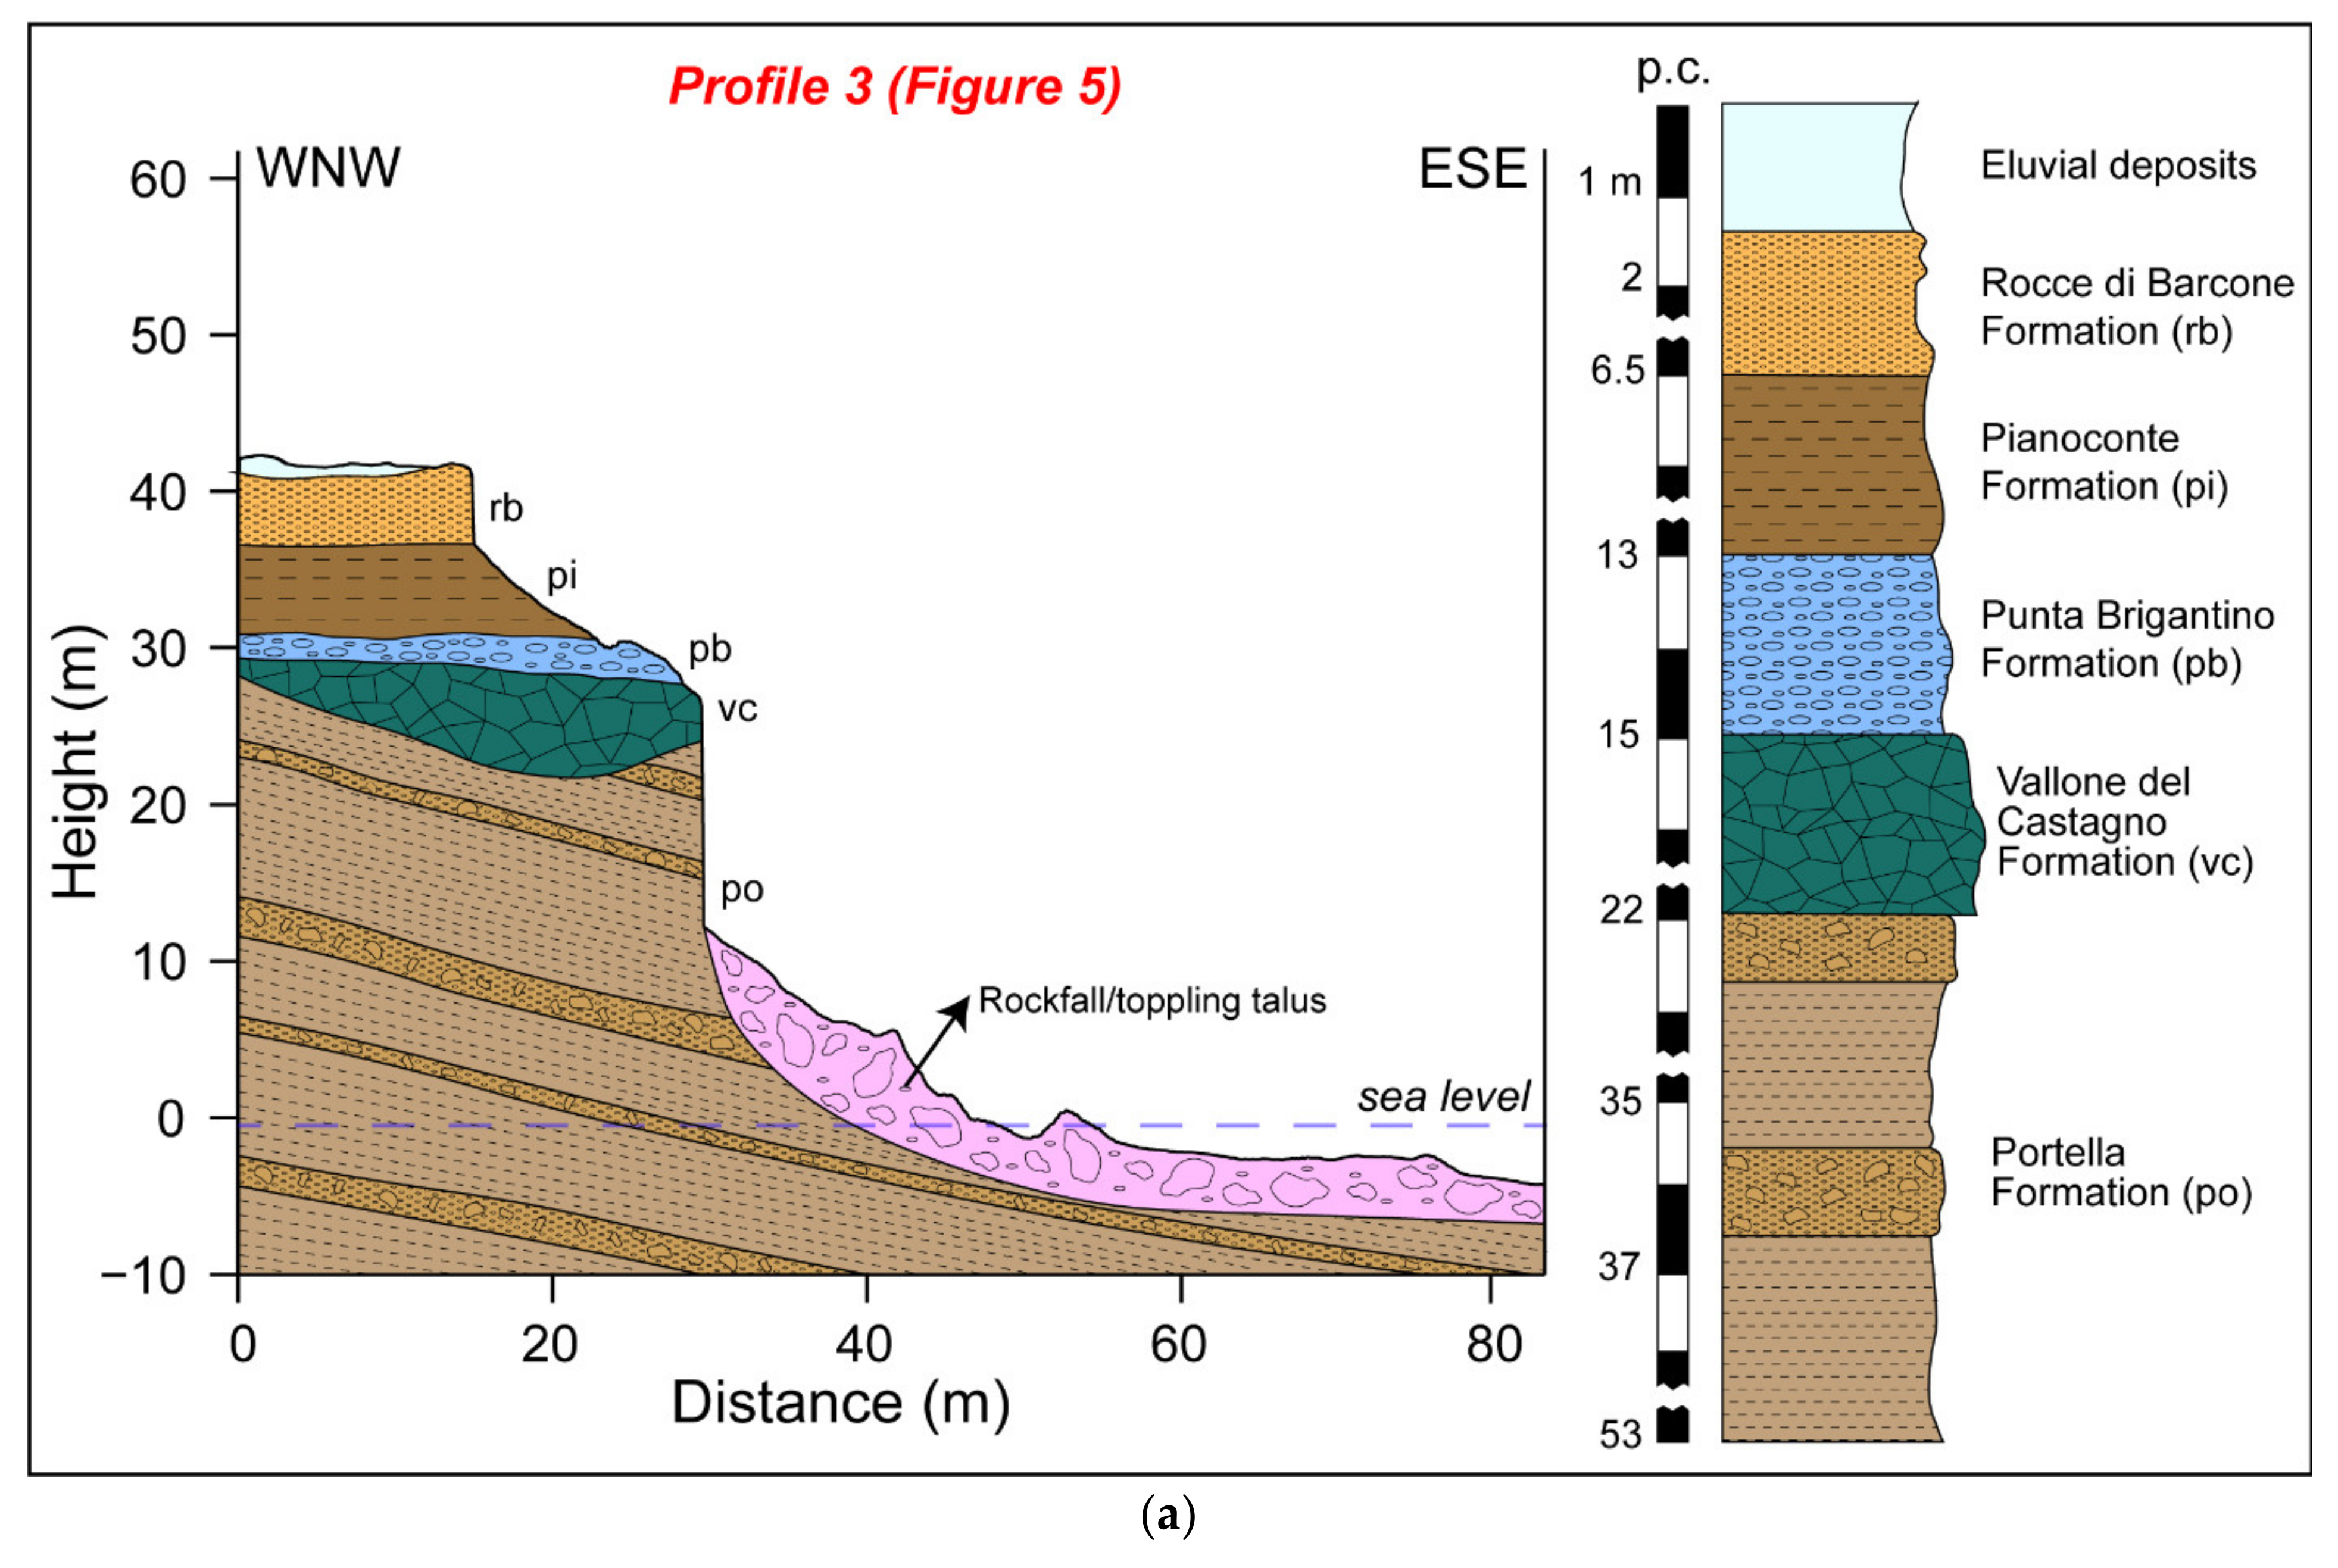
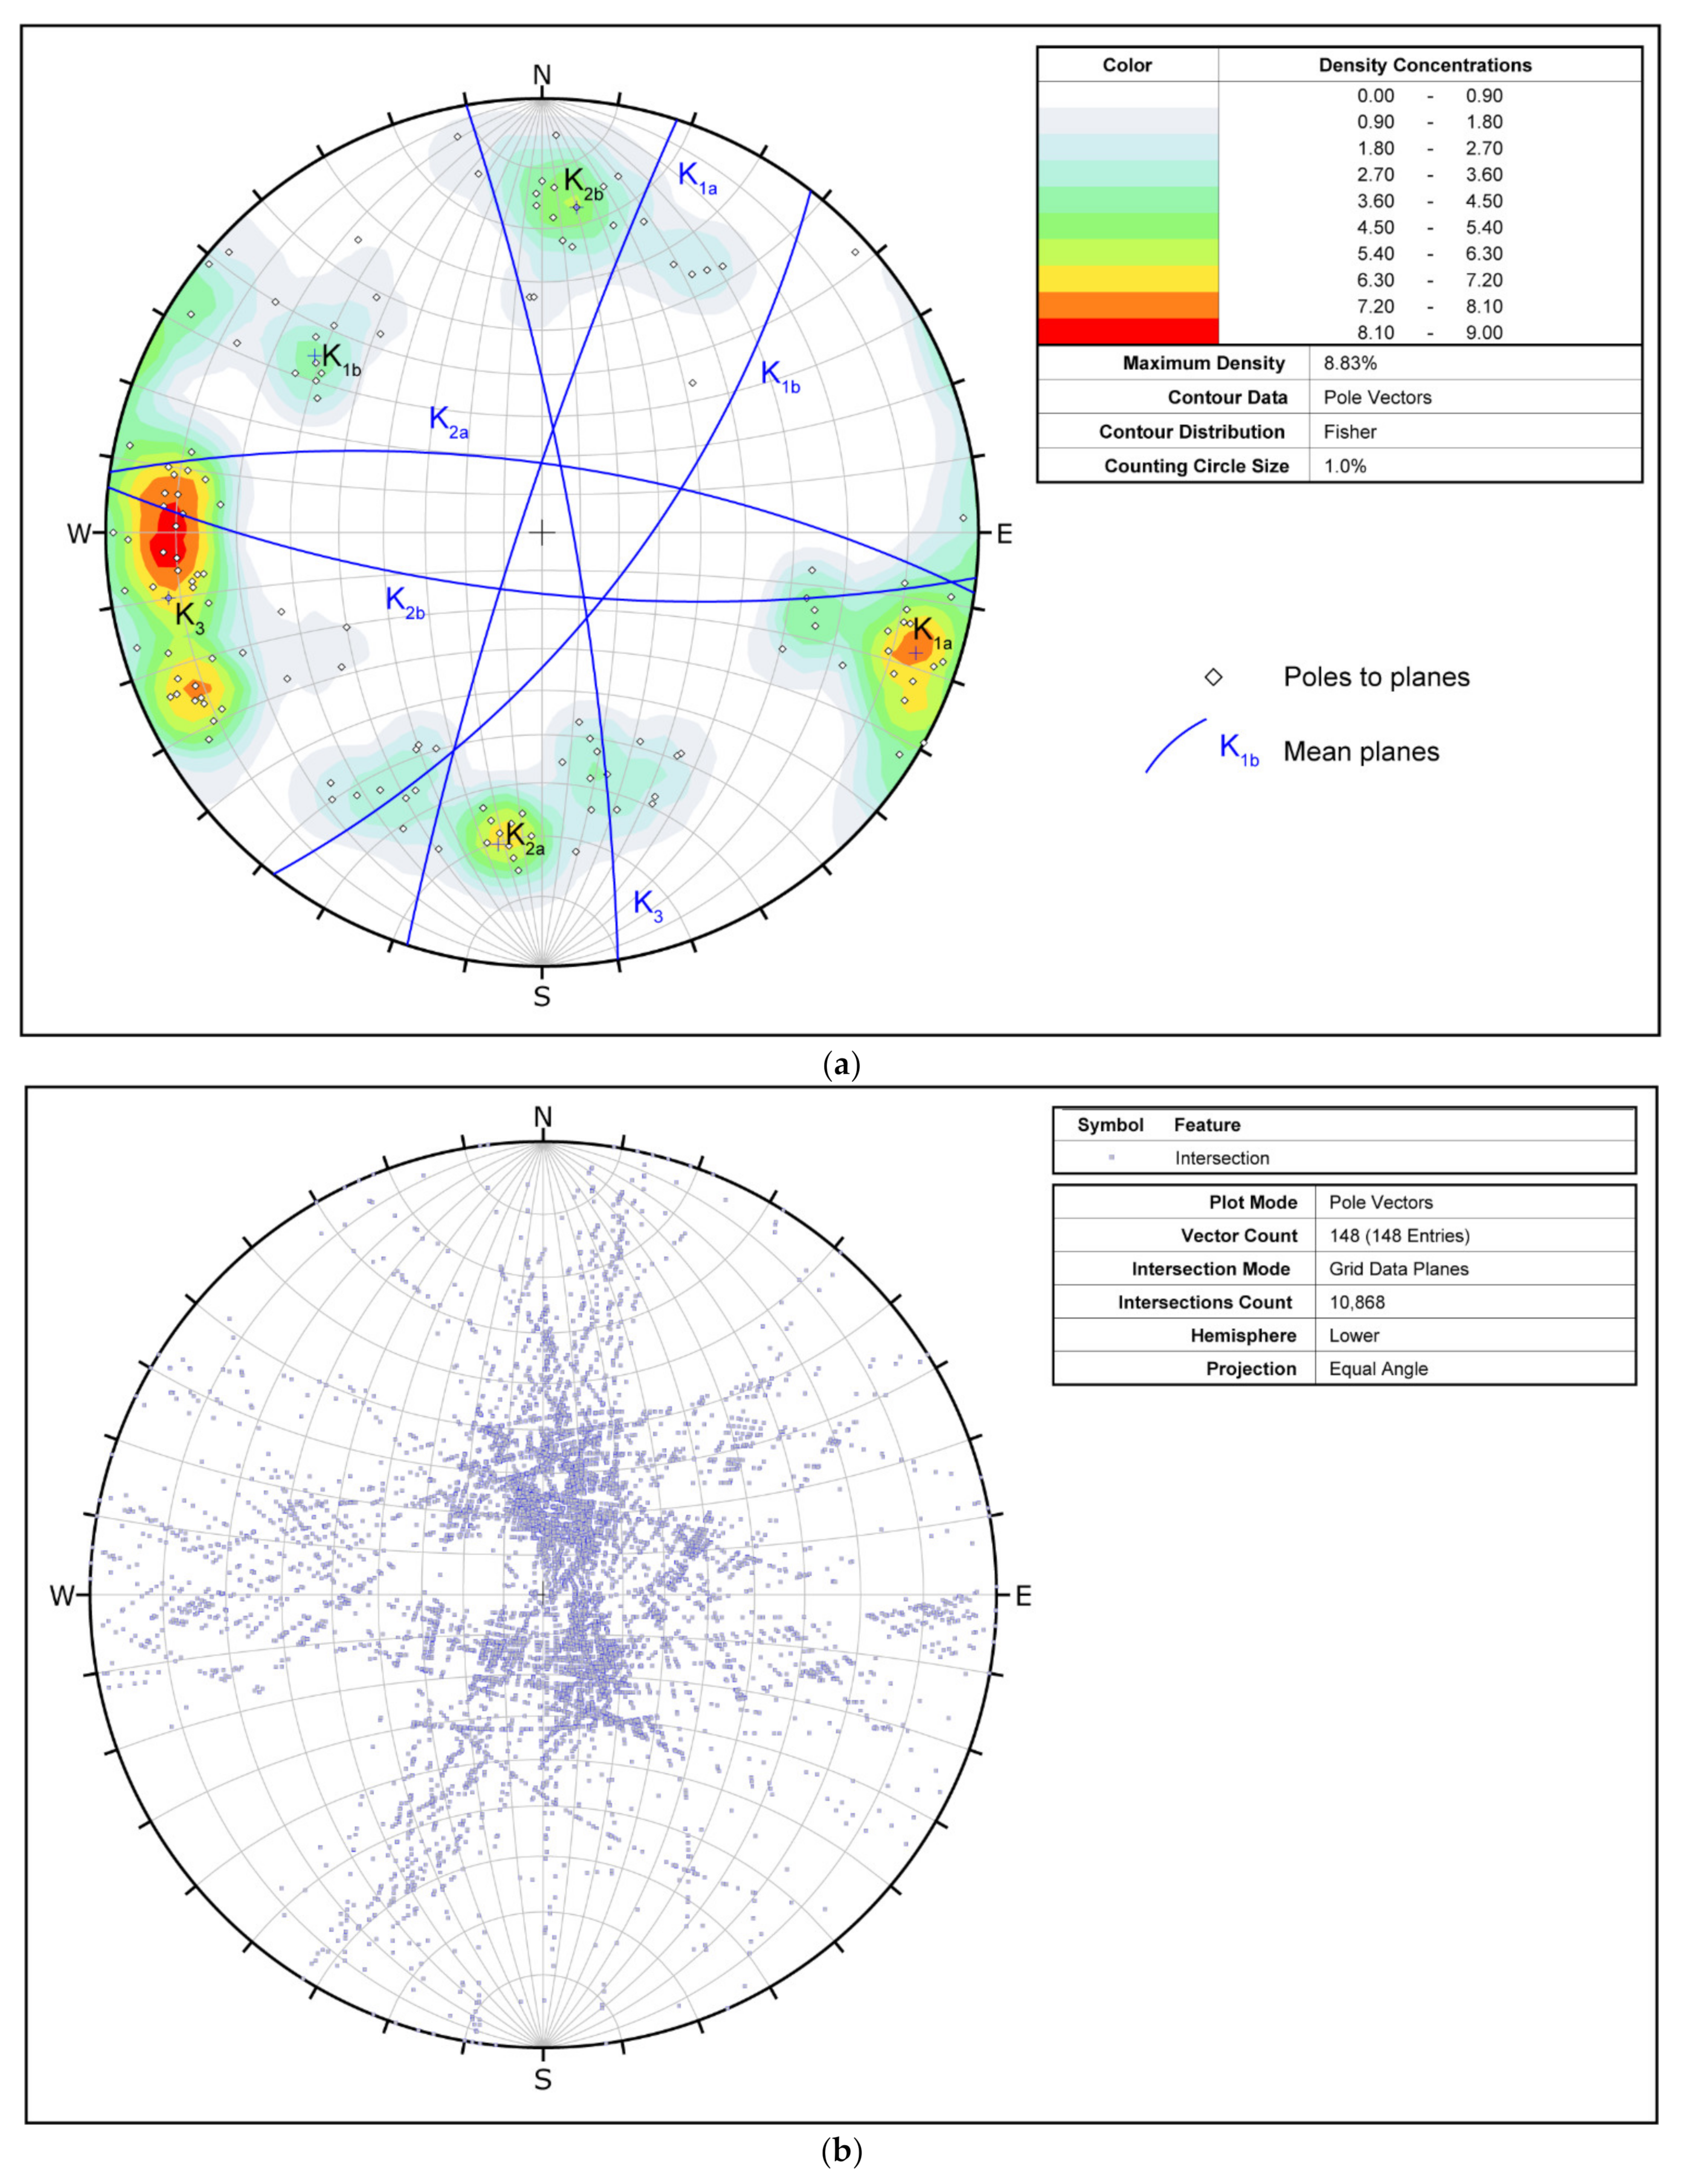
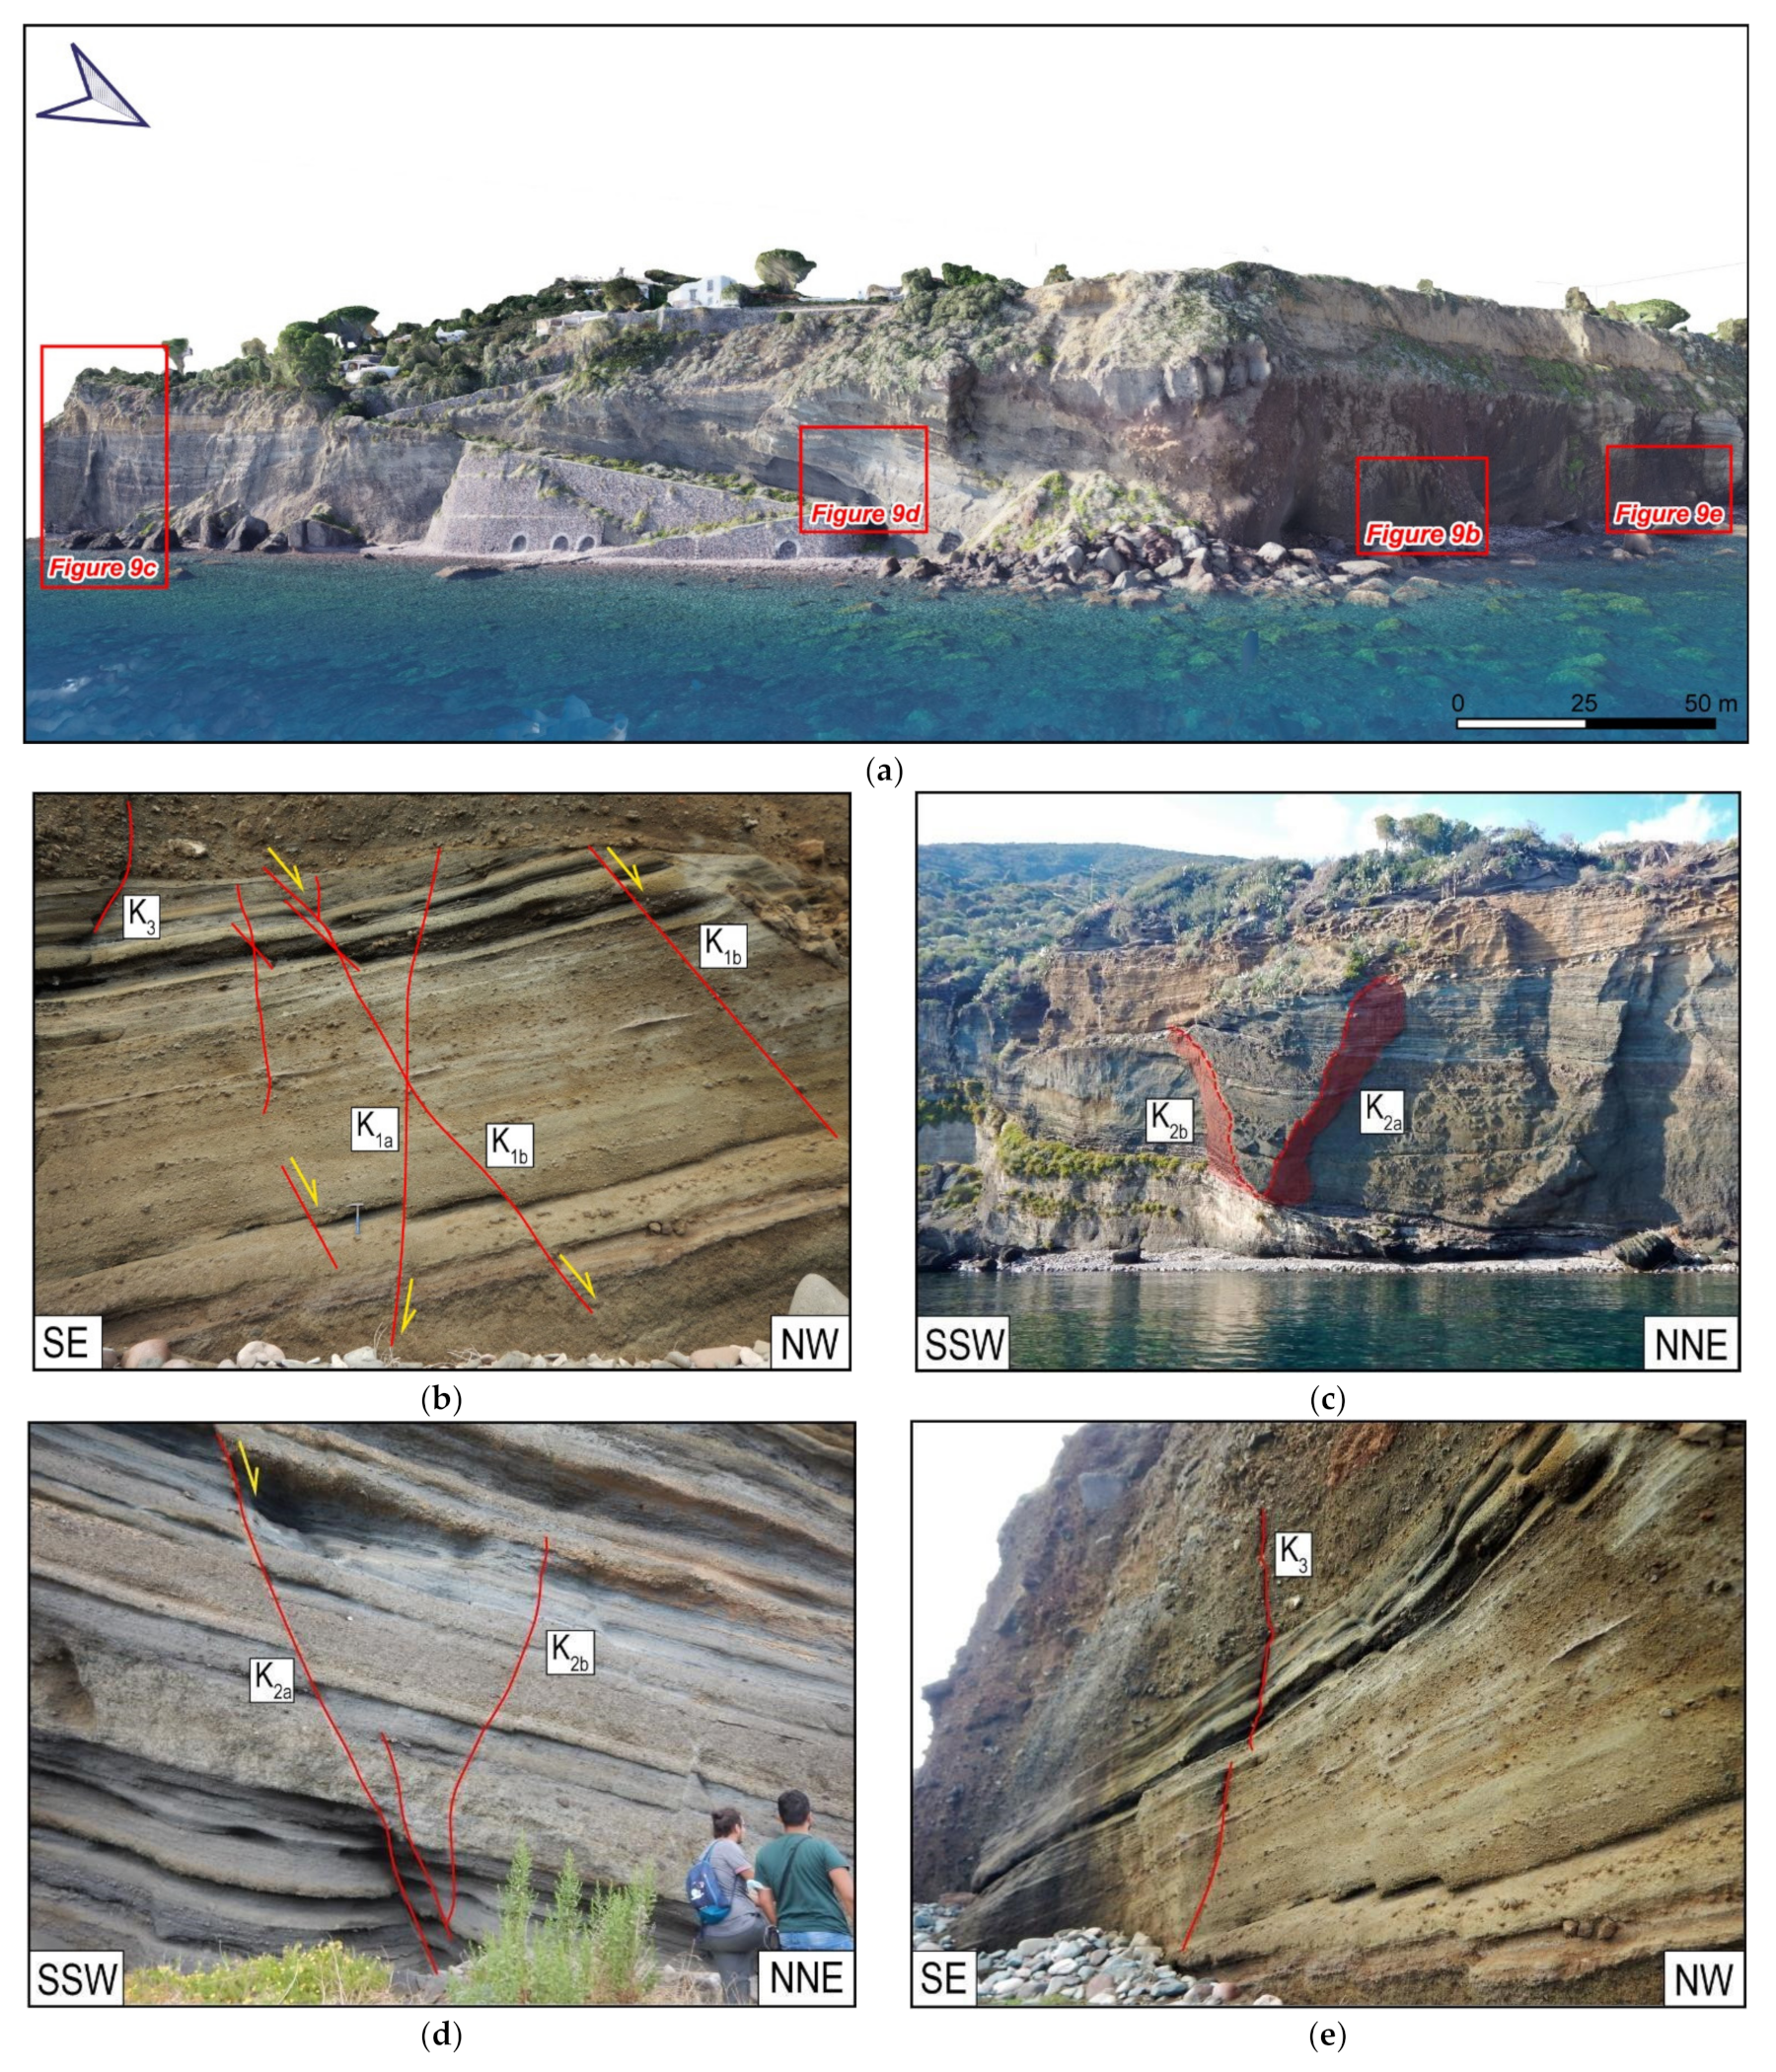
4.2. Cliff Stratigraphy and Structural Assessment

The multidisciplinary approach allows to precisely model the cliff, investigating its topographic, stratigraphical, and structural features. The local thickness of the outcropping formations has been evaluated for the construction of two geological cross–sections (Figure 7a,b).
Overlapped pyroclastic layers referable to Portella Formation (po), emplaced during the II eruptive epoch (c.a. 240 ky, Pizzo Capo volcanic vent; Table 1), crop out on the lower part of the analysed cliff. These deposits, whose thickness in the study area ranges from 35.5 to 40 m show different degrees of cementation and are surmounted by the products of the III and the V eruptive epoch (Monte Rivi and Monte dei Porri volcanic vents; Table 1). Regarding the III epoch, a lenticular massive lava flow body, of basaltic–andesitic to andesitic–dacitic composition, crops out only at the tip of Capo Faro Promontory. It is associated with the Vallone del Castagno formation (vc) and has a thickness ranging from 2 to 7 m (Figure 7a). The marine conglomerate of Punta Brigantino Formation (pb) crops out overlying the vc or the po Formations through an erosional depositional surface. Its thickness ranges from 1.5 to 2 m (Figure 7a,b). As for the V epoch, the distal fallout deposits of the Pianoconte Formation (pi), made of massive ash tuff, are 2 to 6.5 m–thick. The Rocce di Barcone Formation (rb) are pyroclastic deposits whose thickness ranges from 9.5 to 5 m (Figure 7a,b). At the top, the eluvial deposits of the plateau (1.5 m–thick) close the stratigraphic sequence.
Permeability, porosity, and rheological properties of the different deposits influence the development of faults and fractures. Indeed, the permeability is different among eluvial, pyroclastic deposits, and massive lavas. The eluvial and pyroclastic deposits are characterised by high and medium–to–low primary permeability, respectively. On the contrary, due to the presence of fractures, high secondary permeability affected massive lavas. Eluvial deposits, made of clastic gravelly–sandy sediments and placed at the top of the cliff stratigraphy, behave as an incoherent material. For this reason, only the friction angle influences their rheological behaviour.
Three main discontinuity systems have been measured on the field and divided into five subsystems, considering the conjugated subfamilies. The systems have been projected on equal area stereographs and all the intersections among the planes have been calculated (Figure 8a,b). The K1 system has been subdivided into K1a and K1b, which are conjugate faults dipping toward NW and SE, with dip angles ranging between 60 and 85°. The K2 discontinuity system has been also divided into K2a and K2b conjugated subfamilies, respectively dipping toward N and S with dip angles ranging between 60 and 80°. The K3 system dips toward E–NE with dip angles ranging between 70–90° (Figure 8a). Based on field observation (Figure 9a), K1 and K2 systems correspond to faults with a dip–slip normal movement, which forms structures with a displacement between 1–10 cm, well recognizable in the pyroclastic deposits of the po Formation. Its lithological elements are characterised by a low degree of cementation and strong compositional and chromatic variations between different layers (i.e., the scoria and the planar stratified fallout deposits), which allow a reliable estimation of the cm–displacement produced by normal faulting (Figure 9b,c). The K3 system corresponds to joints, without any displacement or filling. These joints produce fractures with an opening of about 1 cm, which crosscut the faults of the K1 and K2 systems (Figure 9e). The conjugated discontinuities of K1 and K2 systems often intersect among them forming pluri–centimetric to decametric wedges, well visible in the deposits of the po Formation (Figure 9b–d). The vc lava flow is a more competent and massive formation and it is only affected by sub–vertical open joints (K3 system) fracturing the rock mass in isolated metric blocks.

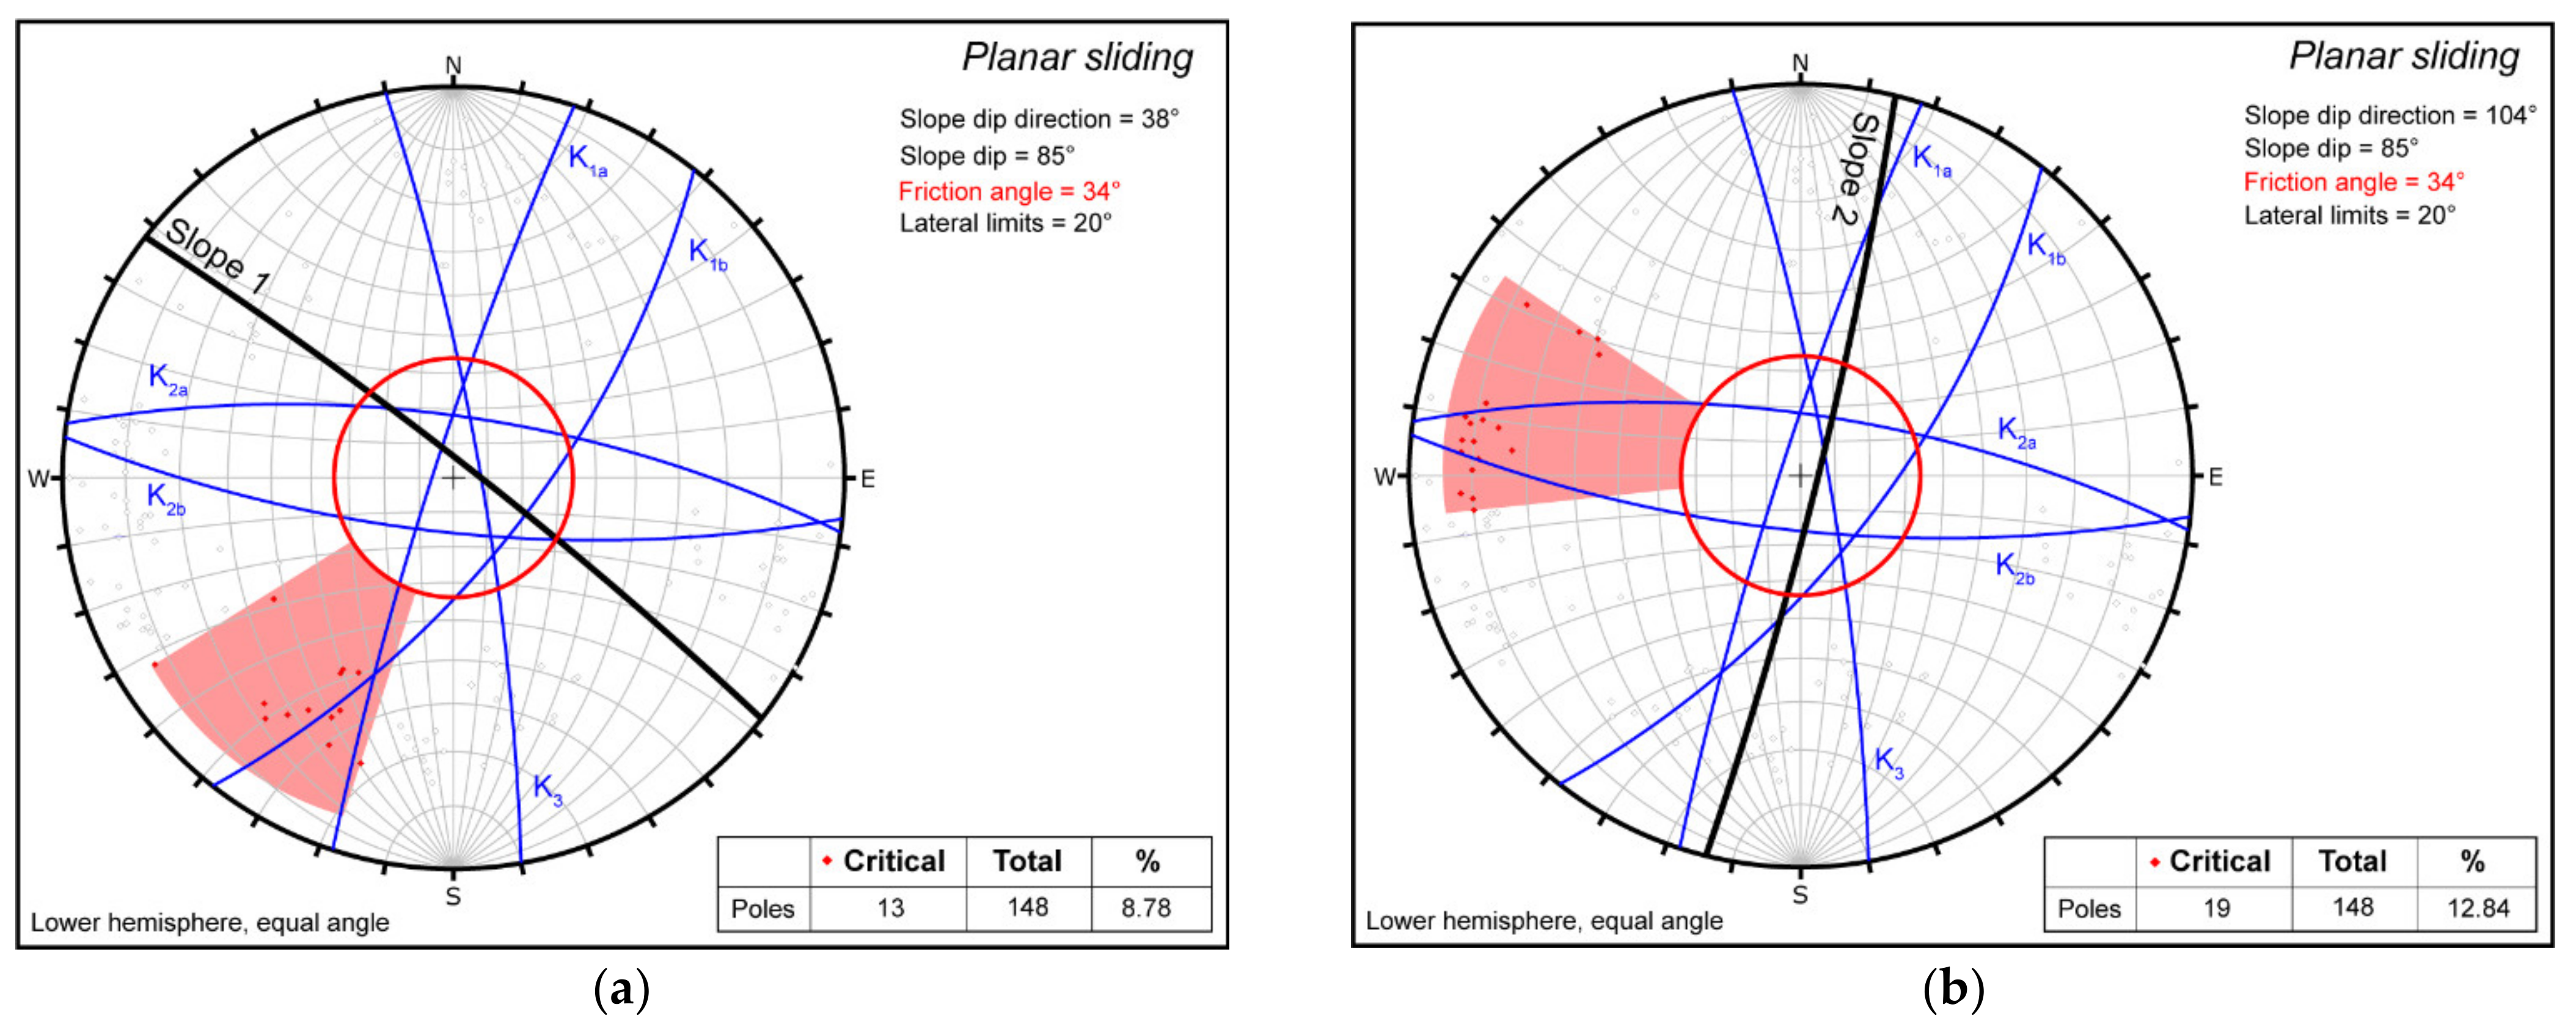
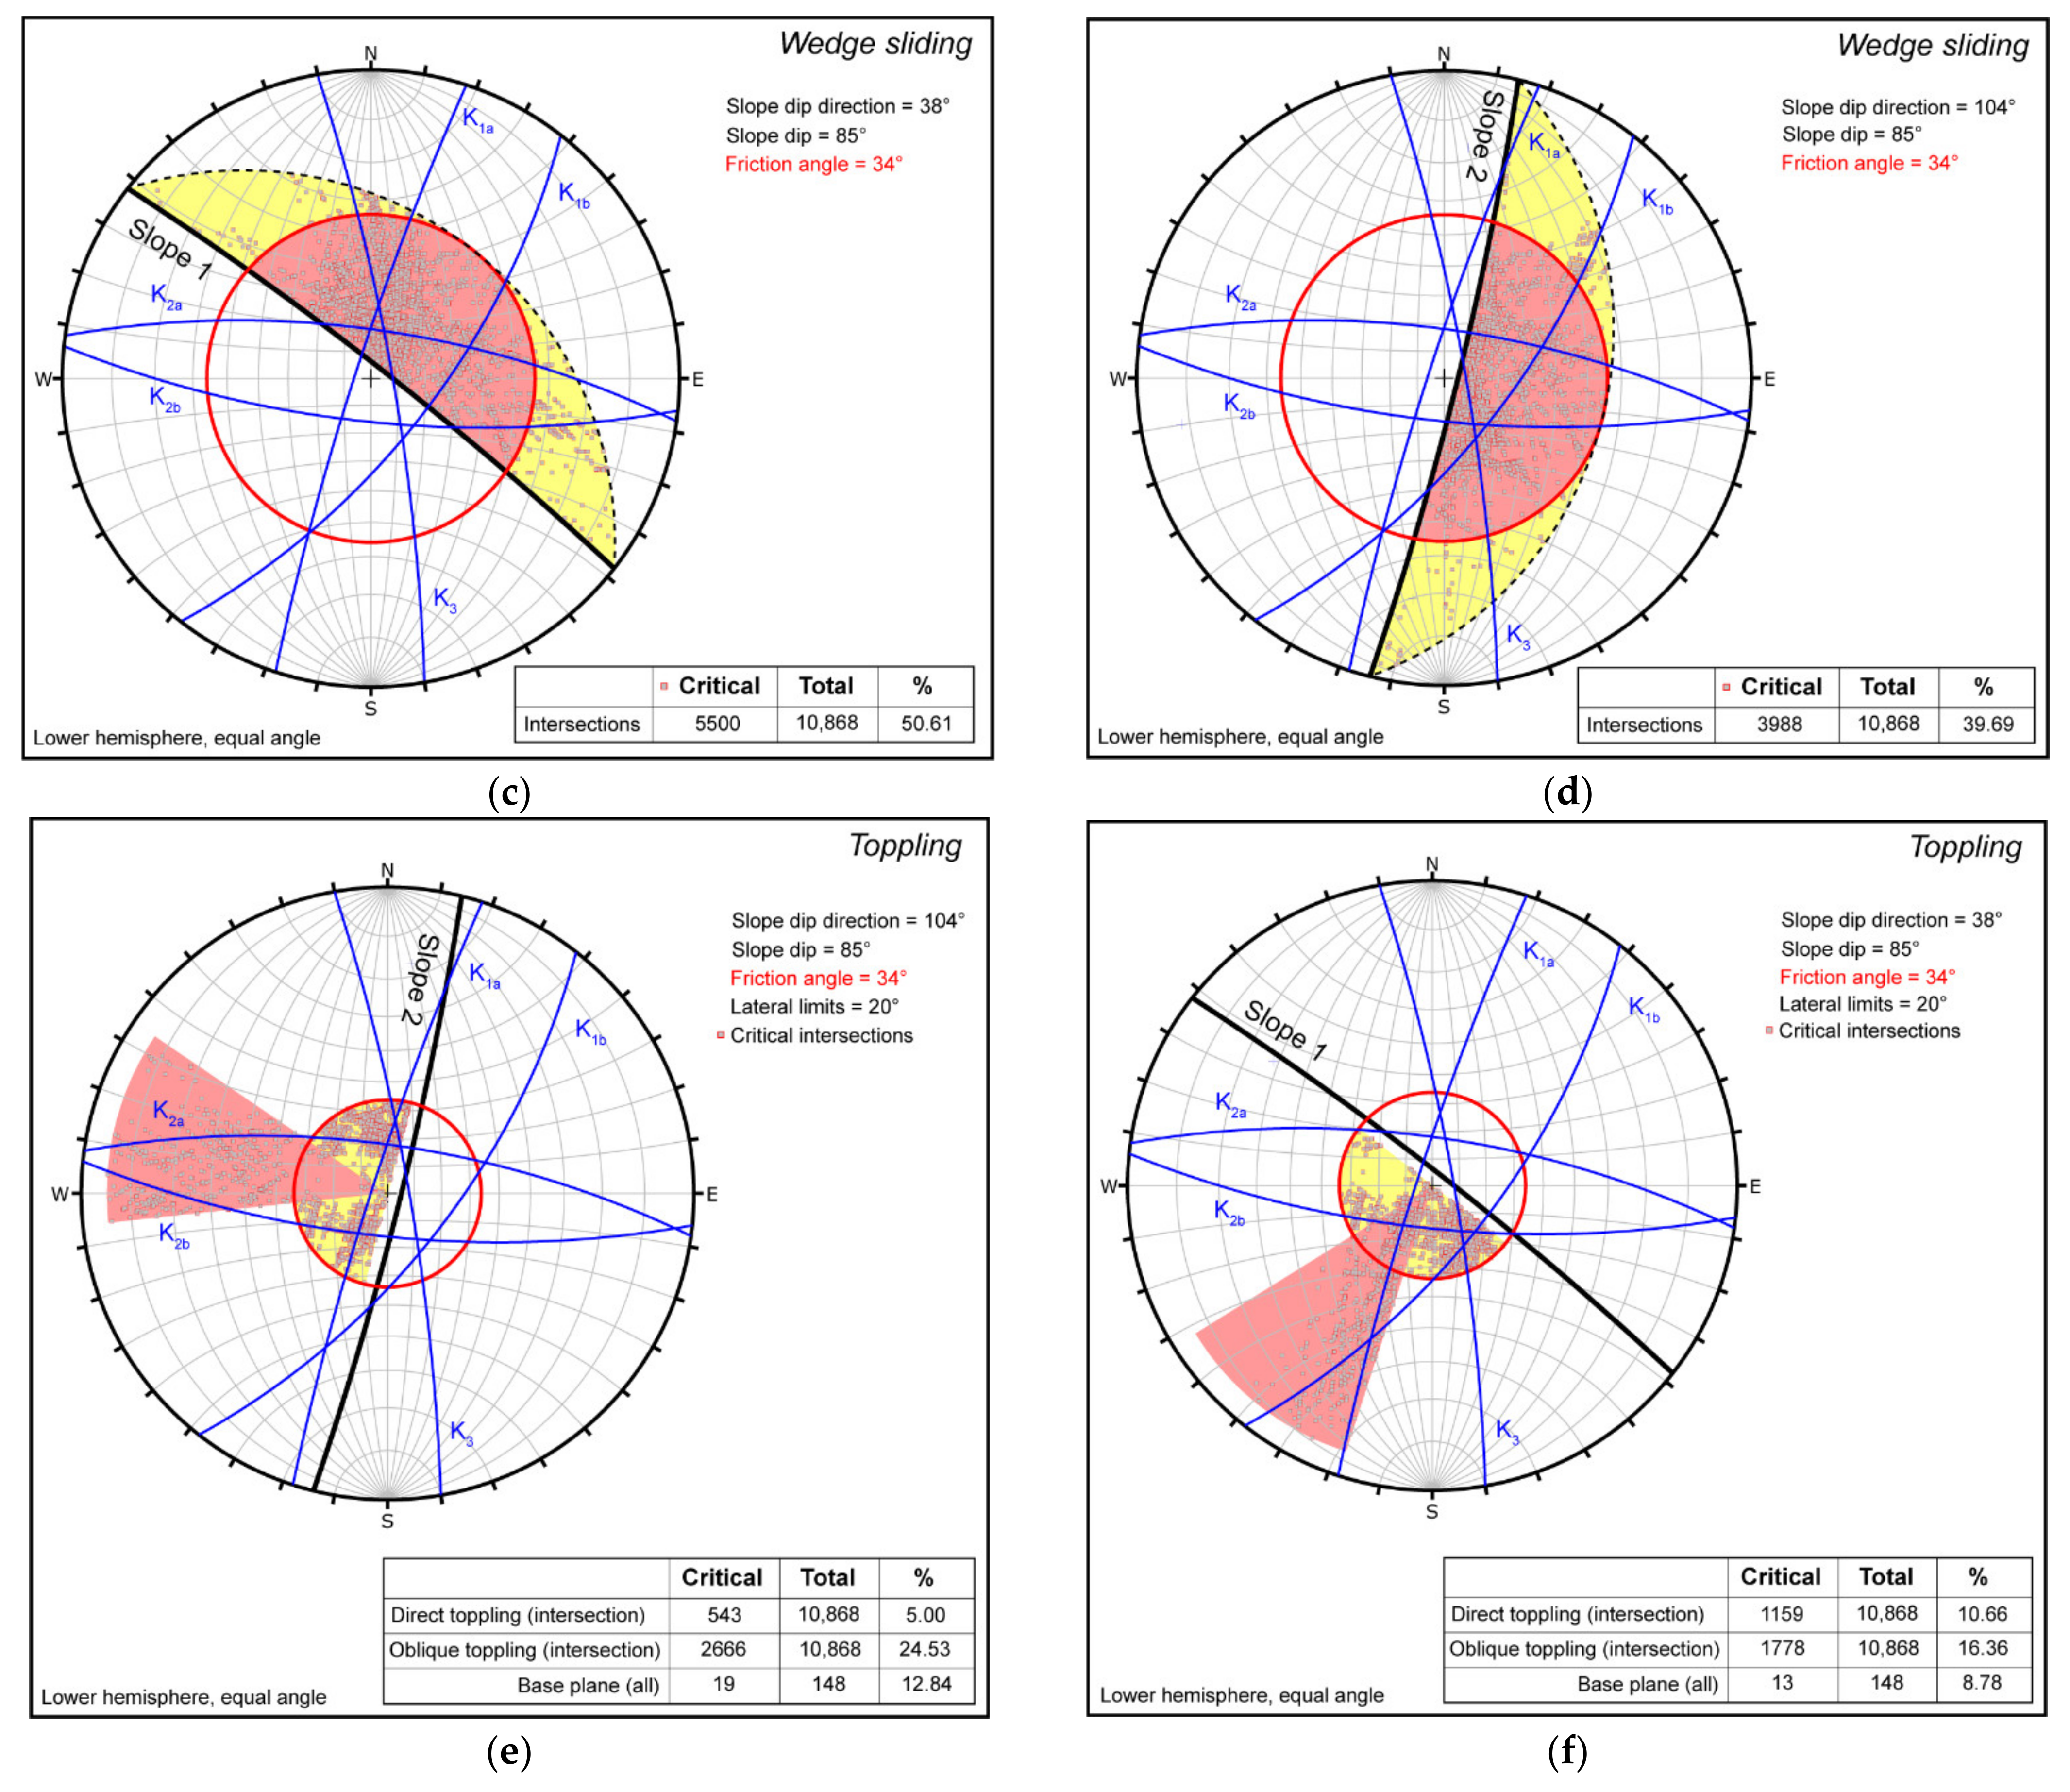
4.3. Slope Stability Analysis

The slope stability assessment (i.e., Markland test) has been conducted near Capo Faro. The two main exposures (Slope 1 and Slope 2) of the coastal cliff with different orientations intersecting in correspondence with Capo Faro were analysed. Slope 1 orientation has been approximated to 38/85° (dip direction, dip) and Slope 2 is oriented 104/85°. The analysis has been made with the Dips®6 software for planar, wedge sliding and toppling (both direct and oblique). The thick black line is the slope orientation, and the red circle of 34° represents the friction angle (φ′) (see Appendix A) measured for pyroclastic deposits and used as an input by the software for the test. The blue lines are the mean planes of the different systems. Planar sliding for both slopes, as provided by the software, gave thirteen critical poles (8.78% of the total) for Slope 1 and 19 (12.84% of the total) for Slope 2 (critical poles are in red in Figure 10a,b). For wedge sliding and toppling, Dips® projected all the intersections between the discontinuities (grey squares), marking with red and yellow areas those critical for triggering gravitational phenomena. Regarding wedge sliding, 5550 over 10,868 intersections (50.61%) have been evaluated as critical (Slope 1), thus falling in the reddish area, corresponding to the intersections between K1a and K3, K1b and K2a, K2a and K3, K1a and K2a systems (Figure 10c). In correspondence to Slope 2, 3988 intersections over 10,868 (36.69%) are critical for wedge sliding and correspond to K1b and K2a, K2b and K3, K1b and K2b, K1b and K3 (Figure 10d). Concerning the toppling mechanism, a number of 1159 intersections in Slope 1 (10.66% of the total) could be responsible for direct toppling (20° of lateral limits with respect to the slope dip direction; red area in Figure 10e), and 1778 (16.36%) for oblique toppling (yellow area; Figure 10e). The intersections critical for toppling in Slope 1 are between K1a and K2b, K1b and K2b, K3 and K1b, K3 and K2b. In Slope 2, 543 intersections (5.00%) are critical for direct toppling (red area with 20° of lateral limits; Figure 10f) and 2666 (24.53%) for oblique toppling (yellow area; Figure 10e). They correspond to the intersection between K1a and K2a, K1a and K2b, K1a and K3, K2a and K3.

5. Discussions

The evolution of the coast in the study area represents a constant hazard factor for the buildings and the economy, linked to the high–quality vineyards upstream of the Capo Faro cliff. The retreating of the coastline, around 50–80 cm/y (PAI between 1992 and 2003), is directly caused by the succession of landslide events. It is still in progress nowadays, as testified by the relevant rock avalanche event in 2011 (Figure 4c).
The clearest predisposing factor is the severe undercutting by water mass pressure and debris of the sea waves, especially during the storms in winter, directly responsible for the swash line at the basis of the coastal scarp (Figure 5). Erosion is also favoured by the heterogeneous composition of the outcropping rocks (Figure 7a,b) and by the chemical action of the saltwater infiltrating the fractures. Whenever the erosion deepens the swash line, the overlying wall weakens and collapses. Debris produced by topplings (Figure 11a) form a sort of reef that temporarily protects the cliff till it is dismantled by the constant action of the wave motion. The nearby beaches are fed by the remodelled products deriving from the dismantling of the pyroclastic rocks of the po Formation (Figure 11b). This lithotype constitutes about 60–70% of the sheer walls. This phenomenon could be limited by reinforcing structures such as wire meshes or anti–erosion blankets, whose adhesion to the walls is kept by soil nailing and steel rods. Furthermore, coastal works (e.g., brushes, artificial reefs) must be positioned aiming at the dissipation of the energy of the waves.
Another mechanism that facilitates collapses triggering is the establishment of high–tension forces due to the superposition of lithologies with different degrees of cementation, deformability, and rigidity. That is the case of the lava flow (vc) superimposed on pyroclastic rocks (po) in correspondence with the tip of Capo Faro Promontory (Figure 11c). The consequence is the formation of vertical fractures (often quite deep tension cracks), parallel to the slope (Figure 11d). The run–off water tends to infiltrate within these cracks, triggering hydraulic thrusts and detensioning the rocks of the cliff causing rockfalls. Furthermore, the run–off water flowing down the slopes leads to the formation of small hanging valleys. The result is the ongoing erosion of the facing scarp which contributes to the retreating of the cliff. To face this problem, a system for collecting, conveying, and draining the run–off water should be realised upstream of the edge of the cliff and flanked by sub–horizontal drains to prevent water infiltration in the tension cracks.
The series of discontinuities characterising the cliff, besides being a preferential path for run–off water, could trigger planar and wedge slides and topple events. In particular, the K3 system, as already observed in Slope 2 (and in minor amounts in Slope 1; Figure 9b,e) and resulting from the Markland Test (Figure 10) is almost parallel to the analysed slopes and therefore could potentially trigger planar slidings. The test highlighted that some discontinuities of K2a and K2b systems in Slope 1 and K1a, K2b and K3 in Slope 2 could trigger these types of gravitational events (Figure 9a,b and vc Formation block in Figure 11d). Discontinuities in pyroclastic deposits of the po Formation both in slopes 1 and 2 intersect each other (K1a with K1b and K2a with K2b), making wedges of different dimensions (from metric– to decametric–scale). The Markland test (Figure 10c,d) confirms that these intersections among discontinuities previously observed on the field (Figure 9b–d) may trigger wedge sliding. Subvertical and horizontal discontinuities with a strike parallel to the cliff intersect originating several plurimetric parallelepipedal blocks which could topple (Figure 11d). This, again, has been confirmed by the Markland test for direct and oblique toppling (K2a and K2b for Slope 1 and K1a, K1b and K3 for Slope 2; Figure 10e,f).

6. Conclusions

The Capo Faro Promontory in north–eastern Salina Island has been assessed from a geomorphological, stratigraphical, and structural point of view. This volcanic area is characterised by a steep slope and a flat plateau on the coastal strip around 40–60 m a.s.l. The coast is rocky and includes a narrow beach backed by a sheer cliff, on which the volcanic deposits succession outcrops. Economic activities of noteworthy importance for tourism (the presence of the Capo Faro Estate, dedicated to summer housing and for Malvasia wine production) are placed on the plateau, not so distant from the edge. Considering the area in question as one of the riskiest in Salina, a detailed field survey has been performed to comprehend the hazard factors. To model the cliff precisely, a drone flight has been carried out. The fracturing conditions of the rock mass have been unravelled by a structural survey. The first results were the redaction of a geomorphological map and the generation of a DEM, with 12 cm spatial resolution, of a 50 cm/pixel resolution orthophoto and a textured 3D model. The area turned out to be characterised by recent gravitational phenomena such as rock avalanches, rockfalls, and topplings. They represent the most dangerous types of failure, both for triggering speed and for unforeseeable nature. The abrupt landslides can stress the pocket beaches used by bathers and they directly cause the dismantling of the cliff, with frequent, great magnitude events provoking up to 30 m retreating. All the field observations on the rock walls have been validated by the Markland test, which confirms the strong control exerted by different intersecting discontinuity patterns affecting the coastal cliff. In particular, a total number of 148 discontinuities has been measured (i.e., their dip direction and dip) on two different exposures of the Capo Faro cliff. The measured discontinuities have been grouped into three main systems and conjugated subsystems (i.e., K1a and K1b, K2a and K2b and K3) to ease the slope stability analysis. The Markland test analysed discontinuity poles orientation for planar sliding, and intersections among planes for wedge sliding and toppling mechanisms. The test highlighted that: (i) the 8.78% (Slope 1) and the 12.84% (Slope 2) of the total discontinuities could trigger planar sliding; (ii) the 50.61% (Slope 1) and the 39.69% (Slope 2) of the total intersections cause wedge sliding; (iii) the 10.66% (Slope 1) and 5.00% (Slope 2) might cause direct toppling; (iv) the 16.36% (Slope 1) and 24.53% (Slope 2) might cause oblique toppling instead.
In essence, the buildings and economical facilities of the area undergo very high–risk conditions with possible involvement of people during summer. Taking into account the interaction between morpho–stratigraphical and structural features of the cliff, the realisation of mitigation measures would be unavoidable to safeguard people’s safety, civil buildings, Capo Faro Estate vineyards and residences.

Author Contributions

Conceptualization and investigation, M.B. and C.C.; methodology, validation, data curation and writing—original draft preparation, M.B., C.C. and F.C.; software, M.B. and F.C.; resources, S.L. and G.R.; writing—review and editing, M.B., C.C. and F.C.; supervision, G.F. and G.R.; project administration, M.B. and G.R.; funding acquisition, G.R. All authors have read and agreed to the published version of the manuscript.

Funding

This research received no external funding.

Institutional Review Board Statement

Not applicable.

Data Availability Statement

The data that supports the findings of this study are freely available within the article or from the first author, [M.B.], upon reasonable request. Furthermore, the coastline evolution data and the topographic base are provided by the Geoportale Regione Siciliana Infrastruttura dati territoriali (https://www.sitr.regione.sicilia.it/geoportale (accessed on 26 June 2022)).

Acknowledgments

Many thanks must be expressed to Alessandro Petroccia for his precious suggestions during the survey, data acquisition and manuscript preparation. Antonio Crupi and Mario Vitti are also thanked for UAV flight planning and surveying. Furthermore, we also thank the Capo Faro Estate for encouraging this research and for the helpfulness in accessing the study area. Orazio Barbagallo is warmly acknowledged for dealing with laboratory data available in the Appendix A.

Conflicts of Interest

The authors declare no conflict of interest.

Appendix A

To obtain information on the rheological behaviour of the rock mass of Capo Faro Promontory, geotechnical analysis has been carried out on 10 samples of pyroclastic materials outcropping along the studied cliff.
The 10 samples have been sent to the MTR laboratory of Troina (Enna, Sicily, Italy), to determine the Point Load resistivity, while on four of them the apparent density has been calculated (Table A1).
Table A1. Determination of the apparent density.
Sample 1Sample 2Sample 3Sample 4Mean Value
Apparent density
(Mg/m3)
1.311.321.301.291.31
Apparent density
(kN/m3)
12.8512.9412.7512.651.80

Point Load Measurements
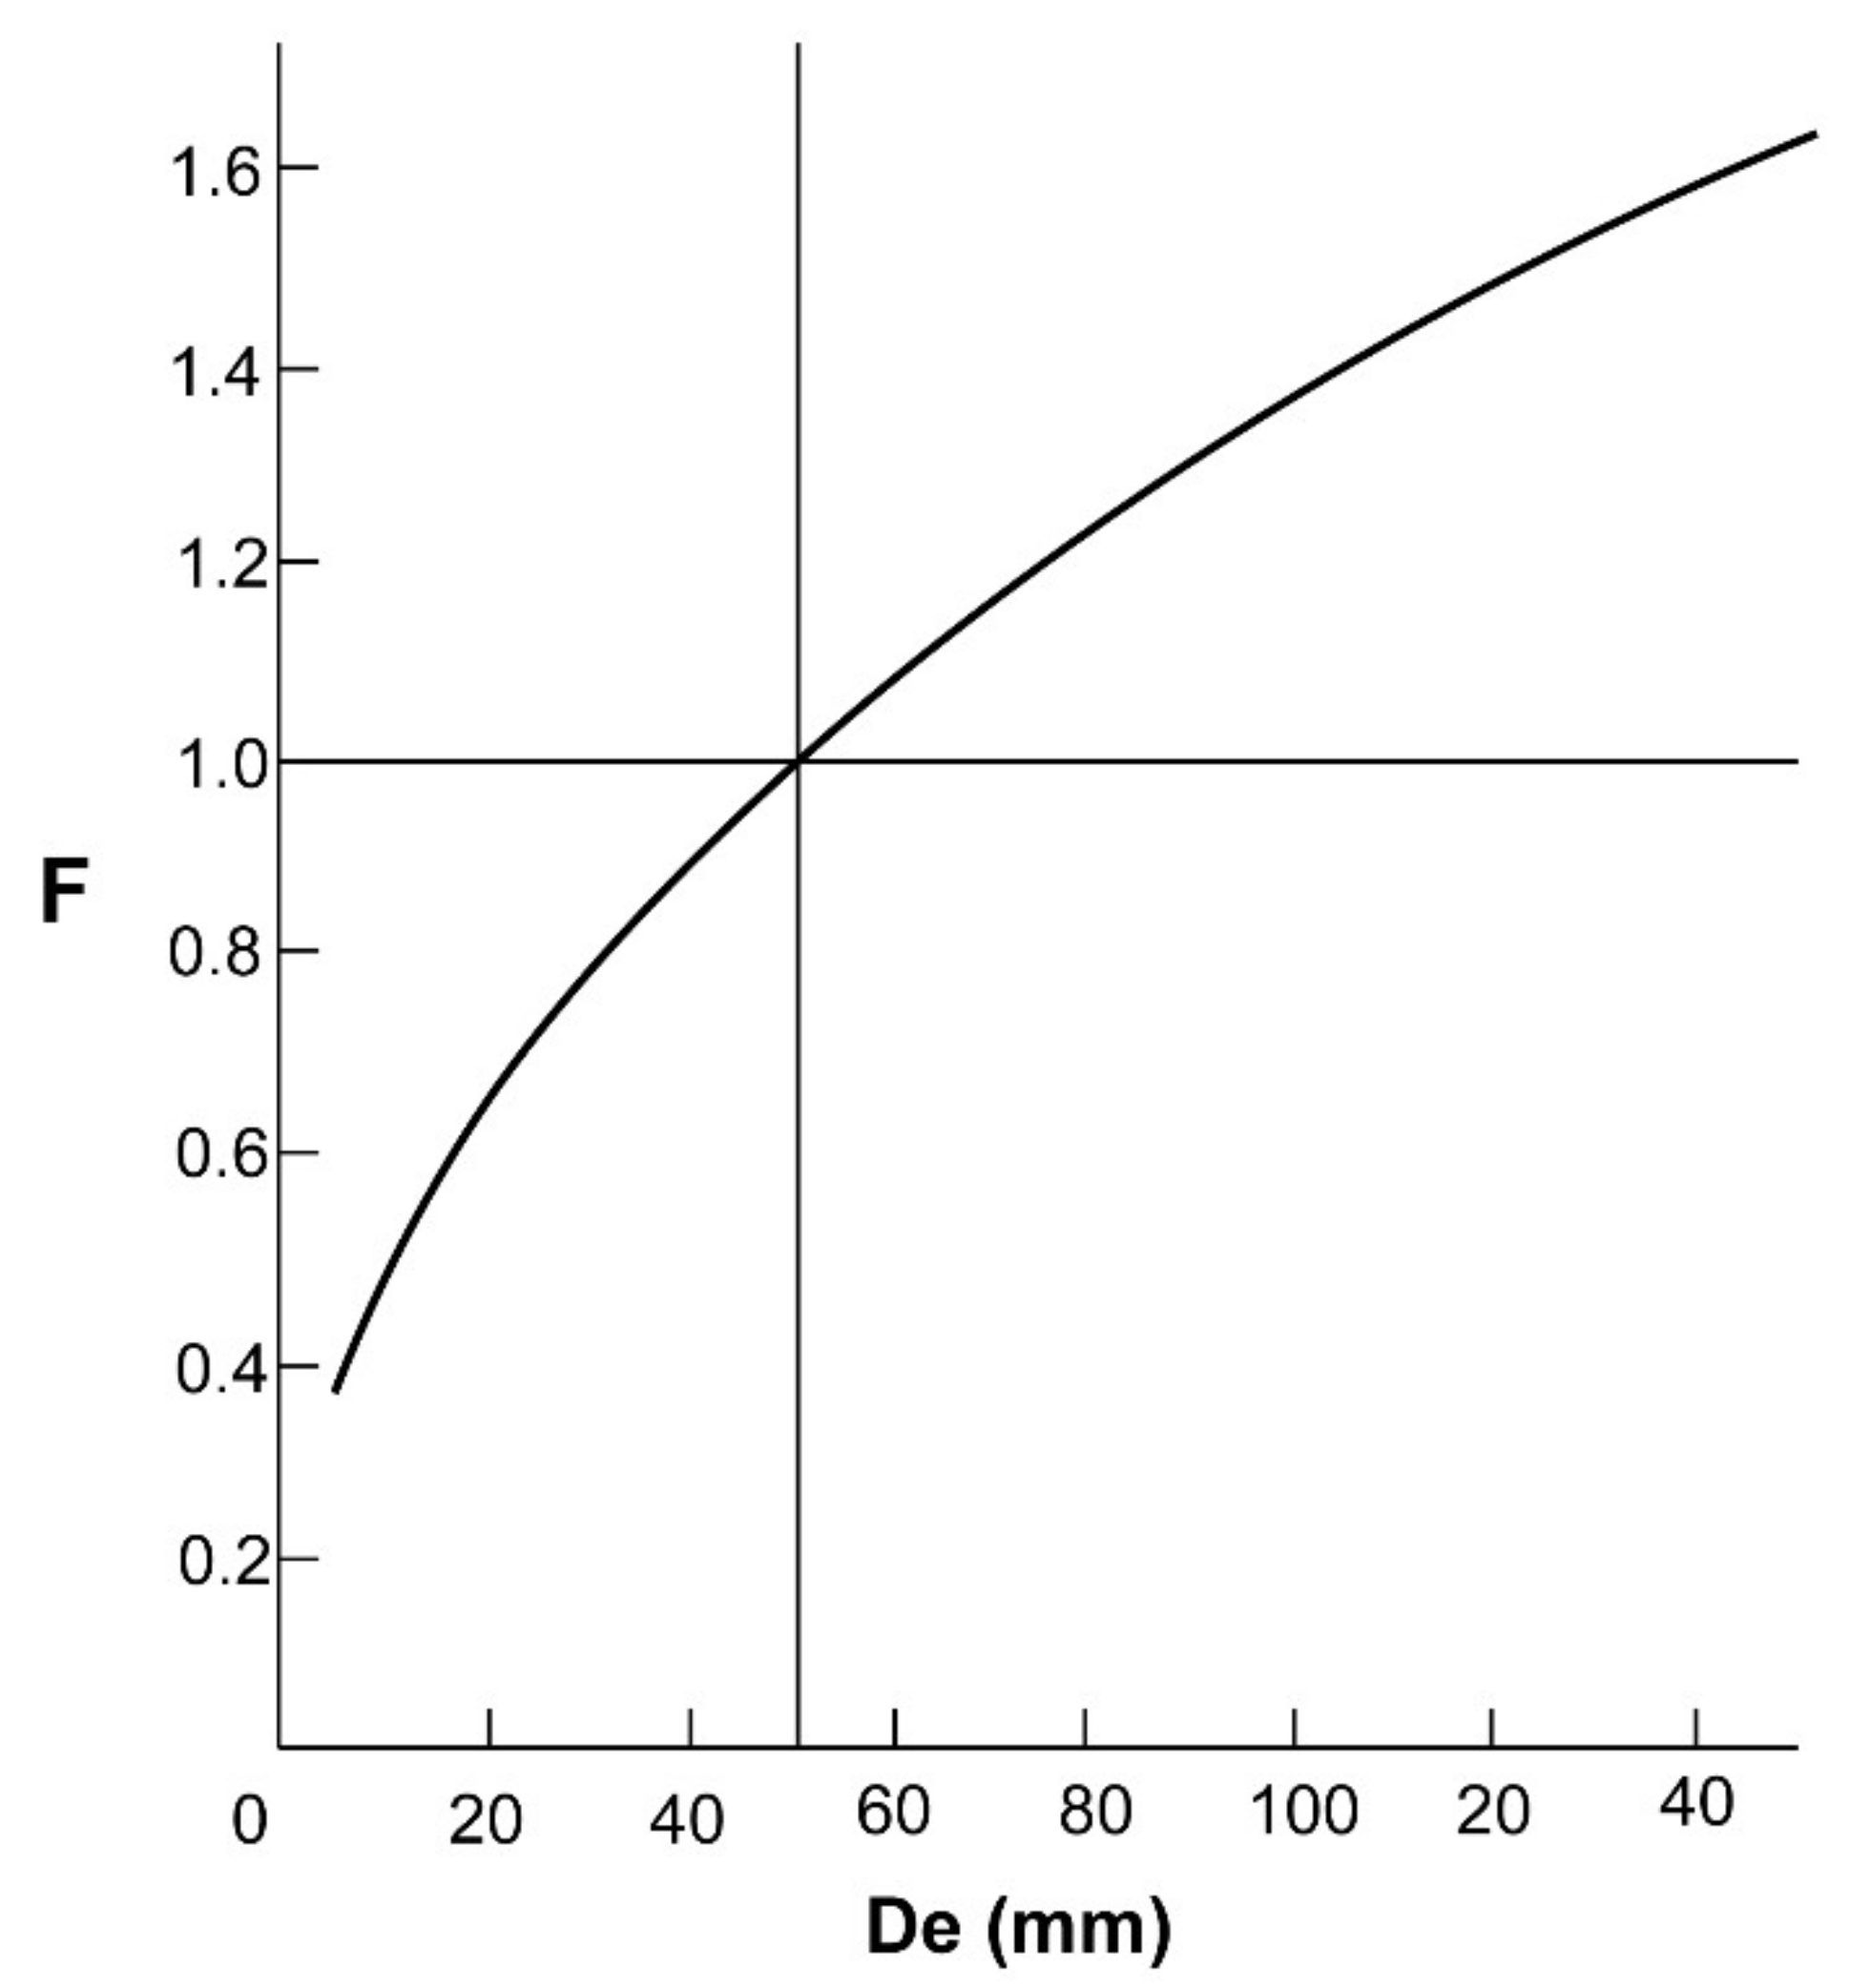
The Point Load Test is widely used to determine the resistivity index of rocks due to the easy and simple use of the instrument and the relatively low cost. The test measures the uniaxial compressive resistivity of rock samples. The test measures the resistivity of rock samples Is (50) to break them by adding a load concentrated in a point. Is varies depending on the diameter of the sample and/or on the equivalent diameter if the samples have an irregular shape. Hence, a correction is required to obtain a unique value for each rock type. In fact, such value may be used to classify the rocks. The correct value of resistivity Is (50) of a sample is defined as the Is values respect to a standard sample with a diameter D = 50 mm. If there are only irregular shape samples, as in our case, the shape correction is given by ISRM (1972) formula:
I s 50 = F × I s
The correction factor may be obtained also through graphical method (Figure A1) or from the following equation:
F = D e ÷ 50 0.45
Figure A1. Graphical method to derive k correction factor.
Land 11 01106 g0a1
When the Is (50) has been calculated, the Uniaxial Compressive Strength (UCS) may be expressed by the relationship:
U C S = k × I s 50
where k is the transformation factor from the literature [52]. The results of the Point Load Test are reported in Table A2.
Table A2. Point Load Test Results.
SampleIs (kPa)FIs (50)C0 (kPa)C0 (MPa)C0 (Kg/cm2)
19.351.3912.97269.780.272.75
212.061.3115.8328.640.333.35
313.331.418.7388.960.393.97
419.81.2323.48488.380.494.98
59.061.3312.03250.220.252.55
69.441.38130.6271.650.272.77
711.661.2614.63304.30.33.1
812.381.3817.09355.470.363.62
99.391.2812249.60.252.55
108.271.2210.09209.870.212.14
Simple mean 15311.70.33.2
Standard deviation 428.20.11.1
Corrected mean 14.5302.30.33.1
Corrected standard deviation 2.551.40.10.5
The UCS values have been used to calculate the shear strength. To do that, the non–linear method proposed by [53] has been applied. In this case, the shear strength of a rock mass, on the plane σ3σ1, may be calculated from the following Equation (A4):
σ 1 = σ 3 + m σ c σ 3 + m σ c 2
where:
  • σ1 = principal stress, maximum to break;
  • σ3 = principal stress, minimum to break;
  • σci = uniaxial compressive strength of the rock;
  • mb = rock mass parameter, in the case of intact rocks: mb = mi;
  • α = rock mass parameter, in the case of intact rocks: α = 0.5;
  • s = rock mass parameter, in the case of intact rocks s = 1;
After [54], such a method has been modified by the application of a regression procedure, which consists of overlapping the linear failure criterion of Mohr–Coulomb with the curve generated from the previous formula when σ3′ values are between σt and σ3max. Finally, c′ and φ′ have been calculated (Table A3) from:
φ = s i n 1 6 α m b s + m b   σ 3 m α 1 2 1 + α 2 + α + 6 α m b s + m b σ 3 n α 1
and
c = σ c i 1 + 2 α s + 1 α m b σ 3 n s + m b σ 3 n α 1 1 + α 2 + α 1 + 6 m b s + m b σ 3 n α 1 1 + α 2 + α
where: σ 3 n = σ 3 m a x / σ c i   ([53] suggested for a general case, a σ 3 m a x value equal to 0.25 σci );
m b = m i e G S I 100 28 14 D
S = e G S I 100 9 3 D
α = 1 2 + 1 6 e G S I 15 e 20 3
D is 0 in an undisturbed rock mass or 1 for a disturbed rock mass.
Table A3. Rock mass resistivity characterization.
Hoek Brown Classification
σci5Mpa
GSI *61
mi10
D0
Ei1375
Hoek Brown criterion
mb2.484
s0.013
a0.503
Cover break range
σ3max1.25MPa
Mohr–Coulomb overlap
c0.3MPa
φ33.74degrees
Rock mass parameters
σt−0.026MPa
σc0.566MPa
σcm1.118MPa
* The GSI (Geological Strenght Index) value, used for the non–linear method [53], derives from the Bieniawsky classification [55,56,57].
φ′ = 33.74 is the friction angle for pyroclastic deposits obtained from the Mohr–Coulomb overlap. It has been approximated to 34 for the stability analysis calculation (i.e., the Markland test; Section 4.3).

References

  1. Randazzo, G.; Cascio, M.; Fontana, M.; Gregorio, F.; Lanza, S.; Muzirafuti, A. Mapping of Sicilian Pocket Beaches Land Use/Land Cover with Sentinel–2 Imagery: A Case Study of Messina Province. Land 2021, 10, 678. [Google Scholar] [CrossRef]
  2. Short, A.D.; Masselink, G. Embayed and Structurally Controlled Beaches. In Handbook of Beach and Shoreface Morphodynamics; Short, A.D., Ed.; Wiley: Hoboken, NJ, USA, 1999; pp. 230–250. [Google Scholar]
  3. Bini, M.; Mascioli, F.; Pranzini, E. Geomorphological Hazard and Tourist Use of Rocky Coasts in Tuscany (NW Italy). In Proceedings of the 12th European Geoparks Conference, Pisa Coastal Plain, NW Tuscany, Italy, 4–6 September 2013; pp. 34–39. [Google Scholar]
  4. Violante, C. Rocky coast: Geological constraints for hazard assessment. Geol. Soc. Lond. Spec. Publ. 2009, 322, 1–31. [Google Scholar] [CrossRef]
  5. Bieniawski, Z.T. Classification of Rock Masses for Engineering: The RMR System and Future Trends. In Comprehensive Rock Engineering; Hudson, J.A., Ed.; Pergamon Press: Oxford, UK, 1993; Volume 3, pp. 553–573. [Google Scholar]
  6. Carter, R.W.G. Coastal Environments; Academic Press: London, UK, 1988. [Google Scholar]
  7. Petroccia, A.; Bonasera, M.; Caso, F.; Nerone, S.; Morelli, M.; Bormioli, D.; Moletta, G. Structural and geomorphological framework of the upper Maira Valley (Western Alps, Italy): The case study of the Gollone Landslide. J. Maps 2020, 16, 534–542. [Google Scholar] [CrossRef]
  8. Redweik, P.; Matildes, R.; Marque, F.; Santos, L. Photogrammetric Methods for Monitoring Cliffs with Low Retreat Rate. J. Coast. Res. 2009, 2, 1577–1581. [Google Scholar]
  9. Ruberti, D.; Marino, E.; Pignalosa, A.; Romano, P.; Vigliotti, M. Assessment of Tuff Sea Cliff Stability Integrating Geological Surveys and Remote Sensing. Case History from Ventotene Island (Southern Italy). Remote Sens. 2020, 12, 2006. [Google Scholar] [CrossRef]
  10. Di Crescenzo, G.; Santangelo, N.; Santo, A.; Valente, E. Geomorphological Approach to Cliff Instability in Volcanic Slopes: A Case Study from the Gulf of Naples (Southern Italy). Geosciences 2021, 11, 289. [Google Scholar] [CrossRef]
  11. Randazzo, G.; Italiano, F.; Micallef, A.; Tomasello, A.; Cassetti, F.P.; Zammit, A.; D’Amico, S.; Saliba, O.; Cascio, M.; Cavallaro, F.; et al. WebGIS Implementation for Dynamic Mapping and Visualization of Coastal Geospatial Data: A Case Study of BESS Project. Appl. Sci. 2021, 11, 8233. [Google Scholar] [CrossRef]
  12. Barbano, M.; Pappalardo, G.; Pirrotta, C.; Mineo, S. Landslide triggers along volcanic rock slopes in eastern Sicily (Italy). Nat. Hazards 2014, 73, 1587–1607. [Google Scholar] [CrossRef]
  13. Matano, F.; Caccavalle, M.; Esposito, G.; Fortelli, A.; Scepi, G.; Spano, M.; Sacchi, M. Integrated dataset of deformation measurements in fractured volcanic tuff and meteorological data (Coroglio coastal cliff, Naples, Italy). Earth Syst. Sci. Data 2020, 12, 321–344. [Google Scholar] [CrossRef] [Green Version]
  14. Lanza, S.; Randazzo, G. Tourist–beach protection in north–eastern Sicily (Italy). J. Coast. Conserv. 2013, 17, 49–57. [Google Scholar] [CrossRef]
  15. Lanza, S.; Randazzo, G. Improvements to a Coastal Management Plan in Sicily (Italy): New approaches to borrow sediment management. J. Coast. Res. 2011, 64, 1357–1361. [Google Scholar]
  16. Randazzo, G.; Lanza, S. Regional Plan against Coastal Erosion: A Conceptual Model for Sicily. Land 2020, 9, 307. [Google Scholar] [CrossRef]
  17. De Astis, G.; Ventura, G.; Vilardo, G. Geodynamic significance of the Aeolian volcanism (Southern Tyrrhenian Sea, Italy) in light of structural, seismological, and geochemical data. Tectonics 2003, 22, 1040. [Google Scholar] [CrossRef]
  18. Santo, A.P.; Clark, A.H. Volcanological Evolution of Aeolian Arc (Italy): Inferences from 40Ar/39Ar ages of Filicudi Rocks. In Proceedings of the IAVCEI Congress, Ankara, Turkey, 12–16 September 1994. [Google Scholar]
  19. Barberi, F.; Innocenti, F.; Ferrara, G.; Keller, J.; Villari, L. Evolution of Eolian Arc volcanism (Southern Tyrrhenian Sea). Earth Planet. Sci. Lett. 1974, 21, 269–276. [Google Scholar] [CrossRef]
  20. Beccaluva, L.; Rossi, P.L.; Serri, G. Neogene to Recent volcanism of the Southern Tyrrhenian–Sicilian area: Implications for the geodynamic evolution of the Calabrian Arc. Earth Evol. Sci. 1982, 3, 222–238. [Google Scholar]
  21. Beccaluva, L.; Gabbianelli, G.; Lucchini, F.; Rossi, P.L.; Savelli, C. Petrology and K/Ar ages of volcanic dredged from the Eolian seamounts: Implications for geodynamic evolution of the Southern Tyhrrenian basin. Earth Planet. Sci. Lett. 1985, 74, 187–208. [Google Scholar] [CrossRef]
  22. Ferrari, L.; Manetti, P. Geodynamic framework of the Tyrrhenian volcanism: A review. Acta Vulcanol. 1993, 3, 1–10. [Google Scholar]
  23. Westaway, R. Quaternary uplift of southern Italy. J. Geophys. Res. 1993, 98, 21741–21772. [Google Scholar] [CrossRef]
  24. Hippolyte, J.; Angelier, J.; Roure, F. A major change revealed by Quaternary stress patterns in the Southern Apennines. Tectonophysics 1994, 230, 199–210. [Google Scholar] [CrossRef]
  25. Milano, G.; Vilardo, G.; Luongo, G. Continental collision and basin opening in southern Italy: A new plate subduction in the Tyrrhenian Sea? Tectonophysics 1994, 230, 249–264. [Google Scholar] [CrossRef]
  26. Carminati, E.; Wortel, M.J.R.; Spakman, W.; Sabadini, R. The role of slab detachment processes in the opening of the western–central Mediterranean basins: Some geological and geophysical evidence. Earth Planet. Sci. Lett. 1998, 160, 651–665. [Google Scholar] [CrossRef]
  27. Ventura, G. Kinematics of the Aeolian volcanism (Southern Tyrrhenian Sea) from geophysical and geological data. In The Aeolian Islands Volcanoes; Lucchi, F., Peccerillo, A., Keller, J., Tranne, C.A., Rossi, P.L., Eds.; Memoirs Geological Society: London, UK, 2013; Volume 37, pp. 3–11. [Google Scholar] [CrossRef]
  28. Bortoluzzi, G.; Ligi, M.; Romagnoli, C.; Cocchi, L.; Casalbore, D.; Sgroi, T.; Cuffaro, M.; Tontini, F.C.; D’Oriano, F.; Ferrante, V.; et al. Interactions between Volcanism and Tectonics in the Western Aeolian Sector, Southern Tyrrhenian Sea. Geophys. J. Int. 2010, 183, 64–78. [Google Scholar] [CrossRef] [Green Version]
  29. Neri, G.; Barberi, G.; Orecchio, B.; Mostaccio, A. Seismic strain and seismogenic stress regimes in the crust of the southern Tyrrhenian region. Earth Planet. Sci. Lett. 2003, 213, 97–112. [Google Scholar] [CrossRef]
  30. D’Agostino, N.; Selvaggi, G. Crustal motion along the Eurasia–Nubia plate boundary in the Calabrian Arc and Sicily and active extension in the Messina Straits from GPS measurements. J. Geophys. Res. 2004, 109, B11402. [Google Scholar] [CrossRef]
  31. Lucchi, F.; Tranne, C.A.; Keller, J.; Gertisser, R.; Forni, F.; De Astis, G. Geological Map of the Island of Salina, Scale 1:10,000 (Aeolian Archipelago). In The Aeolian Islands Volcanoes; Lucchi, F., Peccerillo, A., Keller, J., Tranne, C.A., Rossi, P.L., Eds.; Memoirs Geological Society: London, UK, 2013; Volume 37, pp. 155–211. [Google Scholar]
  32. Lucchi, F.; Gertisser, R.; Keller, J.; Forni, F.; De Astis, G.; Tranne, C.A. Eruptive History and Magmatic Evolution of the Island of Salina (Central Aeolian Archipelago). In The Aeolian Islands Volcanoes; Lucchi, F., Peccerillo, A., Keller, J., Tranne, C.A., Rossi, P.L., Eds.; Memoirs Geological Society: London, UK, 2013; Volume 37, pp. 155–211. [Google Scholar]
  33. Mazzuoli, R.; Tortorici, L.; Ventura, G. Oblique rifting in Salina, Lipari and Vulcano Islands (Aeolian Islands, Southern Tyrrhenian Sea, Italy). Terra Nova 1995, 7, 444–452. [Google Scholar] [CrossRef]
  34. Continisio, R.; Ferrucci, F.; Gaudiosi, G.; Lo Bascio, D.; Ventura, G. Malta escarpment and Mt. Etna: Early stages of an asymmetric rifting process? Evidences from geophysical and geological data. Acta Vulcanol. 1997, 9, 39–47. [Google Scholar]
  35. Lanzafame, G.; Bousquet, J.C. The Maltese escarpment and its extension from Monte Etna to Aeolian Islands (Sicily): Importance and evolution of a lithospheric discontinuity. Acta Vulcanol. 1997, 9, 121–135. [Google Scholar]
  36. Romagnoli, C.; Casalbore, D.; Bortoluzzi, G.; Bosman, A.; Chiocci, F.L.; D’Oriano, F.; Gamberi, F.; Ligi, M.; Marani, M. Bathy–mortphological setting of the Aeolian islands. In The Aeolian Islands Volcanoes; Lucchi, F., Peccerillo, A., Keller, J., Tranne, C.A., Rossi, P.L., Eds.; Memoirs Geological Society: London, UK, 2013; Volume 37, pp. 27–36. [Google Scholar] [CrossRef]
  37. Keller, J. Die Geologie der Insel Salina. Ph.D. Thesis, Albert–Ludwigs–Universitat Freiburg, Breisgau, Germany, 1966. Unpublished. [Google Scholar]
  38. Keller, J.; Ryan, W.B.F.; Ninkovich, D.; Altherr, R. Explosive volcanic activity in the Mediterranean over the past 200.000 yr as recorded in deep–sea sediment. Geol. Soc. Am. Bull. 1978, 89, 591–604. [Google Scholar] [CrossRef]
  39. Morche, W. Tephrochronologie der Äolischen Inseln. Ph.D. Thesis, Albert–Ludwigs–Universitat Freiburg, Breisgau, Germany, 1988. Unpublished. [Google Scholar]
  40. Lucchi, F.; Tranne, C.A.; De Astis, G.; Keller, J.; Losito, R.; Morche, W. Stratigraphy and significance of Brown Tuffs on the Aeolian Islands (southern Italy). J. Volcanol. Geoth. Res. 2008, 177, 49–70. [Google Scholar] [CrossRef]
  41. Keller, J. The Island of Salina. Rend. Della Soc. Ital. Di Mineral. E Petrol. 1980, 36, 489–524. [Google Scholar]
  42. Quareni, F.; Ventura, G.; Mulargia, F. Numerical modelling of the transition from fissure– to central–type activity on volcanoes: A case study from Salina Island, Italy. Phys. Earth Planet. Inter. 2001, 124, 213–221. [Google Scholar] [CrossRef]
  43. Barca, D.; Ventura, G. Evoluzione vulcano–tettonica dell’isola di Salina (arcipelago delle Eolie). Mem. Della Soc. Geol. Ital. 1991, 47, 401–415. [Google Scholar]
  44. Tarquini, S.; Nannipieri, L. The 10–m resolution TINITALY DEM as a trans–disciplinary basis for the analysis of the Italian territory: Current trends and new perspectives. Geomorphology 2017, 281, 108–115. [Google Scholar] [CrossRef]
  45. Cruden, D.M.; Varnes, D.J. Landslide types and processes. In Landslides Investigation and Mitigation. Transportation Research Board; Turner, A.K., Schuster, R.L., Eds.; Special Report 247; US National Research Council: Whashington, DC, USA, 1996; Chapter 3; pp. 36–75. [Google Scholar]
  46. Carrivick, J.L.; Smith, M.W.; Quincey, D.J. Structure from Motion in Practice. In Structure from Motion in the Geosciences; John Wiley & Sons, Ltd.: New York, NY, USA, 2016; pp. 60–96. [Google Scholar] [CrossRef]
  47. Ullman, S. The interpretation of Structure from Motion. Proc. R. Soc. Lond. Ser. B Biol. Sci. 1979, 203, 405–426. Available online: https://www.jstor.org/stable/77505 (accessed on 26 June 2022).
  48. Casella, E.; Rovere, A.; Pedroncini, C.P.; Stark, M.; Casella, M.; Ferrari, M.; Firpo, M. Drones as tools for monitoring beach topography changes in the Ligurian Sea (NW Mediterrenean). Geo–Mar. Lett. 2016, 36, 151–163. [Google Scholar] [CrossRef]
  49. Markland, J.T. A useful technique for estimating the stability of rock slopes when the rigid wedge slide type of failure is expected. Imp. Coll. Rock Mech. Res. Repr. 1972, 19, 1–10. [Google Scholar]
  50. Goodman, R.E.; Bray, J.W. Toppling of Rock Slopes. In Proceedings of the Specialty Conference Rock Engineering for Foundations and Slopes, American Society of Civil Engineers, Boulder, CO, USA, 15–18 August 1976; pp. 201–234. [Google Scholar]
  51. Goodman, R.E. Introduction to Rock Mechanics; Wiley: Hoboken, NJ, USA, 1980; p. 478. [Google Scholar]
  52. Rusnak, J.; Mark, C. Using the Point Load Test to Determine the Uniaxial Compressive Strength of Coral Measure Rock. In Proceedings of the 19th International Conference on Ground Control in Mining, Morgantown, WV, USA, 8–10 August 2000; pp. 362–371. [Google Scholar]
  53. Hoek, E.; Brown, E.T. Empirical strength criterion for rock masses. J. Geotech. Eng. Div. 1980, 106, 1013–1035. [Google Scholar] [CrossRef]
  54. Hoek, E.; Carranza, C.; Itasca, T. Hoek–Brown Failure Criterion–2002 Edition. In Proceedings of the North American Rock Mechanics Society Meeting, Toronto, ON, Canada, 7–10 July 2002. [Google Scholar]
  55. Bieniawski, Z.T. Rock mass Classification in Rock Engineering. In Exploration for Rock Engineering; Balkema: Cape Town, South Africa, 1976; Volume 1, pp. 97–106. [Google Scholar]
  56. Bieniawski, Z.T. Determining rock mass deformability. Int. J. Rock Mech. Min. Sci. 1978, 15, 335–343. [Google Scholar] [CrossRef]
  57. Bieniawski, Z.T. Engineering Rock Mass Classifications: A Complete Manual for Engineers and Geologists in Mining, Civil, and Petroleum Engineering; Wiley–Interscience: New York, NY, USA, 1989; pp. 40–47. ISBN 0-471-60172-1. [Google Scholar]
Figure 2. (a) The Phantom 4 Pro drone during its take–off in the flat courtyard of Capo Faro Estate; (b) Dense point cloud of the flight area in RGB colour, processed with the Agisoft Metashape software.
Land 11 01106 g002
Figure 7. (a) Geological cross–section showing the main stratigraphic units (topographic profile 3 in Figure 5); (b) Geological cross–section showing the main stratigraphic units (topographic profile 4 in Figure 5).
Land 11 01106 g007aLand 11 01106 g007b
Figure 8. (a) Equal angle projection (lower hemisphere) of the measured discontinuities (poles) and contours. The blue lines are the mean planes of each recognized system; (b) Equal angle projection of all the intersections among planes (blue dots).
Land 11 01106 g008
Figure 9. (a) 3D textured model focused on the vertical coastal cliff (red squares indicate the described outcrops). (be) shooting areas are indicated by red squares; (b) Pyroclastic deposits of the po affected by normal faulting of the K1 conjugated system (yellow arrow indicated the sense of displacement); (c) Boat–view of the cliff affected by K2a and K2b conjugated faults, intersecting forming a wedge; (d) K2a and K2b conjugated faults with a normal sense of displacement (indicated in yellow); (e) K3 discontinuity cutting the alternance of pyroclastic layers with different cementation degree of the po.
Land 11 01106 g009
Figure 10. Stereographic equal angle plots (lower hemisphere) with the critical zones (red and yellow areas) for failure mode. (a) Planar sliding for Slope 1; (b) Planar sliding for Slope 2; (c) Wedge sliding for Slope 1; (d) Wedge sliding for Slope 2; (e) Direct and oblique toppling for Slope 1; (f) Direct and oblique toppling for Slope 2.
Land 11 01106 g010aLand 11 01106 g010b
Figure 11. (a) The red arrow indicates the detachment cavity on the vertical cliff; (b) The deposits of the rockfalls and topplings coming from the cliff feed the pocket beach in front; (c) The lava flow referable to Vallone del Castagno Formation (vc) overlying the pyroclastic deposits of the Portella Formation (po). The left red arrow indicates the detachment area of the rock avalanche, the right one points to a fracture in the lava layer, warning of an incipient failure; (d) The cliff is retreating: the dashed green line indicates the crown of the rock avalanche in the vertical cliff; the yellow one the incipient detaching block, probably falling onto rock avalanche deposits. Detrital blocks maximum dimensions are about 70 m3, assessed with the dense point cloud.
Land 11 01106 g011aLand 11 01106 g011b
Table 1. Stratigraphy of Capo Faro Promontory (modified from [31]).
Eruptive EpochSynthemVolcanic VentFormationDescriptionAge
VI(Vulcano Island)Piano Grotte dei RossiAsh tuffs in a massive brownish shape up to 2 m of thicknessn.d.
VISerra di PollaraPollaraPunta di FontanellePumiceous pyroclastic deposits (30–40 m thick)27.5 ky
VValdichiesaMonte dei PorriSerra di SciaratoTwo members: (i) massive CA basaltic andesite lava flow, 5–10 m thick; (ii) scoriaceous deposits, up to several metres thickn.d.
VValdichiesaMonte dei PorriRocce di BarconePyroclastic deposits 50–70 m–thick, made of two facies: (i) massive proximal with lots of lithics; (ii) distal with stratified lapilli/tuffs in thin layers and planar to cross–stratified tuffs72.7–67.9 ky
V(Vulcano Island)PianoconteDistal fallout deposits made of massive ash tuff, 5–7 m of thicknessn.d.
Q.P. 1FontanellePunta BrigantinoPoorly sorted, a coarse conglomerate with rounded pebbles and boulders up to 1.5 m in size (3–4 m–thick). The erosional basal contact is referable to the marine transgression of MIS 5c and 5a100–81 ky
Q.P.Piano MilazzeseSerro dell’AcquaVolcanic re–worked debris deposits up to 20 m–thick110–105 ky
IIIScoglio della FortunaMonte RiviVallone del CastagnoPyroclastic succession made up of alternated thin layers of incoherent, massive pyroclastic breccias of reddish scoria, and planar to cross–stratified lapilli–tuff beds up to 50 m–thick. In Capo Faro Promontory crops out as a massive lava flowca. 168 ky
IIVallone MartelloPizzo CapoPortellaUp to 120 m–thick successions of scoria with the alternation of metre–thick layers with planar–stratified fallout depositsca. 240 ky
IIVallone MartelloPizzo CapoPiano del Serro del CapoScoriaceous pyroclastic succession up to 15 m–thick, made by an alternation of massive lithic–rich beds with tuff–breccias and lava flowsn.d.
IPaleo–SalinaPizzo CapoTorricellaPoorly bedded fallout and volcanic debris deposits with discontinuous interbedded massive lava flown.d.
1 Q.P.: quiescence period.
Publisher’s Note: MDPI stays neutral with regard to jurisdictional claims in published maps and institutional affiliations.

