Article

Mitigation of Deicing Salt Loading to Water Resources by Transpiration from Green Infrastructure Vegetation

1
Department of Engineering Systems and Environment, University of Virginia, 351 McCormick Rd., Charlottesville, VA 22904, USA
2
Department of Environmental Science and Technology, University of Maryland, College Park, MD 20742, USA
3
Department of Environmental Engineering, Florida Polytechnic University, 4700 Research Way, Lakeland, FL 33805, USA
*
Author to whom correspondence should be addressed.
Land 2022, 11(6), 907; https://doi.org/10.3390/land11060907
Submission received: 20 May 2022 / Revised: 10 June 2022 / Accepted: 13 June 2022 / Published: 14 June 2022

Abstract

:
Green infrastructure (GI) protects aquatic ecosystems from stormwater runoff caused by urban development. Bioretention (BR) is a typical GI system wherein stormwater runoff is routed to a soil basin planted with vegetation and has been shown to reduce deicing salt loads in surface runoff, but the removal mechanism of salt is poorly understood. This study explores the potential of different vegetation types to reduce deicing salt released from a BR by transpiration. Six engineered soil media columns were built in a laboratory greenhouse to simulate a 1012 m2 BR basin along Lorton Road, Fairfax County, VA, USA. The effect of vegetation type (Blue Wild Indigo and Broadleaf Cattail) and influent salt concentration on flow volume and salt mass reduction were quantified for multiple storm events. For all storm events, chloride inflow concentrations, and vegetation types, Cl load reduction ranged from 26.1% to 33.5%, Na+ load reduction ranged from 38.2% to 47.4%, and volume reductions ranged from 11.4% to 41.9%. Different inflow salt concentrations yielded different removal rates of deicing salt, and for a given column, salt removal decreased over sequential storm events. For each influent salt concentration, columns planted with Broadleaf Cattail (BC) performed better for volume and salt mass reductions than columns planted with Blue Wild Indigo (BWI), which in turn performed better than the controls.

1. Introduction

Sudden discharges of stormwater have become a leading threat to aquatic ecosystems [1,2], creating water pollution, soil erosion, flooding, and combined sewer overflows into receiving waters [3,4]. Land-use modifications with urbanization, including removal of vegetation and increasing impervious surfaces, are changing how water flows in urban landscapes and lead to stormwater runoff risks, such as decreasing waterbody health, impairing aquatic habitats, and contributing to nonpoint source pollution [5,6,7].
The use of deicing salts in winter on highways represents one of a number of different sources of associated salt ions released into receiving waters, others being commercial parking lots, sidewalks, and residential application [8,9]. Chloride-based salts are used worldwide for deicing purposes, and sodium chloride (NaCl) is most commonly employed in North America [10,11]. In the winter of 2018, the estimated amount of deicing salt used in the USA for highways was 25 million metric tons [12]. Na+ and Cl ions can easily travel with stormwater runoff from impervious surfaces to plants, receiving waters and soil, which stresses plants and animals, as it impacts water quality [8]. Chloride from deicing salt can be stored in shallow groundwater in winter and released into surface water bodies slowly [13,14], contributing to the impairment of the aquatic life and health of waterbodies with time [15,16]. Cl is a relatively conservative constituent and its USA EPA acute and chronic freshwater aquatic life ambient water quality criteria are 860 mg/L and 230 mg/L, respectively.
The effects of urbanization and climate change on freshwater ecology has increased the demand for new stormwater management techniques to alleviate hydrologic impact and water quality problems due to urbanization. Roadside stormwater management systems are also being employed to mitigate the potential effects of highway runoff on receiving waters [17]. Conventional stormwater management techniques tend to use curb–gutter–pipe networks to delay the adverse impacts of high-volume stormwater, without treatment [1]. Green infrastructure (GI), also known as green stormwater infrastructure (GSI) or low-impact development (LID), could mimic natural landscape hydrology by slowing, spreading, and infiltrating stormwater runoff before discharging it into receiving waters [8]. Different from gray infrastructure, GI uses vegetation, soils, and other natural landscape features to manage wet weather impacts, reduce and treat stormwater at its source, and create sustainable and healthy communities in a cost-effective and sustainable way [5]. With rapid urbanization in the last few decades, GI has become an effective design in protecting waterways from various detrimental effects of urban stormwater through reducing flow volume and improving water quality [18].
A typical GI stormwater management technique is a bioretention (BR) system, which has received increasing interest for its performance in mitigating runoff risks in recent years [19,20,21]. A BR consists of a soil bed planted with suitable (preferably native) vegetation to control the quality, quantity, and flow rates of stormwater runoff in urban areas [22]. Stormwater runoff entering the BR system is filtered into an underlying layer of engineered soil media before being either conveyed downstream by an underdrain system or infiltrated into the existing subsoil below the soil bed. Infiltration through the engineered soil media provides uptake of pollutants and runoff through physical, chemical, and biological means. A BR design with an underdrain is known as a BR filter, which could achieve moderate to high levels of runoff and peak flow reduction through infiltration, evaporation, and storage, which further decrease pollutant load transport to receiving waters [23,24]. Plants are introduced for pollutant reduction and soil stability in BR [25]. Previous studies indicate that plants in BR systems maintain soil porosity and contribute to the removal of nutrients, metals, total suspended solids, and some other pollutants [26,27]. However, very few experimental studies exist exploring the potential of vegetation in BR to attenuate the transport of deicing salt (NaCl), which is a threat to aquatic ecosystems along highways in urban areas during winter. Some vegetation types, such as Broadleaf Cattail, can survive in brackish soil water and can store large amounts of salt. This kind of plant could be employed to treat road runoff containing deicing salts before it flows into receiving water [28]. Burgis et al. (2020) monitored the fate and transport of deicing salt through an operational infiltration-based GI systems in Northern Virginia, finding that infiltration GI have the ability to buffer surface waters from salt, but the primary mechanism for doing so was salt transfer from surface water to groundwater, with legacy environmental consequences. That study suggested that vegetation may play a role in salt transport, but the authors were not able to directly determine the contribution of vegetation on salt load reduction.
The purpose of this study is to quantify the flow reduction and salt mass reduction caused by vegetation and to explore the potential of vegetation in green infrastructure to mitigate deicing salt (NaCl). This is accomplished by conducting one-dimensional greenhouse-scale experiments with two plant types and associated controls. Experiments were performed using different salt loadings and multiple simulated storm events for each control and vegetation type.

2. Materials and Methods

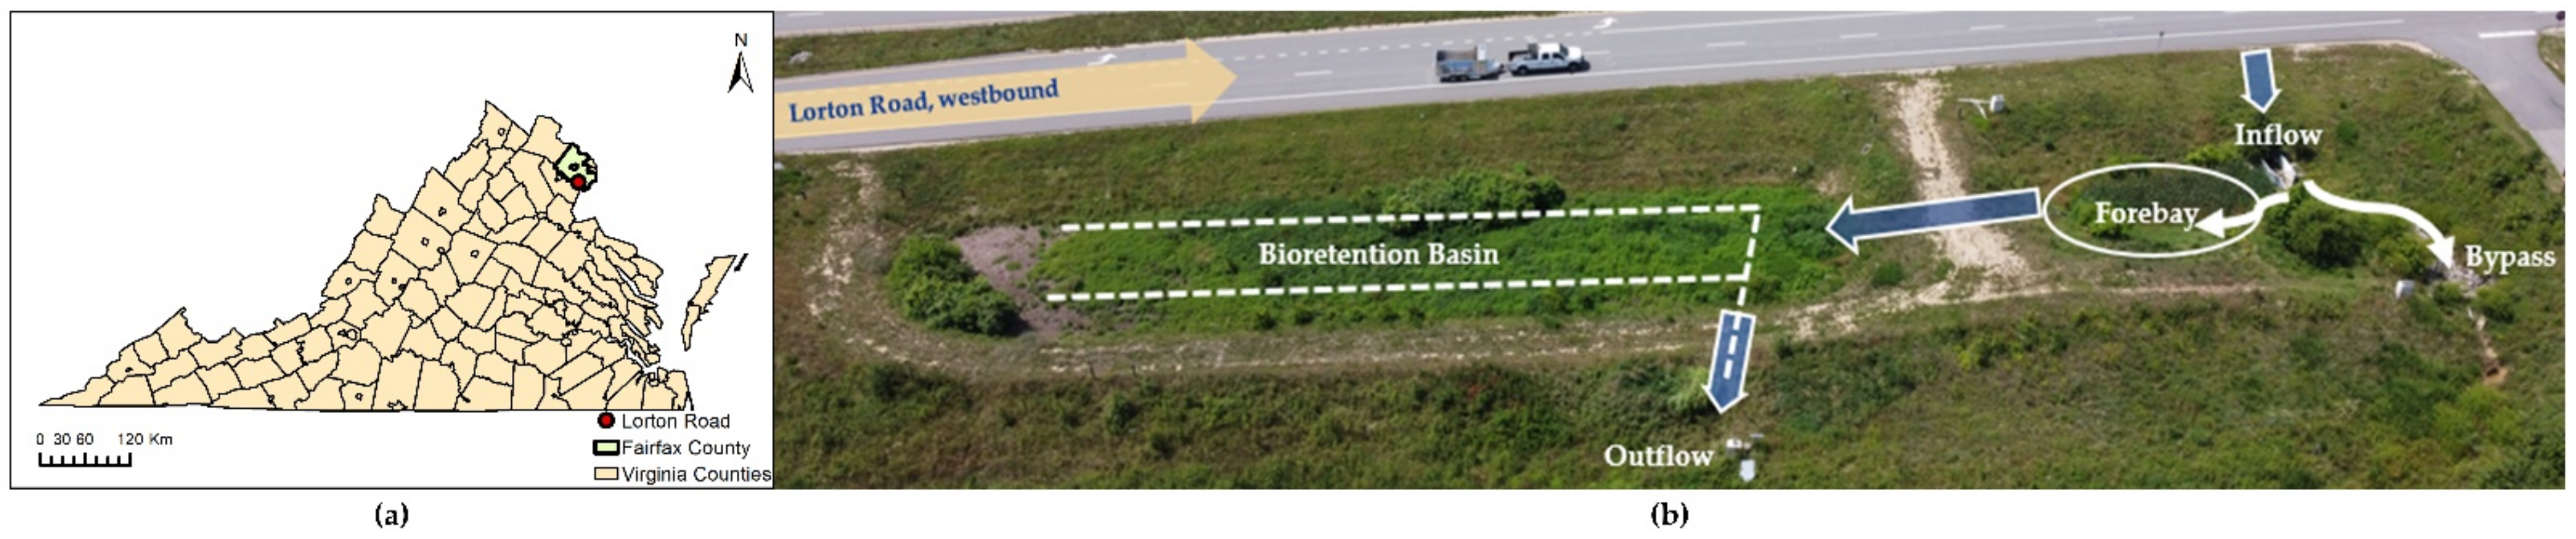
2.1. Field Study Site

Lorton Road in Fairfax County, VA, USA is a part of the Giles Run watershed, within the Chesapeake Bay watershed. The Virginia Department of Transportation (VDOT) expanded it from an approximately 4 km two-lane undivided road to a four-lane divided road with an average daily traffic volume of 100,000 vehicles/day [29,30]. Fairfax County funded the design and construction for 47 different GI systems to manage the additional stormwater runoff in the spring of 2017. A BR basin (hereafter bioretention) was selected and monitored for this study along this road. It is in the north of Lorton Road, consisting of a pretreatment forebay and a basin for treatment connected by a 0.6 m concrete culvert through an earthen berm (approximately 1.5 m in height and 5 m in width) (Figure 1). The vegetation in the basin was planted as “plugs” instead of seeds. Concentrated stormwater from Lorton Road flows into the bioretention via curb and gutter sewers. The outflow from the bioretention basin after treatment flows into the Giles Run watershed, within the Chesapeake Bay watershed. Stormwater travels into the forebay for pretreatment before flowing into the basin (Figure 2). For storm events larger than design-size, a channel in the forebay allows overflow stormwater to the bypass, which is connected to the forebay. The design specifications, monitoring station characteristics, and plant species of the bioretention design are given in Table 1. Inflow, bypass flow, and outflow were monitored using solar-powered programmable samplers for stormwater runoff and H-flumes with ultrasonic sensors to quantify discharge of the runoff at the field site described by Burgis et al. (2020). All of the three monitoring locations were used to calculate runoff and salt load reductions (load reduction = (inlet − outlet − bypass)/Inlet). Appendix A Figure A1 indicates the annual precipitation information from the Washington Reagan National Airport Weather Station in Northern Virginia (nearby Lorton Road) between 2011 and 2021 [31].
Automated stormwater monitoring equipment was installed to measure flow rate and volume. Sampling work started in March of 2018 in the BR, and more than 30 storm events were monitored by 2021. Flow-weighted composite stormwater samples were collected within 24 h of each storm event for lab analysis by autosamplers. Concentrations of collected samples were used as event mean concentrations (EMCs) for each monitoring station. Ion loads through each monitoring location were determined by multiplying EMC values by total stormwater volume [8]. The cumulative Cl surface water effluent load reduction in the BR was 80% and Na+ effluent load reduction was 82%, as described by Burgis et al. (2020).

2.2. Laboratory Experimental Design

The BR basin was simulated in proportion for depth using six engineered soil media columns in the greenhouse laboratory with constant illumination (approximately 16 h for daytime and 8 h for nighttime) and climate (approximately 24 °C during daytime and 20 °C during nighttime). The variability of weather outside the greenhouse at times influenced the internal greenhouse temperature, leading to slight deviations from the set temperatures. The depth of subsurface layers in the field is 1.37 times the column depth. Each column is 0.2 m2 in surface area, 0.5 m in diameter, and 0.97 m in depth (Figure 3). They consist of cylindrical plastic containers filled with engineered soil media and drainage gravel of similar specifications to what is used at the Lorton Road bioretention. The columns contain 11.1 cm ponding depths, 55.6 cm of engineered soil media (ESM) (3.2% clay, 5.6% silt, 91.2% sand) on top of 29.7 cm of underlying gravel (7.4 cm VDOT #8 stone with the outlet and 22.3 cm VDOT #57 stone). The ESM was purchased from “Quail Ridge Products” in Fredericksburg, VA, USA, and all of the gravel was triple washed with tap water before installation. Two of the columns had no vegetation (Blank) as control samples, two had native BR vegetation, established Blue Wild Indigo (BWI), to explore the ability of native plants in the BR basin for reducing the loading of deicing salt in the field, and another two columns had salt-tolerant vegetation, Broadleaf Cattail (BC), which is not in the BR basin (Figure 4), so that each Blank, BWI, and BC had a duplicate column to compare. All of the plants were planted with optimum density of 20 plugs per square meter based on field observation to insure satisfactory growth.
Synthetic stormwater, with sodium chloride concentrations matched with observed field samples, was filtered through each soil column at a constant rate and sampled at the outlet at the bottom of each column. Synthetic stormwater was sprayed by the irrigation system into soil columns, and the discharge rate for each column was consistent and designed based on the observed field rain data in proportion. Composite outflow samples were collected in 118 mL Nasco Whirl-Pak Stand-Up Sample Bags at column outlets for analysis during every storm event, and then the overflow water from sample bags traveled into buckets for volume measurement.
For each column, five storm events sizes were simulated at three deicing salt (NaCl) concentration ranges. Concentration ranges (low, medium, and high) were selected based on observed field concentrations reported previously by Burgis et al. (2020). Samples of these 15 synthetic stormwater events before and after column filtration was analyzed for chloride by ion chromatography and for sodium using inductively coupled plasma mass spectrometry. The specifications and characteristics for field rain and flow data used to inform the greenhouse column experiments are given in Table 2. The design specifications and other characteristics of the soil columns and synthetic storm events are included in Table 3.
According to the observed field data in the BR at Lorton Road, the Cl and Na+ concentrations of representative storm events before winter were fewer than 40 ppm, which was set as the low-level deicing salt concentration. Ion concentrations were between 40 ppm and 200 ppm for the first few light snow events during one year, which was set as the medium-level of deicing salt concentration. The highest level of deicing salt concentration could reach up to approximately 2000 ppm in the coldest climate during the winter. The specific concentration and proportion for Cl and Na+ of each inflow concentration level were designed based on the approximate average concentration of the field data in the same range, and other synthetic stormwater specifications were designed based on observed field rain data, which are given in Table 3.

2.3. Sample Collection

Tap water served as a base to generate the synthetic stormwater used for testing. Before each storm event, tap water was stored in tanks and air was bubbled through the water to remove chlorine from the tap water. Due to the variety of experiments, the inflow concentration for each storm was measured as the real inflow concentration (Table 3). Water samples were collected as they flowed in and out of each column and volumes of inflow and outflow for each storm event were recorded. Composite outflow samples were collected in sample bags at column outlets for analysis during every storm event, and then the overflow water from sample bags traveled into buckets for volume measurement. Sample bags were new for each storm event and all of the buckets were cleaned between storms. Laboratory blanks were taken to ensure no salt cross-contamination occurred before sampling events. Concentrations of inlet and outlet samples were used as event mean concentrations (EMCs) for each monitoring container. Ion loads through each outlet point were determined by multiplying EMC values by total stormwater inflow or outflow volume over the monitoring period.

2.4. Sample Analysis

Collected water samples were filtered using syringes filters (0.45 μm polytetrafluoroethylene (PTFE)) and analyzed for sodium and chloride ions. All of the analyses included synthetic stormwater samples and column blanks. When a sample had an ion concentration higher than the upper range of calibration, they were diluted and re-run within calibration range. Volume reductions were calculated using Equation (1) and total mass load reductions of deicing salt were calculated using Equation (2).
VLR = Inlet Outlet Inlet × 100
In Equation (1), VLR = volume load reduction, Inlet = inflow volume (L), and Outlet = outflow volume (L).
MLR = Con In × Inlet Con out × Outlet Con In × Inlet × 100
In Equation (2), MLR = mass load reduction, ConIn = chemical concentrations of inflow (mg/L), Inlet = inflow volume (L), Conout = chemical concentrations of outflow (mg/L), and Outlet = outflow volume (L).
Before planting vegetation and beginning synthetic stormwater experiments, blank samples for each established column were collected using tap water as inflow to test whether all of the columns had similar nondetectable levels of sodium and chloride ions in the effluent. Blank samples were analyzed, and they are all below designed lowest inflow deicing salt concentrations (Figure 5), which indicated that all of the six columns were in satisfactory condition to begin the experiments.

2.5. Statistical Analysis

Statistical analysis was performed using the software R (version 4.0.3 (https://www.npackd.org/p/r/4.0.3, accessed on 26 January 2022). An analysis of variance (ANOVA) was used to assess the effect of greenhouse columns and salt levels on Cl and Na+ load reductions. Data normality was confirmed using the Shapiro-Wilk test. The criteria of 95% confidence (significance level, α = 0.05) was used for all tests. Tukey’s range test, a multiple comparison test, was conducted to determine significant differences between experimental column groups.

3. Results

3.1. Subsection Stormwater Chemistry

Water quality and quantity data of inflow and outflow for each stormwater event are given in Table 4, Table 5 and Table 6. Three levels of inflow concentrations were used (low, medium, and high). The mean low-concentration inflow solution had Cl and Na+ concentrations of 33.0 mg/L and 23.6 mg/L. The mean medium inflow solution had Cl and Na+ concentrations of 154.0 mg/L and 71.3 mg/L, respectively. The mean high-concentration inflow solution had Cl and Na+ concentrations of 1751.9 mg/L and 649.0 mg/L, respectively.

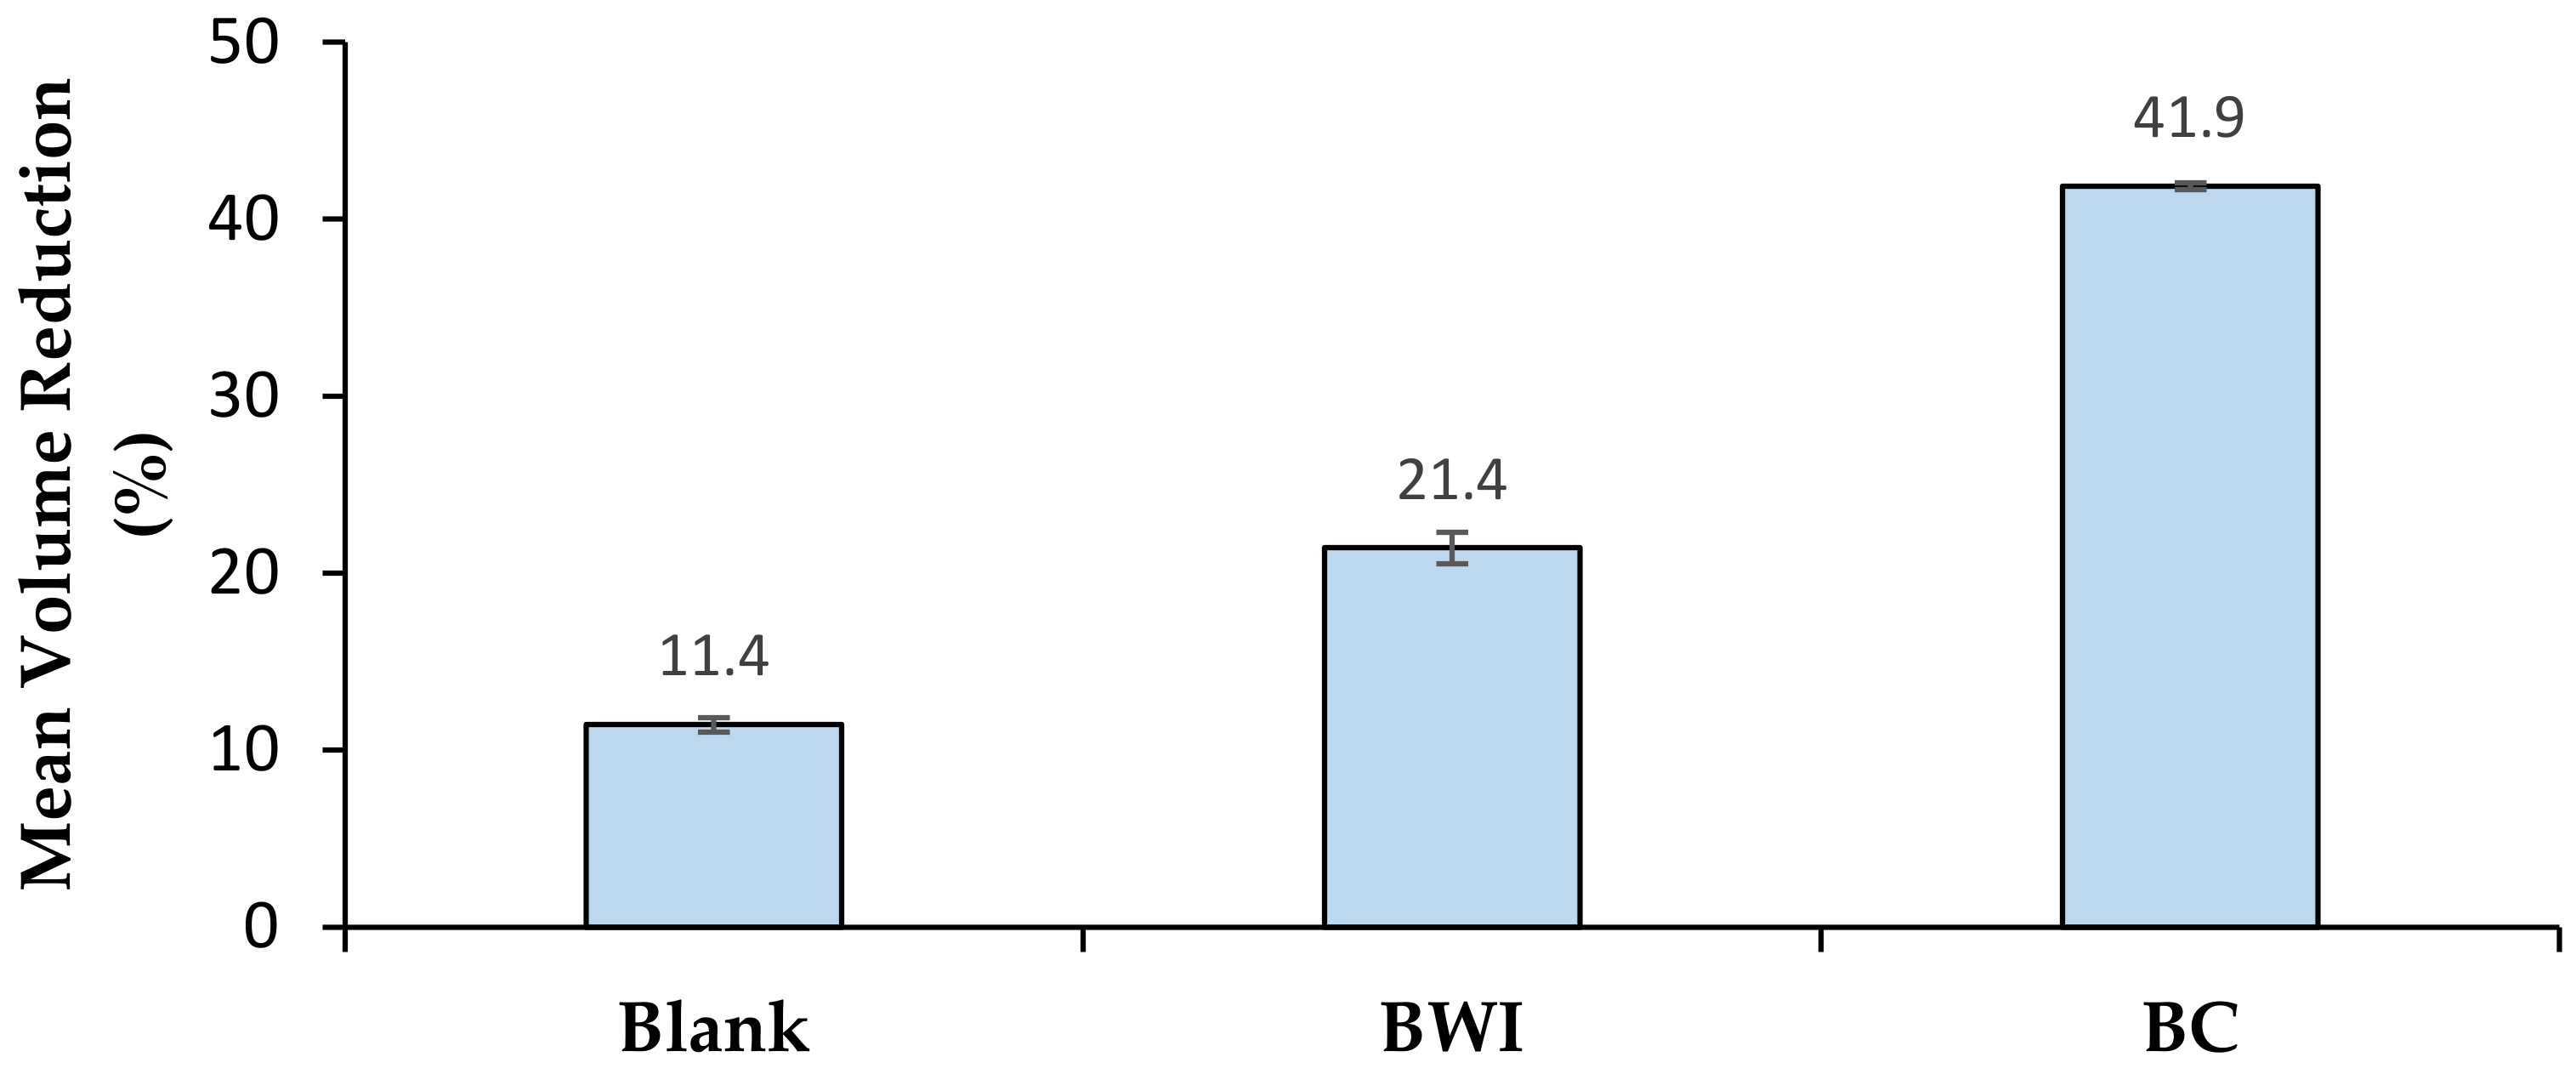
3.2. Overall Stormwater Quantity and Quality Performance for All Storm Events

For flow reduction experiments, the effluent volume of water from the control columns were compared with the effluent volume from the plant columns. In this way, we were able to separate the effects of flow reduction caused by pore filling and evaporation with flow reduction caused by plant transpiration. The water quantity results indicate all three types of columns reduce flow volumes during the experiments. The mean volume reductions for all 15 synthetic storms for each type of column are 11.4% for blank, 21.4% for BWI, and 41.9% for BC, respectively (Figure 6). BC showed a significantly higher volume reduction than the blank columns (p = 0.011).
The mean mass load reduction for all 15 synthetic storm events for both Cl and Na+ were calculated for each of the three types of columns. The results indicate the Cl mean mass load reductions are 26.1% for blank, 30.1% for BWI, and 33.5% for BC respectively, and the mean mass load reductions for Na+ are 38.2% for blank, 41.7% for BWI, and 47.4% for BC, respectively (Figure 7).
For both volume and mass load reduction, the addition of plants to the columns improved system performance, and BC performed better than BWI (Figure 6 and Figure 7).

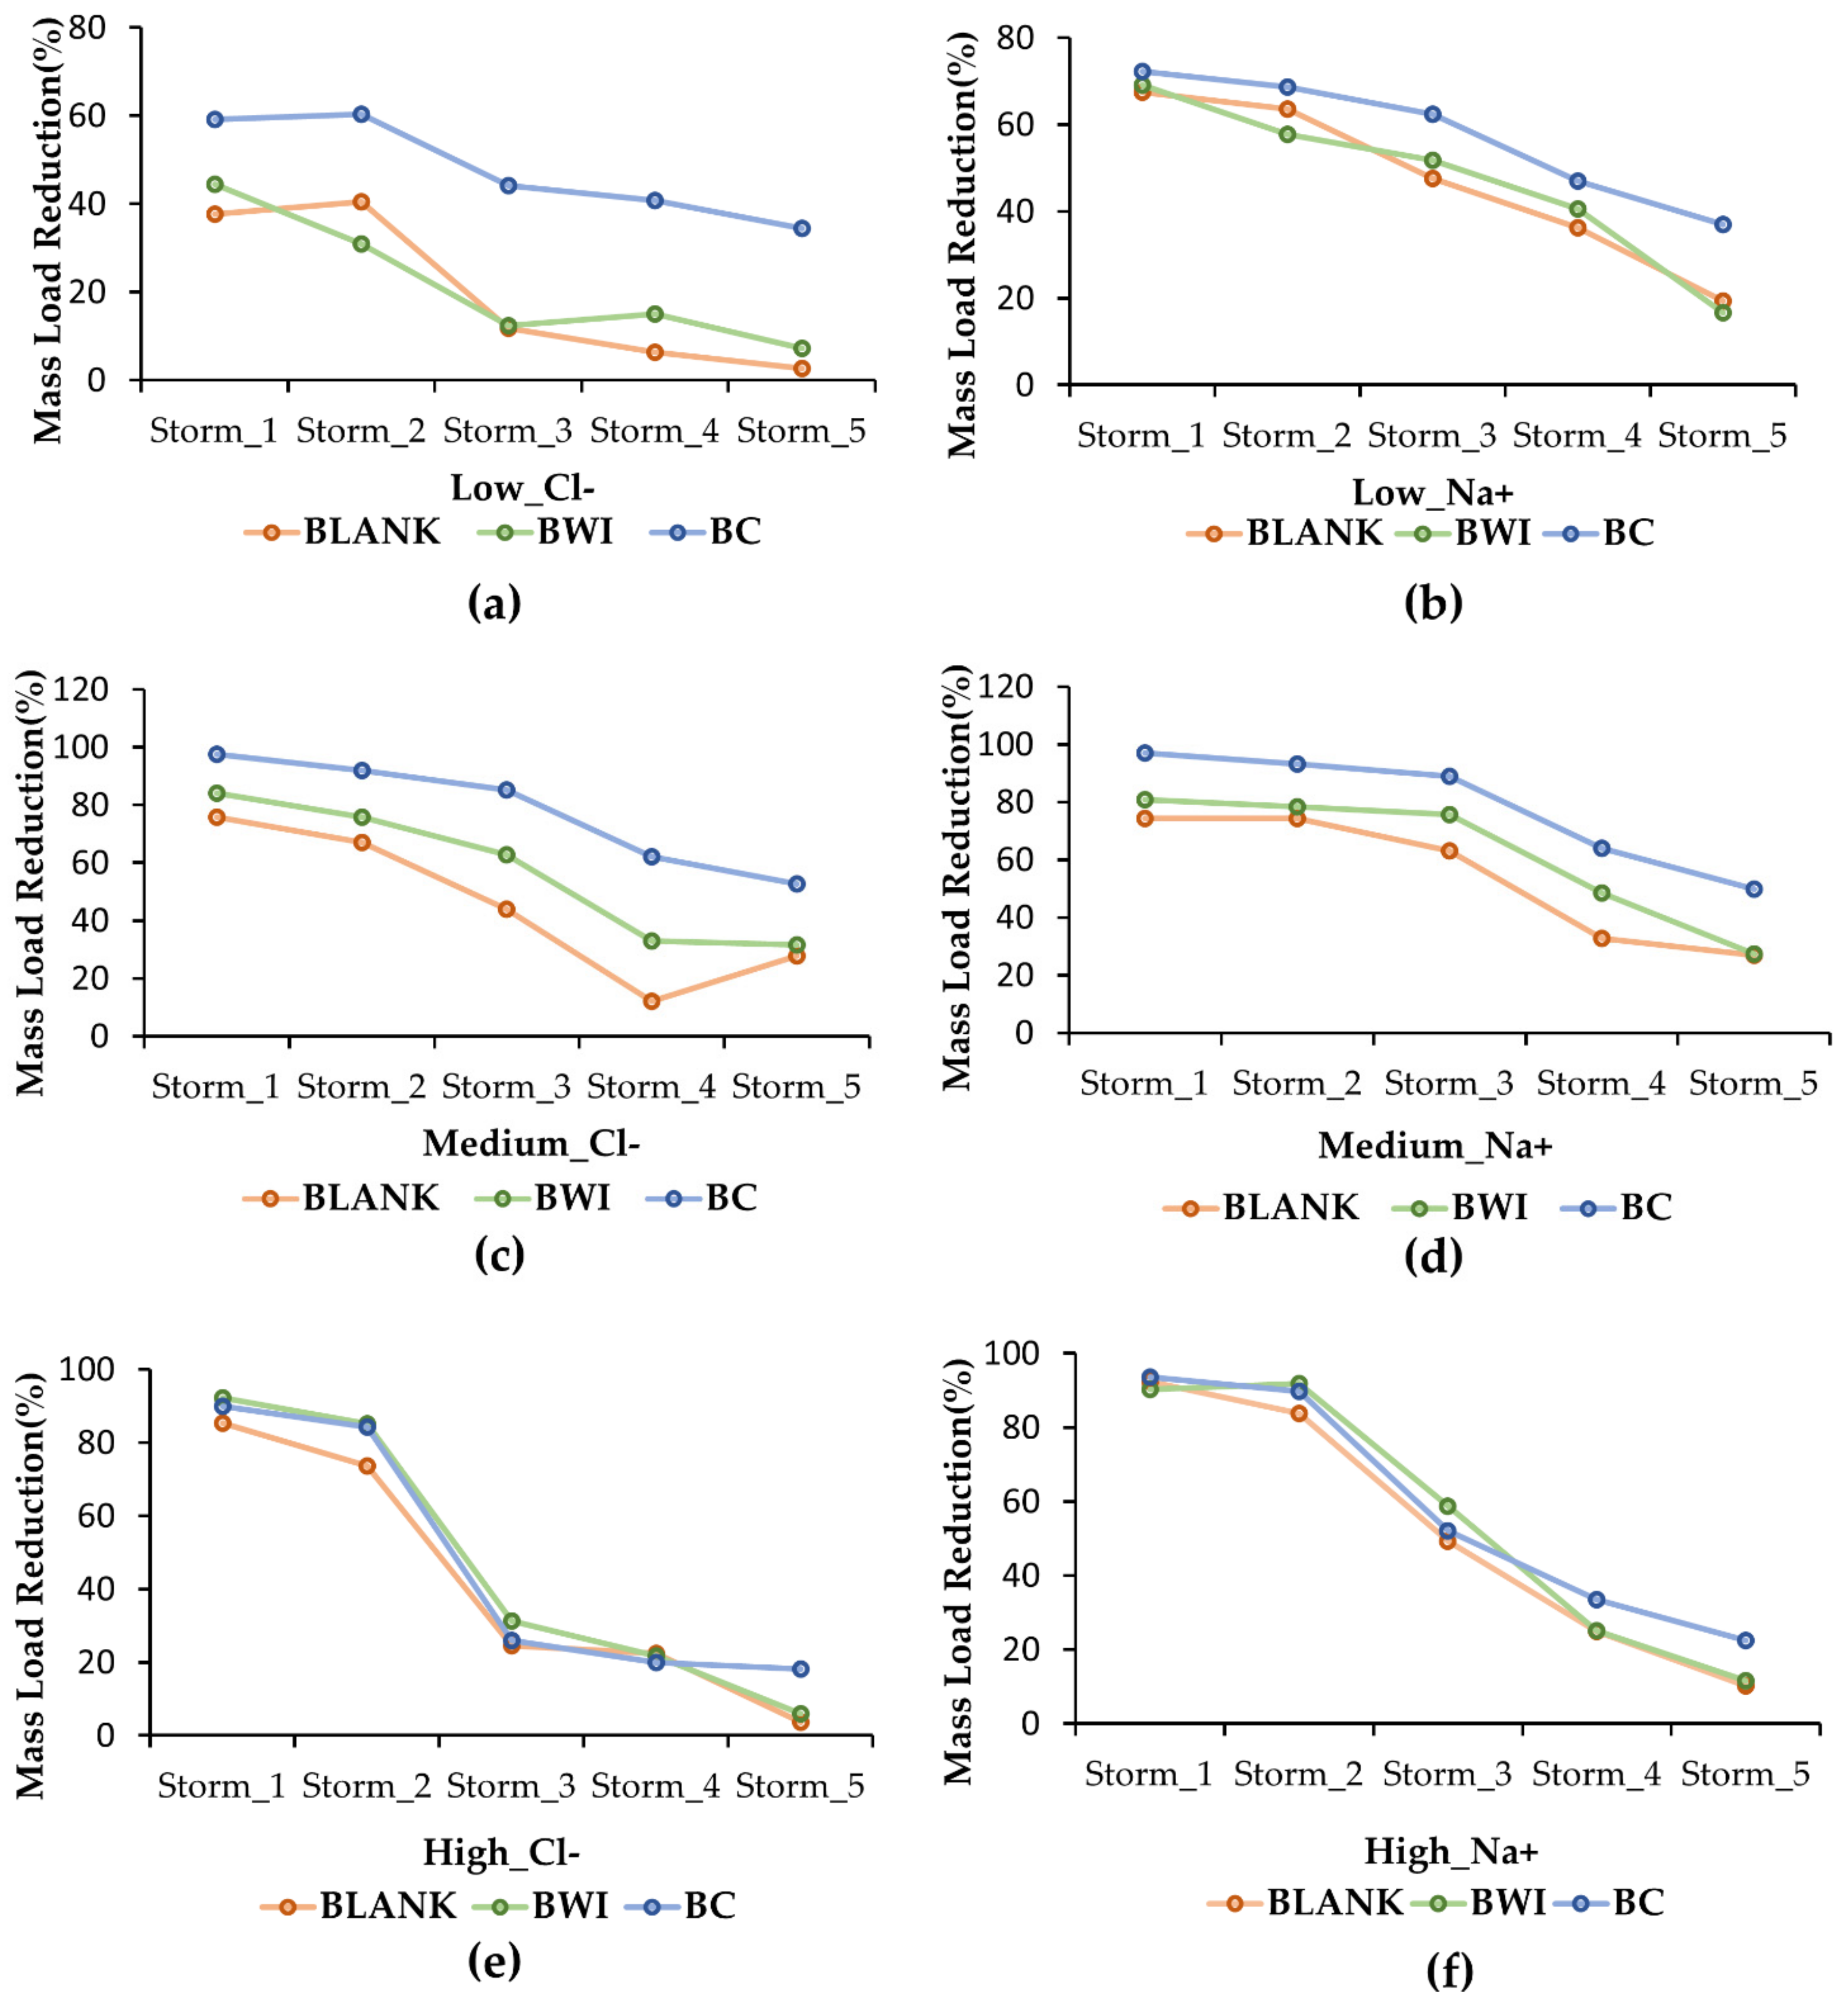
3.3. Quantity and Quality Performance in Different Stormwater Concentration Levels

Figure 8 presents flow-volume reductions for each column type and each deicing salt concentration. The volume reduction ranges from 7.9% to 21.0% for low-level deicing salt concentrations, 14.8% to 73.6% for medium-level deicing salt concentrations, and 11.6% to 31.1% for high-concentration deicing salt concentrations. For the low- and high-concentration levels, each type of column had similar volume reductions, and BC had a larger volume reduction than BWI and blank. BWI performed better than blank for each concentration level, which is consistent with the result of the overall total volume reduction above.
Figure 9 indicates the mass load reduction for Cl ranges from 11.3% to 42.5% for the low-level deicing salt concentrations, 34.5% to 71.2% for the medium-level deicing salt concentrations, and 25.7% to 30.2% for the high-concentration level. The Na+ mass load reduction ranges from 39.2% to 52.1% for the low-level deicing salt concentrations, 48.8% to 74.3% for the medium-level deicing salt concentrations, and 37.1% to 44.5% for the high-concentration level. For each influent salt concentration, BC and BWI performed better than the blank, and BC performed the best overall. It also indicates that the overall salt removal ability was the best for the medium-concentration level, and the worst for high-level salt concentrations. The mass load reductions were similar for all three types of vegetation at the high-level salt concentrations.
The mass load reduction trends for ions are shown in Figure 10 for each inflow concentration level. The water quality load reduction for both Cl and Na+ decreased over multiple synthetic storm events. The performance of BC generally was better than BWI and blank, and the ability of BR with vegetation to reduce deicing salt was always better than BR without vegetation.

4. Discussion

4.1. Using Plants in GI to Manage Deicing Salt

Vegetated columns generally performed better than non-vegetated columns for salt load and flow reduction. Relative to the blank columns, BWI increased Cl and Na+ load reductions by 4% and 3.5%, respectively, while BC increased Cl and Na+ load reductions by 7.4% and 9.2%, respectively. Overall, while both BWI and BC had higher Cl and Na+ load reductions relative to blank columns (Figure 7), only BC columns had statistically (p = 0.037) higher Cl load reduction than blank columns. However, both types of vegetation showed significant increases in Cl load reduction with medium inlet salt levels relative to blank columns (p = 0.047 for BWI and p = 0.000045 for BC). BC also had significantly (p = 0.00017) higher Cl load reduction than blank for low salt concentrations, but neither vegetation types significantly increased Cl load reduction for high inlet salt loads (Figure 9). Since plants are typically dormant in the winter when salt is applied, they likely have lower load reduction potential at that time. Vegetation may be best used to uptake residual stormwater salt in the spring, summer, and fall seasons. Salt-tolerant plants may also be used to remediate GI soils from salt build up in the warmer seasons of the year.
This experiment was conducted in a heated greenhouse (an ideal environment for vegetation) and infield vegetation performance may be different. However, the results indicate a “best case potential” for vegetation salt uptake. Future greenhouse soil column experiments should consider varying temperature to determine the effects of seasonal temperature change on plant performance. Due to limitations in the greenhouse experimental setup, infiltration of stormwater beneath the columns was not simulated in the experimental columns. Burgis et al. (2020) reported infield bioretention annual load reductions of 80% and 82% for Cl and Na+, respectively, and estimated that the majority of reduced salt in bioretention ends up in groundwater. If infiltration was simulated in the greenhouse columns, stormwater volume reduction and overall salt load reduction would be higher in all experimental scenarios. The limited improvement in Cl and Na+ reduction performance of the native BWI vegetation relative to the blank columns under the favorable greenhouse conditions of this experiment supports the conclusion of Burgis et al. (2020) that the majority of infield bioretention-reduced deicing salt ends up infiltrating into groundwater.

4.2. Performance by Plant Species and Changes in Plant Health

BWI and BC both outperformed the blank (unvegetated) columns in terms of overall salt load reduction, and the BC outperformed the BWI columns (Figure 7). The BC columns had higher stormwater volume reduction than the BWI and blank columns in all scenarios (Figure 8), implying that the BC’s salt removal mechanism is driven by elevated water volume uptake. The BC in this experiment were larger biomass plants (approximately 1.5 m tall) and known to have high water use [32]. The BWI are smaller biomass plants (approximately 0.3 m tall) and known to have medium water use. While the BWI columns displayed lower volume reduction than the BC, they typically had lower outlet Cl and Na+ concentrations than BC columns for medium and high salt events (Table 5 and Table 6). BWI is commonly used in bioretention and BC is known to be a salt-tolerant plant [28]. The results confirm that they can withstand elevated wintertime salt concentrations similar to infield levels.
Vegetation health was not directly measured in this study, but all plants survived during the 15 storm experiments. With the inflow concentration increasing to more than 1500 ppm for Cl and 500 ppm for Na+, both the BWI and BC plants were observed to have slower growth rates and displayed some visible damage. Limited plant growth under high salt concentrations may have contributed to lower salt load reduction performance of the planted columns.

4.3. Different Salt Concentrations Yield Different Removal Rates

The low-level salt inlet concentrations were similar to background levels exiting the columns. The high-level inlet salt concentrations appeared to saturate the soil and plants, as indicated by the sharp reduction in performance after the first two storms (Figure 10e,f). The highest load reduction was observed for the intermediate salt concentration level for all columns. One possible explanation for this observation is the season. These experiments were performed during the summer season, compared with the low-salt (before summer) and high-salt (after summer) inflow concentration experiments. These conditions likely led to faster growth of the plants and more transpiration, which in turn led to greater salt uptake. Another possibility is that residual salt from the medium salt concentration experiment affected the column’s salt reduction ability for the high salt concentration storms.

4.4. Salt Removal Decreased over Sequential Storms

The results on a storm-by-storm basis (Figure 10) indicate that salt reduction performance decreases with each subsequent storm and at increasing rates for the highest salt inlet concentration scenario. This observation may be due to prior salt stored in columns from previous storms exhausting the salt storage potential for later storms. The experimental columns have internal water storage capacity in soil and gravel pore space, and stored water could be flushed out by subsequent storms, releasing more salt than the first storm. These results are in agreement with field observations by Burgis et al. (2020), where bioretention was observed to initially have higher salt load reductions following the first salt application of a season and then lower reductions for subsequent runoff events as stored salty water was flushed out of the system. These data indicate that bioretention systems, with and without vegetation, have a temporary salt-holding capacity.
Na+ reductions of these three types of BR with different plant conditions were consistently higher than Cl across all experimental columns (Figure 9), suggesting cation exchange of Na+ with other soil cations (Ca2+, Mg2+, K+). Eventually, all the exchange sites will be saturated by sodium ions, and they will not be removed by that mechanism. Due to its negative charge, Cl is less reactive with soil particles that typically have a negative surface charge.

5. Conclusions

As shown in this research, BR has been confirmed to have beneficial effects on reducing deicing salt from highway stormwater runoff, and vegetation has shown potential in improving load reduction. Specific conclusions on performance in this research are summarized below:
  • The potential of vegetation to mitigate deicing salt loading in BR for all inflow salt concentration levels is BC > BWI > blank.
  • Vegetated columns reduced stormwater volume loading for all experimental salt levels in the order: BC > BWI > blank.
  • The highest salt removal of all columns was observed for the intermediate salt concentration inflow.
  • For all columns, the best salt load reduction was observed for the first storm event, with performance decreasing with repeated salt loadings.
  • Additional study is encouraged to simulate the bioretention and explore the potential of vegetation in green infrastructure to mitigate deicing salt (NaCl) under winter conditions. It is also recommended to study the mitigation of other kinds of salt ions (e.g., K+, SO42−) to water resources by green infrastructure.

Author Contributions

W.Z.: conceptualization, methodology, validation, formal analysis, investigation, writing—original draft, visualization. C.R.B.: methodology, formal analysis, investigation, writing—review and editing. G.M.H.: methodology, writing—review and editing. D.A.H.: methodology, writing—review and editing. J.A.S.: conceptualization, methodology, resources, writing—review and editing, supervision, project administration, funding acquisition. All authors have read and agreed to the published version of the manuscript.

Funding

This work was supported by the Virginia Transportation Research Council (VTRC) Project #413680, USA.

Data Availability Statement

Data presented in this study are available on request from the corresponding author.

Conflicts of Interest

The authors declare that they have no known competing financial interests or personal relationships that could have appeared to influence the work reported in this paper.

Appendix A

Figure A1. Diagram of the annual precipitation from the Washington Reagan National Airport Weather Station (nearby Lorton Road) between 2011 and 2021.
Land 11 00907 g0a1

References

  1. Dhakal, K.P.; Chevalier, L.R. Urban Stormwater Governance: The Need for a Paradigm Shift. Environ. Manag. 2016, 57, 1112–1124. [Google Scholar] [CrossRef] [PubMed]
  2. Spromberg, J.A.; Baldwin, D.H.; Damm, S.E.; McIntyre, J.K.; Huff, M.; Sloan, C.A.; Anulacion, B.F.; Davis, J.W.; Scholz, N.L. Coho Salmon Spawner Mortality in Western US Urban Watersheds: Bioinfiltration Prevents Lethal Storm Water Impacts. J. Appl. Ecol. 2016, 53, 398–407. [Google Scholar] [CrossRef] [PubMed]
  3. Walsh, C.J.; Roy, A.H.; Feminella, J.W.; Cottingham, P.D.; Groffman, P.M.; Morgan, R.P. The Urban Stream Syndrome: Current Knowledge and the Search for a Cure. J. N. Am. Benthol. Soc. 2005, 24, 706–723. [Google Scholar] [CrossRef]
  4. Ahiablame, L.M.; Engel, B.A.; Chaubey, I. Effectiveness of Low Impact Development Practices in Two Urbanized Watersheds: Retrofitting with Rain Barrel/Cistern and Porous Pavement. J. Environ. Manag. 2013, 119, 151–161. [Google Scholar] [CrossRef] [PubMed]
  5. Ureta, J.; Motallebi, M.; Scaroni, A.E.; Lovelace, S.; Ureta, J.C. Understanding the Public’s Behavior in Adopting Green Stormwater Infrastructure. Sustain. Cities Soc. 2021, 69, 102815. [Google Scholar] [CrossRef]
  6. Barbosa, A.E.; Fernandes, J.N.; David, L.M. Key Issues for Sustainable Urban Stormwater Management. Water Res. 2012, 46, 6787–6798. [Google Scholar] [CrossRef]
  7. Al Bakri, D.; Rahman, S.; Bowling, L. Sources and Management of Urban Stormwater Pollution in Rural Catchments, Australia. J. Hydrol. 2008, 356, 299–311. [Google Scholar] [CrossRef]
  8. Burgis, C.R.; Hayes, G.M.; Henderson, D.A.; Zhang, W.; Smith, J.A. Green Stormwater Infrastructure Redirects Deicing Salt from Surface Water to Groundwater. Sci. Total Environ. 2020, 729, 138736. [Google Scholar] [CrossRef]
  9. Granato, G.E.; DeSimone, L.A.; Barbaro, J.R.; Jeznach, L.C. Methods for Evaluating Potential Sources of Chloride in Surface Waters and Groundwaters of the Conterminous United States; U. S. Geological Survey: Reston, VA, USA, 2015.
  10. Hintz, W.D.; Relyea, R.A. Impacts of Road Deicing Salts on the Early-Life Growth and Development of a Stream Salmonid: Salt Type Matters. Environ. Pollut. 2017, 223, 409–415. [Google Scholar] [CrossRef]
  11. Increased Salinization of Fresh Water in the Northeastern United States|PNAS. Available online: https://www.pnas.org/doi/abs/10.1073/pnas.0506414102 (accessed on 20 May 2022).
  12. Mineral Commodity Summaries 2019; Mineral Commodity Summaries; U. S. Geological Survey: Reston, VA, USA, 2019.
  13. Corsi, S.R.; De Cicco, L.A.; Lutz, M.A.; Hirsch, R.M. River Chloride Trends in Snow-Affected Urban Watersheds: Increasing Concentrations Outpace Urban Growth Rate and Are Common among All Seasons. Sci. Total Environ. 2015, 508, 488–497. [Google Scholar] [CrossRef] [Green Version]
  14. Equiza, M.A.; Calvo-Polanco, M.; Cirelli, D.; Señorans, J.; Wartenbe, M.; Saunders, C.; Zwiazek, J.J. Long-Term Impact of Road Salt (NaCl) on Soil and Urban Trees in Edmonton, Canada. Urban For. Urban Green. 2017, 21, 16–28. [Google Scholar] [CrossRef]
  15. Robinson, H.K.; Hasenmueller, E.A.; Chambers, L.G. Soil as a Reservoir for Road Salt Retention Leading to Its Gradual Release to Groundwater. Appl. Geochem. 2017, 83, 72–85. [Google Scholar] [CrossRef]
  16. Stagge, J.H.; Davis, A.P.; Jamil, E.; Kim, H. Performance of Grass Swales for Improving Water Quality from Highway Runoff. Water Res. 2012, 46, 6731–6742. [Google Scholar] [CrossRef]
  17. Kim, H.; Kim, G. An Effectiveness Study on the Use of Different Types of LID for Water Cycle Recovery in a Small Catchment. Land 2021, 10, 1055. [Google Scholar] [CrossRef]
  18. Shafique, M. Green Stormwater Infrastructure with Low Impact Development Concept: A Review of Current Research. Desalin. Water Treat. 2017, 83, 16–29. [Google Scholar] [CrossRef] [Green Version]
  19. Davis, A.P.; Hunt, W.F.; Traver, R.G.; Clar, M. Bioretention Technology: Overview of Current Practice and Future Needs. J. Environ. Eng. 2009, 135, 109–117. [Google Scholar] [CrossRef]
  20. Hsieh, C.; Davis, A.P. Evaluation and Optimization of Bioretention Media for Treatment of Urban Storm Water Runoff. J. Environ. Eng. 2005, 131, 1521–1531. [Google Scholar] [CrossRef] [Green Version]
  21. McIntyre, J.K.; Davis, J.W.; Hinman, C.; Macneale, K.H.; Anulacion, B.F.; Scholz, N.L.; Stark, J.D. Soil Bioretention Protects Juvenile Salmon and Their Prey from the Toxic Impacts of Urban Stormwater Runoff. Chemosphere 2015, 132, 213–219. [Google Scholar] [CrossRef] [Green Version]
  22. Akan, A.O. Preliminary Design Aid for Bioretention Filters. J. Hydrol. Eng. 2013, 18, 318–323. [Google Scholar] [CrossRef]
  23. Leroy, M.; Portet-Koltalo, F.; Legras, M.; Lederf, F.; Moncond’huy, V.; Polaert, I.; Marcotte, S. Performance of Vegetated Swales for Improving Road Runoff Quality in a Moderate Traffic Urban Area. Sci. Total Environ. 2016, 566–567, 113–121. [Google Scholar] [CrossRef]
  24. Li, H. Green Infrastructure for Highway Stormwater Management: Field Investigation for Future Design, Maintenance, and Management Needs. J. Infrastruct. Syst. 2015, 21, 05015001. [Google Scholar] [CrossRef]
  25. Choi, H.; Hong, J.; Lee, S.; Kim, L.H. Assessment of Salt Resistance and Performances of LID Applicable Plants. J. Wetl. Res. 2016, 18, 201–207. [Google Scholar] [CrossRef] [Green Version]
  26. Dagenais, D.; Brisson, J.; Fletcher, T.D. The Role of Plants in Bioretention Systems; Does the Science Underpin Current Guidance? Ecol. Eng. 2018, 120, 532–545. [Google Scholar] [CrossRef]
  27. Muerdter, C.; Özkök, E.; Li, L.; Davis, A.P. Vegetation and Media Characteristics of an Effective Bioretention Cell. J. Sustain. Water Built Environ. 2016, 2, 04015008. [Google Scholar] [CrossRef]
  28. Treatment of Salted Road Runoffs Using Typha Latifolia, Spergularia Canadensis, and Atriplex Patula: A Comparison of Their Salt Removal Potential. Available online: https://www.astm.org/jai102173.html (accessed on 26 January 2022).
  29. Hayes, G.M.; Burgis, C.; Zhang, W.; Henderson, D.; Smith, J.A. Runoff Reduction by Four Green Stormwater Infrastructure Systems in a Shared Environment. J. Sustain. Water Built Environ. 2021, 7, 04021004. [Google Scholar] [CrossRef]
  30. Burgis, C.R.; Hayes, G.M.; Zhang, W.; Henderson, D.A.; Macko, S.A.; Smith, J.A. Tracking Denitrification in Green Stormwater Infrastructure with Dual Nitrate Stable Isotopes. Sci. Total Environ. 2020, 747, 141281. [Google Scholar] [CrossRef]
  31. Climate Data Online (CDO)|National Climatic Data Center (NCDC). Daily Summaries Station Details: Washington Reagan National Airport, VA, USA, Ghcnd:USW00013743. Available online: https://www.ncdc.noaa.gov/cdo-web/datasets/GHCND/stations/GHCND:USW00013743/detail (accessed on 8 June 2022).
  32. Klink, A.; Polechońska, L.; Cegłowska, A.; Stankiewicz, A. Typha Latifolia (Broadleaf Cattail) as Bioindicator of Different Types of Pollution in Aquatic Ecosystems—Application of Self-Organizing Feature Map (Neural Network). Environ. Sci. Pollut. Res. 2016, 23, 14078–14086. [Google Scholar] [CrossRef]
Figure 1. Lorton Road bioretention research site and positioning: (a) Map of the analyzed bioretention location (created with ArcGIS). (b) Aerial image of bioretention with piped/culvert flow represented by blue arrows, surface flow represented by solid white arrows, and perforated underdrain represented by dotted lines (images by authors).
Land 11 00907 g001
Figure 2. Bioretention basin design schematic (created with Microsoft PowerPoint).
Land 11 00907 g002
Figure 3. Engineered soil media column schematic in laboratory (created with Microsoft PowerPoint).
Land 11 00907 g003
Figure 4. Six soil columns in laboratory.
Land 11 00907 g004
Figure 5. Concentration of sodium and chloride ions in tap water for all columns prior to the introduction of plants (blank: no plants; BWI: Blue Wild Indigo; BC: Broadleaf Cattail).
Land 11 00907 g005
Figure 6. Mean volume reduction for all storm events and salt concentration for each column type. Error bars indicate standard error of duplicate measurements (blank: no plants; BWI: Blue Wild Indigo; BC: Broadleaf Cattail).
Land 11 00907 g006
Figure 7. Mean mass load reduction for all storm events and salt concentrations for each column type. Error bars indicate standard error of duplicate measurements (blank: no plants; BWI: Blue Wild Indigo; BC: Broadleaf Cattail).
Land 11 00907 g007
Figure 8. Volume reduction for different levels of deicing salt inflow concentration (blank: no plants; BWI: Blue Wild Indigo; BC: Broadleaf Cattail).
Land 11 00907 g008
Figure 9. Mass load reduction for different inflow salt concentrations (blank: no plants; BWI: Blue Wild Indigo; BC: Broadleaf Cattail).
Land 11 00907 g009
Figure 10. Mass load reduction trends for chloride and sodium ions for each of five storms. The flow volumes for each storm are given in Table 2 and are based on loadings observed at the Lorton Road BR field site (blank: no plants; BWI: Blue Wild Indigo; BC: Broadleaf Cattail). (af) depict different Cl or Na+ concentrations.
Land 11 00907 g010
Table 1. Design specifications and other characteristics for monitored BR (CDA: contributing drainage area; ESM: engineered soil media).
CDA (m2)Impervious%Footprint (m2)Engineered
Storage (m3)
InflowTypeOutflow TypeSubsurface Layers
(Surface → Down)
Mulch Depth (cm)Engineered Soil
Depth (cm)
Underlying Gravel
Depth (cm)
Vegetation
curb and gutter sewer10.2 cm diameter underdrain + bypass channel15.2 cm ponding with mulch and vegetation, 76.2 cm ESM (3.2% clay, 5.6% silt, 91.2% sand), 10.2 cm VDOT #8 stone (+ underdrain), 30.5 cm VDOT #57 stone Blue Wild Indigo
Marsh Marigold
47,753351012447576.240.7Fox Sedge
Buttonbush
Winterberry
Sweetbay
Rough Avens
Cardinal flower
Table 2. Bioretention (BR) field rain and flow information of five representative monitored storm events.
Storm No.Rain Depth (cm)Duration Time (h)Area of BR Basin (m2)Inflow Volume to BR Basin (L)Area of Each Soil Column (m2)Proportional Inflow Volume for Each Soil Column (L)
10.743.3 78,101.0 16.6
21.014.3 57,532.7 12.2
32.296.0862.4214,782.20.18345.6
41.915.5 307,237.3 65.2
52.448.7 261,833.0 55.6
Table 3. Design specifications and other characteristics for synthetic storm events (CIn: concentration of inflow).
Deicing Salt Concentration Level (ppm)Storm No.Duration Time (h)Inflow Volume (L)Inflow Cl Concentration (ppm)Inflow Na+ Concentration (ppm)
13.316.634.126.0
24.312.231.523.3
Low36.045.633.026.1
(0 < CIn < 40)45.565.233.120.1
58.755.633.222.7
13.316.6149.576.2
24.312.2183.593.2
Medium36.045.6167.984.2
(40 < CIn < 200)45.565.2134.049.6
58.755.6135.453.3
13.316.61545.8689.7
24.312.21863.6697.7
High36.045.61698.6627.0
(500 < CIn < 2000)45.565.21906.5668.8
58.755.61744.8561.8
Table 4. Inflow and outflow characteristics for low-level deicing salt concentration of synthetic stormwater runoff (Blank: no plants; BWI: Blue Wild Indigo; BC: Broadleaf Cattail).
Inflow (L)Inflow Concentration (mg/L)Inflow Mass (mg)ColumnOutflow (L)OUT_ Cl Concentration (mg/L)OUT_ Cl Mass (mg)OUT_ Na+ Concentration (mg/L)OUT_ Na+ Mass (mg)
ClClBlank 115.623.13609.3145
34.1566Blank 215.622.13458.8137
BWI 114.222.03129.4133
16.6Na+Na+BWI 214.621.73179.2134
26.0432BC 114.014.52038.6120
BC 214.018.52598.5119
ClClBlank 19.424.322811.1104
31.5384Blank 29.823.523010.6104
BWI 110.625.426911.5122
12.2Na+Na+BWI 211.023.826210.9120
23.3284BC 18.215.012310.384
BC 29.419.41829.993
ClClBlank 141.532.0132816.0664
33.01505Blank 242.930.9132613.6583
BWI 143.132.4139613.9599
45.6Na+Na+BWI 239.931.2124513.8551
26.11190BC 135.819.770511.7419
BC 238.025.797712.6479
ClClBlank 160.533.9205116.1974
33.12158Blank 260.333.0199011.6699
BWI 149.234.8171214.2699
65.2Na+Na+BWI 256.234.8195615.3860
20.11311BC 150.723.8120714.8750
BC 248.427.8134613.2639
ClClBlank 151.834.7179720.81077
33.21846Blank 252.034.6179918.4957
BWI 146.135.6164122.91056
55.6Na+Na+BWI 249.735.9178421.11049
22.71262BC 143.924.0105417.7777
BC 246.029.7136617.7814
Table 5. Inflow and outflow water characteristics for medium-level deicing salt concentration of synthetic stormwater runoff (Blank: no plants; BWI: Blue Wild Indigo; BC: Broadleaf Cattail).
Inflow (L)Inflow Concentration (mg/L)Inflow Mass (mg)ColumnOutflow (L)OUT_ Cl Concentration (mg/L)OUT_ Cl Mass (mg)OUT_ Na+ Concentration (mg/L)OUT_ Na+ Mass (mg)
ClClBlank 113.045.258824.2315
149.52482Blank 213.944.662024.0334
BWI 19.145.241129.4268
16.6Na+Na+BWI 29.440.538122.8214
76.21265BC 13.036.911124.674
BC 20.175.1828.63
ClClBlank 110.372.474629.1300
183.52239Blank 210.569.773227.3287
BWI 18.265.753930.0246
12.2Na+Na+BWI 29.856.054925.1246
93.21137BC 11.560.99124.336
BC 24.165.927029.4121
ClClBlank 137.2112.9420037.71402
167.97656Blank 237.6116.7438838.01429
BWI 123.0111.1255537.6865
45.6Na+Na+BWI 227.2115.7314737.11009
84.23840BC 16.8137.493447.7324
BC 28.2163.8134363.1517
ClClBlank 157.5133.7768836.82116
133.98730Blank 257.6133.4768438.82235
BWI 141.8141.4591139.71659
65.2Na+Na+BWI 241.4139.7578440.41673
49.63234BC 119.0158.1300460.71153
BC 222.0164.9362853.71181
ClClBlank 147.1108.5511043.92068
135.47528Blank 247.8120.8577447.32261
BWI 144.7117.3524351.82315
55.6Na+Na+BWI 243.6116.2506645.71993
53.32963BC 120.1192.0385978.61580
BC 218.3178.3326376.51400
Table 6. Inflow and outflow water characteristics for high-level deicing salt concentration of synthetic stormwater runoff (Blank: no plants; BWI: Blue Wild Indigo; BC: Broadleaf Cattail).
Inflow (L)Inflow Concentration (mg/L)Inflow Mass (mg)ColumnOutflow (L)OUT_ Cl Concentration (mg/L)OUT_ Cl Mass (mg)OUT_ Na+ Concentration (mg/L)OUT_ Na+ Mass (mg)
ClClBlank 115.1229.1345953.4806
1545.825,660Blank 215.6260.8406860.1938
BWI 111.4141.8161740.4461
16.6Na+Na+BWI 213.9171.72387128.01779
689.711,449BC 19.0256.8231175.1676
BC 29.5296.1281383.4792
ClClBlank 111.4516.35886112.31280
1863.622,736Blank 210.7571.56115139.91497
BWI 110.6288.3305659.3629
12.2Na+Na+BWI 210.6346.7367572.3766
697.78512BC 15.8494.42868118.3686
BC 27.4579.34287145.01073
ClClBlank 140.11458.058,466362.314,528
1698.677,456Blank 240.51440.858,352358.414,515
BWI 136.91389.151,258292.910,808
45.6Na+Na+BWI 238.11446.155,096334.212,733
627.028,591BC 135.31682.359,385410.814,501
BC 231.11780.955,386416.512,953
ClClBlank 153.81939.2104,329704.537,902
1906.5124,304Blank 254.21632.588,482508.927,582
BWI 152.51917.3100,658615.532,314
65.2Na+Na+BWI 252.11803.093,936633.933,026
668.843,606BC 142.72314.698,833682.029,121
BC 243.32317.2100,335666.728,868
ClClBlank 150.91836.493,473562.528,631
1744.897,011Blank 253.01763.193,444519.927,555
BWI 151.21763.990,312531.427,208
55.6Na+Na+BWI 250.11838.492,104560.728,091
561.831,236BC 142.91876.980,519568.524,389
BC 242.11855.278,104570.324,010
Publisher’s Note: MDPI stays neutral with regard to jurisdictional claims in published maps and institutional affiliations.

