Article

Conflict or Coordination? Analysis of Spatio-Temporal Coupling Relationship between Urbanization and Eco-Efficiency: A Case Study of Urban Agglomerations in the Yellow River Basin, China

1
School of Land Science and Technology, China University of Geosciences, Beijing 100083, China
2
Institute of Geographic Sciences and Natural Resources Research, Chinese Academy of Sciences, Beijing 100101, China
3
University of Chinese Academy of Sciences, Beijing 100149, China
*
Author to whom correspondence should be addressed.
Land 2022, 11(6), 882; https://doi.org/10.3390/land11060882
Submission received: 23 April 2022 / Revised: 28 May 2022 / Accepted: 31 May 2022 / Published: 10 June 2022

Abstract

:
The coordination and coupling of new urbanization and the ecological environment is of great significance for the high-quality development of the Yellow River basin, China. In this paper, the urbanization efficiency and ecological efficiency of seven urban agglomerations in the Yellow River basin, China, from 2006 to 2019 are calculated at the city level. Spatial correlation analysis between urbanization efficiency and ecological efficiency is carried out by applying the spatial association model. Then, the spatio-temporal coupling relationship is estimated based on the relative development and spatial coupling models. The results show that urbanization efficiency has been rising, from 0.83 in 2006 to 0.91 in 2019. Ecological efficiency first stabilized and then rose from 1.03 in 2006 to 1.23 in 2019. Spatially, cities with high urbanization efficiency development are increasing from west to east. Cities with high eco-efficient developments are increasing from northwest to southeast. The coupling relationship between the two is an N-type relationship, with the trend of first rising, then falling, and then rising. Spatially, the coupling degree of the upper and lower reaches of the Yellow River basin, China, is higher than that of the middle reaches of the Yellow River basin, China. Finally, this paper puts forward policy recommendations on the coordinated and coupling development of urban agglomerations in the Yellow River basin, China, from the perspective of the future differentiated development of different urban agglomerations.

1. Introduction

Rapid urbanization has become an almost global phenomenon in recent decades [1]. The rapid expansion of cities has brought about economic and social changes, such as rapid population growth and infrastructure development [2], as well as ecological and environmental issues such as global warming, air pollution, and biodiversity loss [3]. As the world’s largest developing country, China’s urbanization rate rose from 17.92% in 1978 to 59.58% in 2018 [4]. Urbanization is one of the main drivers of China’s rapid economic and social development and plays a vital role in improving national competitiveness [5]. However, urbanization occupies a large amount of natural land [6,7] and has had a series of negative impacts on the ecological environment [8,9,10], not only restricting the sustainable development of China’s economy and society, but also bringing huge ecological security pressures [11].
The Yellow River basin, China, is an important ecological barrier, food base, and economic zone in China, and has an extremely important strategic position [12]. Due to the density of cities, large populations, and fragile ecological environments, the impact of urbanization processes on their ecological environments is particularly significant [13,14,15]. In September 2019, Xi Jinping pointed out that the ecological protection and high-quality development of the Yellow River basin, China, is a major national strategic need in the new era, clarifying the important position of the Yellow River basin, China, in ecological security, and that it is urgent to achieve the coordinated development of urbanization and ecological security, thereby promoting the high-quality development of the Yellow River basin, China [16]. Therefore, it is of great significance to analyze and explore the relationship between urbanization and ecological security, and to clarify its interaction.
As an important measure of the high-quality development of urbanization, urbanization efficiency has attracted more and more attention from the academic community. There is no unified definition of urbanization efficiency in foreign academic circles, but through existing research, urbanization is a complex “input-output” system process, and its efficiency is widely measured by comparing output or benefits obtained with input resources. If an efficient urbanization process costs fewer resources and generates more benefits, then the process is recognized [17]. Scholars have conducted research on urbanization efficiency in the past, where they successively explored the efficiency of urban [18], district, and county development efficiency and urban industrial efficiency [19], and studied the efficiency measurement methods and models [20]. Relevant studies show two characteristics: on the one hand, keywords such as resource consumption, carbon emissions, and ecosystems [21,22] are always closely related to urbanization and development efficiency; on the other hand, Data Envelopment Analysis (DEA) remains one of the main measurement methods [23,24].
Ecological efficiency is currently the closest measurement index to the core concept of China’s ecological civilization construction, and its meaning lies in the total amount of various economic outputs under the premise of consuming or occupying a certain amount of ecological and environmental resources, which can also be interpreted as the calculation of the degree of ecological environmental damage under the premise of a certain amount of economic output. Ecological efficiency is currently defined in accordance with the current international organizations and sectors related to ecology [25,26], and it can be concluded that, on the one hand, its index value focuses on minimizing the damage to the ecological environment in development, while on the other hand, it pays more attention to the pursuit of a better proportion of economic output and ecological input. In the field of ecological efficiency research, life cycle assessment and DEA analysis have a wide research area, and the latest research results are reflected in the material metabolism of urbanization [27], carbon emissions in the transportation industry [28], energy consumption and relaxation variable measurement model evaluation [29,30,31], and other fields. In order to better realize the coordinated development of urbanization and the ecological environment, many scholars have studied the coupling relationship between subsystems or elements of urbanization and the ecological environment. From the perspective of research themes, the main ones are: first, the negative impact of urbanization on the ecological environment [32]; second, the positive impact of urbanization on the ecological environment; third, the characteristics of the phased impact of urbanization on the ecological environment. Grossman and Krueger [33] demonstrate the existence of an inverted “U” relationship between urbanization and ecology through the empirical analysis of urbanization and the ecological environment, known as the famous environmental Kuznets curve (EKC); finally, the fourth is to study the interaction between urbanization and the ecological environment. Wang et al. [34] uses the coupling coordination model to explore the many environmental problems caused by the high energy consumption, high pollution, and high emission economic model of the Beijing-Tianjin-Hebei urban agglomeration.
According to previous studies, the methods for measuring urbanization efficiency and ecological efficiency can be divided into parametric methods and non-parametric methods. Parametric methods require pre-estimated assumptions about the relationship between inputs and outputs, and stochastic boundary analysis (SFA) models are representative. Nonparametric methods have no requirements for a priori assumptions about the relationship between input and output, so they are considered to avoid any possible problems caused by incorrect pre-estimated assumptions [35]. There are several nonparametric methods, such as the Data Envelopment Analysis (DEA) model and the Free Disposal Hull (FDH) model [36]. Of these, DEA was the most widely adopted, originally proposed by Charnes et al. [37]. In the application of DEA, a set of input-output indicators has been used [38]. This method has been applied to study the efficiency of regional urbanization development. Other scholars have adopted the DEA methodology to assess the ecological efficiency of cities. Bai et al. [39] use the ultra-efficient DEA model to measure the relationship between urbanization and urban ecological efficiency in China from 2006 to 2013 using the input factors of labor, capital, land, and resource consumption and the output factor of economic level. Their study shows that in the process of urbanization, the urban ecological efficiency of China’s prefecture-level cities has undergone three stages of evolution, namely, increase, decline, and increase. The quantification of the coupling of urbanization efficiency and ecological efficiency is essential to achieve sustainable and healthy forms of urbanization. Coupling is a phenomenon in which two or more indicators interact with each other through various interactions, originating in the field of physics [40]. Commonly used technical means are coupled coordination degree models, impulse responses, dynamic econometric analysis methods for variance decomposition, Granger causal testing, system dynamics, geography 3S techniques, etc. [41]. This technology has been widely used in the field of climate change, and although it is a usable technique for such analysis [42], it is rarely used to study the relationship between urbanization and the ecological environment. Given that the environmental problems associated with urban sprawl are most pronounced in rapidly developing urban areas, this prompts scholars to try to make more elaborate analyses at the level of urban agglomerations. The urban agglomeration of the Yellow River basin, China, is a representative of a rapidly developing urban agglomeration, so it was selected as a research area to explore the spatio-temporal coupling relationship between urbanization efficiency and ecological efficiency. Using the physical coupling model, we have developed a coupling coordination degree model, which will allow us to expand the existing research understanding of the relationship between urbanization and the ecological environment and provide the possibility for analyzing the spatio-temporal coupling process between urbanization and the ecological environment in the context of high economic growth.
Summarizing the existing research findings, there are still the following deficiencies in the existing research on the relationship between urbanization and the ecological environment. (1) From the perspective of research objects, most are based on the national [43] or provincial scale [44] and have begun to expand to urban agglomerations in recent years for the Beijing-Tianjin-Hebei [45], the Yangtze River Economic Belt [46], and the Guangdong-Hong Kong-Macao Greater Bay Area [47]. Other major strategic areas of China’s regional development are involved, but the research on the Yellow River basin, China, a special geographical economic zone that carries the “major national strategy for ecological protection and high-quality development of the Yellow River basin, China”, is relatively insufficient. (2) Most existing empirical studies are based on qualitative portrayal [48], and while the mechanism of interpretation of its influence from the perspective of spatio-temporal coupling is very limited, the coupling relationship between the two is an important embodiment of the relationship between urbanization development and regional ecological efficiency. Based on this, this paper takes seven urban agglomerations in the Yellow River basin, China, as the research objects, measures their urbanization efficiency and ecological efficiency from the urban scale, and then studies the spatio-temporal coupling relationship to provide scientific criteria and policy suggestions for promoting the coordinated development of regional urbanization and ecological environment.
In the rest of this paper, we give a brief overview of the study area in Section 2. Then, we describe the methodology used in this article and the sources of the data in Section 3. We analyze the evaluation results of urbanization efficiency and ecological efficiency in the Yellow River basin, China, the spatial correlation pattern, and the coupling relationship between the two in Section 4. Then, we discuss this study from multiple perspectives in Section 5. Finally, we provide the conclusion of this paper in Section 6.

2. Study Area

The Yellow River originates from the Bayankara Mountains of the Qinghai-Tibet Plateau and flows through nine provinces and regions, including Qinghai, Sichuan, Gansu, Ningxia, Inner Mongolia, Shanxi, Shaanxi, Henan, and Shandong, with a basin area accounting for about 8.28% of the country’s area. Since the different urban agglomerations in the Yellow River basin, China, have a slight overlap in urban composition, and considering the serious lack of data in individual county-level cities and ethnic minority autonomous prefectures in some urban agglomerations, 60 cities in 7 urban agglomerations (Figure 1) were selected as samples for urban agglomeration composition, and data collection and research were carried out on this basis.

3. Methods and Data

3.1. Data Envelopment Analysis Model

In order to scientifically evaluate the urbanization efficiency and ecological efficiency of cities in the Yellow River basin’s urban agglomeration, the research method adopted in this paper is to construct an index system for evaluating urbanization efficiency and ecological efficiency, and to measure it by using DEA.
The Data Envelopment Analysis model’s principle is to generate the optimal input-output combination through optimization ideas, that is, to produce the largest output with the smallest input, and most of these input-output decision units form the DEA optimal production frontier. Each set of input-output indicators form a decision unit. When these decision units enter the DEA model for operation, it is projected onto the optimal production front surface, and its efficiency value is evaluated by measuring the distance of the decision unit to the optimal production front surface, that is, when the decision unit is closer to the optimal decision unit surface, its efficiency value is relatively high; if the decision unit deviates from the DEA optimal front, the lower the efficiency value.
The super-efficient DEA model based on the CCR model is, specifically:
{ m i n [ θ ε ( j = 1 m S + j = 1 m S + ) ] = ν d ( ε ) j = 1 n x j λ j + S = θ x j 0 j = 1 n y j λ j S + = y j 0 S + 0 , S 0 , λ j 0
wherein there are n decision units in the model, the input variable of type m is x j , the output variable of type S is y j , the efficiency value of each decision unit is θ , S and S + are the relaxation variables represented, and the ε represent non-Archimedesian infinitesimals. When θ = 1, S = 0 and S + = 0, it means that the decision unit is DEA valid; when θ = 1, S ≠ 0 or S + ≠ 0, it means that the decision unit is weak DEA effective; when θ < 1, it means that the decision unit is non-DEA effective; when θ > 1, it means that the decision unit exceeds the optimal efficiency.

3.2. Spatial Association Model

In this study, a spatial correlation model was introduced to analyze the urbanization efficiency and ecological efficiency of cities in the Yellow River basin’s urban agglomeration, and the Moran’s I index was selected to analyze the urbanization efficiency and ecological efficiency of this paper. The specific formula and meaning are as follows:
(1)
Global Moran’s I Index
I ( d ) = i = 1 n j = 1 n ( X i X ) ( X j X ) S 2 i = 1 n j = 1 n W i j S 2 = i = 1 n ( X i X ) 2 / n
wherein the value of I(d) indicates the degree of spatial correlation between the two regions. When I(d) > 0, it indicates that the efficiency of the two regions shows a high degree of convergence in space and shows a positive correlation development trend, that is, when the efficiency of one region increases or decreases, the other region also increases or decreases; when I(d) < 0, it means that the efficiency of the two regions is significantly different in space, and there is a negative correlation relationship, that is, when the efficiency value of one region increases or decreases, the other region develops in reverse. Xi represents the efficiency value within region i, and Xj represents the efficiency value within region j.
(2)
Local Moran’s I Index
When the global Moran’s I index determines whether there is spatial agglomeration or an abnormal phenomenon between regions, we use the local Moran’s I index to determine the location of local aggregation or abnormal occurrence, which can further measure and characterize the degree of aggregation in the area and the surrounding area. The formula is as follows:
I i = Z i j = 1 n W i j Z j
where the Moran’s I Z value usually indicates the significance of the variable in the region. If the absolute value of Z is greater than 1.96, it indicates that the variable in the region has passed the significance test, and the sign of the Z value indicates its positive and negative correlation; if the absolute value of the Z value is less than 1.96, it indicates that the variable has not passed the significance test. By further analysis, when the regional variable passes the significance test and the Z value is positive, it indicates that the region and its surrounding area show high or low aggregation, and the degree of aggregation is high, showing a positive correlation relationship; if the Z value is negative, it indicates that the region and its surrounding area show high-low aggregation or low-high aggregation, showing a negative correlation relationship.

3.3. Relative Development and Spatial Coupling Model

In order to measure the relative development of urbanization efficiency and ecological efficiency, this study uses the ratio of urbanization efficiency and ecological efficiency to analyze the relative development degree. When the relative degree of development is greater than 1, it indicates that the urbanization efficiency of the region is ahead of its ecological efficiency, and priority should be given to improving the ecological efficiency; when the relative development degree is less than 1, it indicates that the urbanization efficiency of the region lags behind its ecological efficiency, and priority should be given to improving the efficiency of urbanization; similarly, when the relative degree of development is equal to 1, it indicates that the urbanization efficiency of the region is developed simultaneously with its ecological efficiency, and the regional development is sustainable.
In order to express the degree of spatial convergence of regional urbanization efficiency and ecological efficiency, the spatial coupling degree model between urbanization efficiency and ecological efficiency constructed in this paper is as follows:
C = E 1 × E 2 [ 1 2 × ( E 1 2 + E 2 2 ) ] 1 2
In the formula, E 1 and E 2 respectively indicate the urbanization efficiency and ecological efficiency of the region; the C value indicates the spatial coupling degree, and is between 0 and 1; when C is closer to 0, it indicates that the coupling degree of urbanization efficiency and ecological efficiency in the region is extremely low, that is, the development of urbanization efficiency and ecological efficiency in the region is unbalanced, and the correlation is very poor; when C tends to 1, it indicates that the coupling degree of urbanization efficiency and ecological efficiency in the region is high, that is, the urbanization efficiency and ecological efficiency development in the region are balanced, and the region achieves sustainable development.

3.4. Data

In order to measure the efficiency of urbanization, this paper constructs an evaluation index system for urbanization efficiency (Table 1). The indicator system contains four input indicators, namely, the built-up area, the total investment in fixed assets, the financial expenditure, and the non-agricultural population, of which the composition of the input index covers the land elements represented by the built-up area, the economic factors represented by the total fixed-asset investment and fiscal expenditure, and the labor factors represented by the non-agricultural population; at the same time, the indicator system contains two output indicators, which are the total value of the secondary and tertiary industries and the total retail sales of social consumer goods, representing the scale of the urban economy and the level of social consumption, respectively.
At the same time, to measure the ecological efficiency of cities, this paper constructs an ecological efficiency evaluation index system (Table 1). The indicator system contains five input indicators, namely the total investment in fixed assets, the total number of employed persons, the total amount of water supply, the land area of the administrative region, and the electricity consumption of the city, of which the composition of the input indicators covers the capital elements represented by the total investment in fixed assets, the labor factors represented by the total number of employed personnel, and the resource elements represented by the total amount of water supply, the land area of the administrative region, and the urban electricity consumption; at the same time, the indicator system contains four output indicators, which are the regional GDP and sewage discharge. Exhaust gas emissions and soot emissions represent the scale of the city’s economy and the level of ecological benefits, respectively.
The data used in the paper to calculate the urbanization efficiency and ecological efficiency of 60 cities in the Yellow River basin’s urban agglomeration from 2006 to 2019 (Table 2) are mainly from the 2015–2020 China Statistical Yearbook, China Urban Statistical Yearbook, China Urban Construction Statistical Yearbook, and statistical bulletins of related regions.

4. Results and Analysis

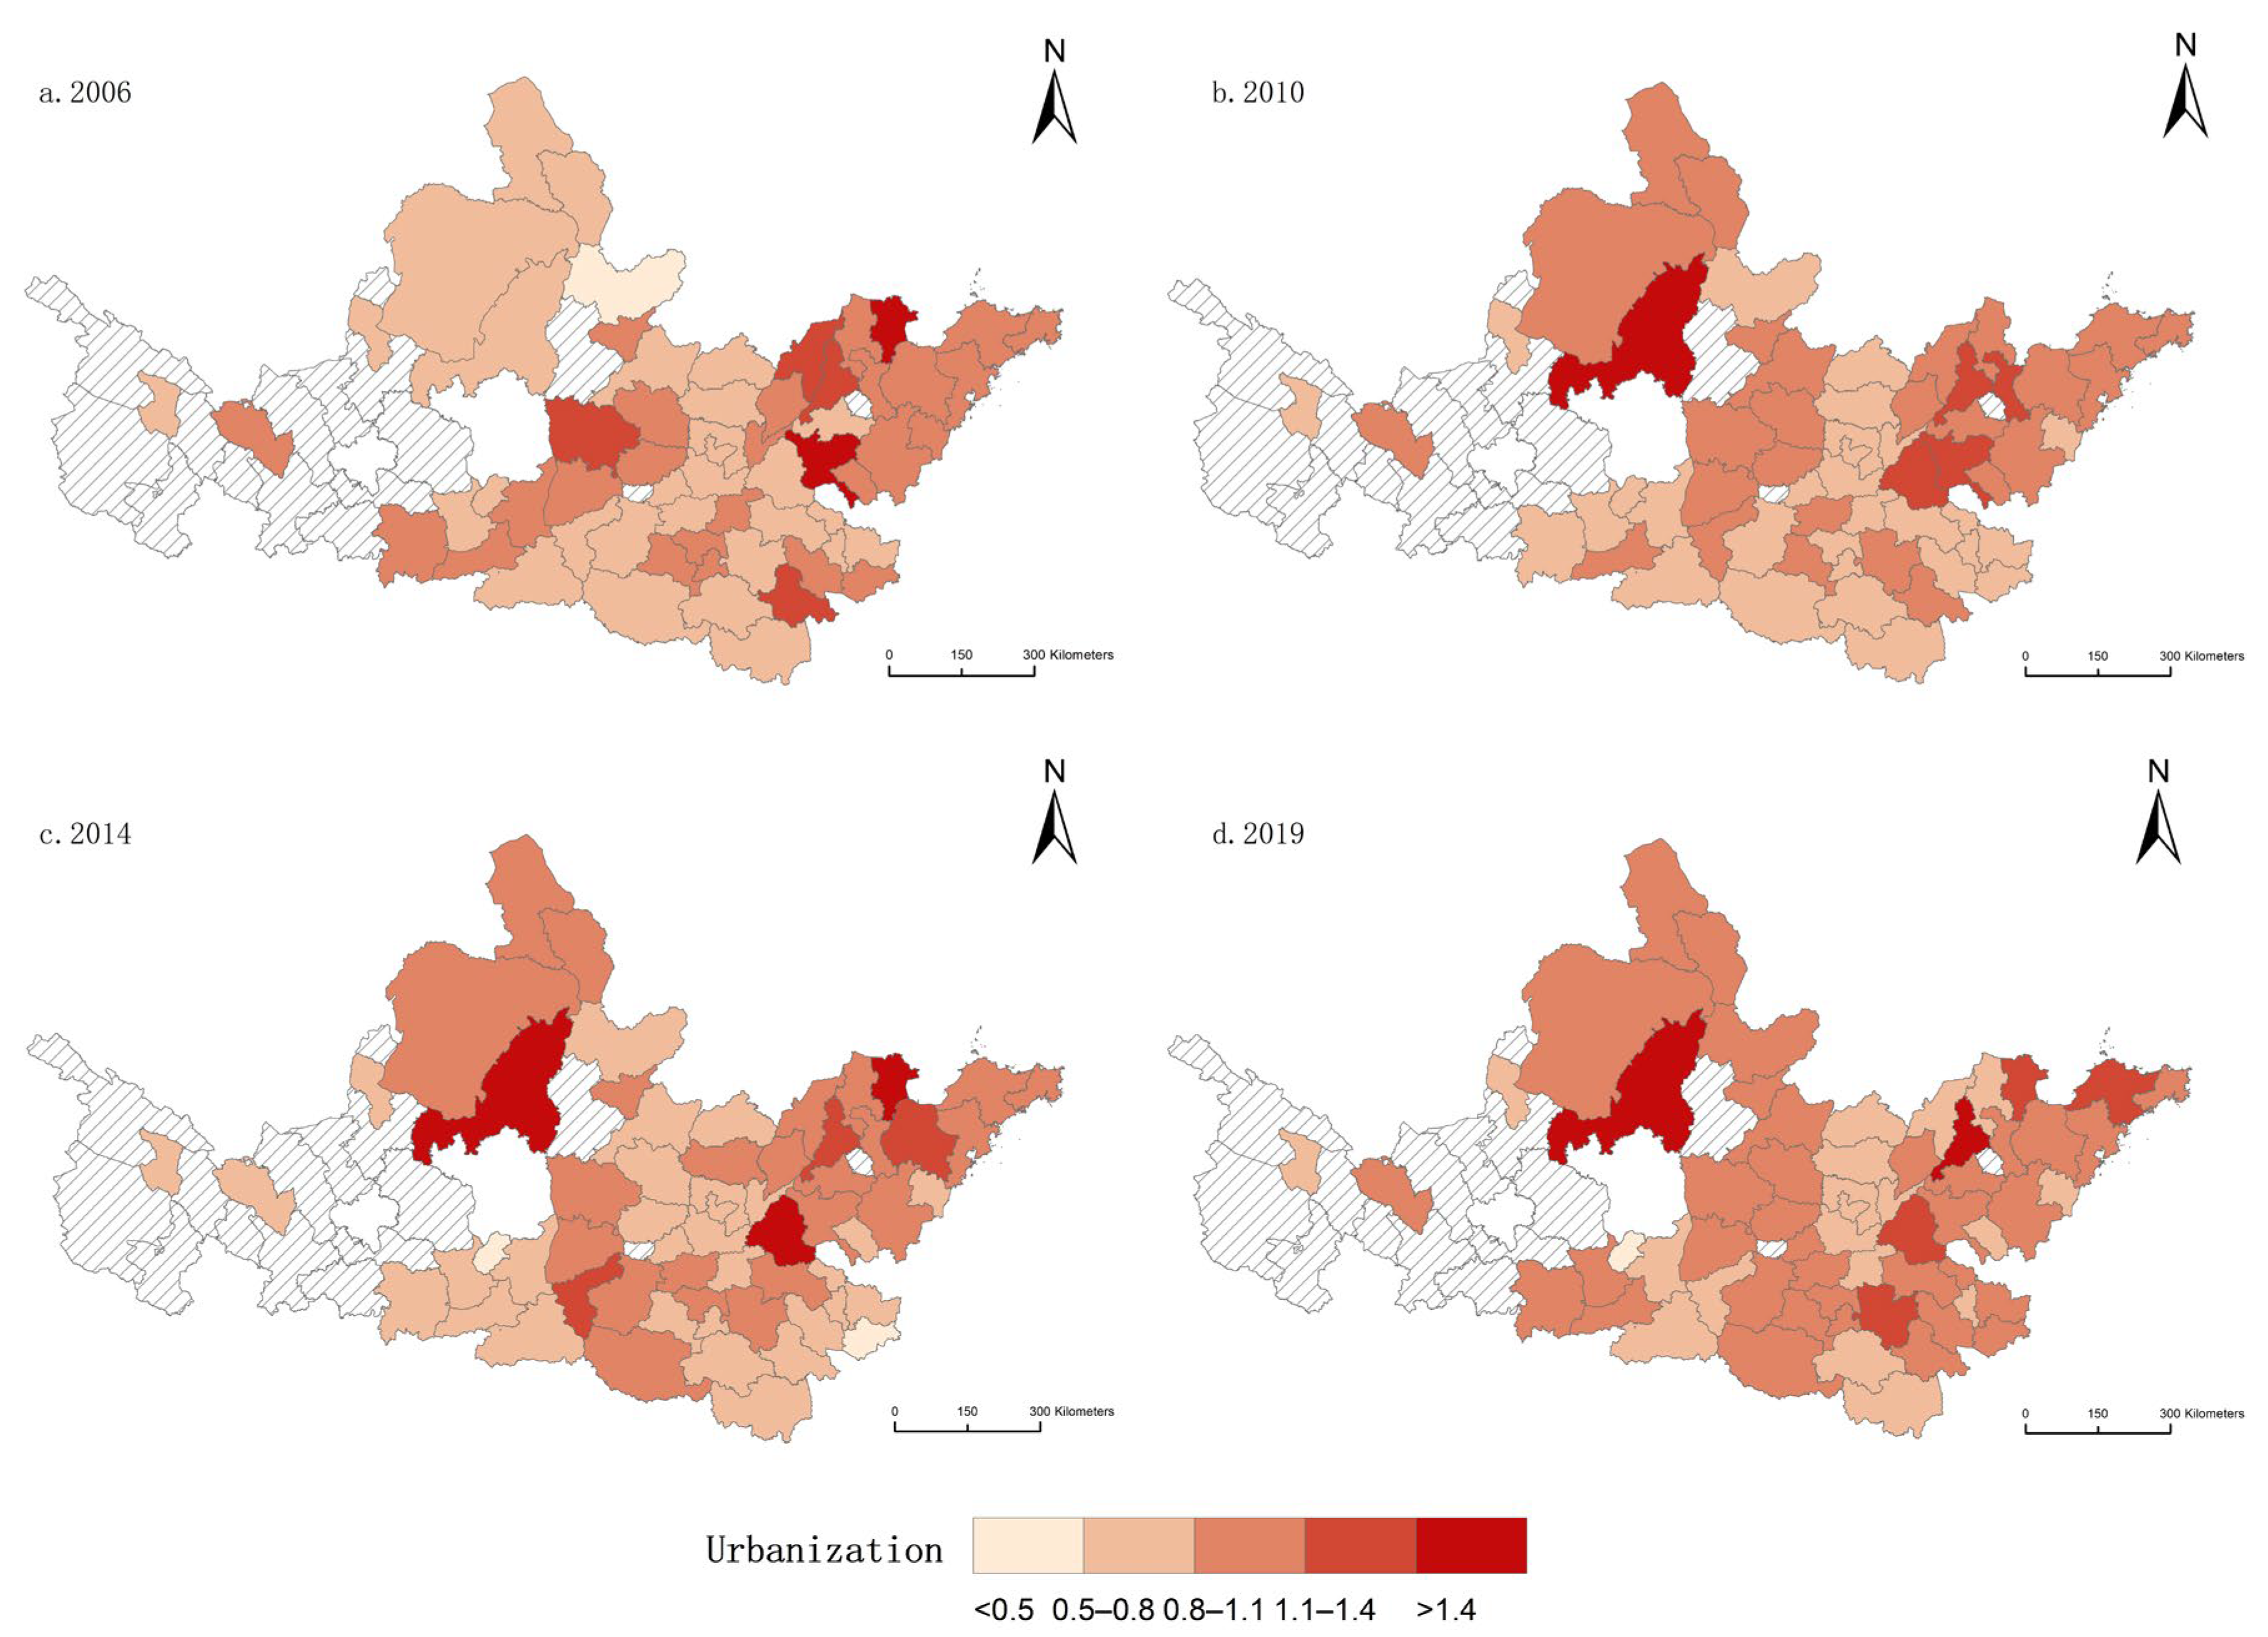
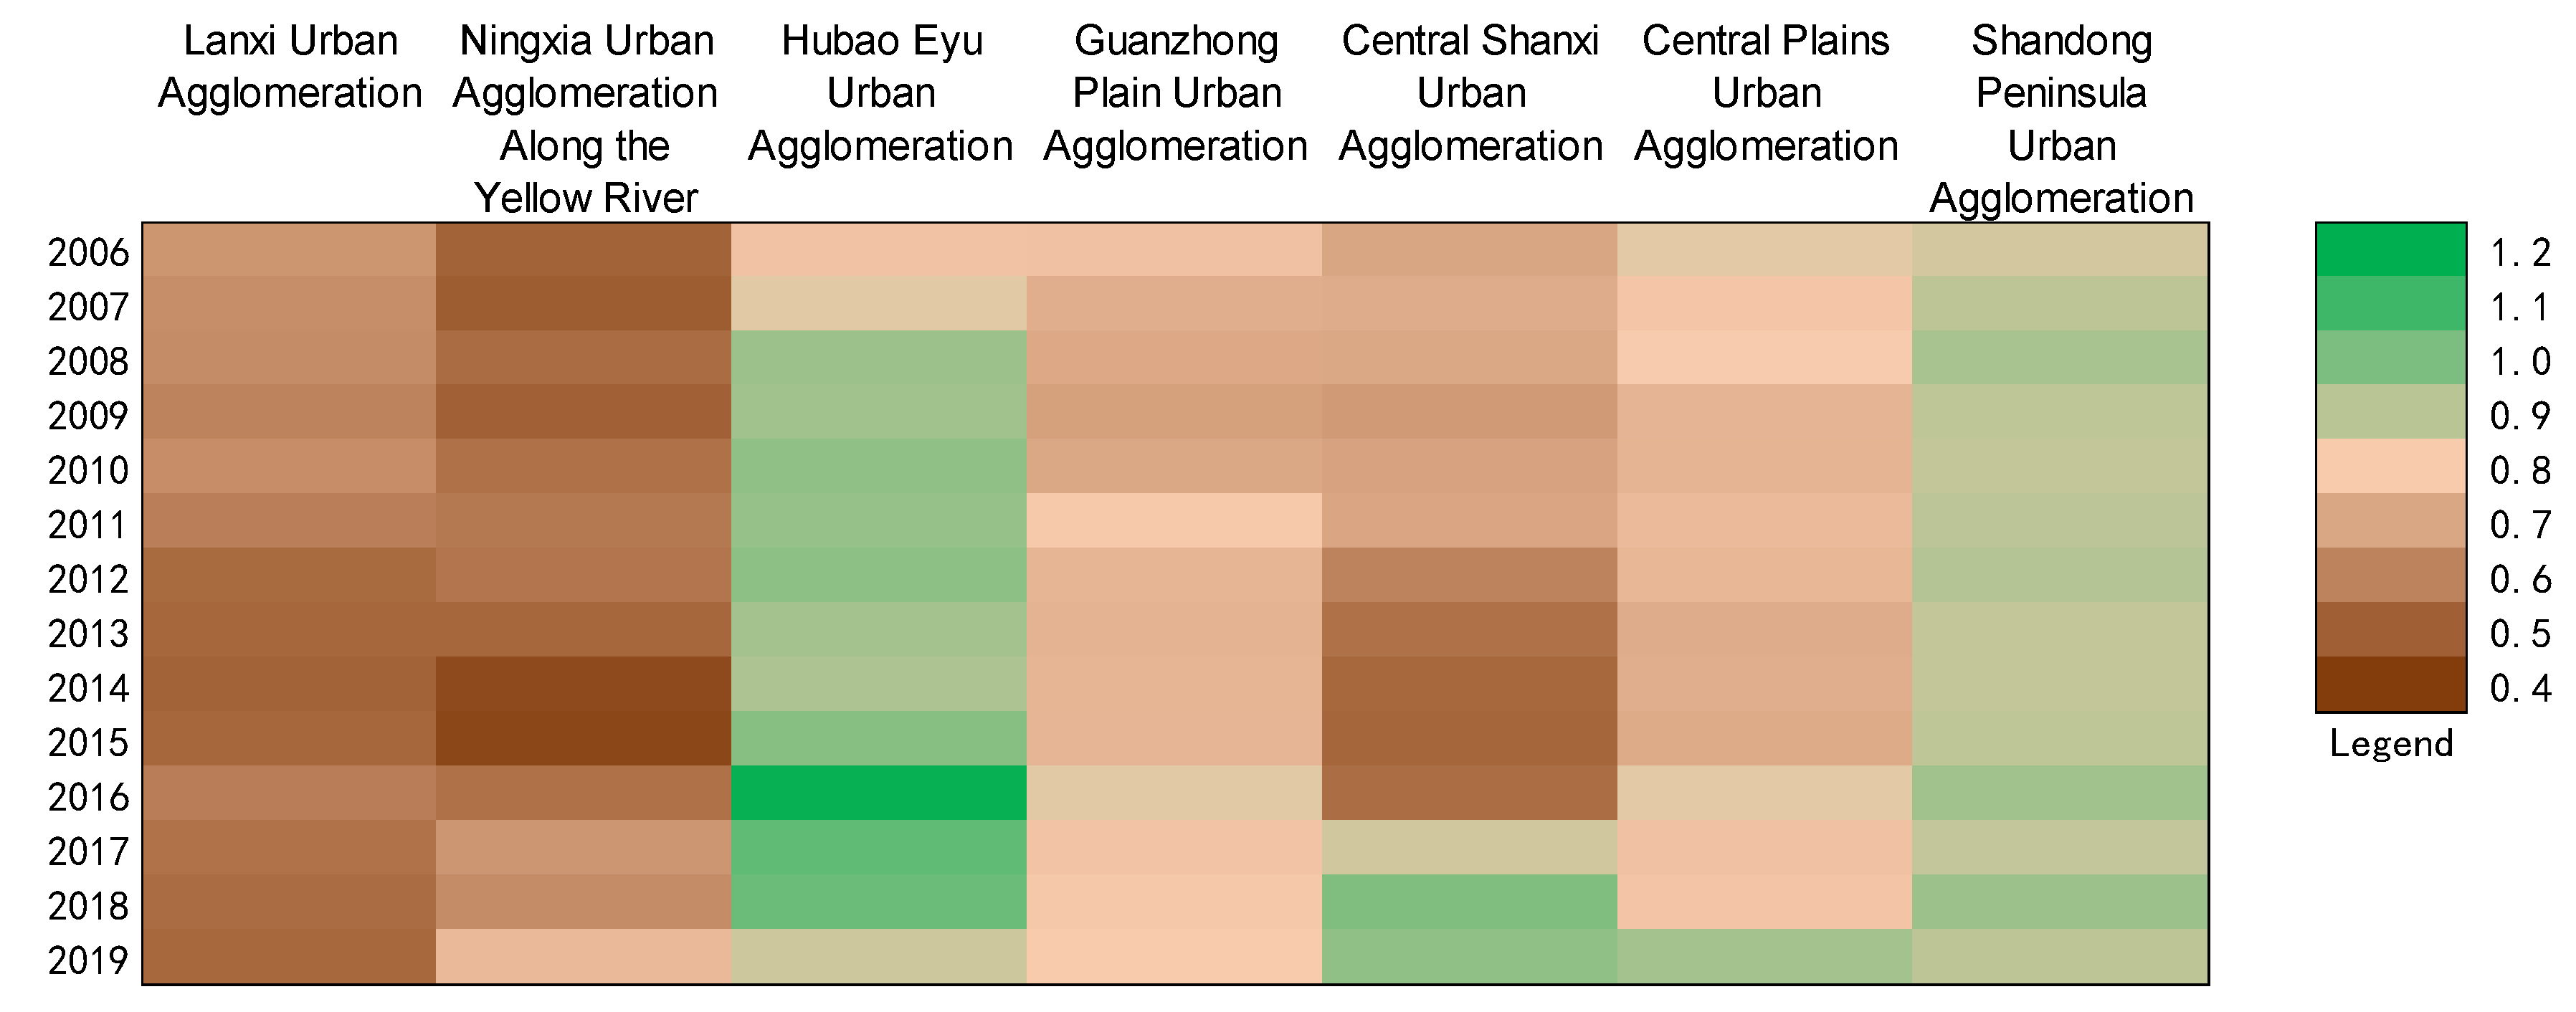
4.1. Urbanization Efficiency Evaluation Results and Analysis

This study measures the urbanization efficiency of 60 cities in the Yellow River basin, China, from 2006 to 2019 based on the DEA model. According to the calculation results, a heat map of the urbanization efficiency of each urban agglomeration in the Yellow River basin, China, from 2006 to 2019 was obtained (Figure 2). According to the analysis of the calculation results, it can be seen that the urbanization efficiency of various urban agglomerations shows an upward trend, from 0.83 in 2006 to 0.91 in 2019. Among them, the increase in the Hubao-Eyu urban agglomeration is the most obvious; although the Lanxi urban agglomeration declined at a low rate in the early stage, it had a sharp upward trend in the later period; the Shandong Peninsula urban agglomeration, the Central Plains urban agglomeration, and the Guanzhong Plain urban agglomeration had a higher starting point, but still grew steadily and slowly; while the Ningxia urban agglomeration along with the Huangcheng agglomeration and the central Shanxi urban agglomeration had a low starting point, the growth rate was relatively fast, and the overall growth rate also achieved rapid growth. In addition, between 2018 and 2019, there is a clear downward trend in the urbanization efficiency of three urban agglomerations, including the Shandong Peninsula, which may be related to the economic slowdown caused by the outbreak of the new crown epidemic at the end of 2019.
In this study, 2006, 2010, 2014, and 2019 were selected as representative years to spatially analyze the urbanization efficiency of the Yellow River basin, China (Figure 3). On the whole, cities with high urbanization efficiency development are increasing from west to east. Specifically, cities such as Yulin City and Dongying City have a high urbanization efficiency. The average urbanization efficiency of Yulin City is high and stable, which is related to its strategic positioning of China’s high-end energy and chemical base. Dongying City is an important part of the Shandong Peninsula urban agglomeration, located at the hub connecting the Central Plains Economic Zone and the Northeast Economic Zone, the Beijing-Tianjin-Tangshan Economic Zone, and the Jiaodong Peninsula Economic Zone, and is also an important oil base in China, so the economic development is rapid, and the urbanization efficiency reached 1.63 in 2014. The urbanization efficiency of cities such as Tongchuan, Bengbu, and Shangluo has been in a state of low-speed development. Tongchuan city is a typical resource-based city, and due to its single industrial structure and seriously restricted economic development, its urbanization efficiency is low, so it is urgent to adjust its industrial structure and layout optimization. Bengbu City is a national comprehensive transportation hub, but it has not been able to use the advantages of its effective geographical location to play a characteristic economy, restricting its urbanization development, so it is necessary for the government and relevant departments to re-clarify the development positioning of Bengbu City and give full play to the transportation advantages to the extreme. The reason for the low efficiency of urbanization in Shangluo City is due to the serious poverty problem in its rural areas. Industrial development is backward, so industrial upgrading should be carried out to promote the dual development of industry and agriculture.

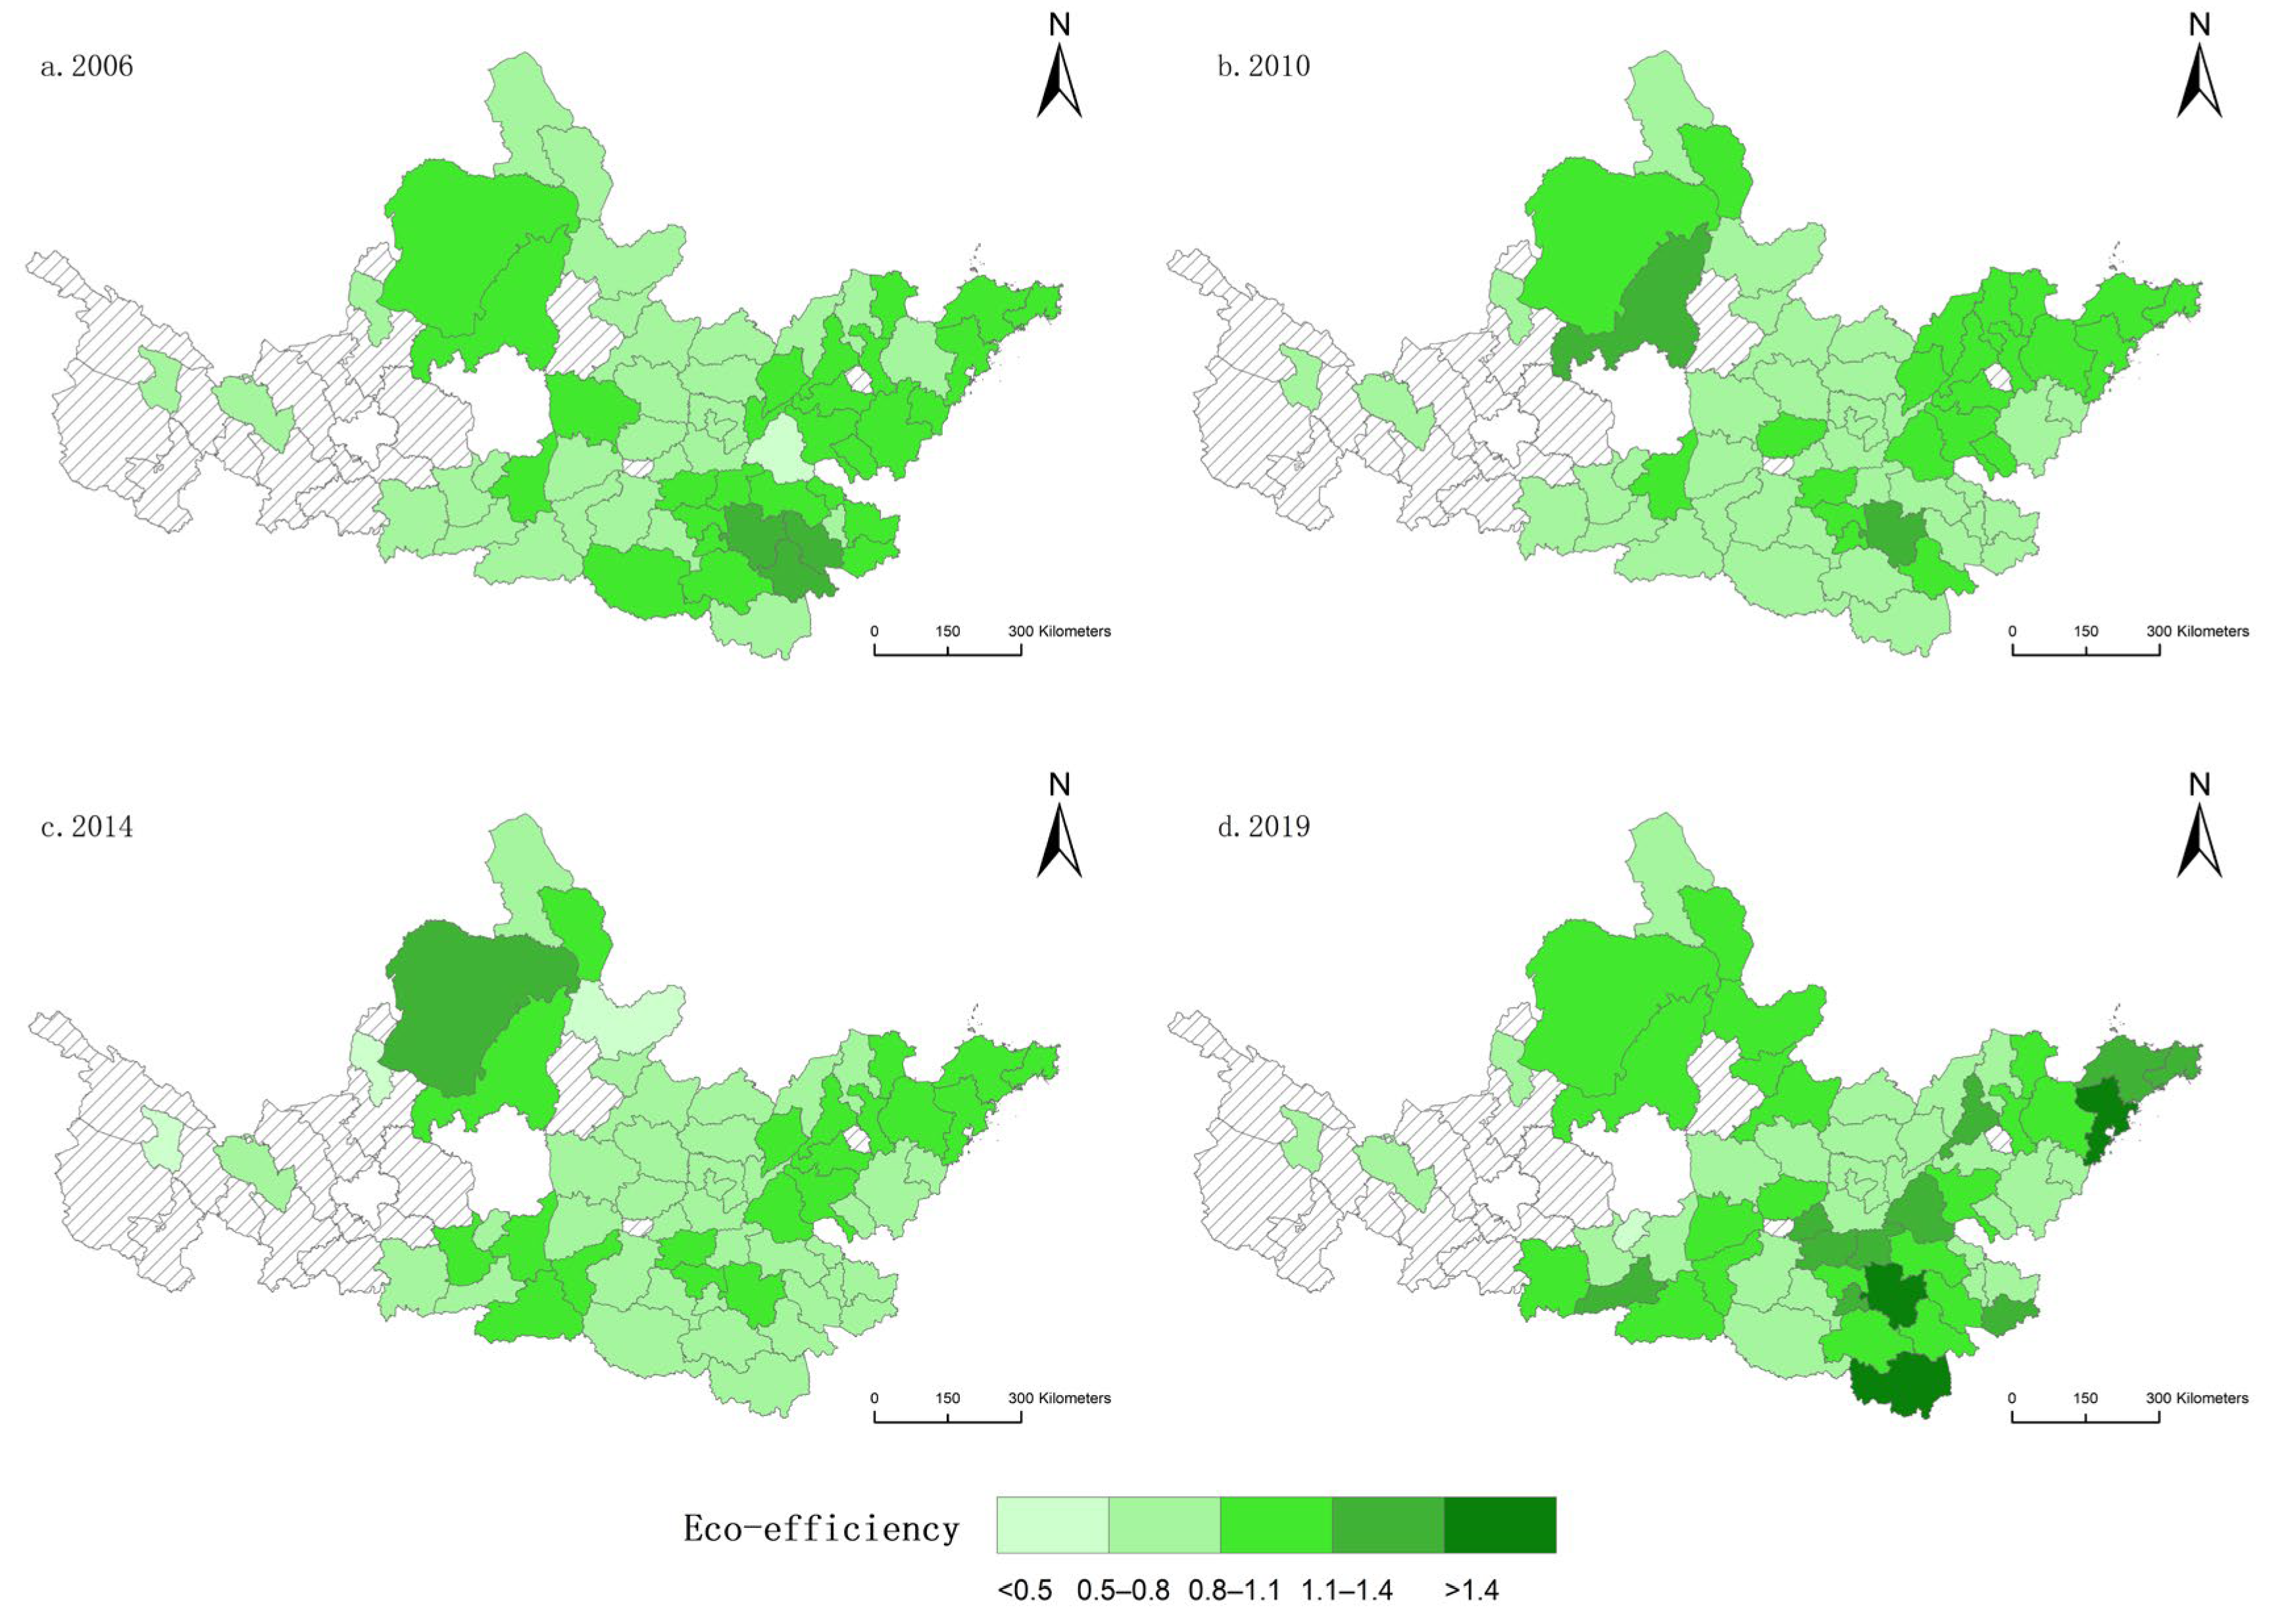
4.2. Ecological Efficiency Evaluation Results and Analysis

This study is based on the DEA model to measure the ecological efficiency of 60 cities in the Yellow River basin, China, from 2006 to 2019. According to the calculation results, a heat map of the ecological efficiency of various urban agglomerations in the Yellow River basin, China, from 2006 to 2019 were obtained (Figure 4). According to the analysis of the calculation results, it can be seen that the ecological efficiency of each urban agglomeration as a whole is stable and then rises from 1.03 in 2006 to 1.23 in 2019. Specifically, according to the trend, this can be divided into two stages: in the first stage, 2006–2014, the ecological efficiency value of the Yellow River basin, China, as a whole is relatively stable, except for the Hubao-Eyu Urban Agglomeration and the Shandong Peninsula Urban Agglomeration, and the ecological efficiency of the remaining urban agglomerations has a downward trend, which may have been caused by the emphasis on economic construction and neglect of ecological protection in the urban agglomerations at this time; during the second stage, 2014–2019, the ecological efficiency of the Yellow River basin, China, as a whole showed an upward trend, especially in 2015–2016. This is inseparable from the proposal of Xi Jinping’s theory of ecological civilization in 2016, the promulgation of the “Ten Articles of Soil”, and the introduction of the “Thirteenth Five-Year Plan for Ecological Environmental Protection”.
This study also selected 2006, 2010, 2014, and 2019 as representative years to conduct a spatial analysis of the ecological efficiency of the Yellow River basin, China (Figure 5). Overall, cities with high eco-efficient developments are increasing from northwest to southeast. Specifically, cities such as Ordos City and Qingdao City have a high urbanization efficiency. Ordos City is the central city of the Hubao-Eyu Urban Agglomeration, and its urbanization efficiency is high and stable, which is related to its national forest city and strong promotion of “water, gas, soil” pollution prevention and control. Qingdao is an important central city along China’s coast which began to adjust its industrial structure and carry out a reform of the ecological civilization system in 2016, so its ecological efficiency was greatly improved, reaching 1.48 in 2019. Due to industrial emissions, Lanzhou has serious environmental pollution and ecological efficiency has been low. Statistics show that Lanzhou ranks among the top 10 air pollution cities in the world in 2019. The same serious environmental problems are experienced by Xi’an City, which is facing the dual pressure of population growth and environmental degradation, but through the continuous promotion of environmental governance projects such as water control throughout the world, ecological efficiency has also increased from 0.56 in 2006 to 1.19 in 2019, and ecological and environmental problems such as water pollution have been significantly improved.

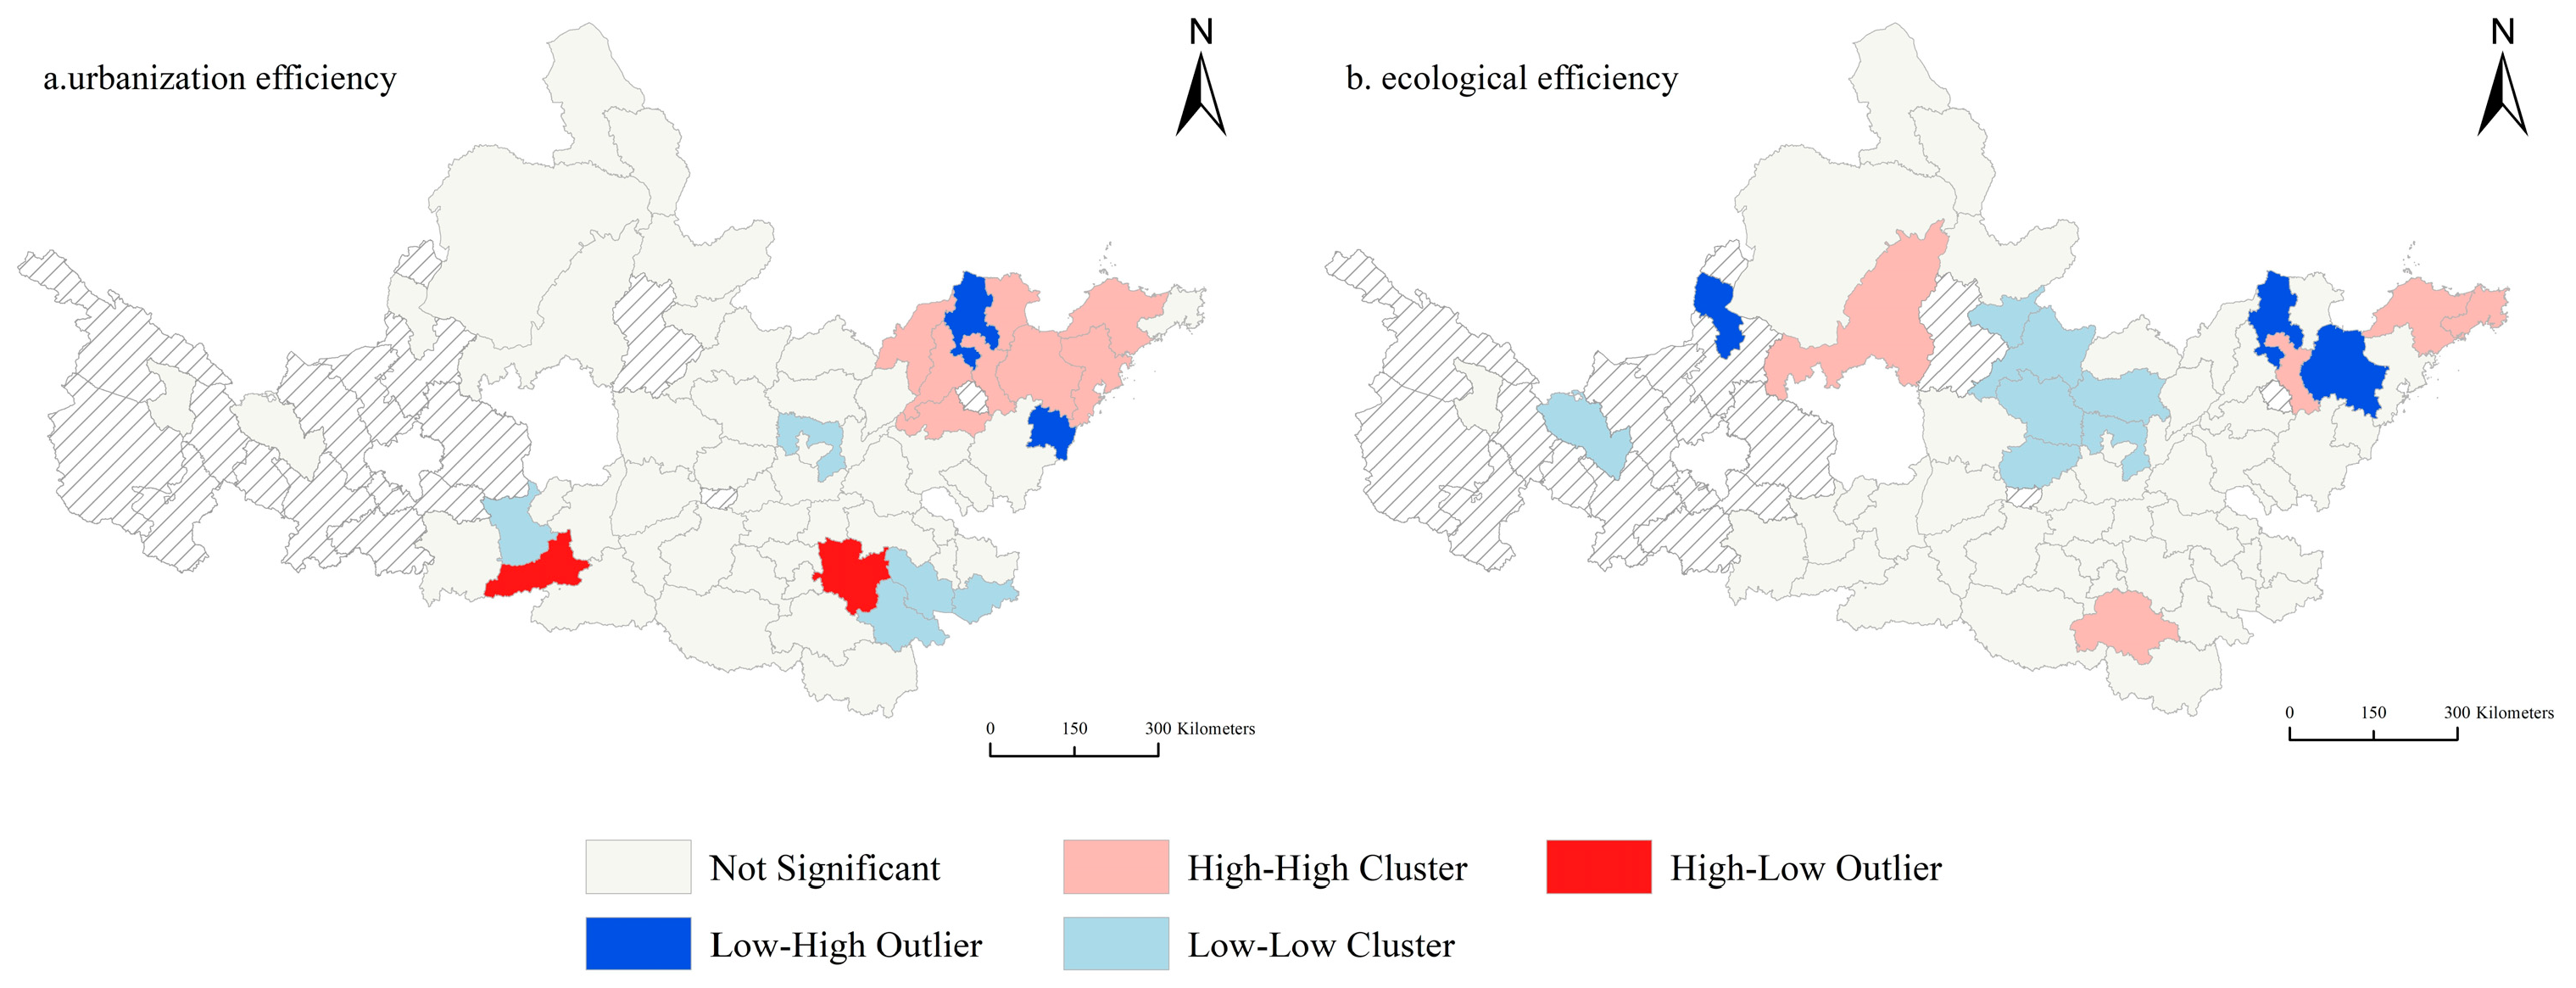
4.3. Spatial Correlation Pattern Analysis

Based on the spatial autocorrelation analysis model, the average values of urbanization efficiency and ecological efficiency of cities passing through urban agglomerations in the Yellow River basin, China, from 2006 to 2019 were analyzed separately. According to Global Moran’s I formula, the global autocorrelation Moran’s I index was calculated by using the average data of urbanization efficiency of cities passing through the Yellow River basin, China, from 2006 to 2019. The results show that the Z value is 4.79, and the index of global Moran’s I is 0.25 through the Z value test, which shows that the urbanization efficiency through the cities of the Yellow River basin, China, shows a positive correlation. Using the average data of the ecological efficiency of cities passing through the Yellow River basin, China, from 2006 to 2019, the global autocorrelation Moran’s I index was calculated, and the results show that the Z value is 2.68, and the global Moran’s I index is 0.14 through the Z value test. These results show that the ecological efficiency of cities passing through the Yellow River basin, China, have a positive correlation relationship.
The local Moran’s I index calculation of the ecological efficiency of cities passing through the Yellow River basin, China, yields the following LISA agglomeration map (Figure 6a). Seventeen cities pass the Z value test, among which Jinan, Qingdao, Zibo, Weifang, Yantai, Dongying, Dezhou, and Tai’an in the Shandong Peninsula urban agglomeration are in high-high correlation areas, that is, the urbanization efficiency of the area and its surrounding areas is higher and the difference is small, which is due to the early start, rapid development, and obvious location advantages of the Shandong Province. These cities are located in the coastal area facing Japan and South Korea across the sea to the east and bordering the Beijing-Tianjin-Hebei region in the north and the Central Plains Economic Zone in the west, which is not only an important part of the cooperation between the Bohai Rim region, but also the main gateway to the sea in the Yellow River basin, China, an important hub of the “Belt and Road”, and has strong trade advantages. Xi’an City in the Guanzhong Plain Urban Agglomeration and Zhoukou City in the Central Plains Urban Agglomeration are in high-low correlation areas: their urbanization efficiency is relatively high, the urbanization efficiency of their surrounding cities is low, and the gap between urbanization efficiency is more significant. This is due to the fact that Xi’an, as the central city of the northwest region, vigorously develops the economy, while the overall economic foundation of the northwest region is weak, the population is sparse, and it is difficult to carry out economic development, resulting in the polarizing trend of modernization and development in the northwest region, making the urbanization efficiency of Xi’an much higher than that of other cities in the northwest region. Binzhou City and Rizhao City of the Shandong Peninsula Urban Agglomeration are in low-high correlation areas: their urbanization efficiency is low, the urbanization efficiency of their surrounding cities is higher, and the gap in urbanization efficiency is more significant, which is due to their position in the Shandong Peninsula Urban Agglomeration, with better economic foundation and rapid development. Binzhou City and Rizhao City developed late, the industrial base is poor, so it is in a low-high correlation area. Xianyang City in the Guanzhong Plain Urban Agglomeration, Anyang City, Fuyang City, Bozhou City, and Bengbu City in the Central Plains Urban Agglomeration are in low-low correlation areas, that is, the urbanization efficiency of the region and its surrounding areas is low, and the difference is small, which is due to the fact that the overall economic development in the central and western regions started late, the economic scale is small, and the industrial structure level is low.
The local Moran’s I index calculation of the ecological efficiency of the Yellow River basin, China through the city obtained the following LISA agglomeration map (Figure 6b). Fifteen cities pass the Z value test, among which Yulin City in the Hubao-Eyu Urban Agglomeration, Yantai City, Weihai City, Zibo City, and Zhumadian City in the Central Plains Urban Agglomeration in the Shandong Peninsula Urban Agglomeration are in high-high correlation areas, that is, the ecological efficiency of the region and its surrounding areas is high, and the difference is small, which is due to the high attention paid by these areas to the construction of ecological civilization and creation of livable cities through a variety of policies. Yinchuan City along the Huangcheng City Agglomeration in Ningxia, Binzhou City, and Weifang City in the Shandong Peninsula Urban Agglomeration are in low-high correlation areas: their ecological efficiency is low, the ecological efficiency of their surrounding cities is higher, and the ecological efficiency gap is more significant, which is due to Ningxia being a fragile ecological environmental area in China. In recent years, in order to protect and restore the ecological environment in Ningxia, the state has vigorously promoted the construction of ecological projects, while Yinchuan City pays attention to economic development and ignores the construction of ecological civilization, ecological governance measures lag behind, and ecological efficiency is lower than other regions. The Shandong Peninsula Urban Agglomeration pays attention to the construction of ecological civilization, while Binzhou City and Weifang City, as resource-based cities, have a single industrial structure, serious pollution, and low ecological efficiency, so they are in low-high correlation areas. Lanzhou City in the Lanxi Urban Agglomeration, Taiyuan City, Jinzhong City in the Central Shanxi Urban Agglomeration, Changzhi City, Jincheng City, Handan City, and Anyang City in the Central Plains Urban Agglomeration are in low-low correlation areas, that is, the ecological efficiency of the area and its surrounding areas is low, and the difference is small, which is due to the fact that these cities are resource-based cities, with low resource input-output ratio, serious pollution emissions, and insufficient pollution control capabilities, as well as the fact that the green production system has not yet been built, which limits its ecological efficiency development.

4.4. Coupling Analysis of Urbanization Efficiency and Ecological Efficiency

In order to further explore the spatio-temporal coupling mechanism of the urbanization efficiency and ecological efficiency of urban agglomerations in the Yellow River basin, China, based on the relative development and spatial coupling model, the urbanization efficiency and ecological efficiency measurement results of 60 cities in the Yellow River basin, China, from 2006 to 2019 were coupled to study, and 2006, 2010, 2014, and 2019 were selected as representative years for analysis.
Firstly, the urbanization efficiency and ecological efficiency of 60 cities in the Yellow River basin, China, were analyzed in four stages, and the scattered coupling distribution map of the 60 cities was plotted (Figure 7). The expression of the straight line in the figure is y = x, that is, the line compares the urbanization efficiency and ecological efficiency of the 60 cities. If the point representing the 60 cities falls on the straight line of y = x, it indicates that the urbanization efficiency and ecological efficiency of the city are balanced. If the point representing the 60 cities falls above the line of y = x, indicating that the urbanization efficiency of the city is lower than the ecological efficiency and the development of urbanization in the city lags behind its ecological environment construction, then the urbanization construction needs to be strengthened to adapt to the sustainable development of the ecological environment. If the point representing the 60 cities falls below the straight line of y = x, indicating that the urbanization efficiency of the city is higher than its ecological efficiency and the development of urbanization in the city is ahead of its ecological environment construction, then the ecological environment construction needs to be strengthened to adapt to the improvement of its urbanization level.
In terms of years, in 2006 (Figure 7a), the ecological efficiency of 27 cities, including Yulin City and Zhoukou City, is higher than their urbanization efficiency, indicating that they gave priority to ecological development at that time, the degree of pollution in the area was low, and the level of urbanization was relatively backward. The urbanization efficiency and ecological efficiency of Handan City and Rizhao City are basically the same, indicating that the two cities have basically achieved balanced development. The ecological efficiency of the remaining 31 cities, including Xi’an City and Dongying City, is lagging behind the urbanization efficiency, indicating that these cities gave priority to economic development and needed to strengthen the construction of the ecological environment. In 2010 (Figure 7b), the development trend of ecological efficiency and urbanization efficiency changed greatly compared with 2006, of which the number of cities with ecological development priority is reduced to 19, the urbanization efficiency and ecological efficiency of Weihai City and Jiaozuo City are basically the same, and the urbanization rate of the remaining 39 cities exceeded their ecological efficiency, indicating that in 2010, the urbanization level of each city has undergone rapid changes, and its growth rate is much higher than the level of ecological environment construction. By 2014 (Figure 7c), the number of cities with priority ecological development has further reduced to only 17, only Zaozhuang City has reached the level of balanced development, while the remaining 42 cities are still in a state of development, where the urbanization efficiency is higher than that of ecological efficiency, and the development speed of the urbanization level is higher than that of ecological environment construction. By 2019 (Figure 7d), the situation has improved, and the number of cities with ecological efficiency higher than the efficiency of urbanization has increased to 22, indicating that when the urbanization process develops to a certain level, some cities begin to pay attention to the coordinated development of the ecological environment, while the ecological environment construction of some cities is still relatively lagging behind, indicating that the construction of their ecological environment cannot meet the needs of the urbanization process and needs to be strengthened.
After analyzing the development degree and trend comparison of the urbanization efficiency and ecological efficiency of different cities in the four stages of the Yellow River basin, China, according to the spatial coupling degree model, this paper analyzes the urbanization efficiency and ecological efficiency of 60 cities in the Yellow River basin, China, respectively, so as to explore the degree of spatial coupling of the cities in the Yellow River basin, China, in different years (2006, 2010, 2014, 2019). This reflects the coordination and priority of the pace of urbanization and the construction of ecological civilization in the Yellow River basin, China, between 2006 and 2019. Based on the spatial coupling degree expression (Figure 8), we divide the coupling degree of urbanization efficiency and ecological efficiency of cities in the Yellow River basin, China, into four stages: low coupling, moderate coupling, medium and high coupling, and high coupling.
Overall, the coupling relationship between the two is an N-type relationship, with the trend of first rising, then falling, and then rising. Spatially, the coupling degree of the upper and lower reaches of the Yellow River basin, China, is higher than that of the middle reaches of the Yellow River basin, China. During the period, there were fluctuations in each city. Hubao-Eyu urban agglomeration is represented by Ordos City and Yulin City: the spatial coupling degree is the highest, and the urbanization efficiency and ecological efficiency are maintained at a high level. There is a certain degree of fluctuation in cities such as Linfen City, Bozhou City, and Kaifeng City around 2006: the coupling degree of these areas is higher, but the value of its urbanization efficiency and ecological efficiency is at average; with the acceleration of the urbanization process, the urbanization efficiency gradually exceeds the ecological efficiency, the spatial coupling degree is unbalanced, and the degree of coupling decreases accordingly. After 2019, with the implementation and development of ecological civilization construction, ecological efficiency has increased year by year, and the spatial coupling between the two has also increased. In Luoyang City, Handan City, and Binzhou City, the degree of spatial coupling remains relatively stable, and the degree of medium coupling and medium and high coupling has been relatively stable for a long time, indicating that the development trend of urbanization efficiency and ecological efficiency is relatively stable, and the development rate is relatively consistent. The degree of spatial coupling of Weihai City, Dongying City, and Jinan City has been maintained at a high degree of coupling, and its urbanization efficiency and ecological efficiency can basically achieve sustainable development. In terms of years, between 2006 and 2010, the industrial structure was still dominated by traditional energy sources such as coal, the resource utilization efficiency is low, and the input-output efficiency is not high, resulting in the fact that the urbanization efficiency and ecological efficiency level of most cities in the Yellow River basin, China, are not high, but their coupling degree is relatively balanced and remain at the level of moderate coupling or even medium and high coupling. Between 2010 and 2014, the overall urbanization efficiency of the Yellow River basin, China, improved, and its degree of improvement is higher than the level of development of the ecological environment. The degree of spatial coupling of cities in the Yellow River basin, China, decreased slightly. Finally, after 2014, the cities in the Yellow River basin, China, put forward special plans for environmental protection and ecological construction, focusing on water and gas pollution control, adhering to innovation-driven development. Their ecological environment also greatly improved, and ecological efficiency improved year by year, especially by about 2019, when the growth rate of urbanization in the Yellow River basin, China, began to slow down, during which the urbanization efficiency and ecological efficiency of each city gradually approached and maintained a relatively high level. The degree of spatial coupling also greatly improved.

5. Discussion

Taking the Yellow River basin, China, as the research area, this study analyzes the spatio-temporal variation characteristics, spatial correlation pattern, and time-space coupling relationship between urban agglomeration urbanization efficiency and ecological efficiency, which makes up for the current lack of research on the interpretation of its influence mechanism from the perspective of spatio-temporal coupling. A brief discussion of the results obtained:
(1)
Reliability of research results. At present, few studies have been carried out on the coupling relationship between new urbanization and the ecological environment in the Yellow River basin, China, from the perspective of urban agglomerations Most of the studies have been carried out on the relationship between urbanization and the ecological environment in the Yellow River basin, China, as a whole, and there are relatively few studies on the mechanism of explaining its impact mechanism from the perspective of efficiency. From the perspective of the variation characteristics of the average coupling degree between urbanization efficiency and ecological efficiency in the Yellow River basin, China, the results of this paper are consistent with the various characteristics of the coupling degree of the new urbanization and ecological environment in the Yellow River basin, China [49]. It is also consistent with the various characteristics of the coupling and coordination degree of urban economic development and ecological environment in the Yellow River basin, China [50], which is good proof of the reliability of this study. In the relevant study on the calculation of the coupling relationship between urbanization and ecological environment in different study areas, the comprehensive urbanization level of Hebei Province [51] is calculated from four dimensions of population, economy, society, and space, while the coupling and coordination relationship between urbanization and ecological environment in Hunan Province [52] is empirically analyzed on the basis of the weighted index of the entropy weighted method. This overlaps with the idea of measuring the coupling degree in this article. This has a certain impact on the comparison between the research results, so future research will achieve a unified measurement system on the basis of deepening and formulating a unified measurement standard. In this paper on the urbanization efficiency and ecological efficiency of 60 cities in the Yellow River basin, China, the selection of different indicators as input-output elements will have an impact on the calculation results, and there is no unified indicator system. In future research, it is planned to try different input-output combinations and strive to find the most suitable indicator system to measure urbanization efficiency and ecological efficiency, so that the coupling results are closer to reality;
(2)
Innovative points and deficiencies in research. From the perspective of research themes, this study takes the urban agglomeration of the Yellow River basin, China, as the research area, and, through the spatio-temporal coupling analysis of the urbanization efficiency and ecological efficiency of the Yellow River basin, China, the problems encountered in the process of ecological protection and high-quality development of the Yellow River basin, China, are found, which makes up for the current lack of research on the special geographical economic zone of the Yellow River basin, China, which carries the “major national strategy for ecological protection and high-quality development of the Yellow River basin, China”. From the perspective of research methods, taking the input indicators (such as capital input, labor input, land input, etc.) related to the development of the Yellow River basin, China, as the main indicators, combined with output indicators such as the scale of the urban economy, the DEA model is used to evaluate the urbanization efficiency of the urban agglomeration in the Yellow River basin, China; the capital factor input, labor input, and resource input are used as the input indicators; the regional GDP, sewage discharge, and waste resource generation are used as the output indicators; and the DEA model is used to evaluate the ecological efficiency of the urban agglomeration in the Yellow River basin, China. The spatial correlation model, relative development, and spatial coupling model are used to comprehensively treat the urbanization efficiency and ecological efficiency of each region in the Yellow River basin, China, and the coupling relationship between the urbanization efficiency and ecological efficiency of each urban agglomeration in the Yellow River basin, China, is analyzed, which is improved on the basis of the original spatio-temporal coupling analysis of urbanization efficiency and ecological efficiency and adopts more reasonable indicators and more comprehensive and effective new methods. From the perspective of the policy orientation of the research results, the results obtained by this study through the spatio-temporal coupling analysis put forward practical policy suggestions for the problems existing in the development process of various urban agglomerations in the Yellow River basin, China, which is of great practical significance. However, what is deficient is that this study focuses on the regional urbanization efficiency and ecological efficiency of urban agglomerations; however, we will also conduct in-depth research on the cooperative relationship between urban agglomerations in the Yellow River basin, China, in the future;
(3)
Policy recommendations. For the future development of the urban agglomeration in the Yellow River basin, China, we must first grasp the main contradiction of development: that not only does high-quality development continue to promote urbanization, but that it also solves the pollution caused by development. Energy-based urban agglomerations, such as the Hubao-Eyu Urban Agglomeration and the Jinzhong Urban Agglomeration, are highly dependent on minerals and water resources, so special attention needs to be paid to ecological and environmental pollution issues. The Lanxi urban agglomeration has a fragile ecological environment, a large land area, a small population, and a relatively lagging economic development, so it is necessary to rely more on innovation and use spatial planning to guide resource utilization and environmental governance. Secondly, in order to achieve coordinated regional development, a unique development strategy is needed. The analysis of the above results shows that there are still some differences in the future development of different urban agglomerations. The Shandong Peninsula Urban Agglomeration continues to play a leading role in the development of the river basin, but compared with other mature urban agglomerations in China, its scientific and technological innovation capabilities and core competitiveness are not outstanding, and it is necessary to further enhance its comprehensive competitiveness in the country in the future. The Guanzhong Urban Agglomeration and the Central Plains Urban Agglomeration are located in the plain area and are important strategic development areas in central and western China. In addition, the degree of coupling development of Ningxia along the Huangcheng Agglomeration and the Lanxi Urban Agglomeration in the seven urban agglomerations is relatively poor, and it is necessary to further solve their development shortcomings, promote the process of urbanization, strengthen environmental ecological protection, and achieve the coordinated development of the urban agglomeration of the whole river basin as soon as possible.

6. Conclusions

From the perspective of efficiency, this study constructs an evaluation index system for urbanization efficiency and ecological efficiency, calculates the urbanization efficiency and ecological efficiency of 60 cities in the Yellow River basin’s urban agglomeration from 2006 to 2019 through the DEA model, and conducts spatio-temporal analysis to explore the temporal and spatial variation characteristics of urbanization efficiency and ecological efficiency of urban agglomeration in the Yellow River basin, China. On this basis, the spatial correlation model, the relative development model, and the coupling degree model are introduced, and the spatial correlation pattern of urbanization efficiency and ecological efficiency of urban agglomeration in the Yellow River basin, China, and the spatio-temporal coupling relationship between the two are explored.
The results show that urbanization efficiency has been rising, from 0.83 in 2006 to 0.91 in 2019. Ecological efficiency first stabilized and then rose from 1.03 in 2006 to 1.23 in 2019. Spatially, cities with high urbanization efficiency development are increasing from west to east. Cities with high eco-efficient developments are increasing from northwest to southeast. The coupling relationship between the two is an N-type relationship, with the trend of first rising, then falling, and then rising. Spatially, the coupling degree of the upper and lower reaches of the Yellow River basin, China, is higher than that of the middle reaches of the Yellow River basin, China.
The research results can provide a reference for urban ecological management and sustainable urban development in the Yellow River basin, China. In the process of continuous urbanization, we should promote the high-quality development of cities in the Yellow River basin, China, and we must change the traditional model relying on high consumption, high emissions, and high pollution to promote low-carbon, green and sustainable development. We must improve the intensity of resource utilization, optimize the spatial layout of urban resource allocation, develop more environmentally friendly energy-saving and water-saving technologies, increase urban ecological space, and avoid unlimited expansion of cities.

Author Contributions

Conceptualization, Y.R. and Y.B.; methodology, F.Z.; software, J.W. and Z.W.; validation, Y.R., Y.B. and Y.L.; formal analysis, Y.R. and Y.L.; data curation, Y.R., Y.L., J.W. and Z.W.; writing—original draft preparation, Y.R. and Y.L.; writing—review and editing, Y.B.; visualization, Y.L.; supervision, Y.B.; project administration, Y.B.; funding acquisition, Y.B. All authors have read and agreed to the published version of the manuscript.

Funding

This research was supported by the National Natural Science Foundation of China [Grant No. 72104130] and the National Natural Science Foundation of China [Grant No. 72104223].

Conflicts of Interest

The authors declare no conflict of interest.

References

  1. Ghosh, S.; Chatterjee, N.D.; Dinda, S. Urban ecological security assessment and forecasting using integrated DEMATEL-ANP and CA-Markov models: A case study on Kolkata Metropolitan Area, India. Sustain. Cities Soc. 2021, 68, 102773. [Google Scholar] [CrossRef]
  2. Nechyba, T.J.; Walsh, R.P. Urban sprawl. J. Econ. Perspect. 2004, 18, 177–200. [Google Scholar] [CrossRef] [Green Version]
  3. Bardhan, R.; Kurisu, K.; Hanaki, K. Does compact urban forms relate to good quality of life in high density cities of India? Case of Kolkata. Cities 2015, 48, 55–65. [Google Scholar] [CrossRef]
  4. Yu, B. Ecological effects of new-type urbanization in China. Renew. Sustain. Energy Rev. 2021, 135, 110239. [Google Scholar] [CrossRef]
  5. Guan, X.; Wei, H.; Lu, S.; Dai, Q.; Su, H. Assessment on the urbanization strategy in China: Achievements, challenges and reflections. Habitat Int. 2018, 71, 97–109. [Google Scholar] [CrossRef]
  6. Chen, J. Rapid urbanization in China: A real challenge to soil protection and food security. Catena 2007, 69, 1–15. [Google Scholar] [CrossRef]
  7. Cao, Y.; Kong, L.; Zhang, L.; Ouyang, Z. The balance between economic development and ecosystem service value in the process of land urbanization: A case study of China’s land urbanization from 2000 to 2015. Land Use Policy 2021, 108, 105536. [Google Scholar] [CrossRef]
  8. Liu, J.; Schlünzen, K.H.; Frisius, T.; Tian, Z. Effects of urbanization on precipitation in Beijing. Phys. Chem. Earth 2021, 122, 103005. [Google Scholar] [CrossRef]
  9. Su, H.; Wang, W.; Jia, Y.; Han, S.C.; Gao, H.; Niu, C.; Ni, G. Impact of urbanization on precipitation and temperature over a lake-marsh wetland: A case study in Xiong’an New Area, China. Agric. Water Manag. 2021, 243, 106503. [Google Scholar] [CrossRef]
  10. Shen, J.; Qin, G.; Yu, R.; Zhao, Y.; Yang, J.; An, S.; Liu, R.; Leng, X.; Wan, Y. Urbanization has changed the distribution pattern of zooplankton species diversity and the structure of functional groups. Ecol. Indic. 2021, 120, 106944. [Google Scholar] [CrossRef]
  11. Yang, X.J. China’s rapid urbanization. Science 2013, 342, 310. [Google Scholar] [CrossRef]
  12. Qiu, M.; Yang, Z.; Zuo, Q.; Wu, Q.; Jiang, L.; Zhang, Z.; Zhang, J. Evaluation on the relevance of regional urbanization and ecological security in the nine provinces along the Yellow River, China. Ecol. Indic. 2021, 132, 108346. [Google Scholar] [CrossRef]
  13. Si-Yuan, W.; Jing-Shi, L.; Cun-Jian, Y. Eco-environmental vulnerability evaluation in the Yellow River Basin, China. Pedosphere 2008, 18, 171–182. [Google Scholar]
  14. Miao, C.Y.; Yang, L.; Chen, X.H.; Gao, Y. The vegetation cover dynamics (1982–2006) in different erosion regions of the Yellow River Basin, China. Land Degrad. Dev. 2012, 23, 62–71. [Google Scholar] [CrossRef]
  15. Chen, Y.P.; Fu, B.J.; Zhao, Y.; Wang, K.B.; Zhao, M.M.; Ma, J.F.; Wu, J.; Xu, C.; Liu, W.; Wang, H. Sustainable development in the Yellow River basin, China: Issues and strategies. J. Clean. Prod. 2020, 263, 121223. [Google Scholar] [CrossRef]
  16. Hui, X.U.; Nuo, S.H.I.; Lingling, W.U.; Dawei, Z.H.A.N.G. High-quality development level and its spatiotemporal changes in the Yellow River Basin. Resour. Sci. 2020, 42, 01000115. [Google Scholar]
  17. Ren, Y.; Li, H.; Shen, L.; Zhang, Y.; Chen, Y.; Wang, J. What is the efficiency of fast urbanization? A China study. Sustainability 2018, 10, 3180. [Google Scholar] [CrossRef] [Green Version]
  18. Halleux, J.M.; Marcinczak, S.; van der Krabben, E. The adaptive efficiency of land use planning measured by the control of urban sprawl. The cases of the Netherlands, Belgium and Poland. Land Use Policy 2012, 29, 887–898. [Google Scholar] [CrossRef]
  19. Brülhart, M.; Mathys, N.A. Sectoral agglomeration economies in a panel of European regions. Reg. Sci. Urban Econ. 2008, 38, 348–362. [Google Scholar] [CrossRef] [Green Version]
  20. Mallet, J.S. Municipal Powers, Land Use Planning, and the Environment: Understanding the Public’s Role; Environmental Law Centre: Edmonton, AB, Canada, 2005. [Google Scholar]
  21. Al-Mulali, U.; Fereidouni, H.G.; Lee, J.Y.; Sab, C.N.B.C. Exploring the relationship between urbanization, energy consumption, and CO2 emission in MENA countries. Renew. Sustain. Energy Rev. 2013, 23, 107–112. [Google Scholar] [CrossRef]
  22. Ren, A. Construction of life cycle evaluation model for urban innovative ecological system based on new-type urbanization. Open House Int. 2018, 43, 36–41. [Google Scholar] [CrossRef]
  23. Berry, B.J.; Kim, H. Efficiency frontiers: Urbanization and development. Urban Geogr. 2001, 22, 306–315. [Google Scholar] [CrossRef]
  24. Fang, S.; Ji, X.; Ji, X.; Wu, J. Sustainable urbanization performance evaluation and benchmarking: An efficiency perspective. Manag. Environ. Qual. Int. J. 2018, 29, 240–254. [Google Scholar] [CrossRef]
  25. Woodward, R. The Organisation for Economic Co-Operation and Development (OECD); Routledge: London, UK, 2009. [Google Scholar]
  26. Saling, P.; Kicherer, A.; Dittrich-Krämer, B.; Wittlinger, R.; Zombik, W.; Schmidt, I.; Schrott, W.; Schmidt, S. Eco-efficiency analysis by BASF: The method. Int. J. Life Cycle Assess. 2002, 7, 203–218. [Google Scholar] [CrossRef]
  27. Liu, Y.; Wang, W.; Li, X.; Zhang, G. Eco-efficiency of urban material metabolism: A case study in Xiamen, China. Int. J. Sustain. Dev. World Ecol. 2010, 17, 142–148. [Google Scholar] [CrossRef]
  28. Tovar, B.; Wall, A. Environmental efficiency for a cross-section of Spanish port authorities. Transp. Res. Part D Transp. Environ. 2019, 75, 170–178. [Google Scholar] [CrossRef]
  29. Picazo-Tadeo, A.J.; Beltrán-Esteve, M.; Gómez-Limón, J.A. Assessing eco-efficiency with directional distance functions. Eur. J. Oper. Res. 2012, 220, 798–809. [Google Scholar] [CrossRef]
  30. Mardani, A.; Zavadskas, E.K.; Streimikiene, D.; Jusoh, A.; Khoshnoudi, M. A comprehensive review of data envelopment analysis (DEA) approach in energy efficiency. Renew. Sustain. Energy Rev. 2017, 70, 1298–1322. [Google Scholar] [CrossRef]
  31. Vázquez-Rowe, I.; Villanueva-Rey, P.; Iribarren, D.; Moreira, M.T.; Feijoo, G. Joint life cycle assessment and data envelopment analysis of grape production for vinification in the Rías Baixas appellation (NW Spain). J. Clean. Prod. 2012, 27, 92–102. [Google Scholar] [CrossRef]
  32. Scherner, F.; Horta, P.A.; de Oliveira, E.C.; Simonassi, J.C.; Hall-Spencer, J.M.; Chow, F.; Nunes, J.M.C.; Pereira, S.M.B. Coastal urbanization leads to remarkable seaweed species loss and community shifts along the SW Atlantic. Mar. Pollut. Bull. 2013, 76, 106–115. [Google Scholar] [CrossRef] [Green Version]
  33. Grossman, G.M.; Krueger, A.B. Economic growth and the environment. Q. J. Econ. 1995, 110, 353–377. [Google Scholar] [CrossRef] [Green Version]
  34. Wang, S.; Ma, H.; Zhao, Y. Exploring the relationship between urbanization and the eco-environment—A case study of Beijing–Tianjin–Hebei region. Ecol. Indic. 2014, 45, 171–183. [Google Scholar] [CrossRef]
  35. Ma, H.; Huang, D.; Yao, H. Total-factor energy efficiency analysis of three major economic regions in China: Based on super-DEA and Malmquist. China Popul. Resour. Environ. 2011, 21, 38–43. [Google Scholar]
  36. Leleu, H. A linear programming framework for free disposal hull technologies and cost functions: Primal and dual models. Eur. J. Oper. Res. 2006, 168, 340–344. [Google Scholar] [CrossRef]
  37. Charnes, A.; Cooper, W.W.; Rhodes, E. Measuring the efficiency of decision making units. Eur. J. Oper. Res. 1978, 2, 429–444. [Google Scholar] [CrossRef]
  38. Cook, W.D.; Seiford, L.M. Data envelopment analysis (DEA)—Thirty years on. Eur. J. Oper. Res. 2009, 192, 1–17. [Google Scholar] [CrossRef]
  39. Bai, Y.; Deng, X.; Jiang, S.; Zhang, Q.; Wang, Z. Exploring the relationship between urbanization and urban eco-efficiency: Evidence from prefecture-level cities in China. J. Clean. Prod. 2018, 195, 1487–1496. [Google Scholar] [CrossRef]
  40. Li, Y.; Li, Y.; Zhou, Y.; Shi, Y.; Zhu, X. Investigation of a coupling model of coordination between urbanization and the environment. J. Environ. Manag. 2012, 98, 127–133. [Google Scholar] [CrossRef]
  41. Tang, Z. An integrated approach to evaluating the coupling coordination between tourism and the environment. Tour. Manag. 2015, 46, 11–19. [Google Scholar] [CrossRef]
  42. Wang, S.J.; Fang, C.L.; Wang, Y. Quantitative investigation of the interactive coupling relationship between urbanization and eco-environment. Acta Ecol. Sin. 2015, 35, 2244–2254. [Google Scholar]
  43. Yao, J.; Xu, P.; Huang, Z. Impact of urbanization on ecological efficiency in China: An empirical analysis based on provincial panel data. Ecol. Indic. 2021, 129, 107827. [Google Scholar] [CrossRef]
  44. Guo, L. Coupling coordination degree between new urbanization and eco-environment in shaanxi, China, and its influencing factors. Discret. Dyn. Nat. Soc. 2021, 2021. [Google Scholar] [CrossRef]
  45. Fang, C.; Cui, X.; Li, G.; Bao, C.; Wang, Z.; Ma, H.; Sun, S.; Liu, H.; Luo, K.; Ren, Y. Modeling regional sustainable development scenarios using the Urbanization and Eco-environment Coupler: Case study of Beijing-Tianjin-Hebei urban agglomeration, China. Sci. Total Environ. 2019, 689, 820–830. [Google Scholar] [CrossRef] [PubMed]
  46. Shao, Z.; Ding, L.; Li, D.; Altan, O.; Huq, M.; Li, C. Exploring the relationship between urbanization and ecological environment using remote sensing images and statistical data: A case study in the Yangtze River Delta, China. Sustainability 2020, 12, 5620. [Google Scholar] [CrossRef]
  47. Wu, Z.; Li, Z.; Zeng, H. Using remote sensing data to study the coupling relationship between urbanization and eco-environment change: A case study in the Guangdong–Hong Kong–Macao greater bay area. Sustainability 2020, 12, 7875. [Google Scholar] [CrossRef]
  48. Zoppi, C.; Lai, S. Urban development and expenditure efficiency in the 2000–2006 regional operational program of Sardinia. Land Use Policy 2011, 28, 472–485. [Google Scholar] [CrossRef]
  49. Zhao, J.; Liu, Y.; Zhu, Y.; Qin, S.; Wang, Y.; Miao, C. Spatiotemporal differentiation and influencing factors of the coupling and coordinated development of new urbanization and ecological environment in the Yellow River Basin. Resour. Sci. 2020, 42, 01000159. [Google Scholar] [CrossRef]
  50. Liu, K.; Qiao, Y.; Shi, T.; Zhou, Q. Study on coupling coordination and spatiotemporal heterogeneity between economic development and ecological environment of cities along the Yellow River Basin. Environ. Sci. Pollut. Res. 2021, 28, 6898–6912. [Google Scholar] [CrossRef]
  51. Ren, F.; Yu, X. Coupling analysis of urbanization and ecological total factor energy efficiency—A case study from Hebei province in China. Sustain. Cities Soc. 2021, 74, 103183. [Google Scholar] [CrossRef]
  52. Geng, Y.; Zhang, H. Coordination assessment of environment and urbanization: Hunan case. Environ. Monit. Assess. 2020, 192, 637. [Google Scholar] [CrossRef]
Figure 1. Distribution of urban agglomerations in the Yellow River basin, China.
Land 11 00882 g001
Figure 2. Heat map of urbanization efficiency of urban agglomerations in the Yellow River basin, China.
Land 11 00882 g002
Figure 3. Spatial patterns of urbanization efficiency in (a) 2006, (b) 2010, (c) 2014, and (d) 2019 in the Yellow River basin, China.
Land 11 00882 g003
Figure 4. Heat map of ecological efficiency of urban agglomerations in the Yellow River basin, China.
Land 11 00882 g004
Figure 5. Spatial patterns of ecological efficiency in (a) 2006, (b) 2010, (c) 2014, and (d) 2019 in the Yellow River basin, China.
Land 11 00882 g005
Figure 6. LISA agglomeration map of urbanization efficiency and ecological efficiency in the Yellow River basin, China.
Land 11 00882 g006
Figure 7. The relative development of urbanization efficiency and ecological efficiency in cities in the Yellow River basin, China. (a): 2006, (b): 2010, (c): 2014, (d): 2019.
Land 11 00882 g007
Figure 8. The degree of spatial coupling of urbanization efficiency and ecological efficiency in (a) 2006, (b) 2010, (c) 2014, and (d) 2019 in the Yellow River basin, China.
Land 11 00882 g008
Table 1. Evaluation index system of urbanization efficiency and ecological efficiency.
PurposeInput and output variablesCriteriaIndicatorsUnit
Urbanization efficiencyInput variablesLand elements inputBuilt-up areakm2
Human capital inputNon-agricultural population104person
Capital element inputFinancial expenditure
Total investment in fixed assets
108Yuan
108Yuan
Output variablesScale of the urban economyTotal value of the secondary and tertiary industries108Yuan
Level of social consumptionTotal retail sales of social consumer goods108Yuan
Ecological efficiencyInput variablesCapital elements inputTotal investment in fixed assets108Yuan
Labor factors inputTotal number of employed persons104person
Resource elements inputTotal amount of water supply
Electricity consumption of city
Land area of administrative region
106m3
1012kwh
102km2
Output variablesScale of the city's economyThe regional GDP1012Yuan
Level of ecological benefitsSewage discharge
Exhaust gas emissions
Soot emissions
106m3
106t
106t
Table 2. Descriptive statistics of input and output variables.
Input and Output VariablesUnitObsMinimunMaximumMeanStandard
Deviation
Built-up areakm284012.00758.16122.41107.01
Non-agricultural population104 person84046.351773.90243.05150.99
Financial expenditure a108 Yuan84012.311215.89196.42150.22
Total investment in fixed assets a108 Yuan84043.735740.641091.11892.01
Total value of the secondary and tertiary industries a108 Yuan84077.307613.151341.491127.75
Total retail sales of social consumer goods a108 Yuan84025.413388.01576.18551.95
Total number of employed persons104 person84011.81713.5495.9784.97
Total amount of water supply106 m38407.60892.59108.46107.15
Electricity consumption of city1012 kwh8401.051267.52111.99131.35
Land area of administrative region102 km284020.71868.82129.32119.47
The regional GDP a1012 Yuan84083.637866.451473.701164.81
Sewage discharge106 m38403.17281.9165.9249.88
Exhaust gas emissions106 t84010.033371.64664.05564.27
Soot emissions106 t8402.9631,538.22388.671170.35
a At 2006 price.
Publisher’s Note: MDPI stays neutral with regard to jurisdictional claims in published maps and institutional affiliations.

