
Walking Accessibility to the Bus Stop: Does It Affect Residential Rents? The Case of Jinan, China


Abstract
:1. Introduction
2. Data and Methods
2.1. Data
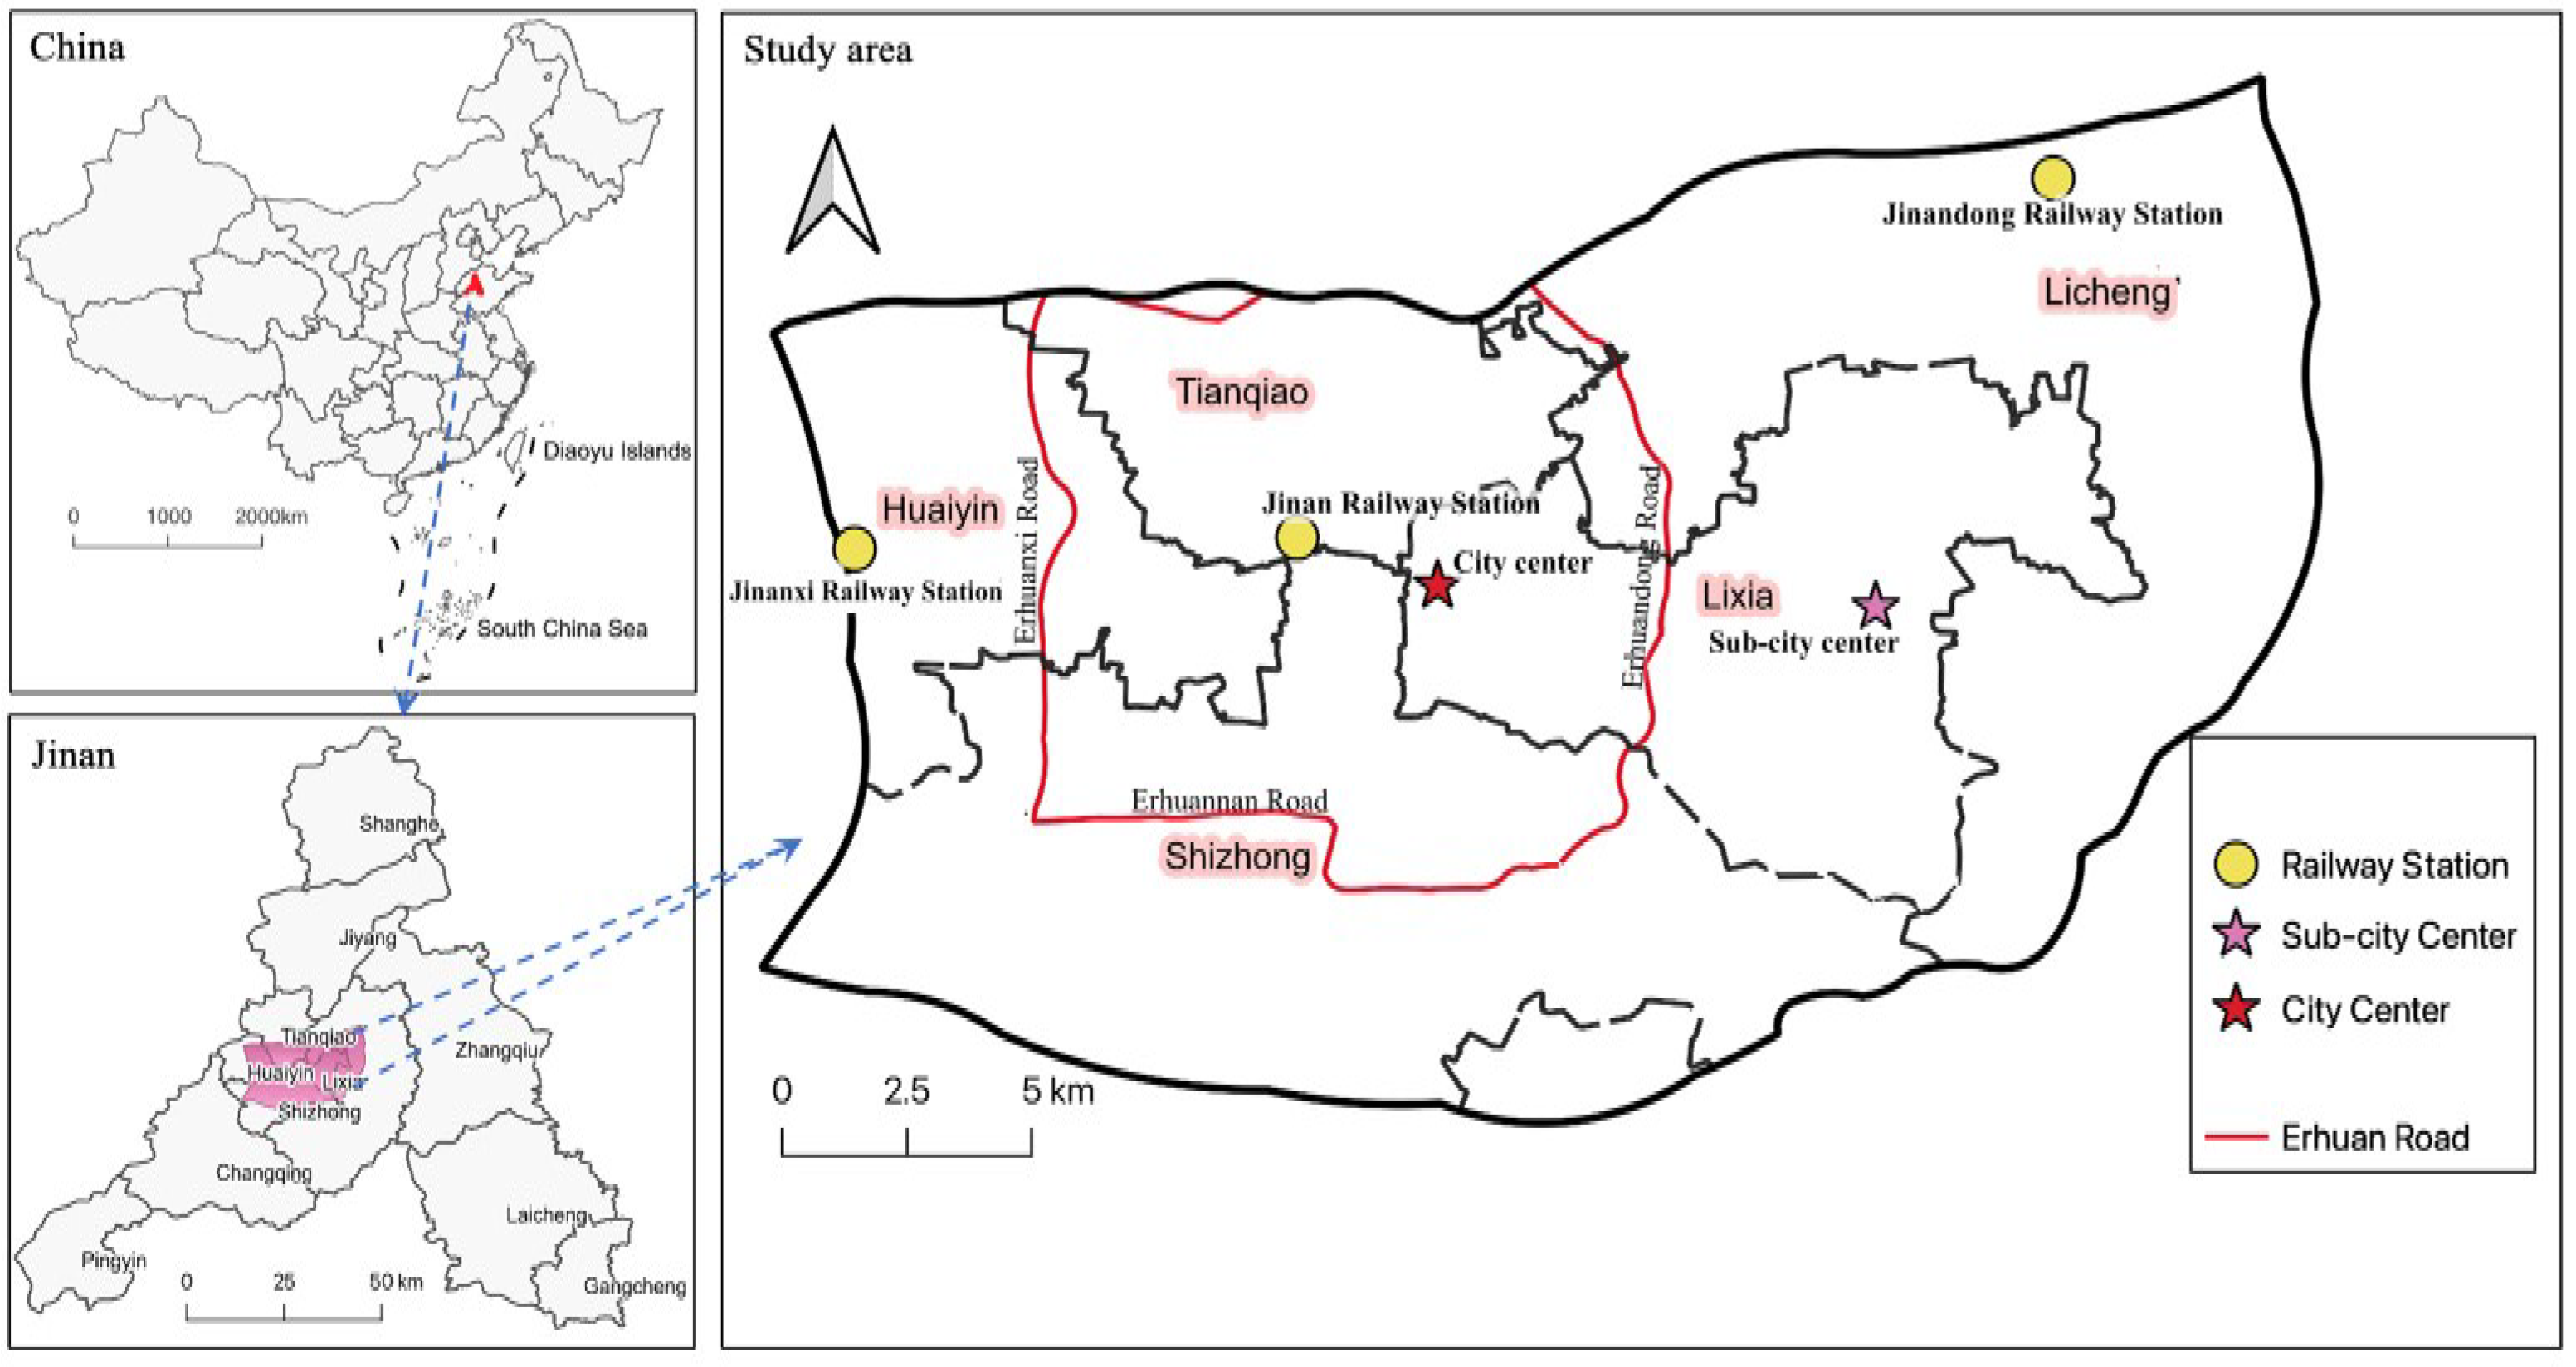
2.1.1. Study Area
2.1.2. Data Source
2.1.3. Indicator System
2.2. Methods
2.2.1. Evaluation of the Walking Accessibility to the Bus Stop
2.2.2. OLS and GWR Model
3. Results
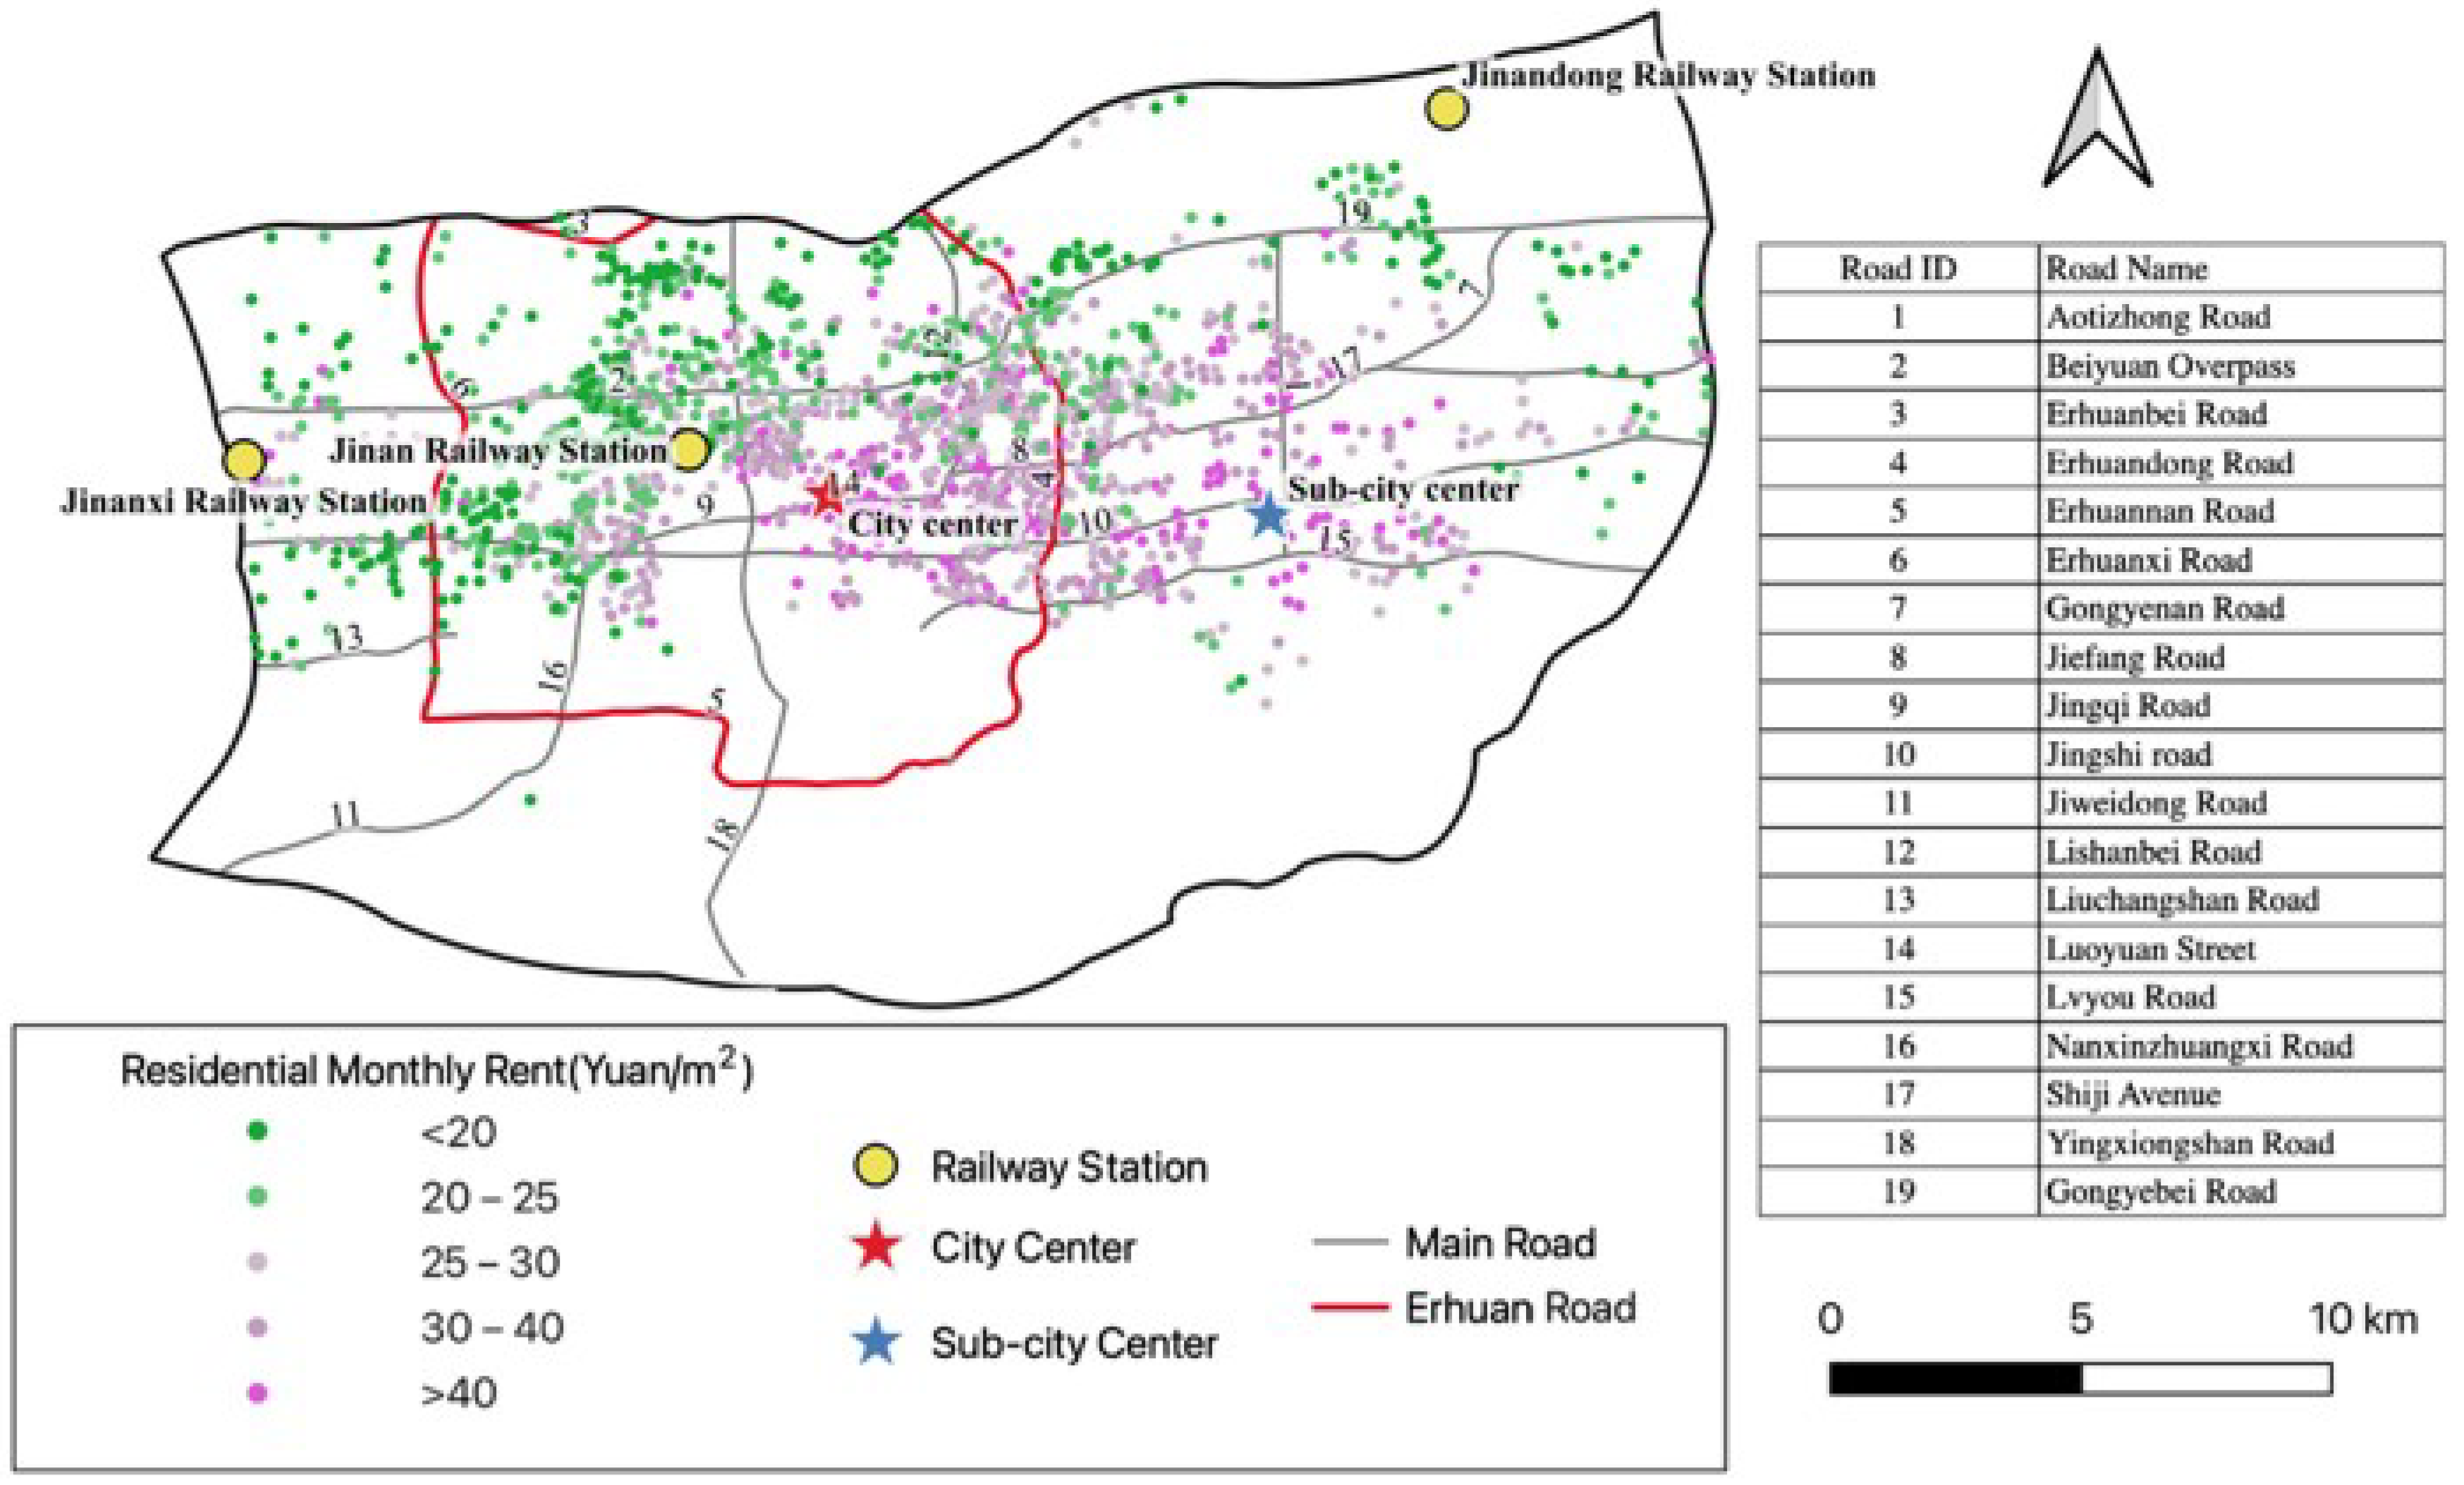
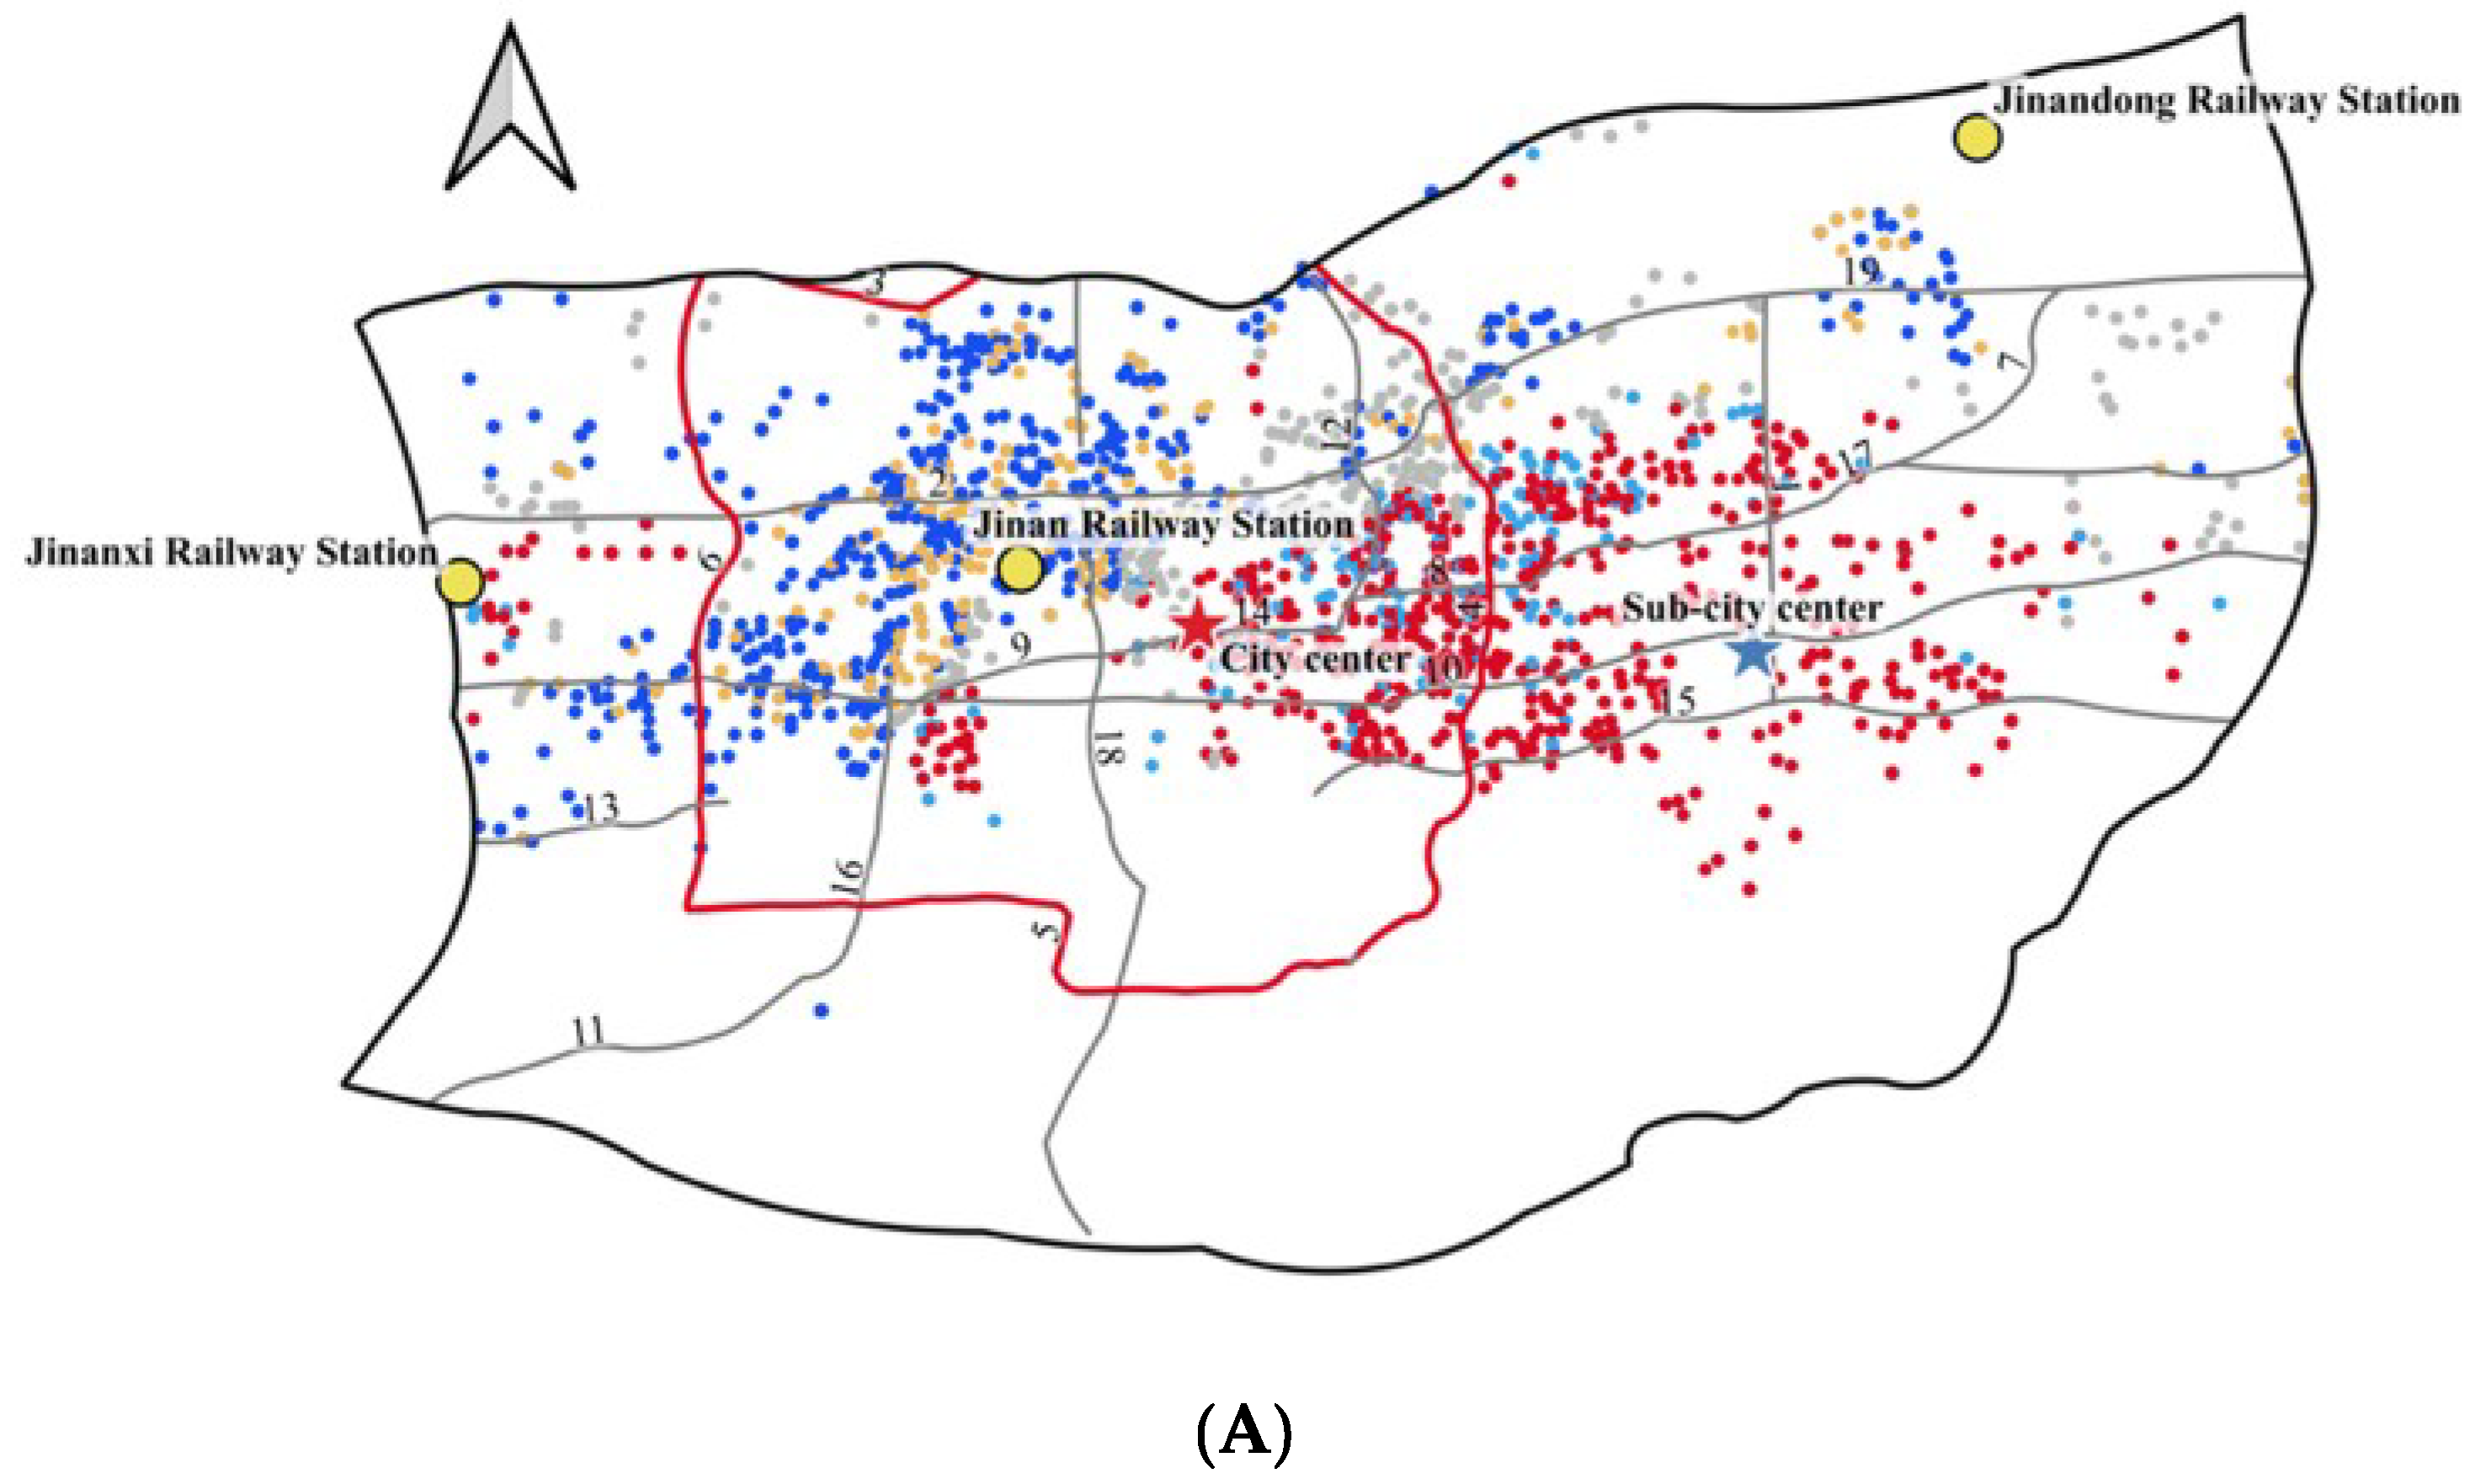
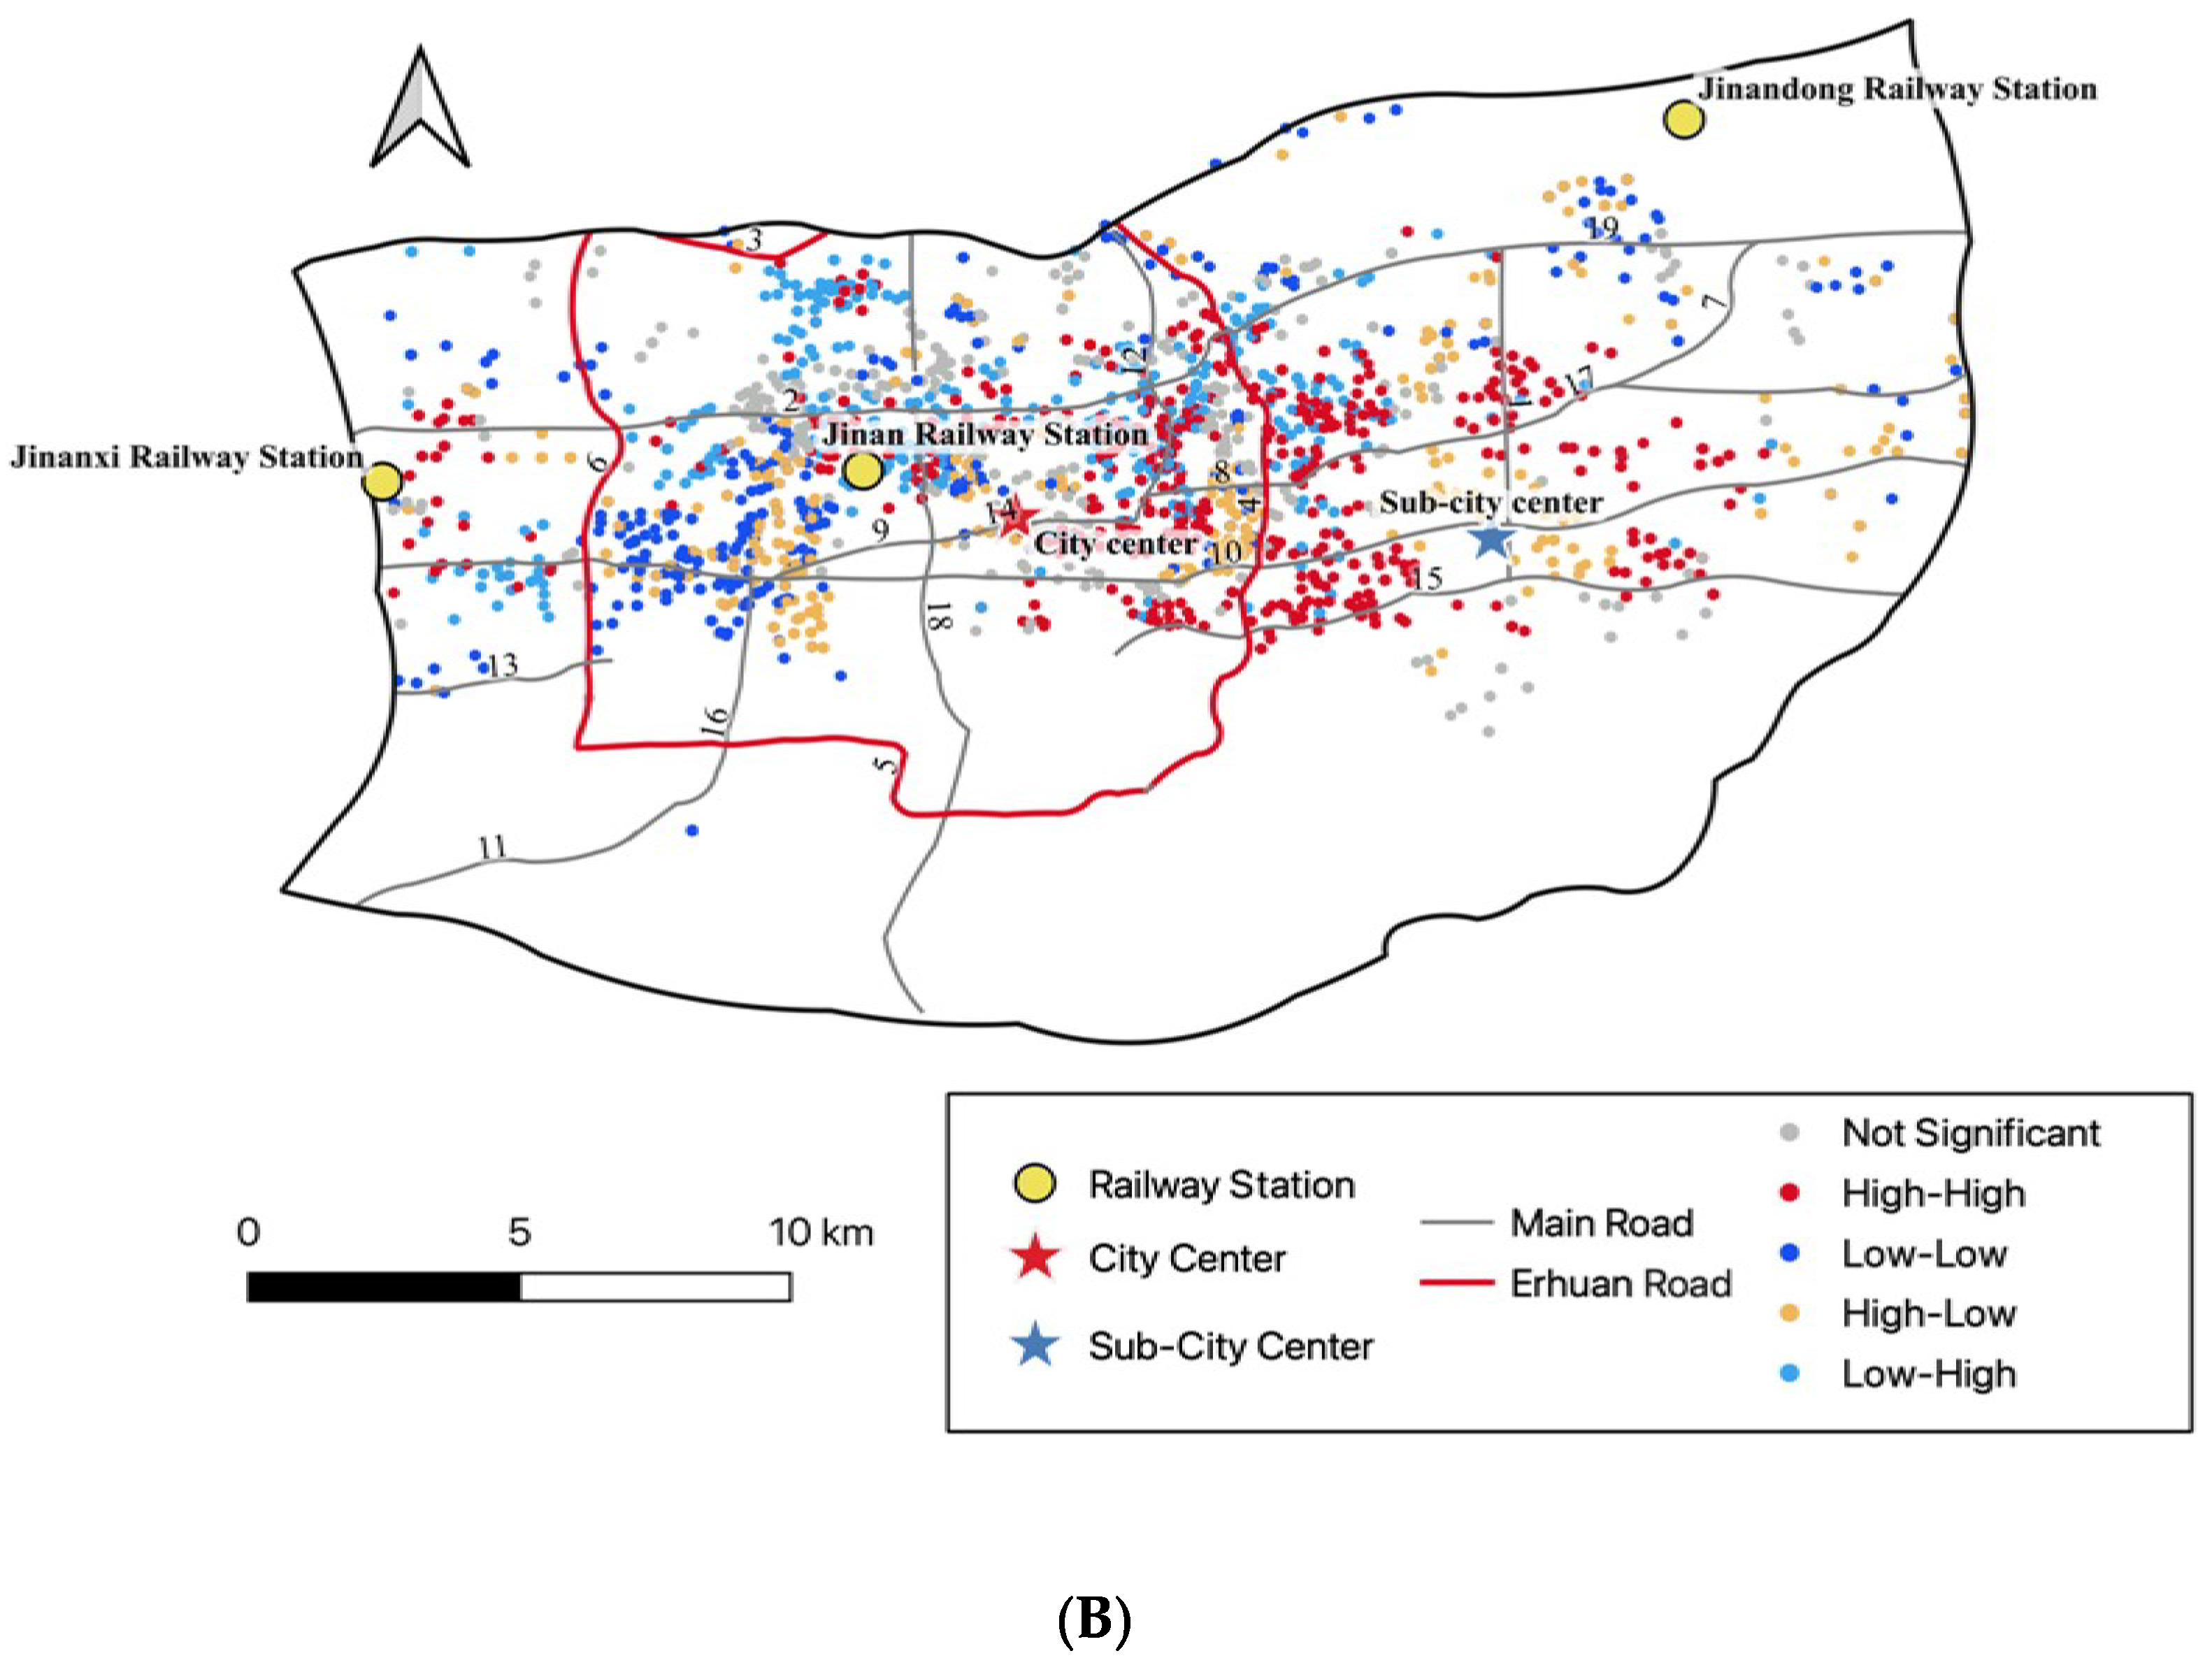
3.1. Spatial Pattern and Spatial Correlation Analysis of Residential Rents
3.2. The Effect of Walking Accessibility to the Bus Stop on Residential Rents
3.2.1. OLS Model Results
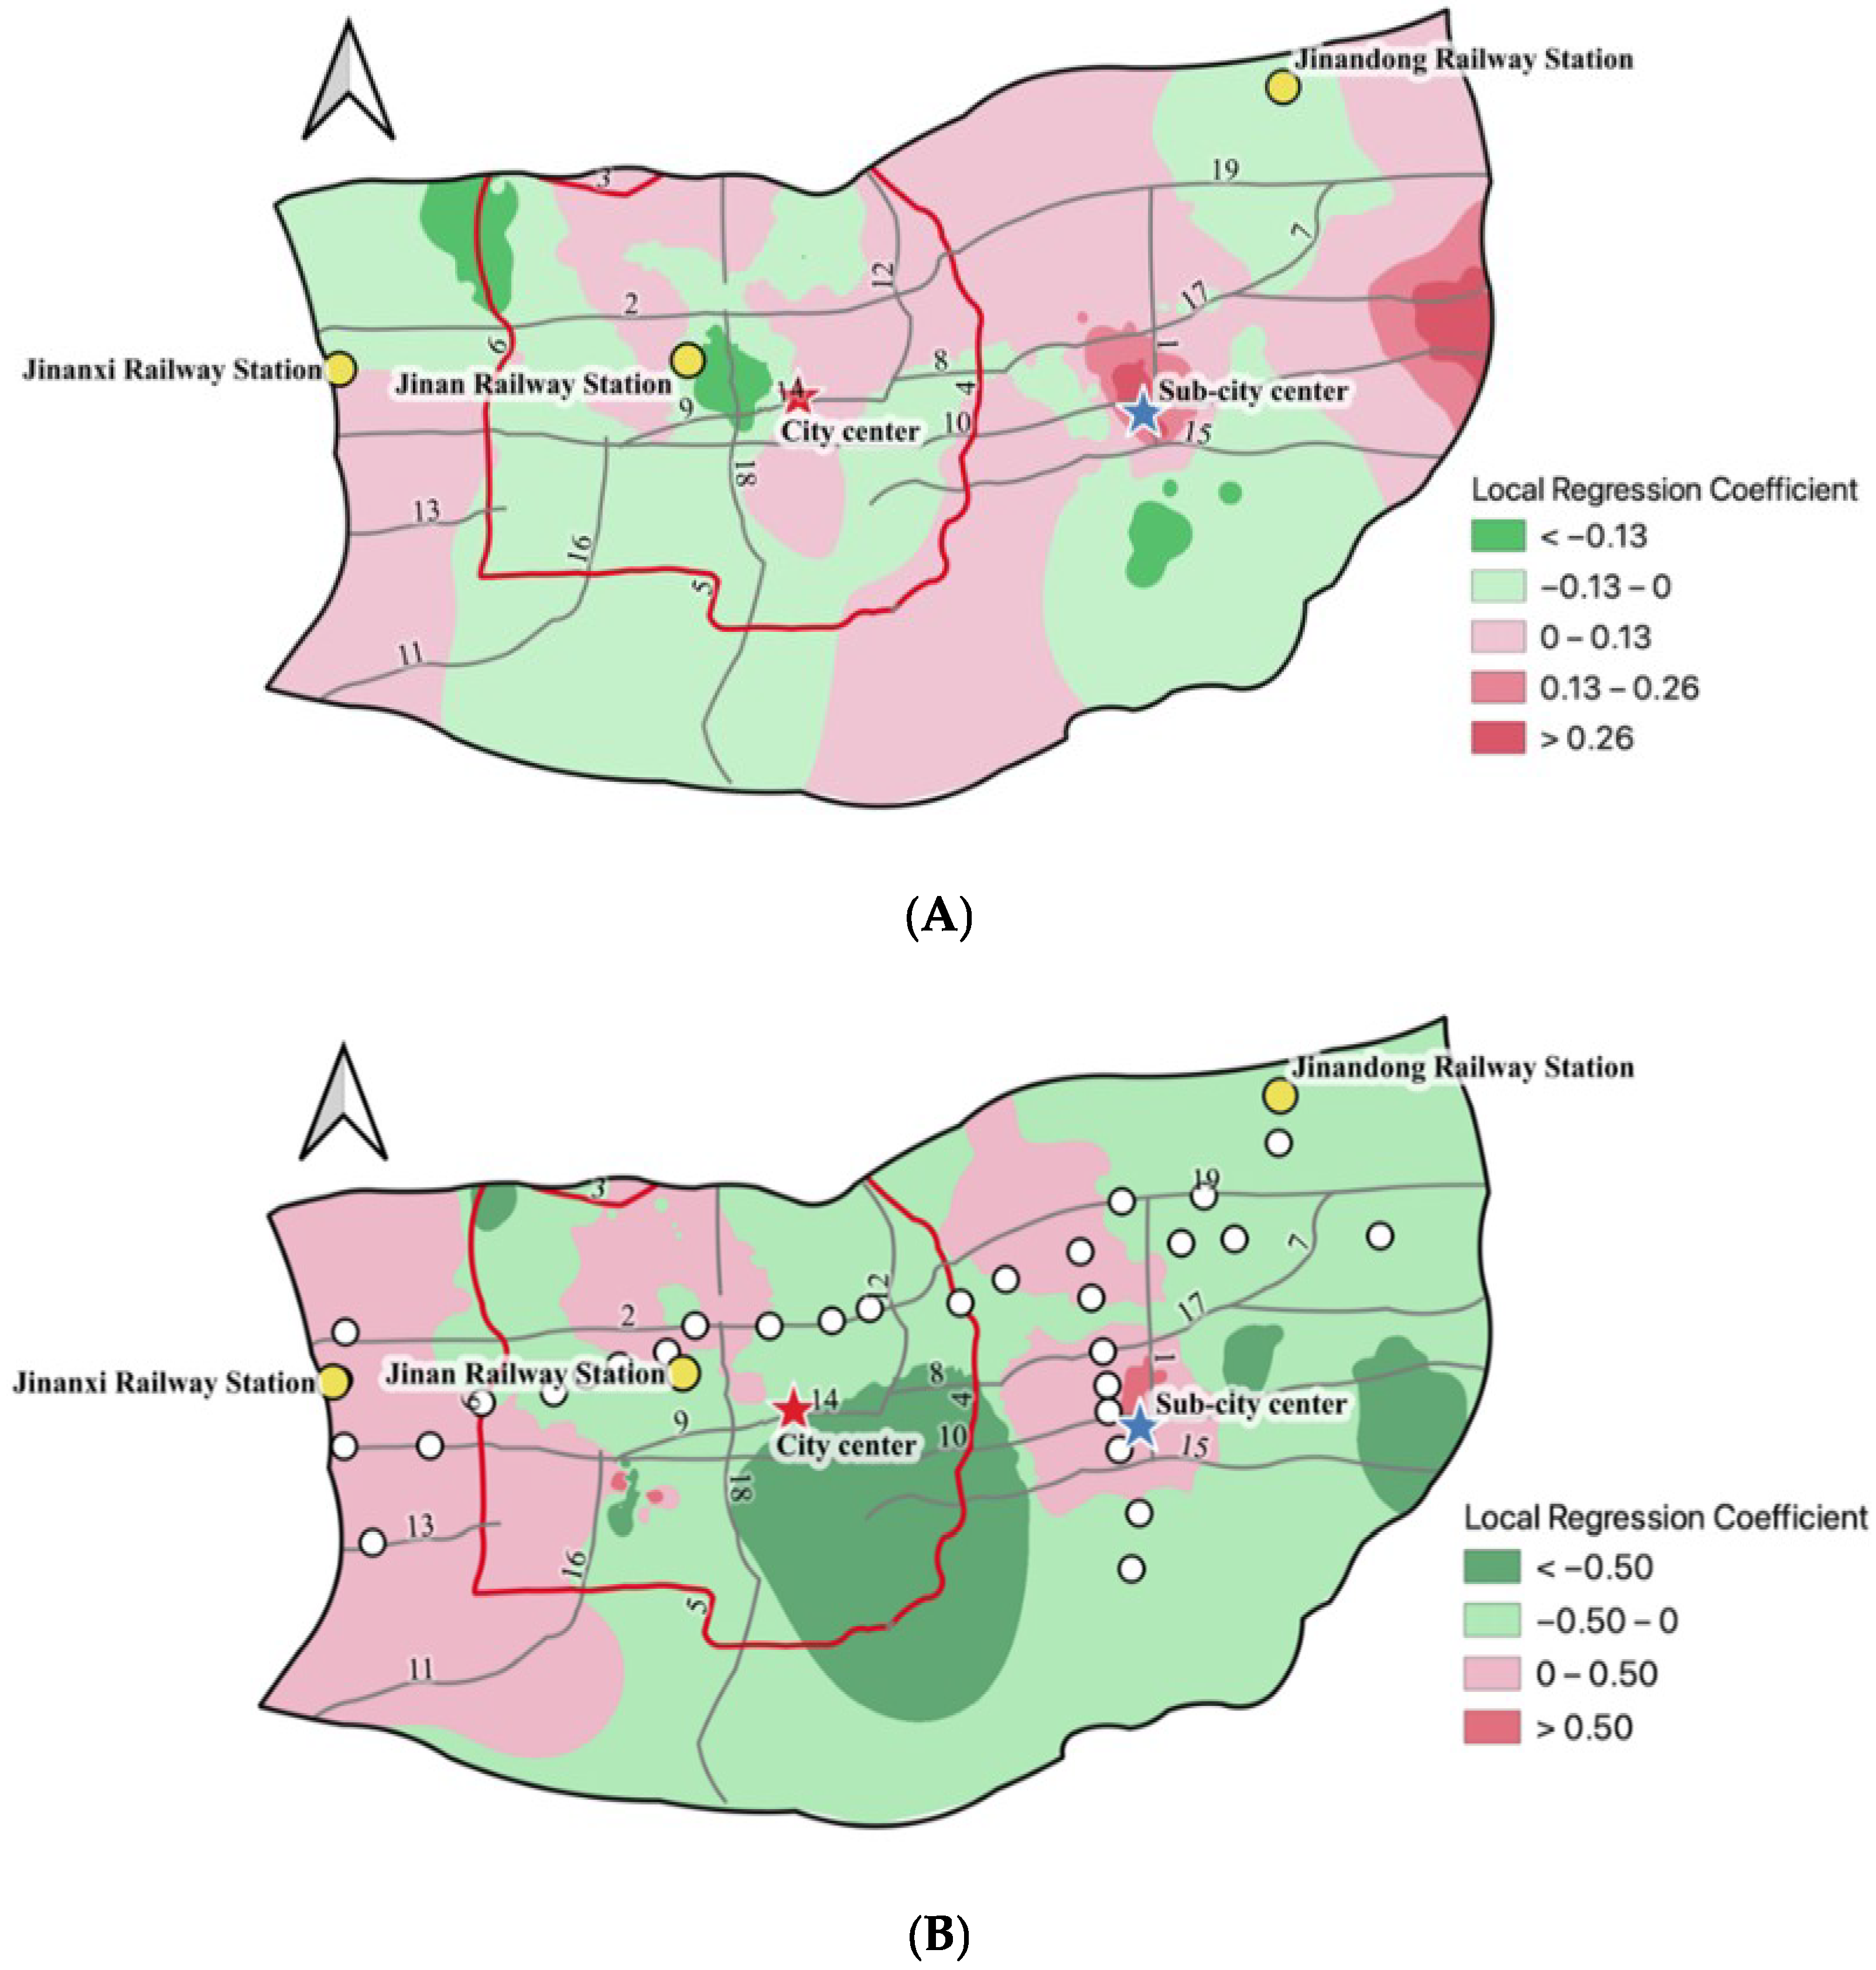
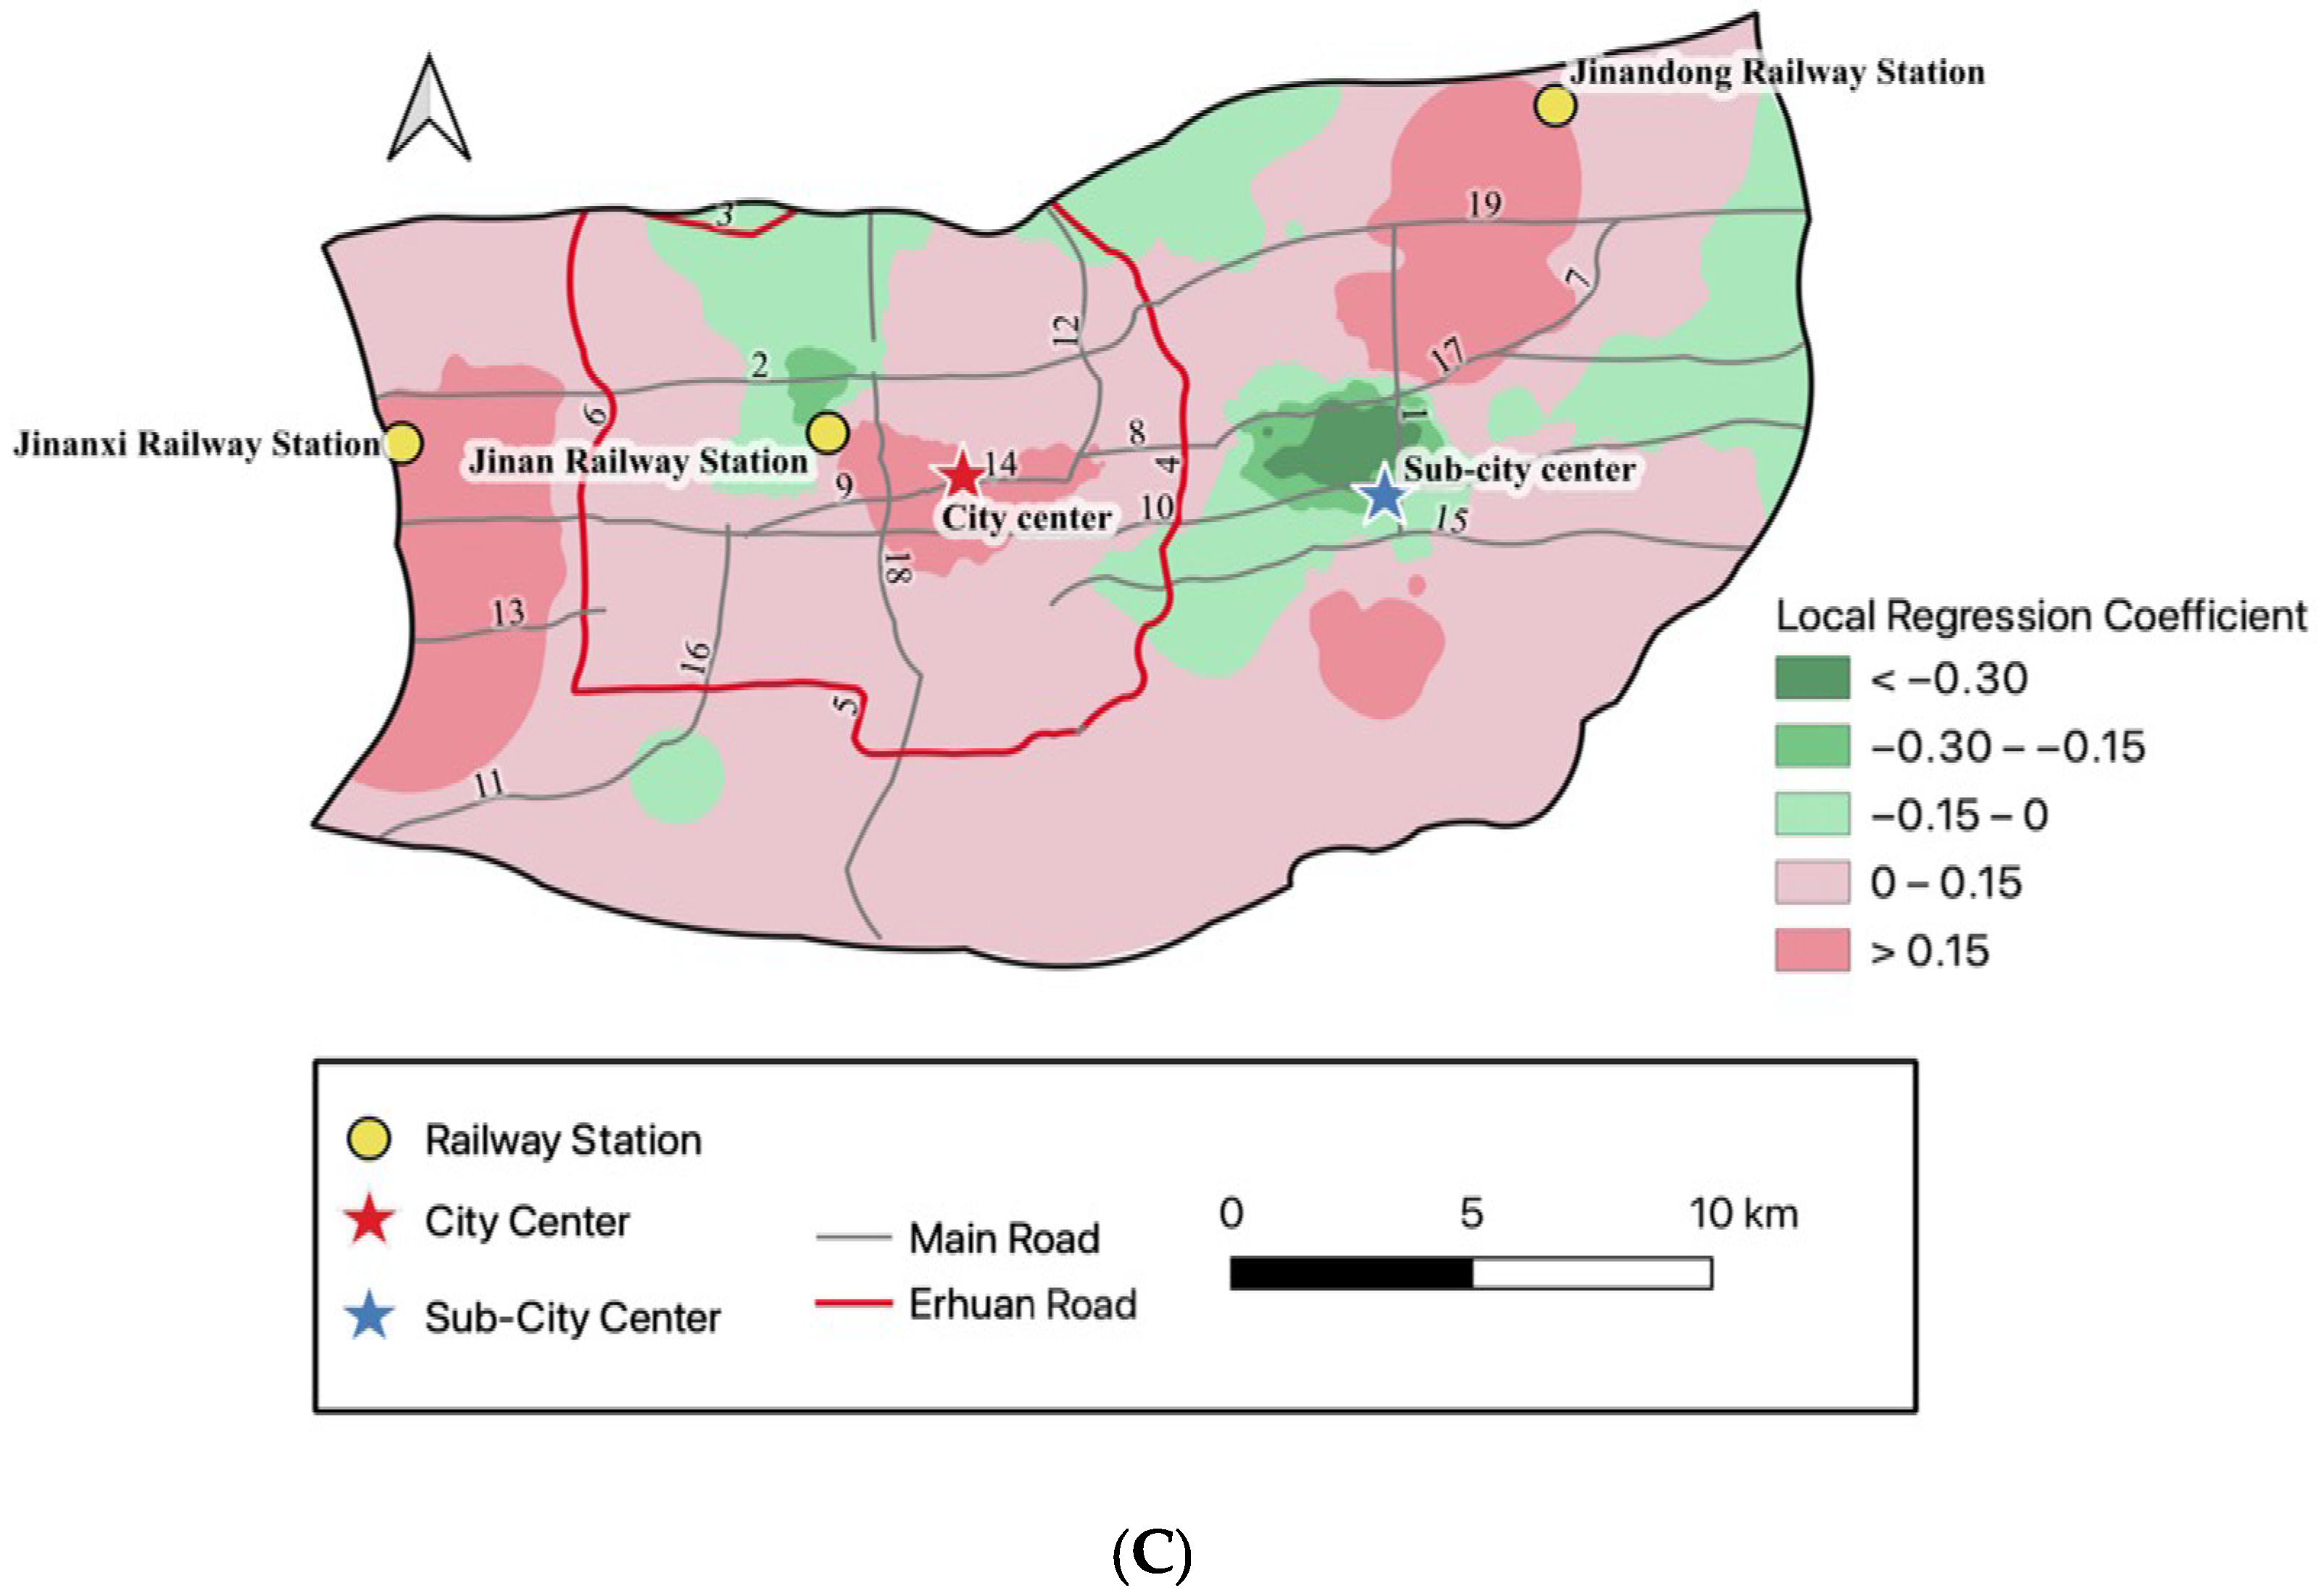
3.2.2. GWR Model Results
3.2.3. Heterogeneity Analysis
Heterogeneity Analysis of Residential Location
Heterogeneity Analysis of Bus Stop Neighbourhood Scale
4. Discussion
4.1. Scientificity and Accuracy of Walking Accessibility to the Bus Stop
4.2. The Effect of the Walking Accessibility to the Bus Stop on Residential Rents
4.3. Limitations
5. Conclusions
- (1)
- Residential rent levels in Jinan show evident spatial dependence and spatial heterogeneity. The bivariate local autocorrelation results indicate that in the Jinan city centre and sub-city centre, both residential rent levels and walking accessibility to the bus stop reflect a ‘high-high correlation’ distribution, showing a pattern of coupling and correlation between ‘dual city centre’ and ‘dual traffic centre’. In contrast, ‘high rent, low accessibility (high–low)’ residences are mostly distributed in the south-eastern part of the city, while ‘low rent, high accessibility (low–high)’ residences are mostly distributed in the north-western part of the city.
- (2)
- GWR results show that walking accessibility to the bus stop could significantly improve residential rent levels. On the spatial scale, a 1% increase in walking accessibility could result in a premium of up to 0.427% and may also lead to a decline in rental prices to 2.984%. However, a residence’s proximity to a subway does not necessarily lead to higher rent. Further, residential rent levels increase in most areas close to bus lines. However, due to negative externalities such as traffic congestion and environmental pollution, the nuisance effect generated by this proximity will also reduce the premium effect of renting.
- (3)
- The results of the heterogeneity analysis show that as the distance between a residential area and the city centre increases, the impact of walking accessibility to the bus stop on rental prices increases. Specifically, it has a higher impact on residential rent levels in the outer suburbs, while having little impact on the rent in residences closer to the city centre, conforming to the law of ‘diminishing marginal effect’ of willingness to rent. Besides, with the increase of the distance to the bus stop, the marginal effect of the walking accessibility to the bus stop on the residential rents shows the trend of ‘first increase and then decrease’. Moreover, it has the most significant premium effect in residences within 500–900 m of a bus stop.
Author Contributions
Funding
Institutional Review Board Statement
Informed Consent Statement
Data Availability Statement
Conflicts of Interest
| 1. | This report “Jinan Residents Travel Survey Report” is published by Jinan Urban and Rural Transportation Bureau in 2019. |
| 2. | The hedonic rent model formula is lnY = aX + bM + A + v, where X represents other control variables, M is the dummy variable of well-decorated residences, A is the constant, and v is the error. Therefore, for a well-decorated residence, lnY1 = aX + b + A + v, for a less decorated residence, lnY2 = aX + A + v, and the rental premium of a well-decorated residence over that of a less decorated residence is Y1/Y2 − 1 = e lnY1−lnY2 − 1 = eb − 1. |
| 3. | The hedonic rent model formula is lnY = aX′ + bM1 + cM2 + dM3 + fM1lnX + gM2lnX + kM3lnX + A + v, where M is a dummy variable for the distance to the city centre, such that M1 means within 2km from the city centre, M2 means 5–10 km away from the city centre, and M3 means more than 10 km away from the city. lnX represents walking accessibility (take the mean value. lnX = 0.8973, if M1 = 1, M2 = 0, M3 = 0; lnX = 0.8653, if M1 = 0, M2 = 1, M3 = 0; lnX = 0.5928, if M1 = 0, M2 = 0, M3 = 1). X′ is other control variable. Therefore, for residences within 2 km of the city centre, lnY1 = aX′ + b+flnX + A + v, for residences within 2–5 km from the city centre, lnY2 = aX′ + A + v, and the rental premium of residences within 2 km over that of those within 2–5 km is Y1/Y2 − 1 = e lnY1−lnY2 − 1 = eb+flnX − 1. |
References
- Wang, Y.; Wu, K.; Zhang, H. The core influencing factors of residential rent differences in the central urban area of Guangzhou. J. Geog. 2021, 76, 1924–1938. (In Chinese) [Google Scholar]
- Huang, Y.; Wang, C.; Zhang, C.; Chen, X. Establish the long-term mechanism for the development of China’s housing rental market. Price Theory Pract. 2017, 7, 17–21. (In Chinese) [Google Scholar]
- Alonso, W. Location and Land Use; Harvard University Press: Cambridge, MA, USA, 1964. [Google Scholar]
- Ministry of Natural Resources of the People’s Republic China. Spatial Planning Guidance: Community Life Unit. Available online: http://gi.mnr.gov.cn/202105/t20210526_2633012.html (accessed on 5 January 2022).
- Hansen, W.G. How accessibility shapes land use. J. Am. Inst. Plan. 1959, 25, 73–76. [Google Scholar] [CrossRef]
- Yang, L.; Zhang, X.; Hong, S. The impact of walking accessibility of public service facilities on residential prices: Accessibility measurement method based on cumulative opportunities. South. Econ. 2016, 1, 57–70. (In Chinese) [Google Scholar]
- Liu, B. Urban development and land economy. J. Urban Plan. 2014, 5, 120–121. (In Chinese) [Google Scholar]
- Kang, C. Spatial access to metro transit villages and housing prices in Seoul, Korea. J. Urban Plan. Dev. 2019, 145, 05019010. [Google Scholar] [CrossRef]
- Zhai, S.; He, X.; Kong, Y.; Luo, J.; Song, G. Spatial accessibility analysis of public facilities based on optimal supply and demand allocation. J. Geogr. 2022, 77, 1028–1038. (In Chinese) [Google Scholar]
- Aman, J.; Smith-Colin, J. Transit Deserts: Equity analysis of public transit accessibility. J. Transp. Geogr. 2020, 89, 102869. [Google Scholar] [CrossRef]
- Di Ciommo, F.; Shiftan, Y. Transport equity analysis. Transp. Rev. 2017, 37, 139–151. [Google Scholar] [CrossRef] [Green Version]
- Lancaster, K.J. A new approach to consumer theory. J. Pol. Econ. 1966, 74, 132–157. [Google Scholar] [CrossRef]
- Rosen, S. Hedonic prices and implicit markets: Product differentiation in pure competition. J. Pol. Econ. 1974, 82, 34–55. [Google Scholar] [CrossRef]
- Kim, J.; Zhang, M. Determining transit’s impact on Seoul commercial land values: An application of spatial econometrics. Int. Real Estate Rev. 2005, 8, 1–26. [Google Scholar] [CrossRef]
- Siripanich, A.; Rashidi, T.H.; Moylan, E. Interaction of public transport accessibility and residential property values using smart card data. Sustainability 2019, 11, 2709. [Google Scholar] [CrossRef] [Green Version]
- Füss, R.; Koller, J. The role of spatial and temporal structure for residential rent predictions. Int. J. Forecast. 2016, 32, 1352–1368. [Google Scholar] [CrossRef]
- Tomal, M. Modelling housing rents using spatial autoregressive geographically weighted regression: A case study in Cracow, Poland. ISPRS Int. J. Geo-Inf. 2020, 9, 346. [Google Scholar] [CrossRef]
- Wang, J.; Ji, M.; Deng, Z. Analysis of the causes of the distribution of residential rents in the outer ring of Shanghai based on the geographically weighted hedonic price method. Reg. Res. Dev. 2016, 35, 72–80. (In Chinese) [Google Scholar]
- Tang, W.; Xiao, Q.; Yan, H.; Chen, Y. Spatial differentiation of residential rents along urban rail transit: The case of metro line 1, line 2 and line 4 in Changsha. Econ. Geog. 2021, 41, 100–108. (In Chinese) [Google Scholar]
- Du, C.; Wang, J.; Liu, B.; Huang, D. Research on the influence of urban road and public transportation network centrality on residential rental prices: A case study of Beijing. Adv. Geog. 2019, 38, 1831–1842. (In Chinese) [Google Scholar]
- Leung, K.M.; Yiu, C.Y. Rent determinants of sub-divided units in Hong Kong. J. Hous. Built. Environ. 2019, 34, 133–151. [Google Scholar] [CrossRef]
- Cui, N.; Gu, H.; Shen, T.; Feng, C. The impact of micro-level influencing factors on home value: A housing price-rent comparison. Sustainability 2018, 10, 4343. [Google Scholar] [CrossRef] [Green Version]
- Yang, L.; Zhou, J.; Shyr, O.F. Does bus accessibility affect property prices? Cities 2019, 84, 56–65. [Google Scholar] [CrossRef]
- Benjamin, J.; Sirmans, G.; Wang, K. Mass transportation, apartment rent and property values. J. Real Estate Res. 1996, 12, 1–8. [Google Scholar]
- Du, H.; Mulley, C. Relationship between transport accessibility and land value: Local model approach with geographically weighted regression. Transp. Res. Rec. 2006, 1977, 197–205. [Google Scholar] [CrossRef]
- Jun, M.; Choi, K.; Jeong, J.-E.; Kwon, K.-H.; Kim, H.-J. Land use characteristics of subway catchment areas and their influence on subway ridership in Seoul. J. Transp. Geogr. 2015, 48, 30–40. [Google Scholar] [CrossRef]
- Ye, X.; Feng, A. Data statistics and development analysis of China’s urban rail transit in 2020. Tunnel Constr. 2021, 41, 871–876. (In Chinese) [Google Scholar]
- Shen, Q.; Xu, S.; Lin, J. Effects of bus transit-oriented development (BTOD) on single-family property value in Seattle metropolitan area. Urban Stud. 2018, 55, 2960–2979. [Google Scholar] [CrossRef]
- Jinan Municipal Planning Bureau. Urban Overall Planning in Jinan (2011–2020). Available online: http://nrp.jinan.gov.cn/art/2016/8/29/art_43843_3510694.html (accessed on 8 May 2021).
- Bureau of Statistics of Jinan. Jinan Statistical Year Book; China Statistic Press: Beijing, China, 2021. [Google Scholar]
- Liu, Q.; Zhao, P.; Yuan, Y.; Xu, X.; Zhou, P. Research on the construction of urban green transportation system under the carbon neutrality target: The case of Jinan. Environ. Prot. 2021, 49, 33–39. (In Chinese) [Google Scholar]
- Zhang, M.; Wang, L. The impacts of mass transit on land development in China: The case of Beijing. Res. Transp. Econ. 2013, 40, 124–133. [Google Scholar] [CrossRef]
- Yang, J.; Bao, Y.; Zhang, Y.; Li, X.; Ge, Q. Impact of accessibility on housing prices in Dalian city of China based on a geographically weighted regression model. Chin. Geogr. Sci. 2018, 28, 505–515. [Google Scholar] [CrossRef] [Green Version]
- Pan, Q.; Pan, H.; Zhang, M.; Zhong, B. Effects of rail transit on residential property values: Comparison study on the rail transit lines in Houston, Texas, and Shanghai, China. Transp. Res. Rec. 2014, 2453, 118–127. [Google Scholar] [CrossRef]
- Yang, L.; Chau, K.; Szeto, W.; Cui, X.; Wang, X. Accessibility to transit, by transit, and property prices: Spatially varying relationships. Transp. Res. Part D Transp. Environ. 2020, 85, 102387. [Google Scholar] [CrossRef]
- Li, S.; Chen, L.; Zhao, P. The impact of metro services on housing prices: A case study from Beijing. Transportation 2019, 46, 1291–1317. [Google Scholar] [CrossRef]
- Yang, L.; Chu, X.; Gou, Z.; Yang, H.; Lu, Y.; Huang, W. Accessibility and proximity effects of bus rapid transit on housing prices: Heterogeneity across price quantiles and space. J. Transp. Geogr. 2020, 88, 102850. [Google Scholar] [CrossRef]
- Jin, S.; Yang, J.; Wang, E.; Liu, J. The influence of high-speed rail on ice–snow tourism in northeastern China. Tour. Manag. 2020, 78, 104070. [Google Scholar] [CrossRef]
- Yang, J.; Guo, A.; Li, X.; Huang, T. Study of the impact of a high-speed railway opening on China’s accessibility pattern and spatial equality. Sustainability 2018, 10, 2943. [Google Scholar] [CrossRef] [Green Version]
- Wen, H.; Gui, Z.; Tian, C.; Xiao, Y.; Fang, L. Subway opening, traffic accessibility, and housing prices: A quantile hedonic analysis in Hangzhou, China. Sustainability 2018, 10, 2254. [Google Scholar] [CrossRef] [Green Version]
- Sevtsuk, A.; Mekonnen, M. Urban network analysis. A new toolbox for ArcGIS. Rev. Int. Géoma. 2012, 22, 287–305. [Google Scholar] [CrossRef]
- Sevtsuk, A.; Kalvo, R. Patronage of urban commercial clusters: A network-based extension of the Huff model for balancing location and size. Environ. Plan. B 2018, 45, 508–528. [Google Scholar] [CrossRef] [Green Version]
- Brunsdon, C.; Fotheringham, A.S.; Charlton, M.E. Geographically weighted regression: A method for exploring spatial nonstationarity. Geog. Anal. 1996, 28, 281–298. [Google Scholar] [CrossRef]
- Anselin, L.; Syabri, I.; Kho, Y. GeoDa: An Introduction to Spatial Data Analysis; Springer: Berlin/Heidelberg, Germany, 2010; pp. 73–89. [Google Scholar]
- Liang, X.; Liu, Y.; Qiu, T.; Jing, Y.; Fang, F. The effects of locational factors on the housing prices of residential communities: The case of Ningbo, China. Habitat Int. 2018, 81, 1–11. [Google Scholar] [CrossRef]
- Mulley, C. Accessibility and residential land value uplift: Identifying spatial variations in the accessibility impacts of a bus transitway. Urban Stud. 2016, 51, 1707–1724. [Google Scholar] [CrossRef]
- Wu, C.; Ren, F.; Hu, W.; Du, Q. Multiscale geographically and temporally weighted regression: Exploring the spatiotemporal determinants of housing prices. Int. J. Geogr. Inf. Sci. 2019, 33, 489–511. [Google Scholar] [CrossRef]
- Yang, J.; Li, C.; Li, Y.; Xi, J.; Ge, Q.; Li, X. Urban green space, uneven development and accessibility: A case of Dalian’s Xigang District. Chin. Geogr. Sci. 2015, 25, 644–656. [Google Scholar] [CrossRef]
- Munoz-Raskin, R. Walking accessibility to bus rapid transit: Does it affect property values? The case of Bogotá, Colombia. Transp. Policy 2010, 17, 72–84. [Google Scholar] [CrossRef]
- Xue, C.; Ju, Y.; Li, S.; Zhou, Q. Research on the sustainable development of urban housing price based on transport accessibility: A case study of Xi’an, China. Sustainability 2020, 12, 1497. [Google Scholar] [CrossRef] [Green Version]
- Jacobs, J. The Death and Life of Great American Cities; Vintage Books: New York, NY, USA, 1993. [Google Scholar]
- Cao, X.; Hough, J.A. Hedonic value of transit accessibility: An empirical analysis in a small urban area. J. Transp. Res. Forum 2008, 47, 170–183. [Google Scholar] [CrossRef] [Green Version]
- Li, H.; Wei, Y.D.; Wu, Y.; Tian, G. Analyzing housing prices in Shanghai with open data: Amenity, accessibility and urban structure. Cities 2019, 91, 165–179. [Google Scholar] [CrossRef]
- Wang, Y.; Potoglou, D.; Orford, S.; Gong, Y. Bus stop, property price and land value tax: A multilevel hedonic analysis with quantile calibration. Land Use Policy 2015, 42, 381–391. [Google Scholar] [CrossRef] [Green Version]
- Gu, Y.; Zheng, S. The impact of rail transit on housing prices and land development intensity: Taking Beijing Line 13 as an example. J. Geogr. 2010, 65, 213–223. (In Chinese) [Google Scholar]


| Attribute Classification | Explanatory Variables | Description | Analysis Method |
|---|---|---|---|
| Location attributes | Accessibility to the city centre | Time taken to get to the city centre by bus | Directions application program interface (API) in AutoNavi |
| Accessibility to the sub-city centre | Time taken to get to the sub-city centre by bus | ||
| Neighbourhood attributes | Distance to a shopping centre | The shortest distance to a nearby shopping centre, including large supermarkets, shopping malls, shopping centres | Nearest neighbour analysis in Arcgis |
| Distance to a tertiary hospital | The shortest distance to a tertiary hospital | ||
| Distance to primary and secondary schools | The shortest distance to primary and secondary schools | ||
| Distance to a park | The shortest distance to a park | ||
| Housing attributes | Number of floors | Discrete variable | Web crawl from Lianjia.com (accessed on 3 September 2021) |
| Number of toilets | Discrete variable | ||
| Housing size | Discrete variable | ||
| Well-decorated | Dummy variable (Yes = 1, No = 0) | ||
| Housing age | Discrete variable | ||
| Transportation attributes | Walking accessibility to bus stop | The number of bus stops within a network radius of 900 m from the residence, considering distance impedance and passenger weight (daily average ridership of bus stops) | Urban Network Analysis (UNA) |
| Proximity to a railway station | Dummy variable (whether it is located within 2000 m of the railway station, including Jinan Station, Jinandong Station, and Jinanxi Station) | Nearest neighbour analysis in Arcgis | |
| Proximity to a subway station | Dummy variable (whether it is located within 1000 m of the subway station) | ||
| Proximity to bus lines | Dummy variable (whether it is within 400 m of the bus line) |
| Variable | Coefficient | t Value | Standardized Coefficient | VIF |
|---|---|---|---|---|
| Walking accessibility to the bus stop | 0.0239 *** | 9.91 | 0.0685 | 1.15 |
| Proximity to a subway station | −0.101 *** | −12.96 | −0.0863 | 1.07 |
| Proximity to bus lines | 0.0288 *** | 4.17 | 0.0282 | 1.11 |
| Accessibility to the city centre | −0.0212 ** | −1.95 | −0.0135 | 1.17 |
| Accessibility to the sub-city centre | −0.2280 *** | −20.92 | −0.1498 | 1.24 |
| Well-decorated | 0.2677 *** | 44.34 | 0.2876 | 1.02 |
| Housing size | 0.5364 *** | 67.78 | 0.5435 | 1.56 |
| Number of toilets | 0.1053 *** | 13.58 | 0.1079 | 1.53 |
| Distance to a park | −0.0427 *** | −9.09 | −0.0610 | 1.09 |
| Distance to primary and secondary schools | −0.0348 *** | −8.71 | −0.0625 | 1.24 |
| Distance to a tertiary hospital | −0.0853 *** | −22.36 | −0.1635 | 1.29 |
| Constant | 8.226 *** | 74.12 | - | - |
| R2 | 0.4693 | |||
| F(11, 12843) | 946.24 | |||
| Prob(F-statistic) | <0.0001 | |||
| AIC | 8632.78 | |||
| Variable | Mean | Minimum | Median | Maximum |
|---|---|---|---|---|
| Walking accessibility to the bus stop | 0.013 | −2.984 | 0.022 | 0.427 |
| Accessibility to the city centre | −0.147 | −2.736 | −0.087 | 0.906 |
| Proximity to bus lines | 0.031 | −0.528 | 0.037 | 0.328 |
| Proximity to a subway station | −0.106 | −1.775 | −0.043 | 2.582 |
| Well-decorated | 0.17 | −0.078 | 0.171 | 0.342 |
| Number of toilets | 0.151 | −0.118 | 0.126 | 0.52 |
| Housing size | 0.699 | −0.325 | 0.736 | 1.304 |
| Distance to a tertiary hospital | 0.13 | −0.997 | 0.072 | 1.348 |
| Distance to a shopping mall | −0.041 | −0.473 | −0.047 | 0.25 |
| Distance to primary and secondary schools | −0.053 | −0.477 | −0.037 | 0.314 |
| Distance to a park | −0.131 | −1.078 | −0.105 | 0.201 |
| Constant | 0.114 | −1.846 | 0.223 | 2.615 |
| R2 | 0.762 | |||
| AIC | 4951.43 | |||
| Variable | Coefficient | t Value | VIF |
|---|---|---|---|
| Walking accessibility to the bus stop | 0.0181 *** | 7.46 | 4.48 |
| Proximity to a subway station | −0.1033 *** | −13.79 | 1.07 |
| Proximity to bus lines | 0.0154 ** | 2.30 | 1.12 |
| Accessibility to the sub-city centre | −0.2671 *** | −26.95 | 1.11 |
| Located within 2 km of the city centre | 0.1161 *** | 5.25 | 1.67 |
| Located 5–10 km away from the city centre | −0.2133 *** | −19.87 | 3.13 |
| Located more than 10 km from the city centre | −0.1849 *** | −14.67 | 4.76 |
| Located within 2 km of the city centre × Walking accessibility to the bus stop | 0.0608 *** | 4.82 | 1.60 |
| Located 5–10 km away from the city centre × Walking accessibility to the bus stop | 0.0528 *** | 8.98 | 3.38 |
| Located more than 10 km from the city centre × Walking accessibility to the bus stop | 0.0863 *** | 14.69 | 3.06 |
| Well-decorated | 0.2556 *** | 43.81 | 1.03 |
| Housing size | 0.5378 *** | 70.08 | 1.58 |
| Number of toilets | 0.1080 *** | 14.44 | 1.53 |
| Distance to a park | −0.0307 *** | −6.72 | 1.12 |
| Distance to primary and secondary schools | −0.0283 *** | −7.07 | 1.35 |
| Distance to a tertiary hospital | −0.0641 *** | −13.38 | 2.20 |
| Constant | 8.1292 *** | 79.67 | - |
| R2 | 0.5072 | ||
| F(16, 12,865) | 778.83 | ||
| Prob(F-statistic) | <0.0001 | ||
| AIC | 7696.95 | ||
| Variable | Distances to the Bus Stop (m) | ||||
|---|---|---|---|---|---|
| d ≤ 200 | 200 < d ≤ 500 | 500 < d ≤ 900 | 900 < d ≤ 1500 | 1500 < d ≤ 2000 | |
| Walking accessibility to the bus stop | −0.0184 | 0.0292 | 0.0703 *** | 0.0680 *** | 0.025 |
| (−0.76) | (1.93) | (4.36) | (4.69) | (1.69) | |
| Accessibility to the city centre | 0.00264 | 0.0489 | −0.282 *** | −0.200 *** | −0.184 *** |
| (0.12) | (1.86) | (−7.90) | (−7.34) | (−5.95) | |
| Well-decorated | 0.328 *** | 0.211 *** | 0.374 *** | 0.295 *** | 0.0472 |
| (13.38) | (9.97) | (19.23) | (15.21) | (1.01) | |
| Housing size | 0.327 *** | 0.346 *** | 0.283 *** | 0.215 *** | −0.160 *** |
| (13.4) | (16.21) | (19.5) | (10.35) | (−6.78) | |
| Number of toilets | 0.155 *** | 0.286 *** | 0.347 *** | 0.360 *** | 0.469 *** |
| (5.04) | (10.59) | (14.63) | (15.2) | (9.64) | |
| Distance to a park | −0.0497 | −0.159 *** | −0.0494 *** | 0.0214 | −0.0435 |
| (−1.93) | (−8.95) | (−3.78) | (1.41) | (−1.60) | |
| Distance to primary and secondary schools | −0.0822 *** | −0.0089 | −0.0610 *** | −0.0524 *** | −0.0829 * |
| (−3.86) | (−0.55) | (−4.87) | (−4.14) | (−2.56) | |
| Distance to a tertiary hospital | 0.0199 | 0.0163 | 0.0692 *** | −0.010 | −0.114 * |
| (1.21) | (1.18) | (5.28) | (−0.70) | (−2.49) | |
| Constant | 6.704 *** | 6.393 *** | 8.182 *** | 4.643 *** | 7.881 *** |
| (25.51) | (26.64) | (27.2) | (21.38) | (16.78) | |
Publisher’s Note: MDPI stays neutral with regard to jurisdictional claims in published maps and institutional affiliations. |
© 2022 by the authors. Licensee MDPI, Basel, Switzerland. This article is an open access article distributed under the terms and conditions of the Creative Commons Attribution (CC BY) license (https://creativecommons.org/licenses/by/4.0/).
Share and Cite
Liu, Q.; Zhao, P.; Xiao, Y.; Zhou, X.; Yang, J. Walking Accessibility to the Bus Stop: Does It Affect Residential Rents? The Case of Jinan, China. Land 2022, 11, 860. https://doi.org/10.3390/land11060860
Liu Q, Zhao P, Xiao Y, Zhou X, Yang J. Walking Accessibility to the Bus Stop: Does It Affect Residential Rents? The Case of Jinan, China. Land. 2022; 11(6):860. https://doi.org/10.3390/land11060860
Chicago/Turabian StyleLiu, Qingchun, Peixiong Zhao, Yan Xiao, Xin Zhou, and Jun Yang. 2022. "Walking Accessibility to the Bus Stop: Does It Affect Residential Rents? The Case of Jinan, China" Land 11, no. 6: 860. https://doi.org/10.3390/land11060860
APA StyleLiu, Q., Zhao, P., Xiao, Y., Zhou, X., & Yang, J. (2022). Walking Accessibility to the Bus Stop: Does It Affect Residential Rents? The Case of Jinan, China. Land, 11(6), 860. https://doi.org/10.3390/land11060860