Abstract
Taking metropolitan areas as space carriers has become the engine of the Chinese government in its promotion of high-quality development, and this has also become an important measure by which to balance regional development. We used Zipf’s law and the gravity model to study the urban scale distribution characteristics of the Kashgar Metropolitan Area (KMA) in this paper. We also constructed a spatial structure judgment vector for the KMA and put forward the development objectives of different circles. The findings show the following: (1) large cities have a high primacy of development, while small and medium-sized cities are underdeveloped. At present, the KMA is a concentrated monocentric-pattern metropolitan area, with Kashgar City as its core city. (2) The urban built-up area of Kashgar City is expanding to the east and south, where it has broken through the administrative boundary and become integrated with the urban built-up area of Shule County. The spatial structure characteristics of the KMA have been further clarified. The KMA forms three circles: core, middle, and outer. (3) Tumxuk City, Bachu County, Yecheng County, Shache County, and other counties are far from the core city and cannot be connected with Kashgar, but they are closely related to the surrounding cities, forming the Bachu–Tumxuk Urban Group and the Shache–Zepu–Yecheng Urban Group. This study contributes to the understanding of the characteristics of urban scale distribution and the spatial structure of metropolitan areas in arid regions, as well as providing guidance for the formulation of policies for the development of different circles in the KMA.
1. Introduction
As centers of production and consumption, cities are important global network nodes of commercial, population, and cultural transactions [1]. In recent decades, the area of cities has been expanding, and economic trade and population flows between cities are becoming more frequent. This phenomenon of large-scale urbanization could be described as a metropolitan region, a metropolis, a conurbation, or a city region [2]. Metropolitan areas have been the destination of most immigrants and the main target areas of investors because of scale economies, reduced transportation costs, and externalities [3,4,5]. With the gradual increase in migration and investment in metropolitan areas, they have become the pillar of regional economic development and play an important role in promoting economic structure adjustment, population redistribution [6], and improving the living standards of local people [7].
Globally, drylands cover approximately 41.3% of the total land surface [8] and are home to more than 2.5 billion people (over 38% of the world’s population) [9,10,11], 90% of whom live in developing countries, where people face numerous environmental challenges. Drylands have the highest concentration of food insecurity and poverty in the world [12,13]. Like other countries in the world, the economic development of most regions in arid areas of northwest China, such as Xinjiang and Gansu, is lagging behind the coastal areas of eastern China, belonging to the “low-lying” region in China’s economy [14]. Most of the local people are distributed in rural areas, facing the dilemma of insufficient development, and their living standards have lagged behind the national average for a long time. Therefore, eradicating poverty and achieving sustainable development in arid areas are related to the future of all mankind, which will also promote the realization of the United Nations’ Sustainable Development Goals (SDGs). As an important carrier and top priority of the economy and population in arid areas, metropolitan areas are those with the most concentrated production factors such as various industries, transportation, communications, culture, education, talent, and information, and they are also the focus of infrastructure construction investment, which provides services for local residents with different functions [15]. Urbanization is an important engine of modernization and economic growth and appears to be an inevitable trend in human socioeconomic development around the world [16]. Accelerating the development of metropolitan areas will help to reduce the incidence of poverty in arid areas, promote regional urbanization, and achieve sustainable development.
With the rapid urbanization and economic development of Xinjiang and the continuous increase in national infrastructure construction and investment in southern Xinjiang, Kashgar, the regional central city in southern Xinjiang, is expanding at a very fast pace [17,18]. The agglomeration effect of regional central cities is also increasing. In fact, a prototype of the metropolitan area centered on Kashgar, the central city of southern Xinjiang, has been initially formed [17,19]. Thus, taking Kashgar as a focal point, certain actions that can facilitate the gathering of people and promote the radiating functions of this regional central city in southern Xinjiang and, thus, create a metropolitan area are considered inevitable. Based on this, using Zipf’s law, central place theory, the economic distance model, and the gravity model, this paper examines the urban scale distribution characteristics of the KMA, constructs a spatial structure judgment vector of the KMA, and puts forward the development objectives of different circles. This study is helpful in understanding the characteristics of city size distribution and the spatial structure of metropolitan areas in arid areas and provides guidance for the formulation of metropolitan development policies.
2. Literature Review
Metropolitan areas are internally closely related in space, interdependent in function, cross established administrative boundaries, and tend to be integrated [20]. This not only reflects the increase in the scale of collective “living space” but also reflects the different spatial strategies of the economic subject [21]. Some scholars believe that metropolitan areas are a new concept and trend in global urban development that reflects the cohesion between cities [22]. Research on metropolitan areas should first seek to clarify their spatial extent [23,24]. Most developed and other developing countries have been working for decades to more accurately delineate true metropolitan areas and analyze and assess metropolitan areas’ size and function [21]. Some scholars have used certain function indicators, for example, urban population density, urban infrastructure, commuting rate, land use, and industrial development, to examine the extent of the spatial development of metropolitan areas in North America, Asia, and Japan [25,26,27]. Martin [28] suggested using a variety of demographic and socioeconomic data to determine the boundaries of metropolitan areas through computational simulations. Whether for purely statistical or institutional purposes, there is no universally recognized standard for the demarcation of China’s metropolitan areas, but Chinese scholars have actively discussed it. After the concept of metropolitan areas was introduced into China, scholars such as Zhou [29], Ning [30], and Gu [31] discussed the delimitation method for metropolitan areas, and all emphasized the socio-economic connection between the central city and the surrounding areas. Zhou believed that the metropolitan area is a combination of a large population as the core area and adjacent communities with a high degree of economic and social development integrated into this core [32]. From the perspective of positivism, some researchers have actively defined the scope of the Lhasa [33] and Shanghai metropolitan areas [34]. Yue et al. pay attention to the urban vitality of the metropolitan area [35].
The increased population and the rapid expansion of urbanization have been some of the main global characteristics in recent decades. This expansion has shaped the diverse spatial structure in metropolitan areas worldwide [36]. Therefore, many studies have begun to focus on the spatial structure of metropolitan areas. Scholars from the Americas, Europe, and Asia have used different measurement standards, including commuting flow [37], employment density [38], population density [39], and land use [40]. Some articles use a combination of two or three criteria to measure the spatial structure of metropolitan areas. It was found that the metropolitan area structure of the United States has experienced a concentrated monocentric pattern and evolved into polycentric and dispersed or edgeless patterns [41,42]. From the research on the spatial structure of China’s metropolitan area, some empirical studies have analyzed the polycentric structure of Chinese metropolitan areas [43,44]. These studies show that the spatial structure of Chinese metropolitan areas has simultaneously evolved towards concentration and decentralization (more polycentric).
As a social, economic, and physical entity, the core city of the metropolitan area has a certain impact on the surrounding small cities and towns [45]. Urban influence range is an important index by which to judge the intensity of urban competition and regional function, and it is also an important field of urban spatial structure research. At present, there are two main methods used to define the scope of urban impact: one is the empirical method, the other is the theoretical model method [46,47]. Dividing the scope of urban attraction according to the empirical method requires collecting and selecting representative, accurate, easy to count, and comparative indicators and requires a large amount of statistical data [48]. At present, the theoretical model method is the main method used to study urban influence. It is mainly based on the theory of spatial interaction. The impact of the city on the surrounding areas is directly proportional to the size and scale of the city and inversely proportional to the distance from the city [49]. For example, the breakpoint model, the field strength model, and the Voronoi graph model are the main models in this field. Theoretically, central place theory, the law of universal gravitation, growth pole theory, spatial interaction theory, and spatial diffusion theory provide a rich theoretical basis for the study of the interaction between spatial cities.
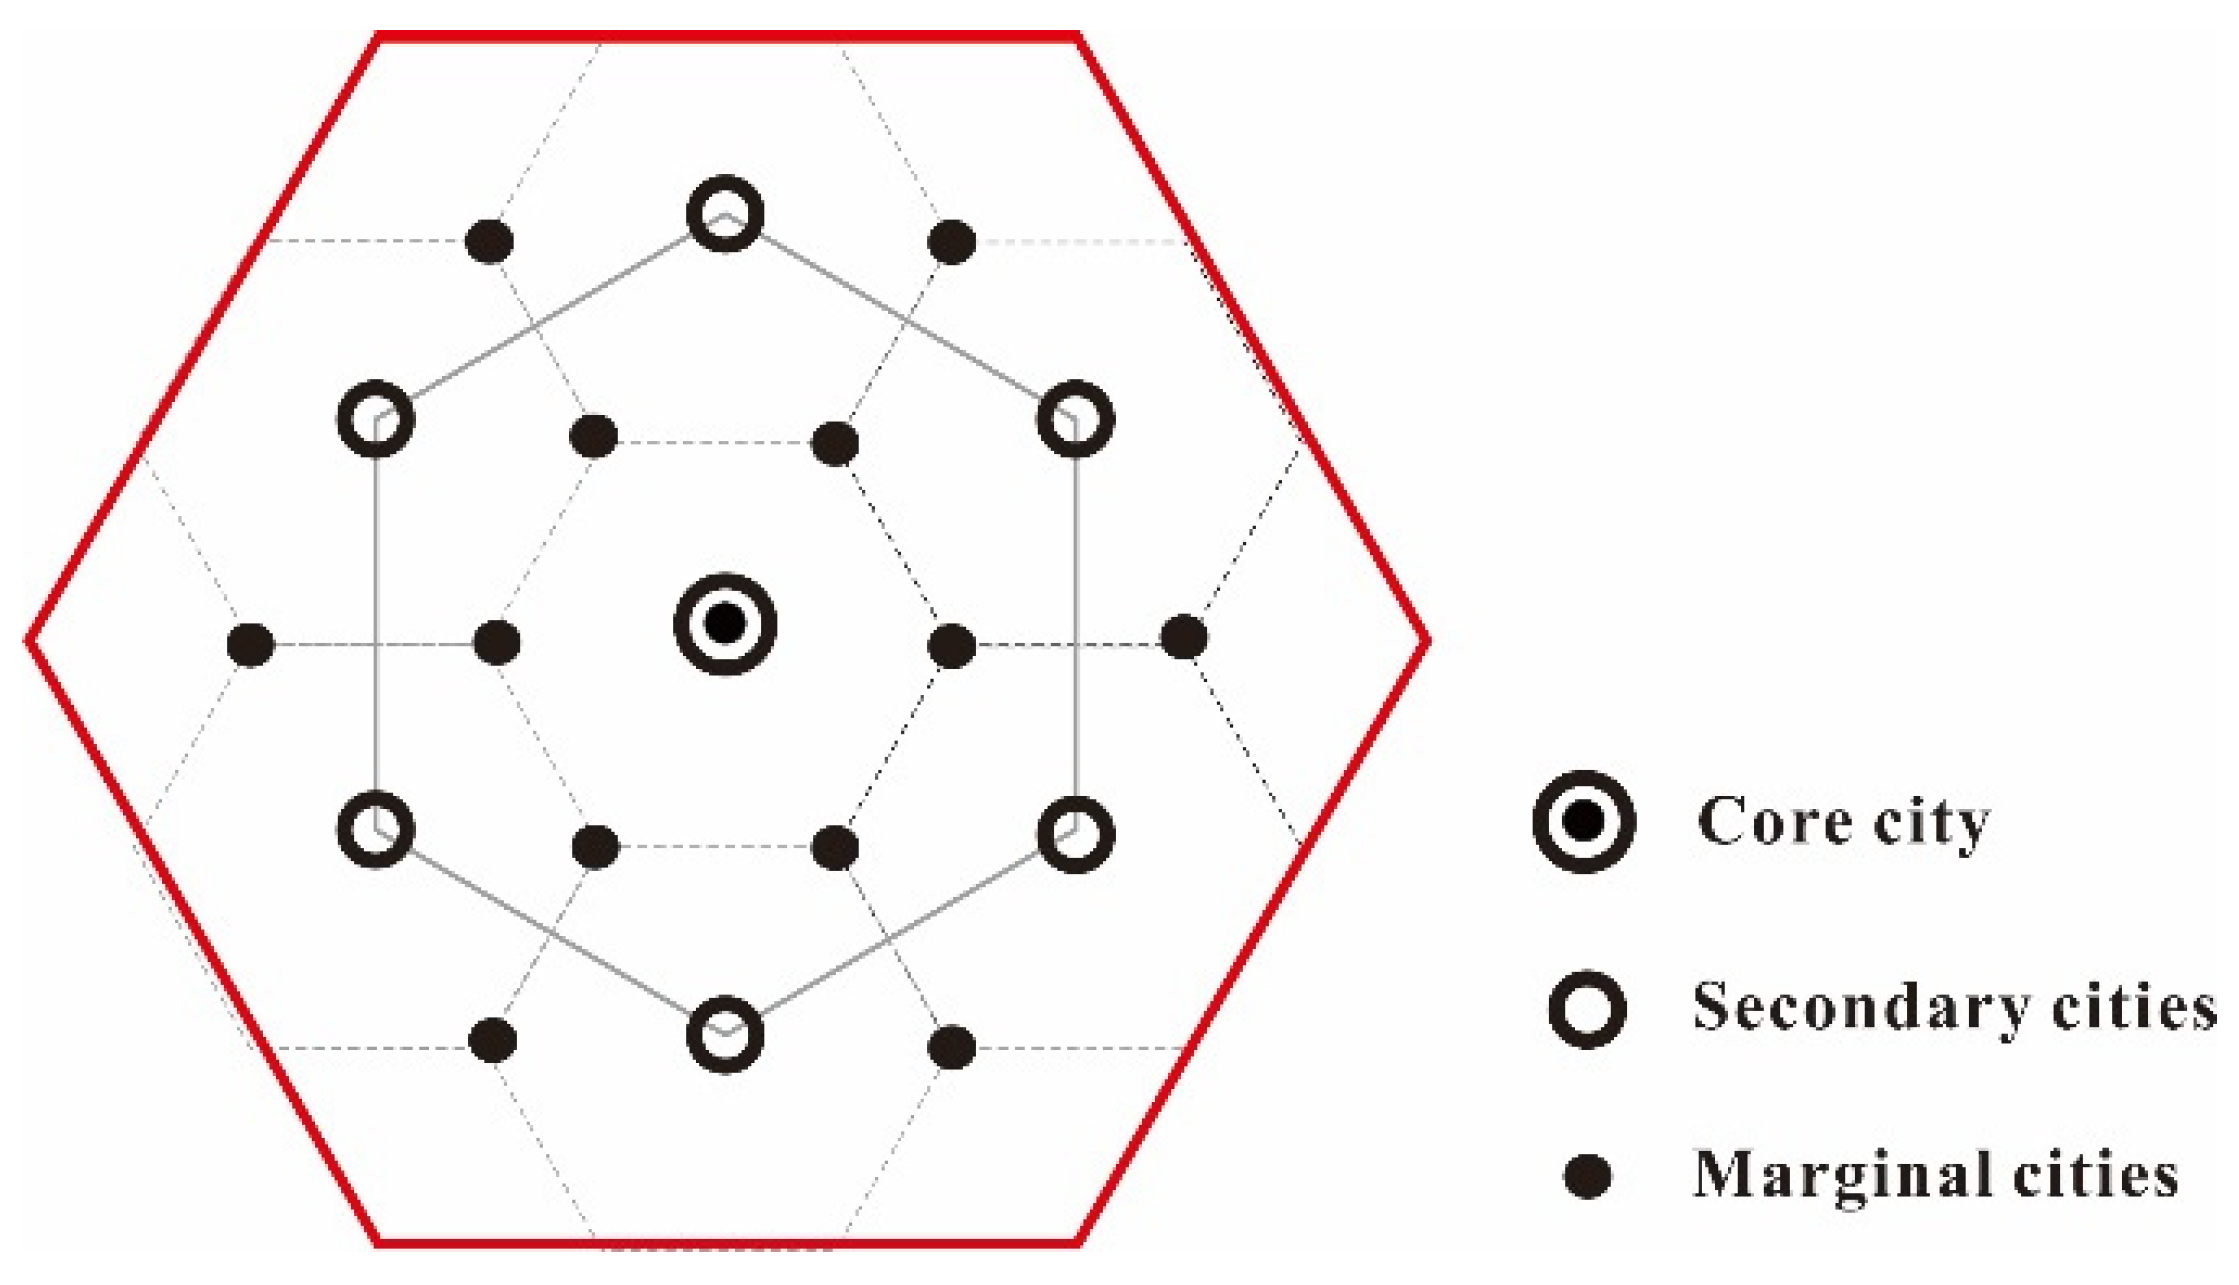
According to the central place theory, the service scope of cities at different levels is different. The higher the city level, the larger the service scope [50]. The core cities of metropolitan areas have more concentrated resources and power. They are an area with a high concentration of economic activity and a large population. At the same time, they have produced a larger range of services [51]. With increases in geographical distance, the connection with core cities will gradually weaken, showing an obvious law of distance attenuation [52]. Therefore, a spatial structure with core cities as the center and decreasing outward has been formed (Figure 1). In view of the current reality, the research on the spatial structure of metropolitan areas mostly focuses on the identification of central cities. Based on central place theory and the law of universal gravitation, this paper first identifies the core cities of metropolitan areas and then analyzes the connection strength between KMA’s core cities and surrounding cities by using the mature universal gravitation model, which makes up for the deficiencies in the existing research on the spatial structure of metropolitan areas in arid areas.
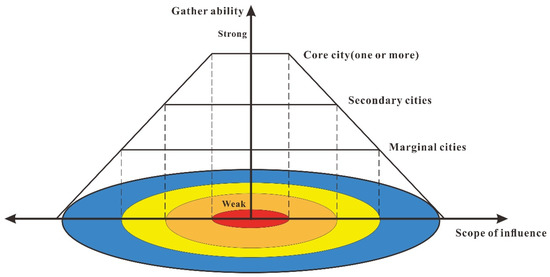
Figure 1.
A conceptual map of metropolitan areas’ spatial structure.
Some researchers believe that modern metropolitan areas are the main indicators of the economic growth of a nation [53,54,55]. Metropolitan areas have become the breeding ground for concentrated economic, political, and cultural activity, as well as for creativity and innovation [54]. Metropolitan areas have progressively emerged as a new form of urban governance [55]. Therefore, taking metropolitan areas as a space carrier has become the engine of the Chinese government in its promotion of high-quality development and an important measure by which to balance regional development. In March 2021, the Nanjing Metropolitan Area Development Plan was officially approved. This was the first cross-provincial metropolitan area plan approved by the National Development and Reform Commission in a formal reply, and it marked that the construction of China’s metropolitan areas had entered a new stage of national attention. It is undeniable that the development of metropolitan areas has caused air pollution [56] and has also caused a large amount of ecological land to become urban land [57,58], as well as having a negative impact on regional sustainable development. However, almost no one opposes the development of metropolitan areas because of these problems, and everyone agrees that metropolitan areas are a new stage of urban development and the basic geographical and organizational units of global competition [59]. It is for these reasons that our view is that the rapid development of arid-zone cities cannot be achieved without the support of metropolitan areas. Although their scale in terms of population and economy cannot be compared with those of large metropolitan areas such as the United States, arid-zone metropolitan areas play an irreplaceable role in local economic development.
3. Conceptual Framework
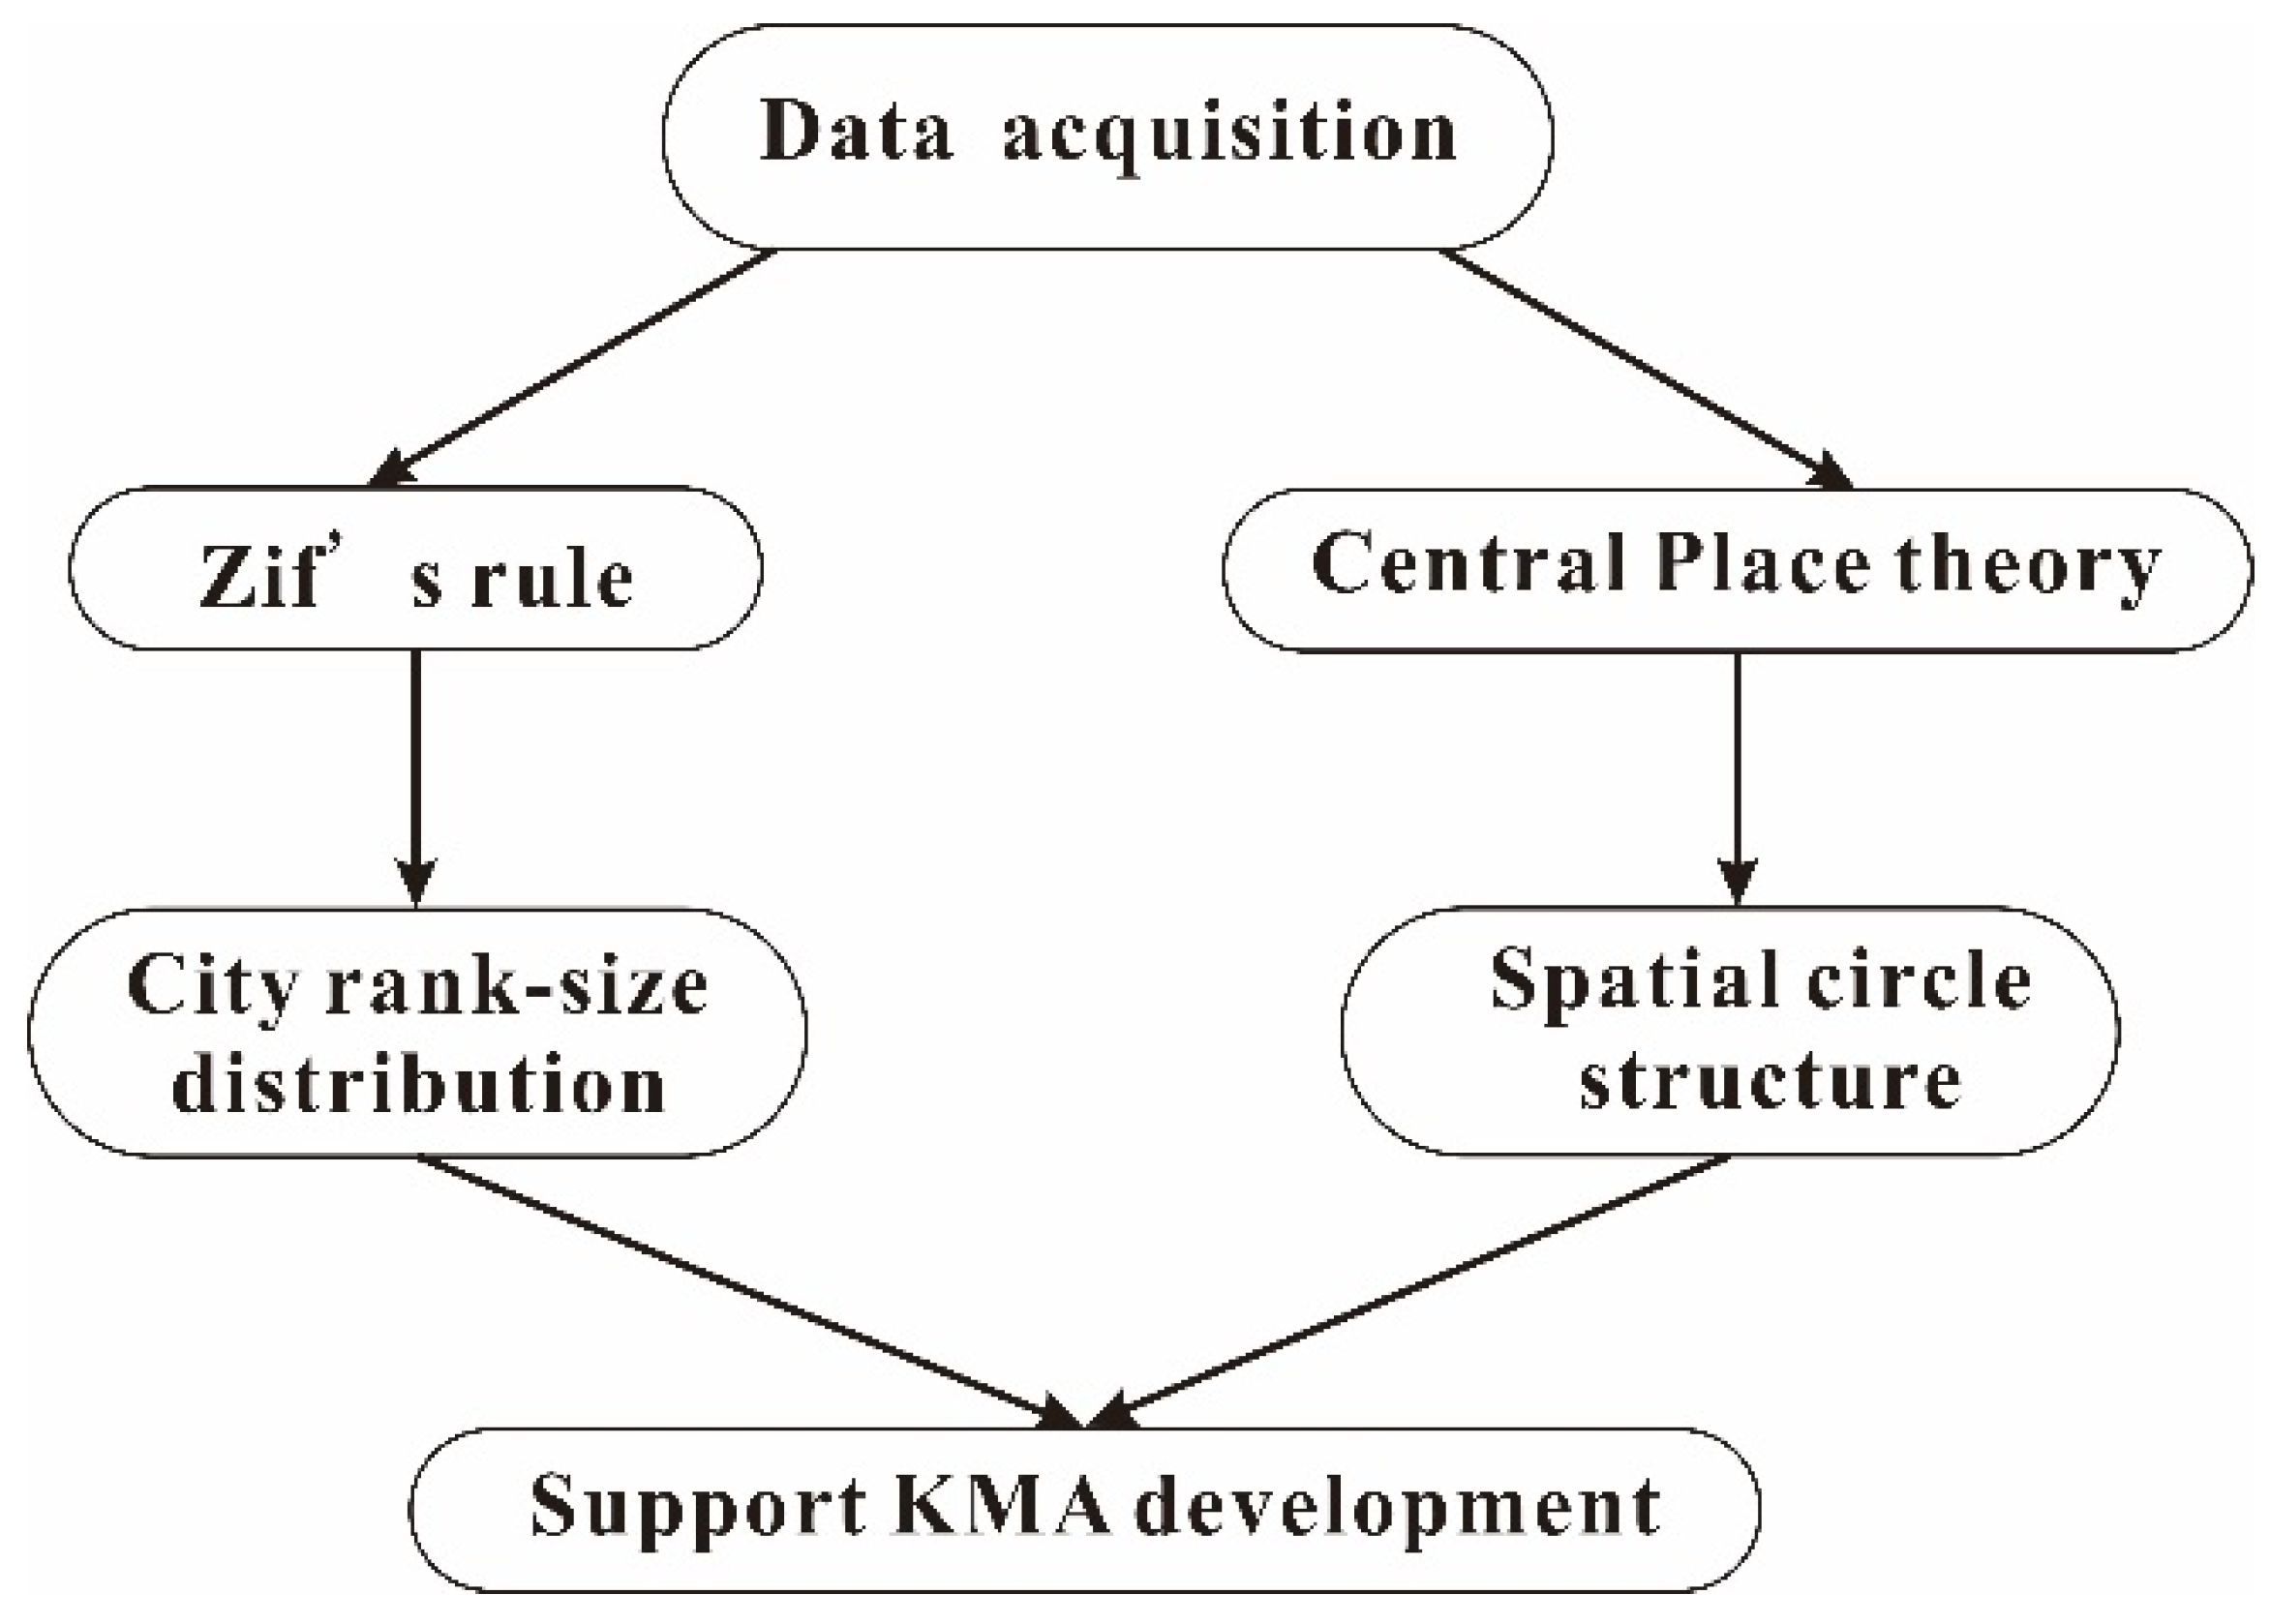
Although many findings exist from metropolitan area research, we have developed a conceptual framework in this study based on the Zipf’s law and central place theory; Figure 2 shows the conceptual framework used in this paper. The analysis process was as follows: first, we collected and organized the data, including statistical yearbook data, multi-period remote sensing image data, and POI using 17 cities as the study unit. Then, we used Zipf’s rule to reveal the city rank-size distribution characteristics and the gravity model to scientifically delineate the spatial circle structure of the KMA. Finally, the conclusions drawn were discussed and validated.
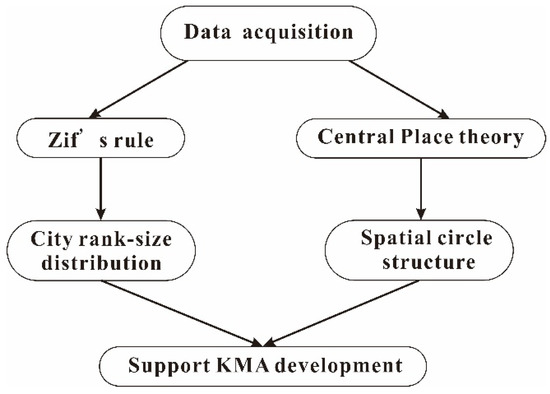
Figure 2.
The conceptual framework of spatial structure in KMA.
4. Material and Methods
4.1. Study Area
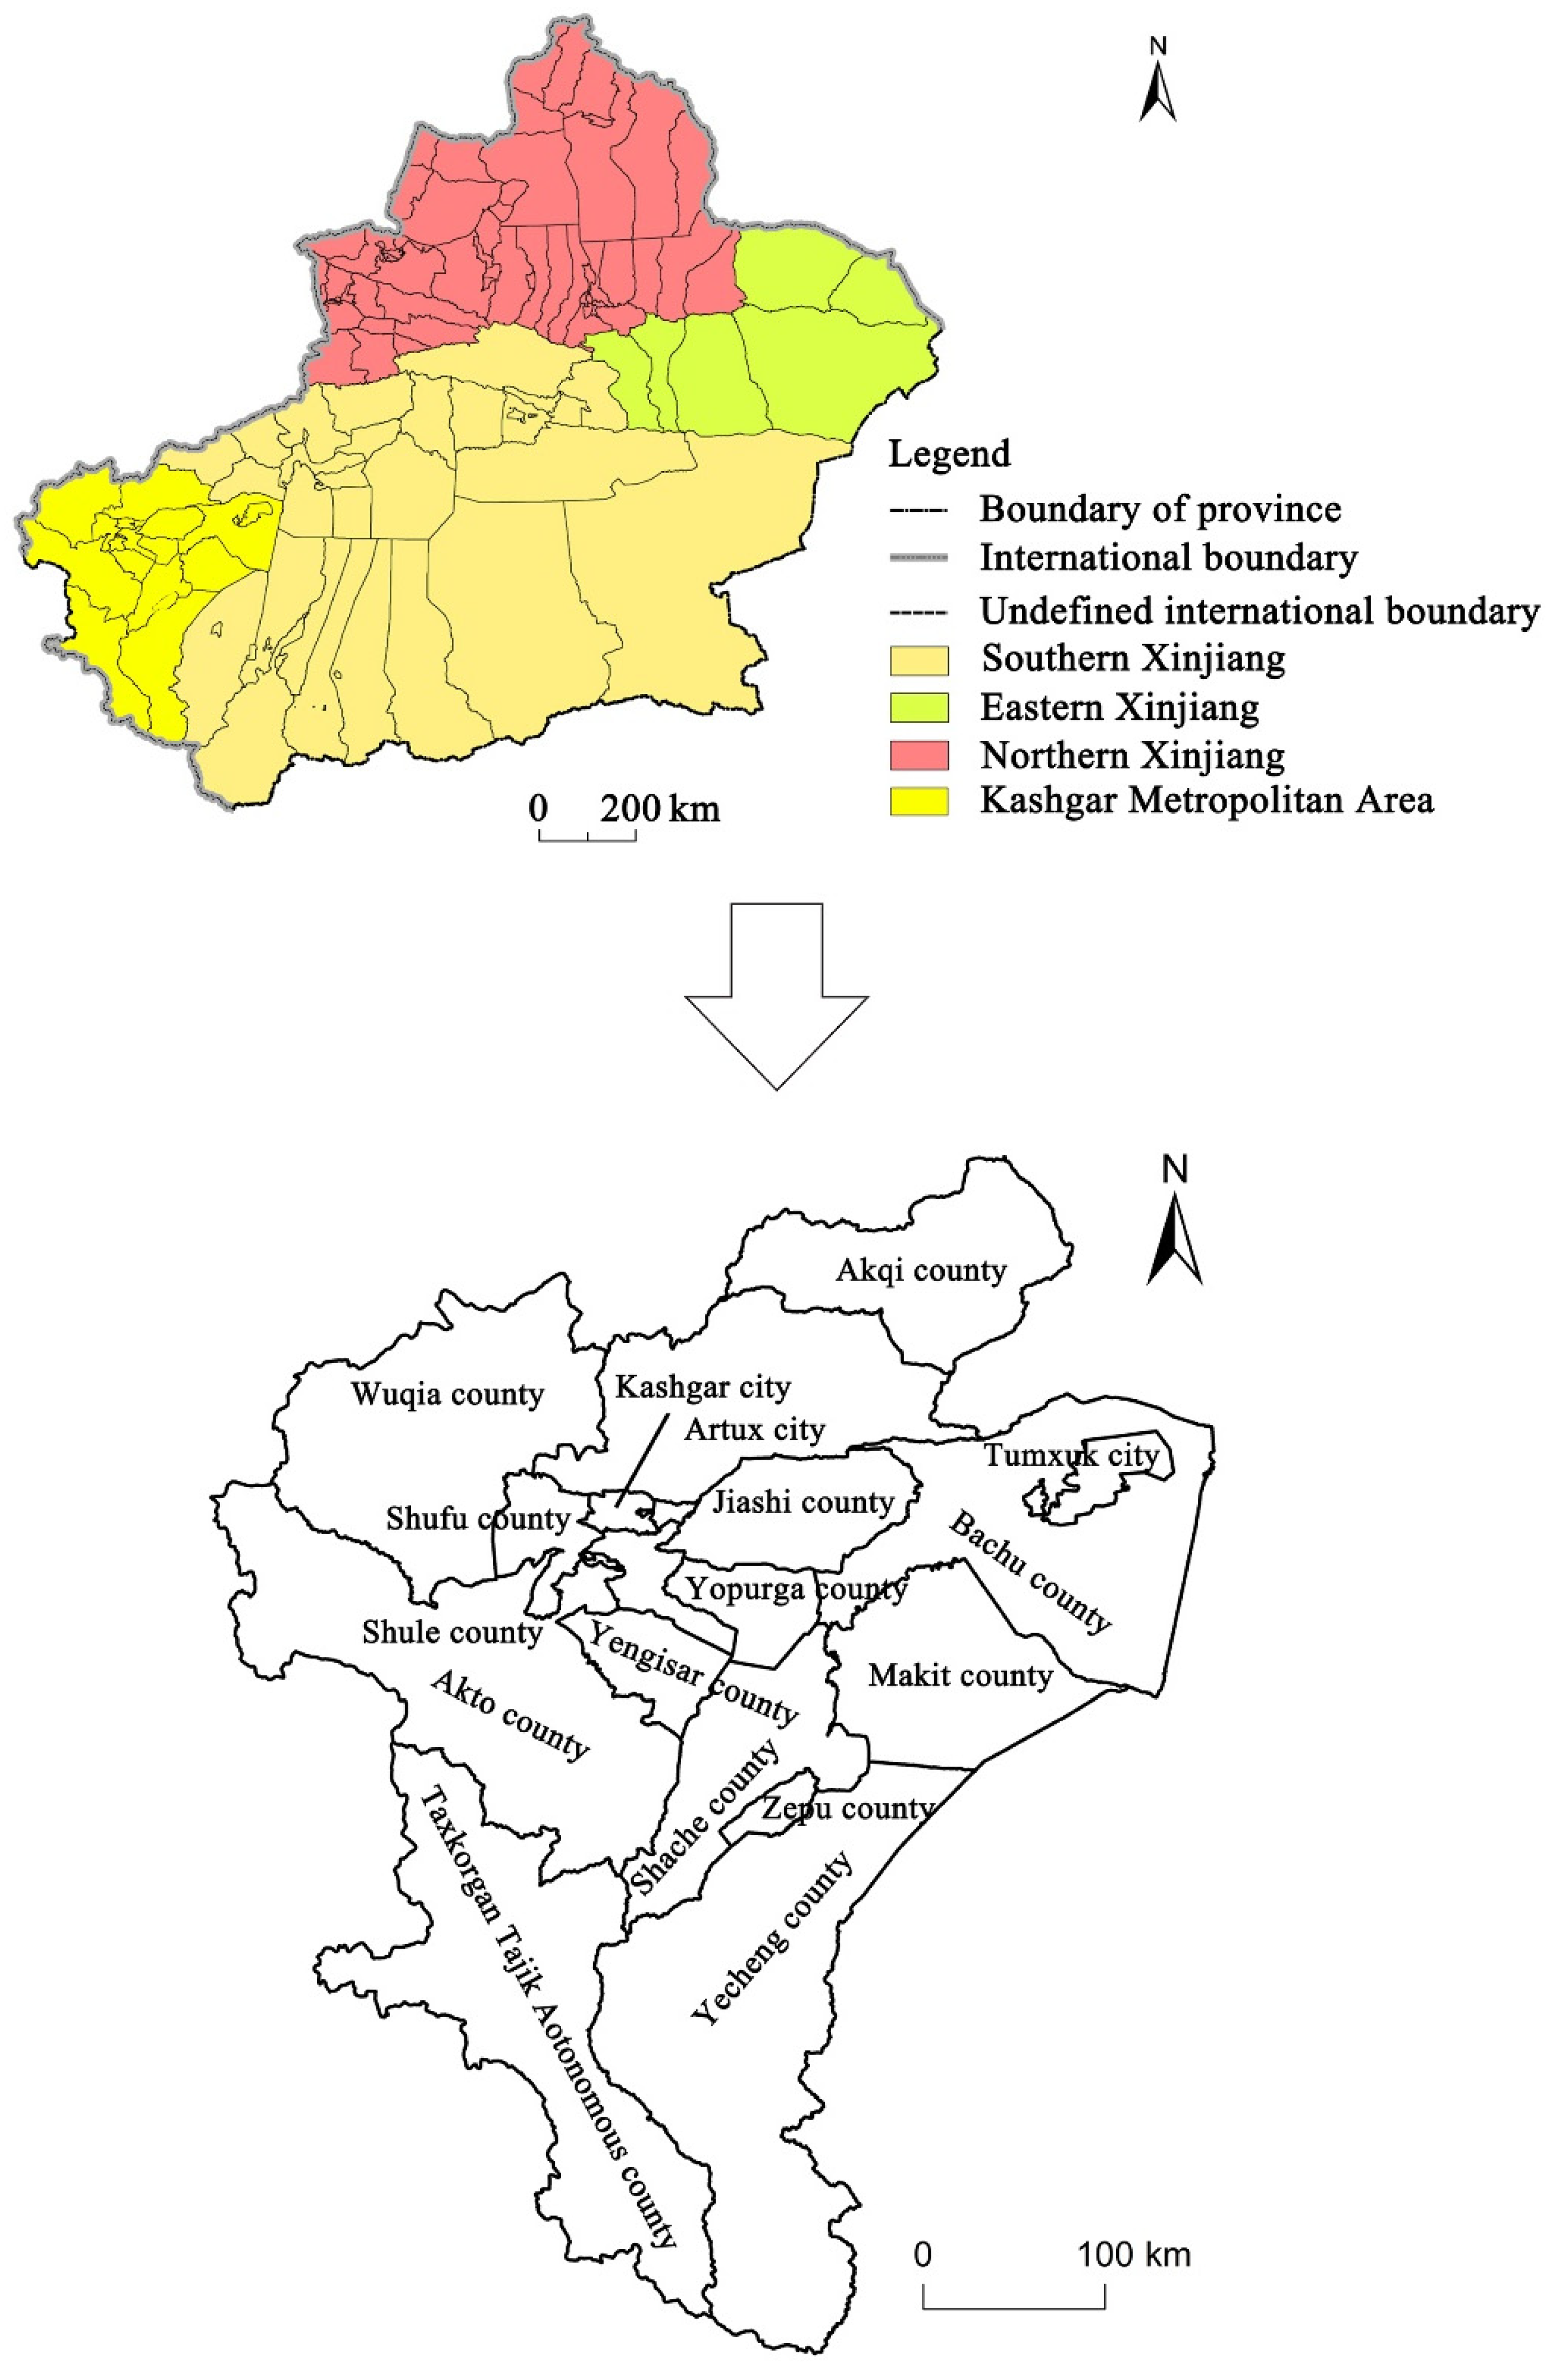
The Tianshan Mountains divide Xinjiang into three parts: southern Xinjiang, northern Xinjiang, and eastern Xinjiang [60]. The KMA is located in southern Xinjiang (as shown in Figure 3). It is composed of 17 cities and counties (Figure 3), including Kashgar City, Artux City, Shufu County, and Tumxuk City of the Xinjiang Production and Construction Corps. The KMA covers 242,500 km2, accounting for 15% of the total area of Xinjiang. The mean annual rainfall is in the range of 55–72 mm, and the area is typical of a temperate continental climate with annual evaporation rates much greater than the annual precipitation rates.
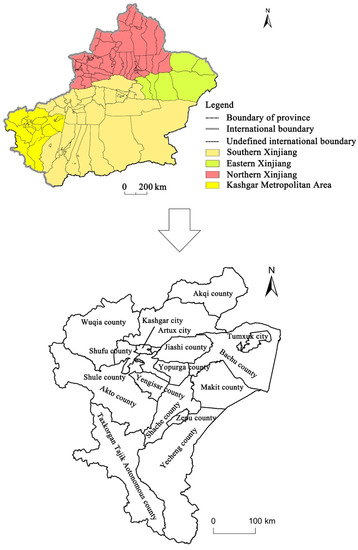
Figure 3.
The location of KMA in China. (Note: the image is based on the standard map GS (2019) No. 1652 of the standard map service website of the Ministry of Natural Resources of China; the base map boundary has not been modified).
The KMA is an important urban metropolitan area in southern Xinjiang with a relatively high level of economic development and a large urban population [14]. By the end of 2018, the total population of the KMA was 5.432 million, accounting for 23.79% and 46.17% of the total population of Xinjiang and southern Xinjiang, respectively. The GDP was CNY 1028.51 billion, accounting for 8.43% and 31.94% of the total GDP of Xinjiang and southern Xinjiang, respectively. The local fiscal revenue was CNY 85.7 billion, accounting for 5.6% and 30.58% of the total in Xinjiang and southern Xinjiang, respectively. The construction of the KMA is conducive to accelerating the construction of southern Xinjiang, optimizing the spatial pattern of population and economy in Xinjiang and providing a case of metropolitan area construction for the sustainable development of arid areas.
4.2. Data Sources
This study’s data sources for the KMA were downloaded from the following sources: (1) GDP, GDP per capita, urban population, total population, and local fiscal revenue data from Xinjiang Statistical Yearbook (2001, 2011, and 2019); (2) from online map data: Baidu Maps, Gaode Maps, and some navigation data; and (3) using network data collection software, we collected the full class POI point data of Gaode and Baidu Maps as of September 2021, mainly including catering, hotels, leisure and entertainment, corporate enterprises, finance, and transportation facilities. (4) The land use data are from the National Land Use Data set (NLUD) established by the remote sensing survey of resources and environment of the Chinese Academy of Sciences (https://www.resdc.cn/ (accessed on 5 March 2020). Table 1 shows the remote sensing image information of 1980, 1990, 2000, 2010, and 2018. The description of the land use data set by the Chinese Academy of Sciences shows that geometric fine correction has been carried out according to the topographic map and the existing remote sensing images. Convert the projection from WGS84 to Gauss Kruger projection in arcgis10.2 software. In order to avoid the redundancy of the article, the process of remote sensing image processing is not described in detail.

Table 1.
Remote sensing images used in the study.
4.3. Research Methods
4.3.1. Zipf’s Law (The Rank-Size Rule)
Zipf’s law for testing the distribution characteristics of the urban scale originates from the bit-order scale law established by Auerbach [61], that is, the product of urban bit order and urban scale is a constant. Zipf [62] found similar phenomena in many research fields, and a coefficient α close to 1 has attracted extensive attention. Therefore, the bit-order scale rule with a coefficient of 1 is also known as Zipf’s law. The purpose of using Zipf’s law in this study was to analyze whether there are cities with high primacy in the Kashgar Metropolitan Area. Aue to the number of observations is small, there is the risk of bias due to underrated standard error. Therefore, we used the Gabaix–Ibragimov estimator [63]. This is based on the reversed Zipf regression (=Pareto regression) with rank as the independent variable and size as the predictor. The variable rank is simply corrected by subtracting 0.5. In an empirical analysis, the following forms are usually used for regression:
log(Ri − 0.5) = −αlogPi + K
Ri is the rank order of city i; Pi is the population size of city i; α is often called the Pareto index; and K is a constant. A Pareto index of α = 1 means that it is in line with Zipf’s law, and the urban system is in a balanced development state. One thing to note is that α = 1 is not per se Pareto efficient. Pareto optimality is simply a theoretical consideration of a situation when centripetal and centrifugal forces of urbanization are in equilibrium [64]; α > 1 means that the distribution of the urban scale is more concentrated, with prominent large cities, sparsely populated medium and small cities, and high primacy; α < 1 means that the urban population is more dispersed, with a smaller population in high-ranking cities and a larger population in medium and small cities.
4.3.2. Central Place Theory
The striking regularity of city size distribution has attracted considerable interest in providing explanations for it [50]. Zif’s Law provides a statistical perspective. However, the law does not explore the geospatial distribution of cities, where cities of different sizes play different roles in the economy. The central place theory, first proposed by the German geographers Christal (1933), could solve this problem. In 1933, the German economic geographer Christaller published “the center of southern Germany” and founded central place theory. Central place theory holds that cities and towns are the service centers in their surrounding hinterland, providing certain goods and services for the surrounding areas, such as retail, wholesale, finance, and administration; since these services and goods can be divided into several levels according to particular characteristics, the goods and service industries that cities and towns can provide are divided into several levels. There is a regular hierarchical relationship between cities and towns. The more services a town provides for its hinterland, the higher the central position of the town and the higher the level of the central place. The distribution of centers at different levels is subject to the needs of administrative management and political control, and the low-level centers and their service areas are included in the control scope of the high-level centers (Figure 4). We used the central place theory to describe the urban spatial organization structure of KMA, which provides theoretical support for the division of KMA’s circle structure below.

Figure 4.
The central place system.
4.3.3. Gravity Model
Calculation of Economic Distance
In the model calculation, it is not convincing to simply take the spatial distance between the two cities as the research distance. In practical application, many factors such as society, economy, and transportation should also be considered. Therefore, we propose economic distance (E):
In this formula, E is the economic distance; α and β are the corrected weights; and D is the spatial distance between the two cities. α is the corrected weight of commuting distance, β is the correct weight of the economic gap, and its value is determined by the ratio of the per capita GDP of surrounding cities to the per capita GDP of core cities. We have learnt from the research results of Fan [65] and Zhou [66], combined with the actual situation of the KMA, that the appropriate commuter correction weight and economic gap correction weight can be determined (Table 2 and Table 3).
Table 2.
The commute distance correction weight .
Table 3.
The economic gap correction weight .
Gravity Model
The gravity model is derived from the law of universal gravitation in physics, which was later used to describe the intensity of mutual attraction between two cities [67]. The urban influence follows the ‘distance attenuation law’, which is inversely proportional to the distance and divides the influence area according to the principle of ‘maximum contact strength’. The expressions of the gravity model are as follows:
is the gravitational strength between the core city of the metropolitan area and the city. is the economic distance. are the urban population size, GDP, and urban administrative area of the city, respectively. , and are the urban population size, GDP, and urban administrative area of the core city in the metropolitan area, respectively.
5. Results
5.1. The City Size Distribution Evolution Characteristics
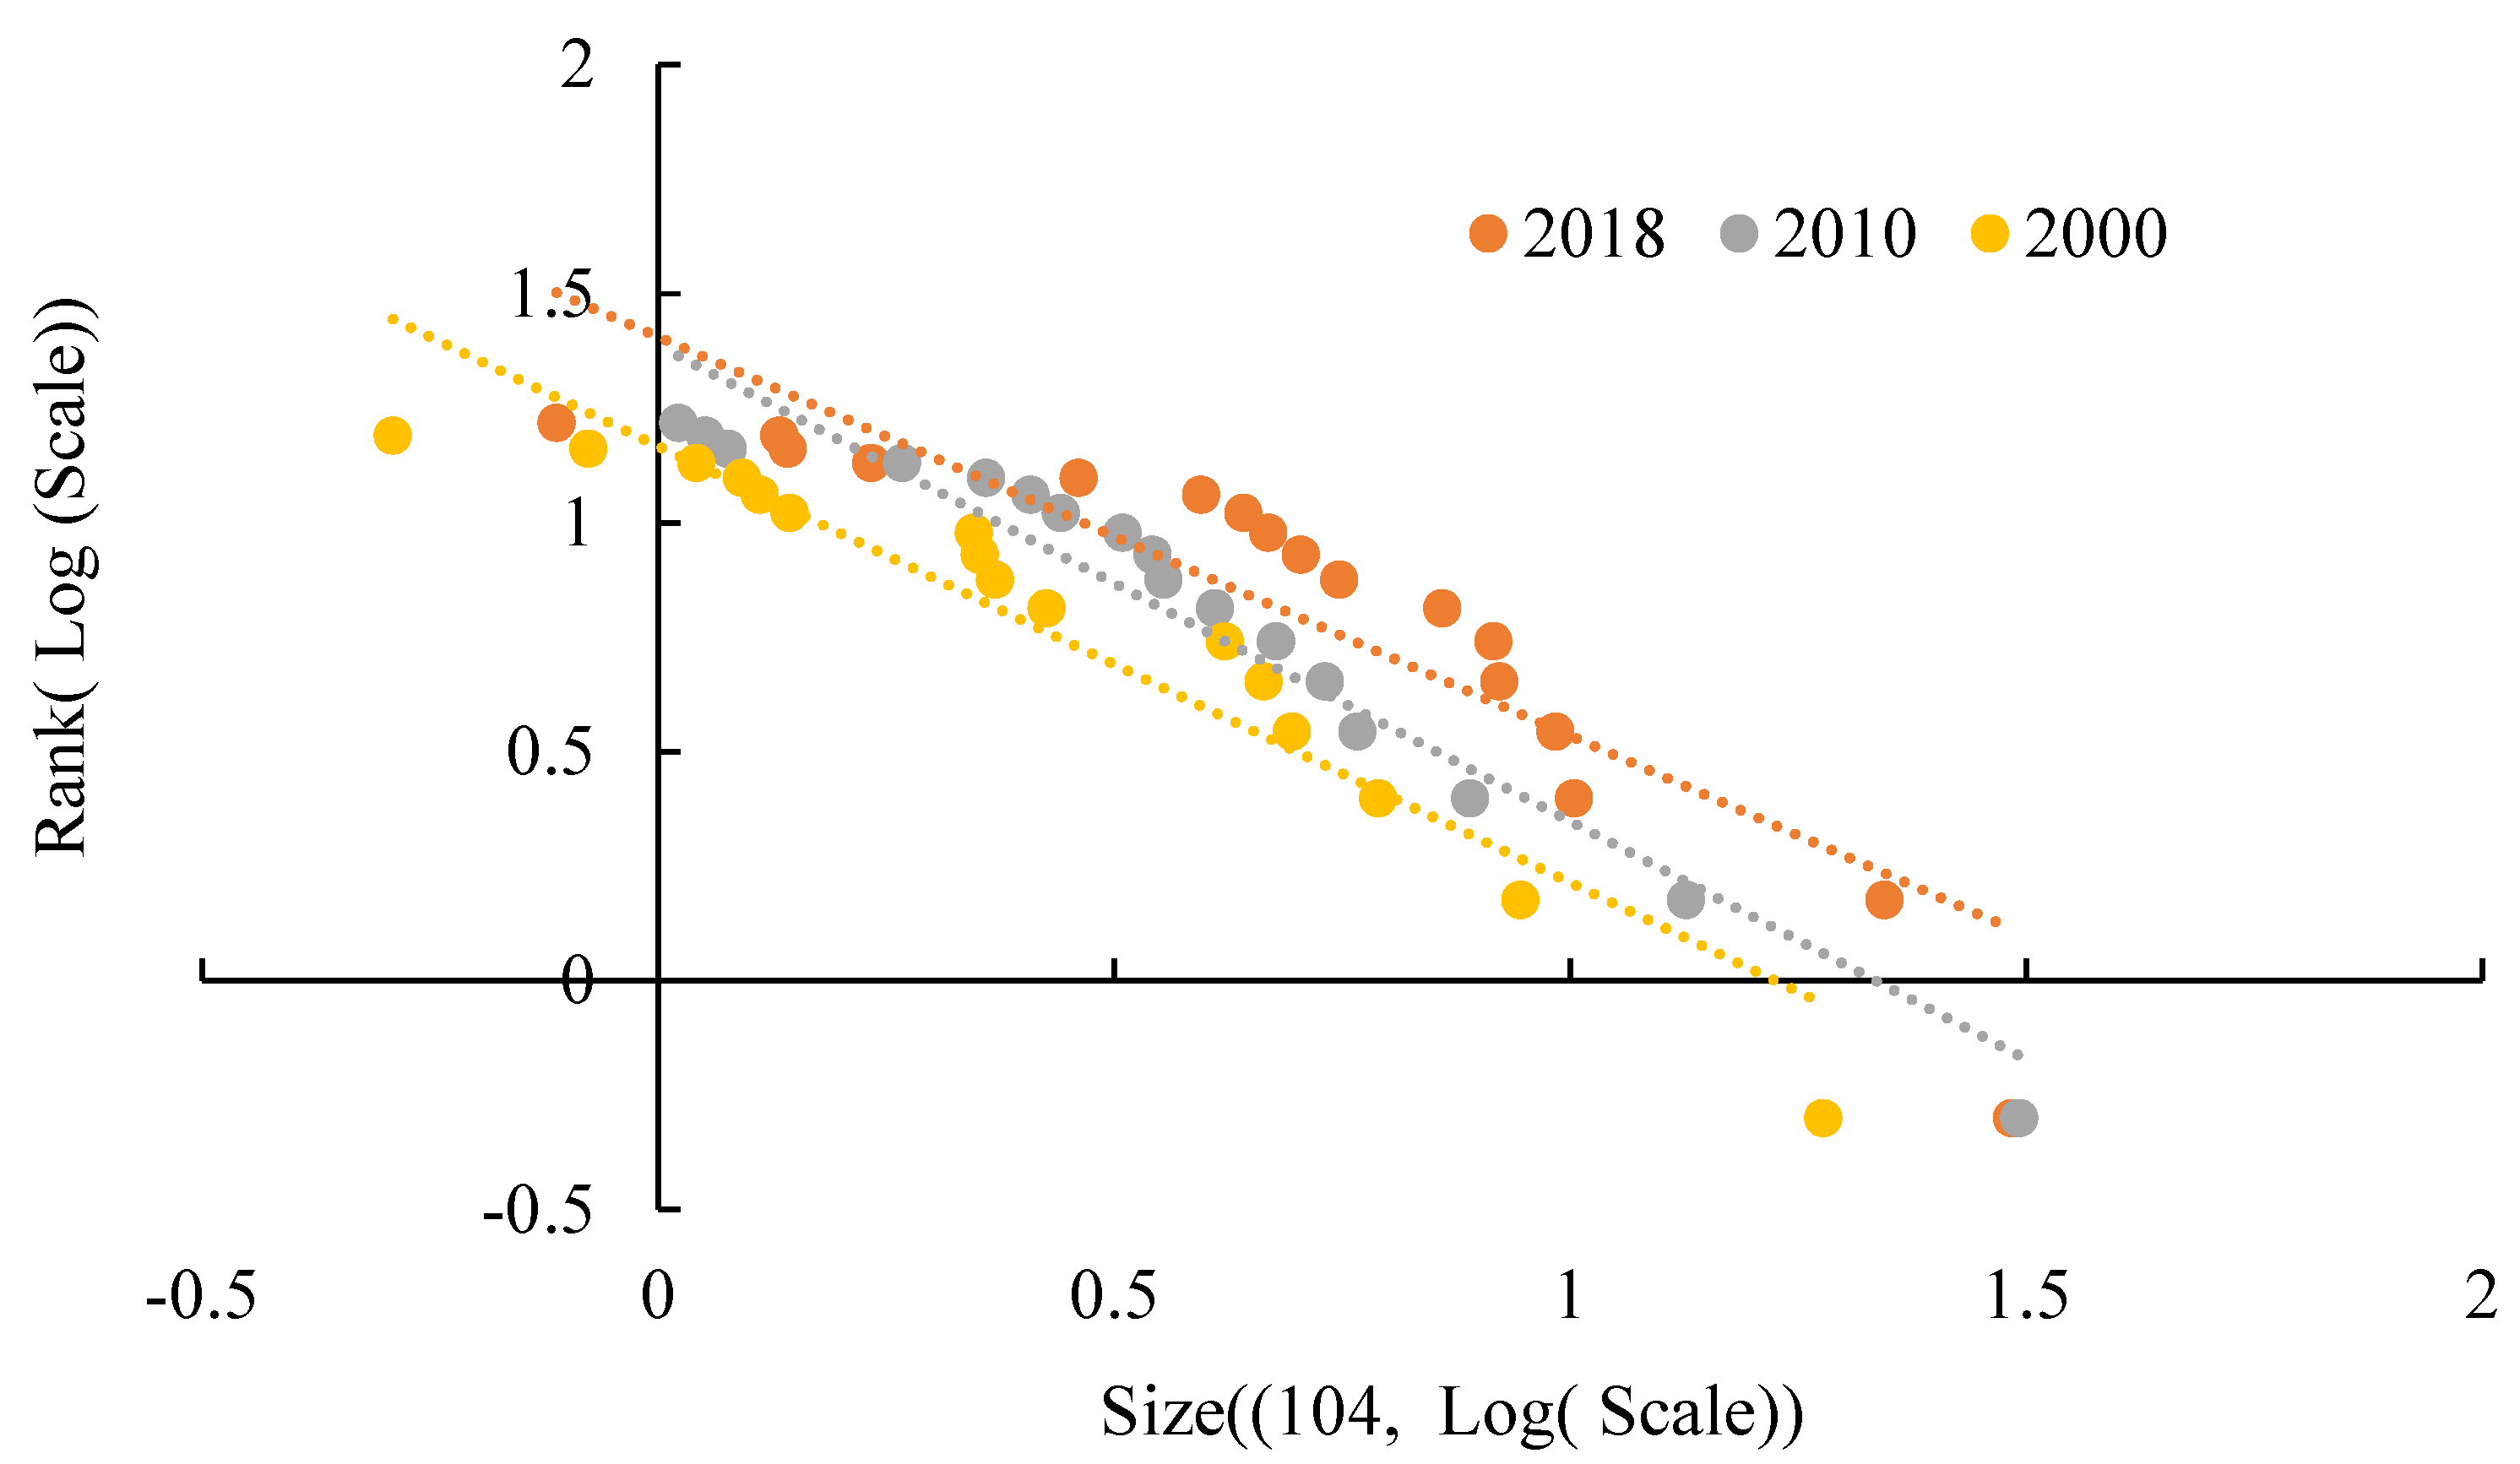
The city size distribution of KMA from 2000–2018 was fitted using the rank-size rule (Figure 5), and we found that the goodness of fit R2 of all the fitted curves was greater than 0.8, which is a good fit. Table 4 shows that the Pareto exponent (α) from 2010 was greater than 1, indicating that large cities have a high primacy, and small and medium-sized cities have been underdeveloped. In the past 18 years, the change characteristics of the rank scale fitting curve show that the scale of the high primacy city has decreased. There are some breaks of size in the middle (2000) and middle and lower sections of the distribution (2010, 2018). This shows that that the region is rather characterized by relatively large and relatively small municipalities.

Figure 5.
The Zipf plot for KMA in 2000–2018.
Table 4.
The relevant parameters of the rank-size rule fitting in the KMA.
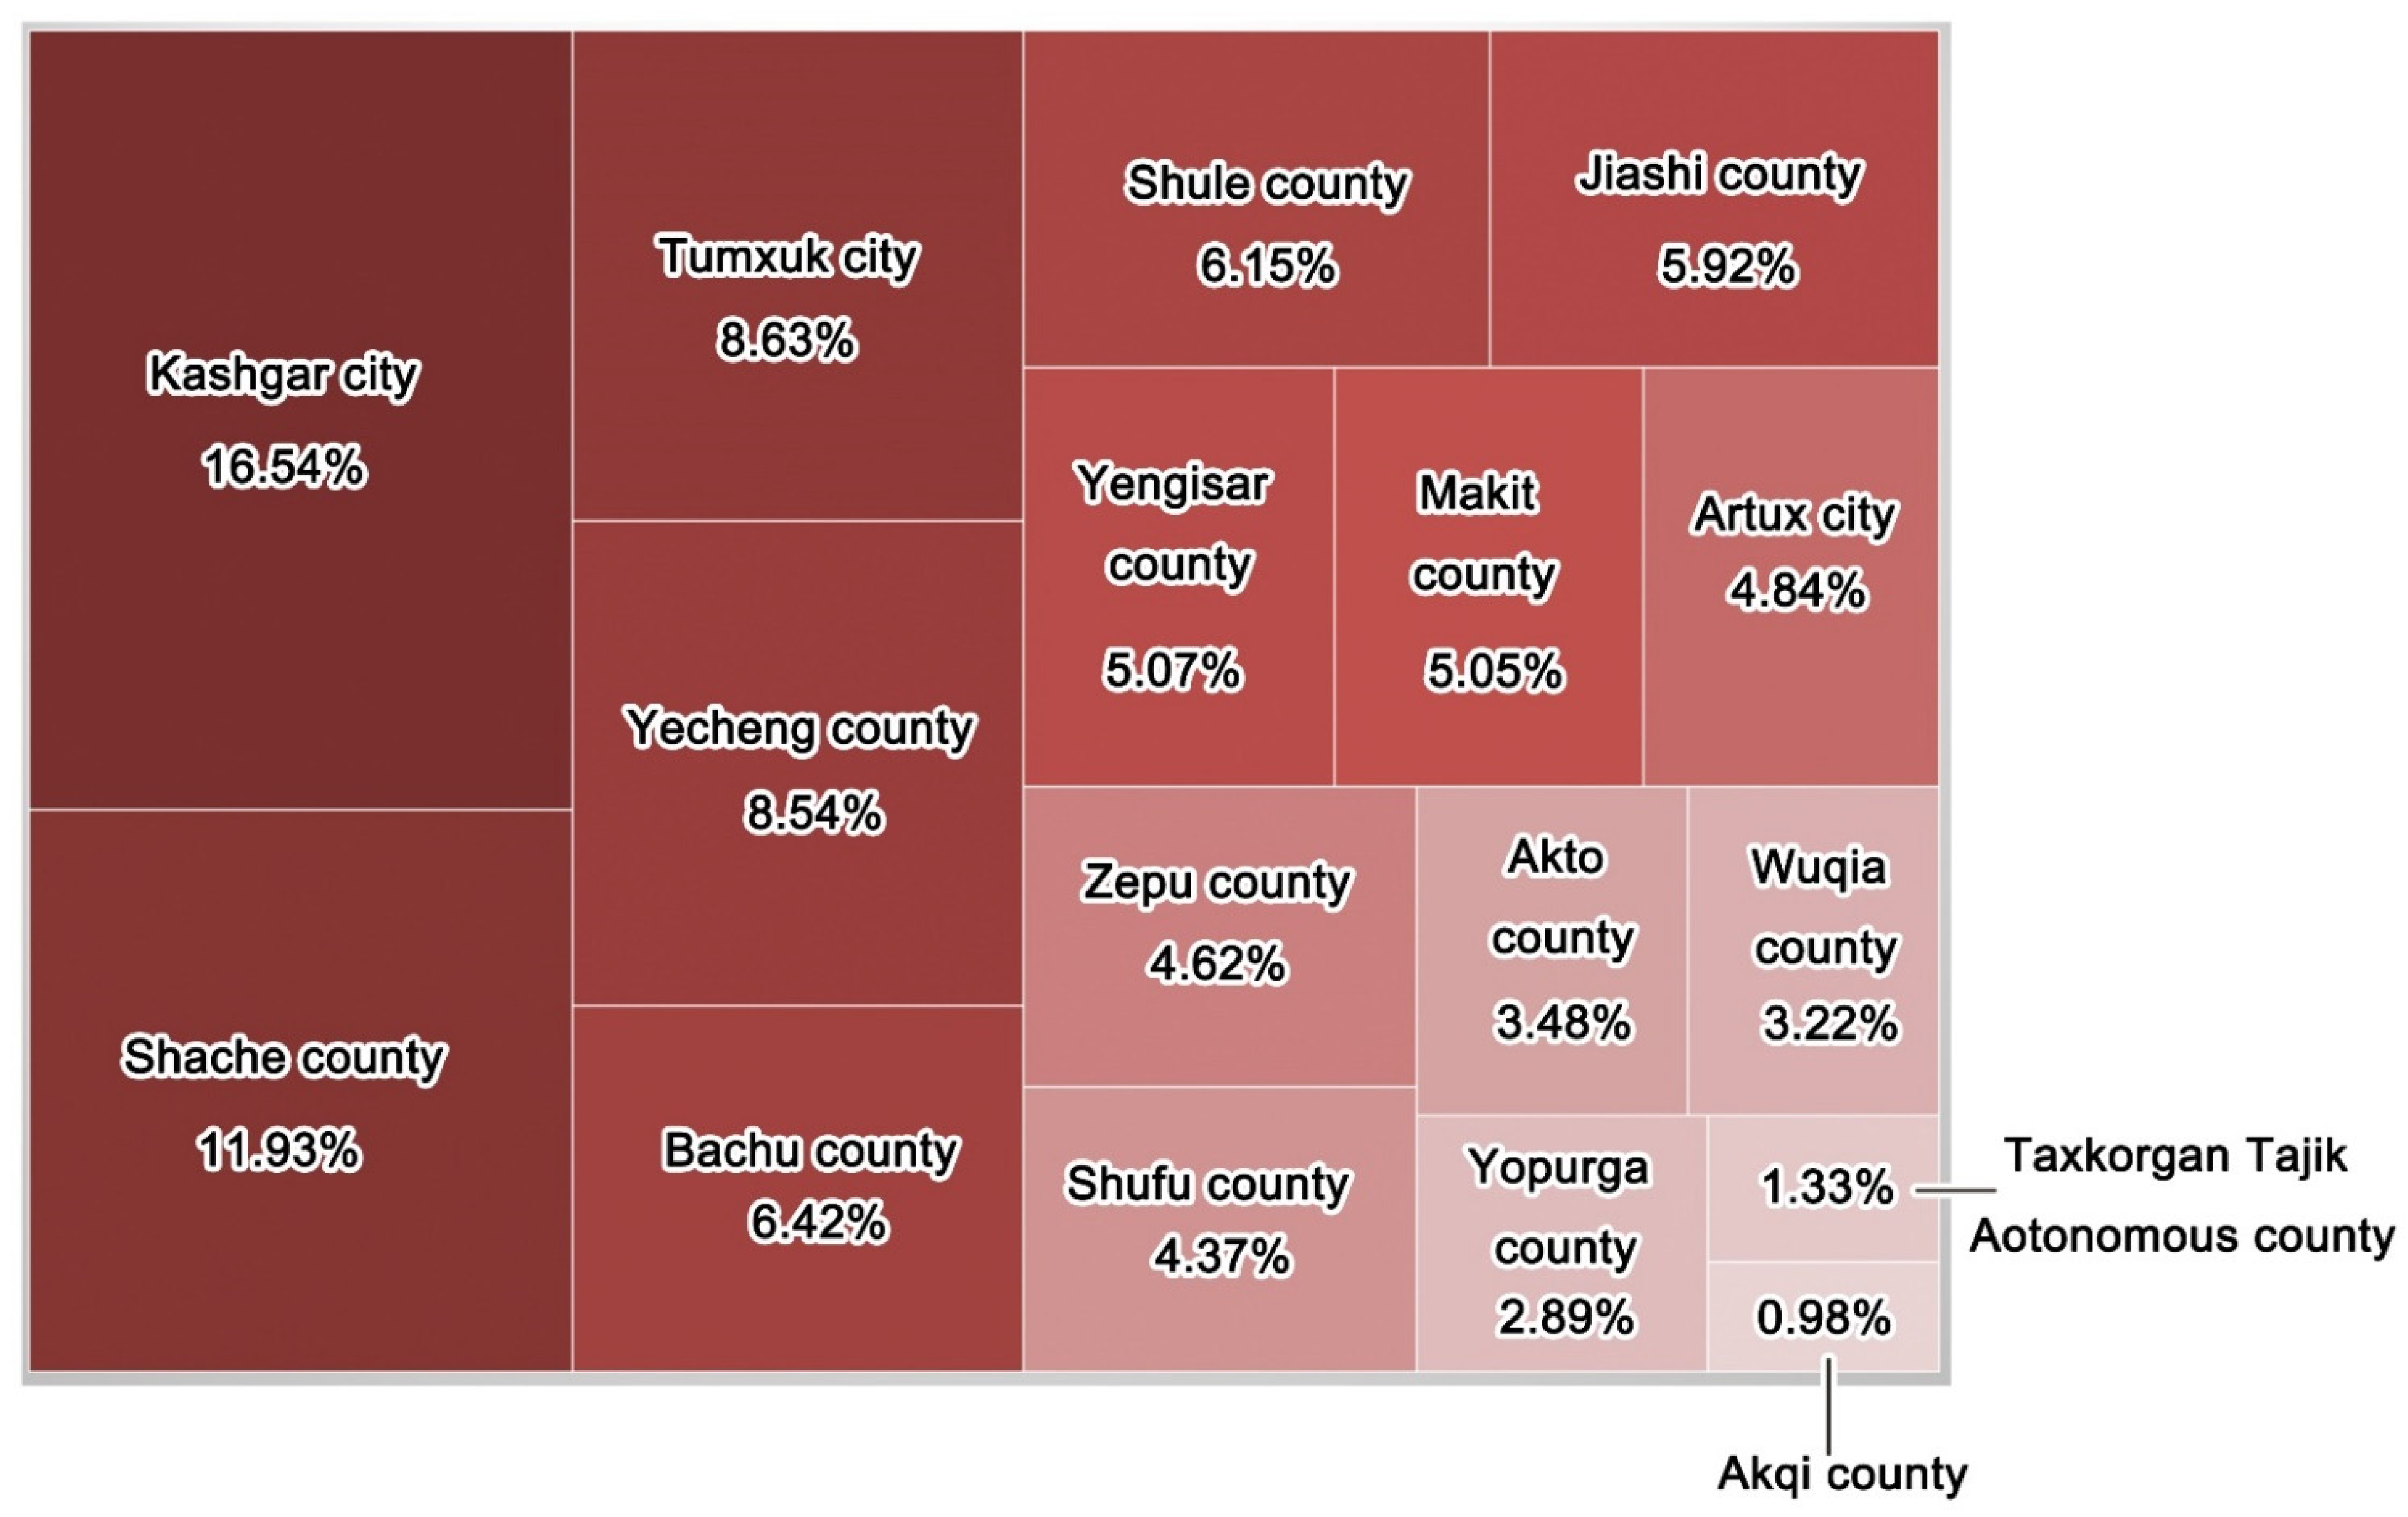
Looking at the Pareto index alone, it is true that there are no cities in the KMA that have a very high degree of primacy. However, the dominance of a city in the region is also closely related to economic factors [68]. From the perspective of the urban population, the urban population of Kashgar City was 30 × 104, and its total urban population ranked first in the KMA in 2018. The primacy city indexes showing the 2-city index, 3-city index, and 5-city indexes of Kashgar City were 1.37, 0.95, and 0.61, respectively. By calculating the proportion of 17 cities’ GDP within the total GDP of the KMA in 2018, it was found that Kashgar City accounts for 16.54% of the GDP of the whole metropolitan area, showing strong economic agglomeration capacity (Figure 6). The calculation shows that the per capita GDP of Kashgar City reaches CNY 26,204; the per capita GDP of Shache County, which has the second largest urban population, is CNY 13,719; and the economic 2-city index of Kashgar city is 1.91. On the whole, Kashgar City currently occupies a certain dominant position in the KMA. In summary, the KMA is a concentrated monocentric-pattern metropolitan area with Kashgar City as its core city at present.

Figure 6.
The proportion of GDP of counties and cities in the KMA in 2018.
5.2. Spatial Structure Characteristics of the KMA
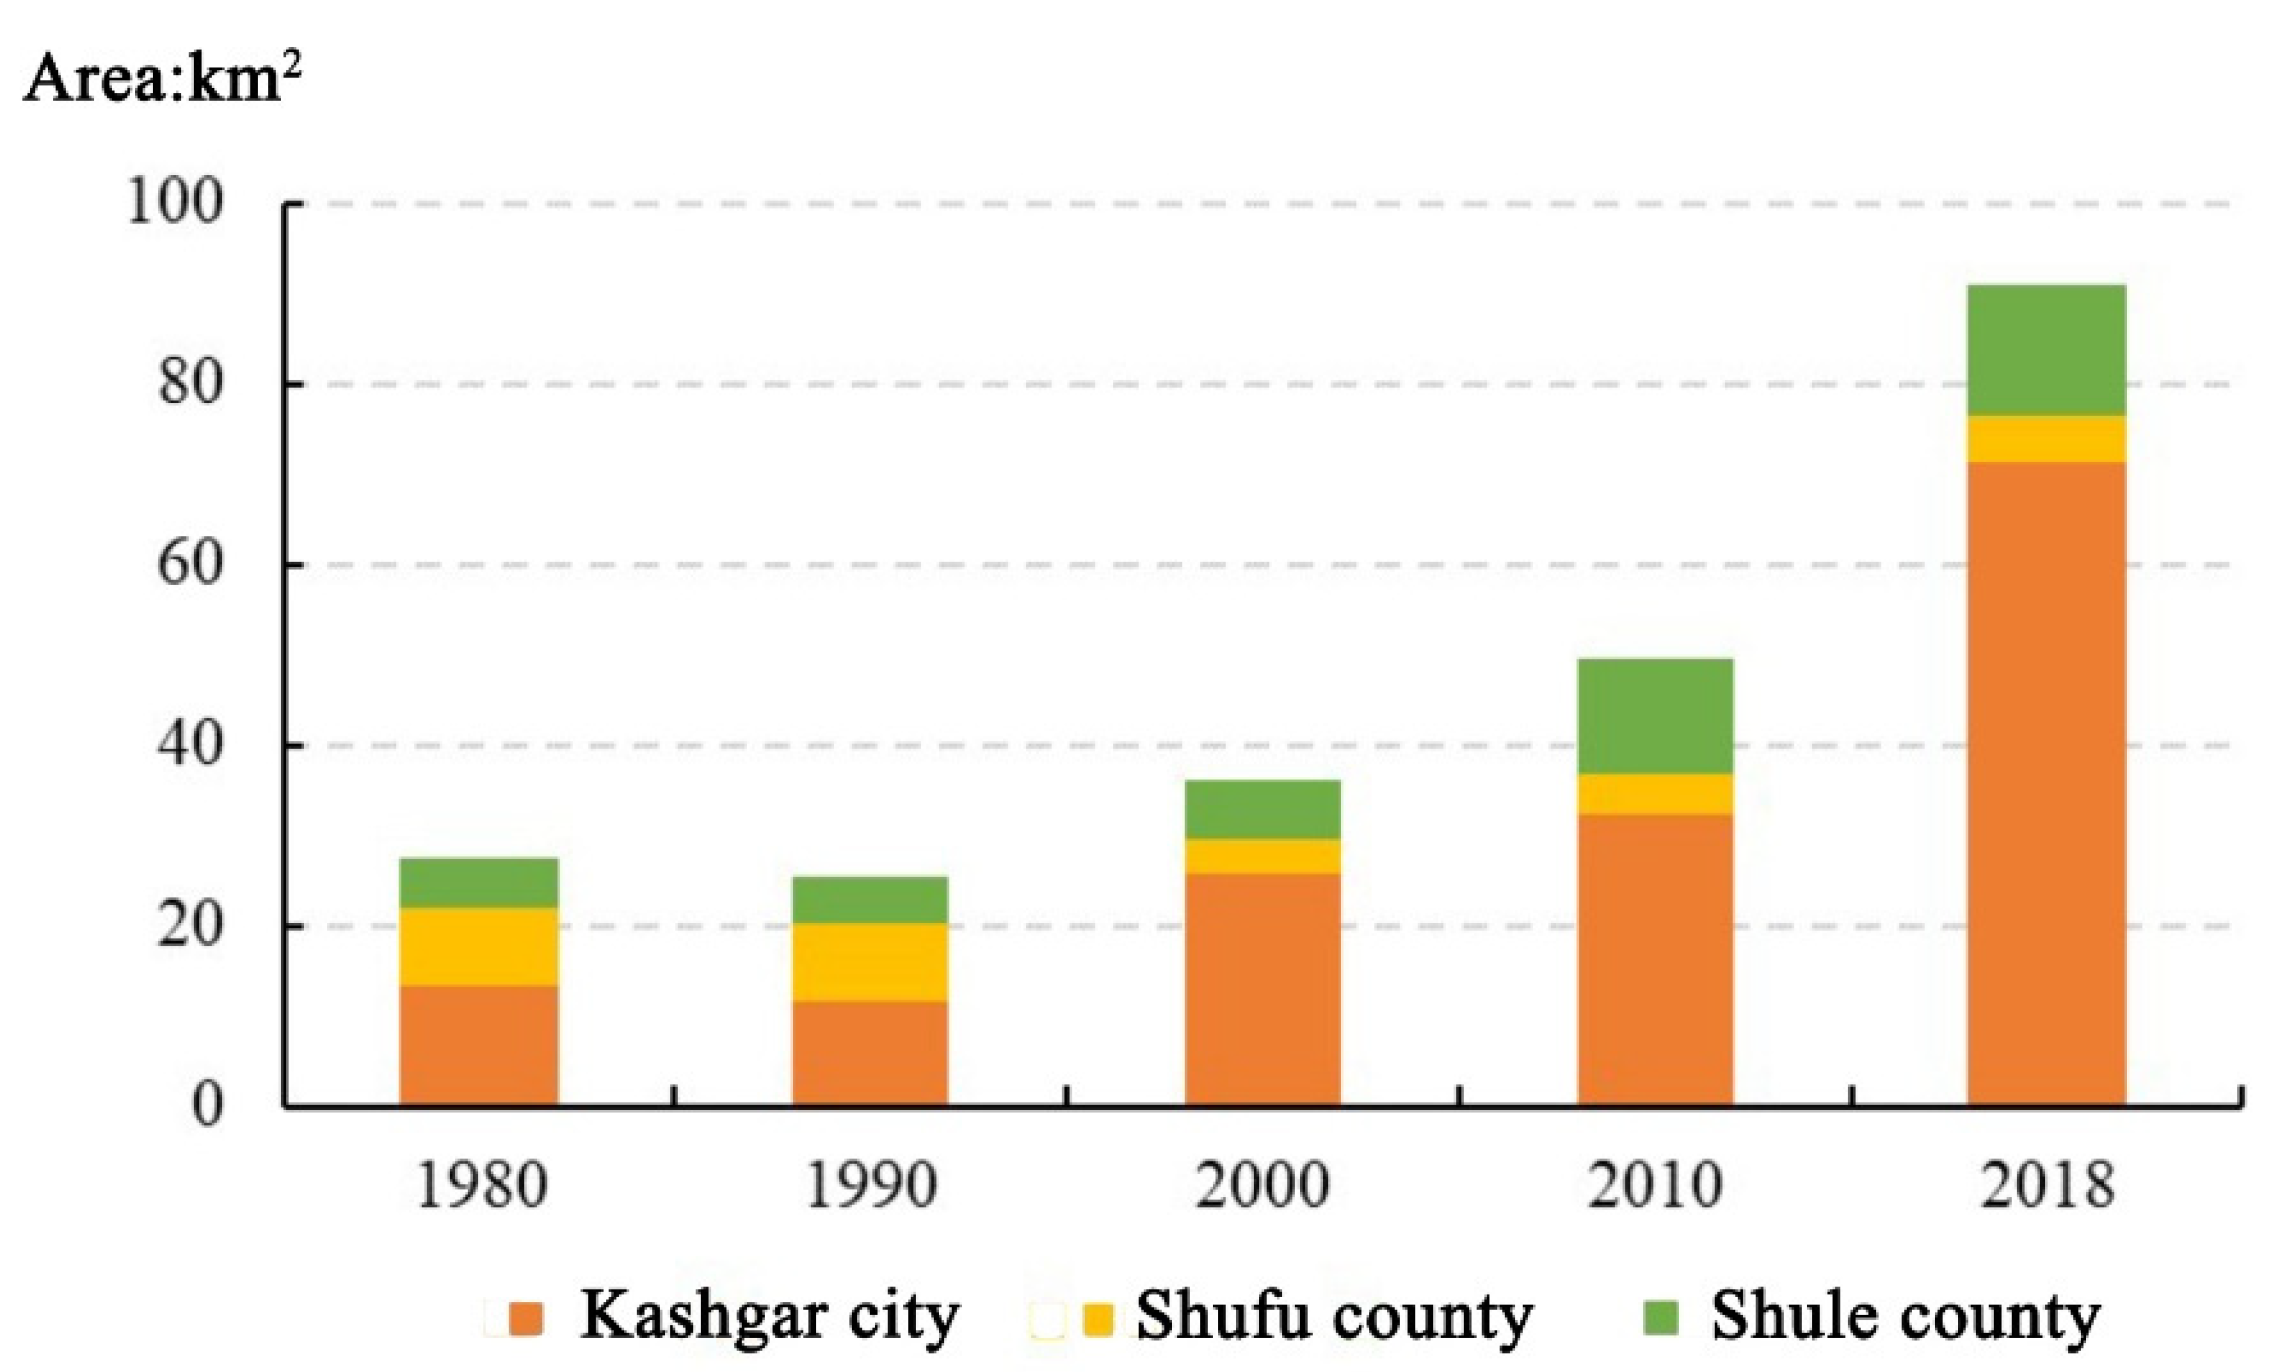
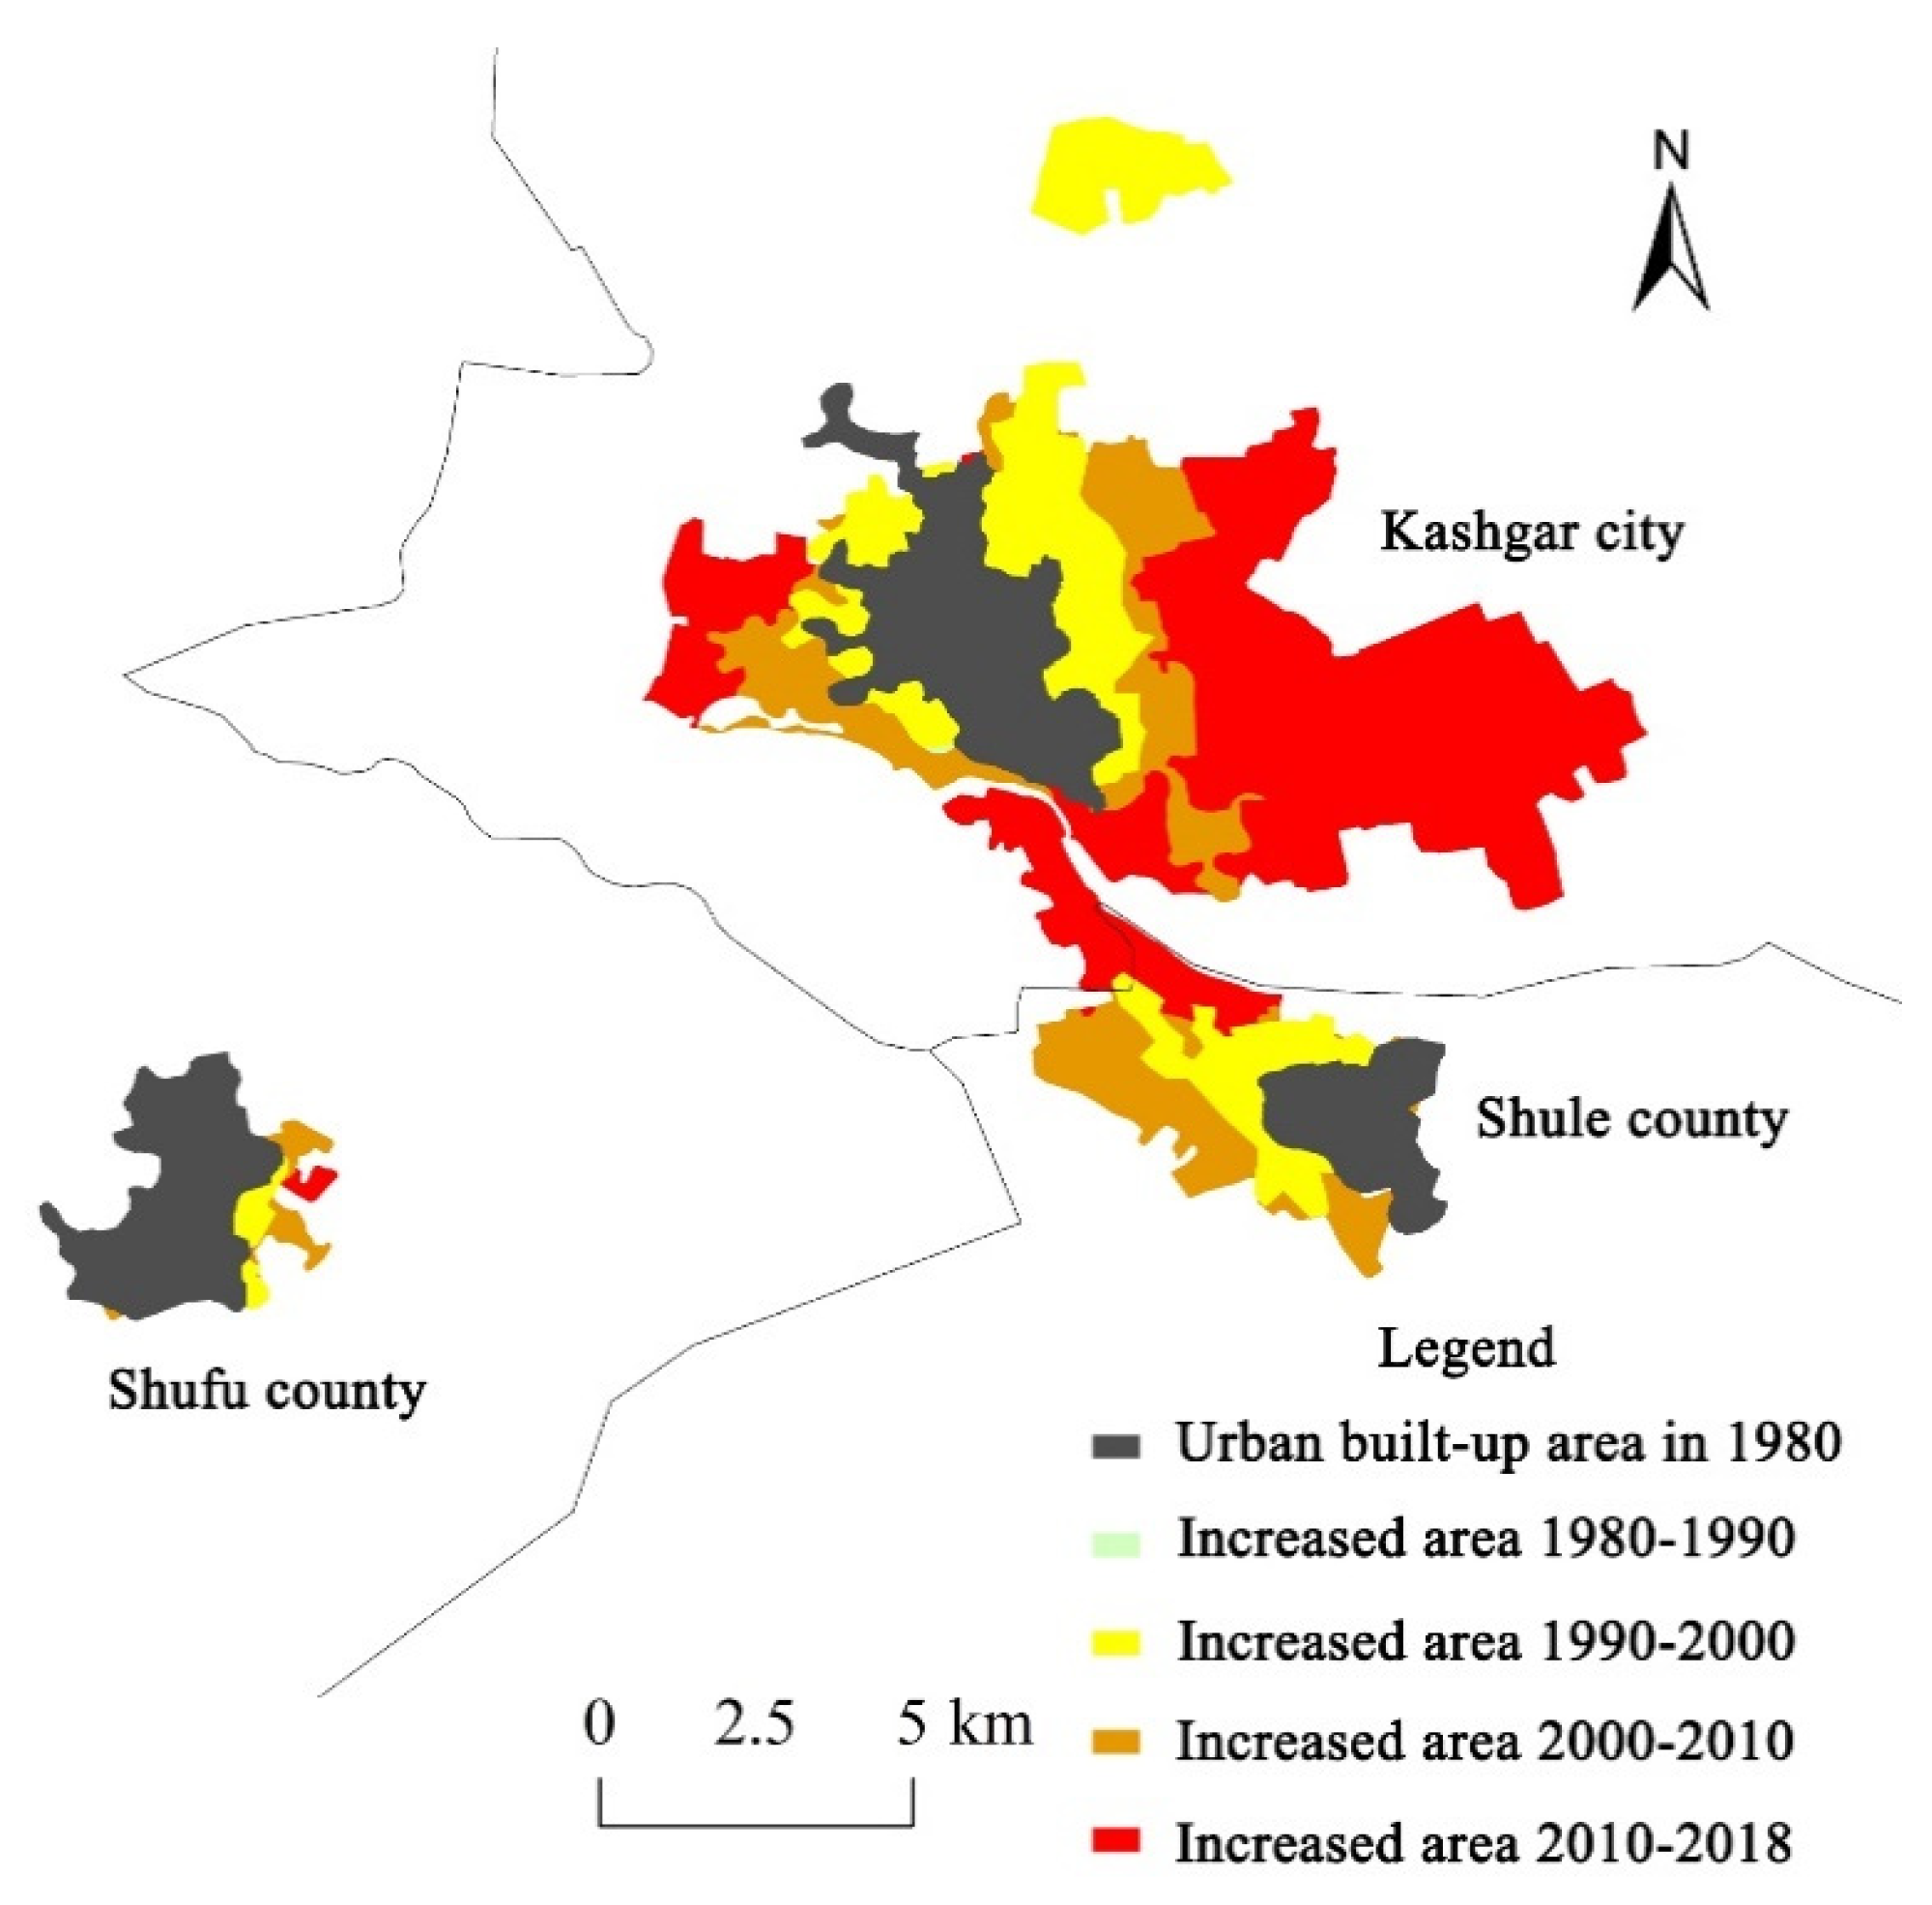
In previous research, we found that Kashgar is a high-primacy city in the KMA, with a large population and high economic activity. With the further development of Kashgar, the current small amount of urban land has been unable to meet the development needs, and urban land use began to spread to the surrounding areas according to the data of the urban built-up area in 1980, 1990, 2000, 2010, and 2018. It was found that the urban built-up area of Kashgar City, Shule County, and Shufu County has been gradually expanding since 1980. With the establishment of the Kashgar Special Economic Zone in 2010 and the implementation of the new round of national counterpart aid plans for Xinjiang, the urban built-up area expanded the most from 2010 to 2018, with a net increase of 41.55 km2 (Figure 7). The urban built-up area of Kashgar City expands to the east and south, which has broken through the administrative boundary and become integrated into one with the urban built-up area of Shule County (Figure 8). In the future, with the further acceleration of the land-use area of the central city Kashgar, the neighboring Shufu County will also be gradually integrated with Kashgar and Shule County and will become a new central area.

Figure 7.
The changes in the urban built-up area from 1980 to 2018.

Figure 8.
A schematic diagram of the spatial expansion of the urban built–up area.
Economic distance and gravity represent the interaction with the core cities of the metropolitan area. Within a certain range of influence, the smaller the economic distance between cities, the greater the gravity, which, to some extent, shows the closer economic and social connection to the core cities. As the core city of the metropolitan area, the flow of population, capital, and information takes place between Kashgar City and the surrounding cities. The distance attenuation law shows that with the increase in distance from the core city, the intensity of flow will decrease [37]. With the aid of the gravity model, the spatial structure characteristics of the KMA can be further clarified.
We used Equations (2) and (3) to obtain the economic distance and gravity from each city to Kashgar, the central city (Table 5). Table 5 shows that Shule County, Artux City, Shufu County, and Akto County have economic distances of less than 20 km. The gravity between these cities and Kashgar City is also greater than 1 million, indicating that these cities are the most closely related to the economy of the core cities. The economic distance of Akqi County is more than 1000 km, indicating that it has the weakest link to the core city.
Table 5.
The economic distance (E) and gravity (S).
The economic distance and gravity between the surrounding cities and counties and the core cities of the metropolitan area represent the strength of their interaction. Within a certain range of influence, the closer the economic distance between cities, the greater the gravity, and the closer the economic and social ties with the core cities. Based on the specific situation of the KMA, we constructed a judgment vector (E, S) of the spatial circle structure of the Kashgar Metropolitan Area. When the economic distance E ≤ 40 km, E is 1; when the economic distance 40 km 110 km, E is 3; when gravity S ≥ 500,000, S is 1; when gravity 500,000 < S < 500,000, S is 2; and when S < 500,000, S is 3.
In the vectors, if there are two values of 1, indicating that the economic correlation between these cities and the core city is high, they can be divided into the core circle. Shule County, Shufu County, and Artux City are the core circles; the vectors of Akto County, Yengisar County, Shache County, and Jiashi County have more than two values of 2, indicating that these cities and the core city economic correlation are low. These are the middle circle. The vectors of the nine cities all have values of 3, indicating that Yecheng County, Bachu County, Wuqia County, Makit County, Yopurga County, Zepu County, Tumxuk City, Taxkorgan Tajik Autonomous County, and Akqi County have a low economic correlation with the core city and are peripheral circles (Table 6).
Table 6.
The vector results.
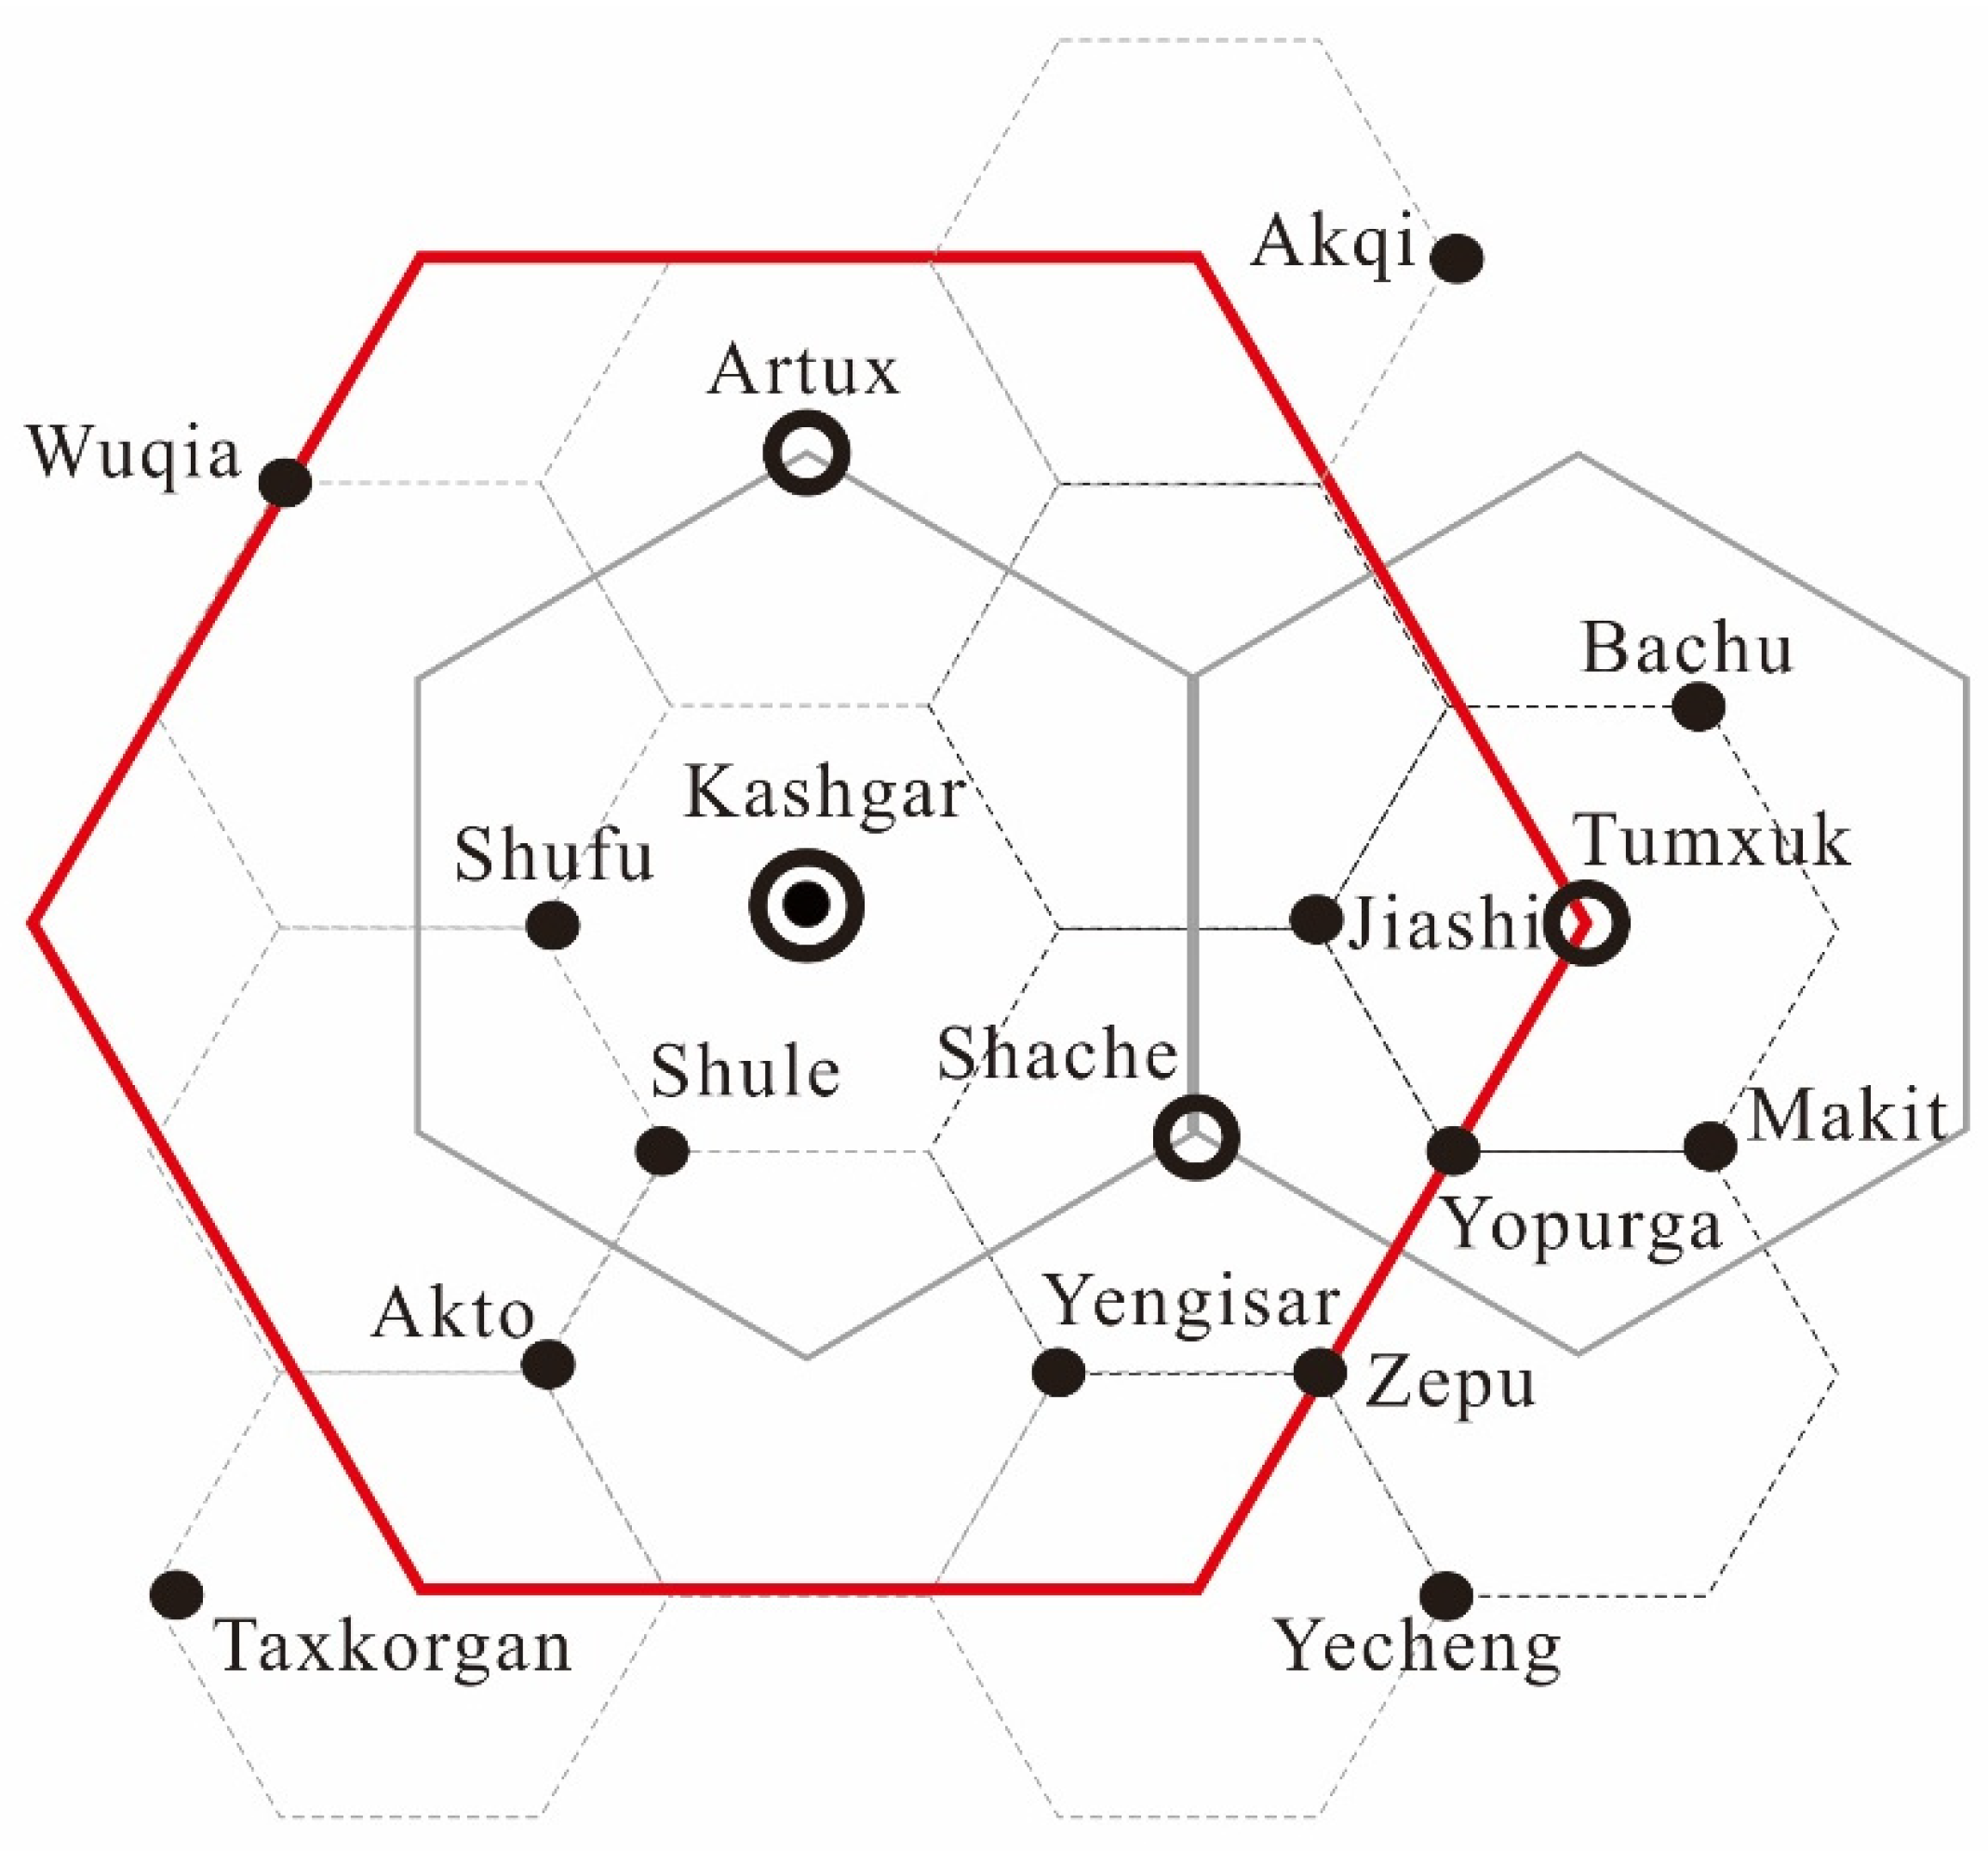
Given the existence of certain agglomeration forces and competition mechanisms, a hierarchy of cities (and, hence, a city-size distribution) naturally arises, including the resulting central-place hierarchies [69]. A reasonable spatial form structure can optimize the hierarchical system and functional structure of cities and reduce the cost of communication between cities [70]. Based on the strength of economic ties between cities, urban population, and other factors, we can also describe the urban spatial structure of the KMA from the perspective of central place theory. In 2018, the urban population of Kashgar, the central city, will reach 300,000, making it the city with the largest urban population in the urban circle. Additionally, it has close economic ties with the surrounding Artux City, Shule County, and Shufu County. From the perspective of economic connection intensity maps and urban population scale, the geometric form of the urban spatial layout in Kashgar City Circle is similar to a hexagon, which is roughly in line with Chris Taylor’s central place theory, that is, the basic principle of hexagon theory. Kashgar City is located in the center of the hexagon and plays the role of an agglomeration and diffusion center. Further abstracting the relevant positions of other cities, it was found that the geometric form of their spatial combination is approximately an equilateral hexagon, and Kashgar City is located in the geometric center of the equilateral hexagon (Figure 9). At present, the development space of Kashgar City is seriously insufficient. Shufu and Shule are close to Kashgar City in space and have the closest economic connection with Kashgar City, which can become the core area; Kashgar, Atush, Shufu, and Shule should be integrated into a robust core circle. This spatial structure is the form with the most benefits, the lowest administrative costs, the highest spatial utilization efficiency, and the most agglomeration benefits. ArcGIS10.2 software was used for spatial visualization, and we found that the Kashgar Metropolitan Area forms a three-level spatial structure, with core, middle, and peripheral circles (Figure 10).
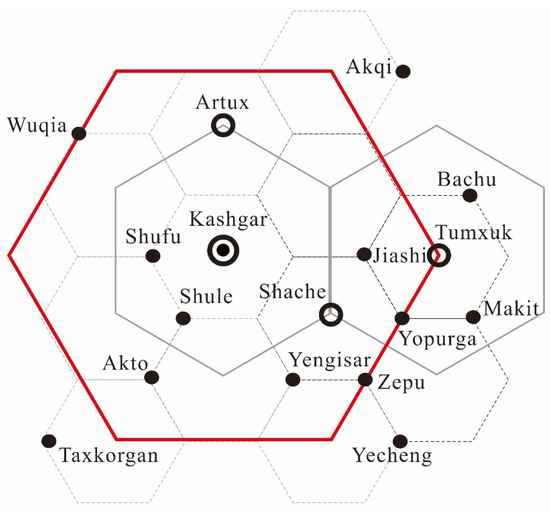
Figure 9.
An abstract schematic diagram of the urban spatial form of KMA.
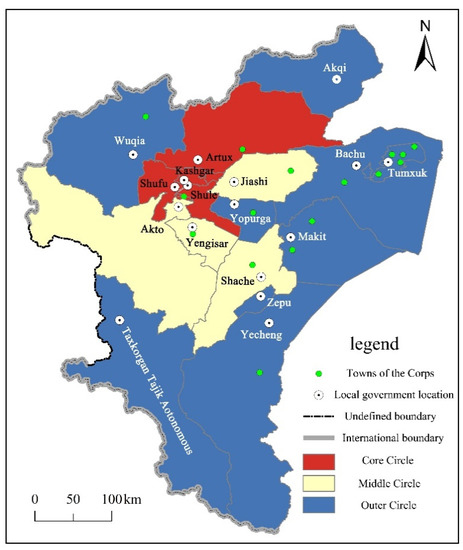
Figure 10.
A map of three types of circle scope in the KMA.
The Chinese government believes that metropolitan areas are a spatial form of urbanization within the urban agglomeration centered on megacities or big cities with strong radiation and driving functions, with a one-hour commuting circle as their basic scope. A one-hour commuting circle represents the closeness of employment links between core cities and neighboring cities [71,72]. This gives rise to a question worth pondering: by what means of transport is the one-hour commuting circle measured? Different means of transportation, such as cars, buses, rail transit, or high-speed rail, can cover completely different ranges.
In this study, considering that the economic development of the Kashgar Metropolitan Area lags behind the developed areas in the East, there are no high-speed railways or subways in the Kashgar Metropolitan Area, so cars were selected as the means of transportation to determine the one-hour commuting range. Using Baidu Maps, Gaode Maps, and navigation data, and with the help of QGIS and GIS software, we generated the 30-min and 60-min isochronal circle range of conventional vehicles (mainly cars) in metropolitan areas (Figure 11). Figure 10 shows an interesting finding: the scopes of the 30-min and 60-min traffic isochronous circles are consistent with the scopes of the central area and the core circle analyzed above, indicating that the above research and analysis are scientific.
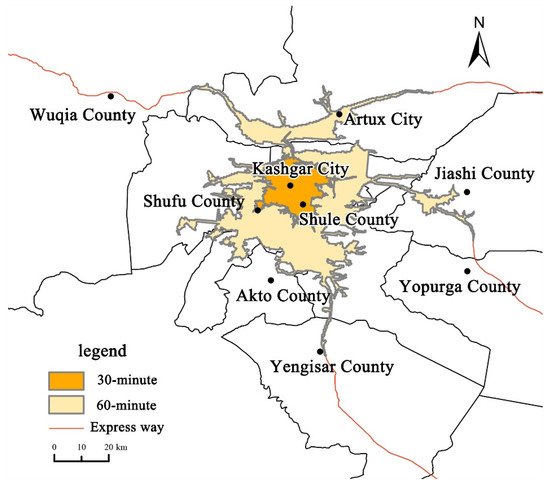
Figure 11.
A map of 30-min and 60-min traffic isochronous circles.
The arrival of the Big Data era has brought new ideas and methods to metropolitan area research. Point of Interest (POI) data are a spatial feature with geographical indications, including name, category, and latitude and longitude information [73]. These data are the basic data used in spatial big data analysis. Compared with remote sensing data and population density data, POI data have certain advantages in improving the speed and acquisition costs [74]. Electronic maps contain a large number of POI data; each name, building, residential area, park, school, hospital, company, and shopping mall are a point of interest [75]. Like Gaode Maps, Baidu electronic maps contain tens of millions of POI data. With the wide use of electronic maps, the application of POI data is gaining increasing attention [76].
POI data can reflect the urban structure and the distribution characteristics corresponding to the road skeleton in space. Due to a large number of residents and merchants on both sides of the road, most POIs are concentrated on both sides of the road and block blocks. When there are many landmarks and merchants on both sides of the road, the distribution characteristics of the POI data corresponding to the road skeleton are more obvious. This spatial distribution mode directly reflects the texture of the city and the agglomeration of various urban activities.
The spatial distribution difference in the POI density heat map reflects different regional development levels and agglomeration effects [77]. Using web crawler software, we collected all categories of POI data from Gaode Maps and Baidu Maps up to September 2021, mainly including catering facilities, hotels, leisure and entertainment facilities, corporate enterprises, finance facilities, and transportation facilities, for a total of 9851 POIs. Then, the search radius was set to 10 km to generate the corresponding thermal diagram (Figure 12). Figure 12 shows that Kashgar City, Artux City, Shufu County, and Shule County have formed a significant hot spot area. This area is the agglomeration area of the whole metropolitan economy and also means that this is the core circle of the metropolitan area, which is consistent with the previous research results. Tumxuk City, Bachu County, Yecheng County, Shache County, and other counties are far from the core cities and cannot be connected with Kashgar, but they are closely related to the surrounding cities, forming the Bachu–Tumxuk Urban Group (BTUG) and the Shache–Zepu–Yecheng Urban Group (SZYUG). Akqi County, Wuqia County, and Taxkorgan Tajik Aotonomous County have weak economic agglomeration ability. These counties’ economic activities have not yet broken through the administrative boundary, which belongs to the peripheral circle of the KMA. The analysis of the POI data directly reflects the agglomeration characteristics of the KMA’s economy and further confirms the analysis results above.
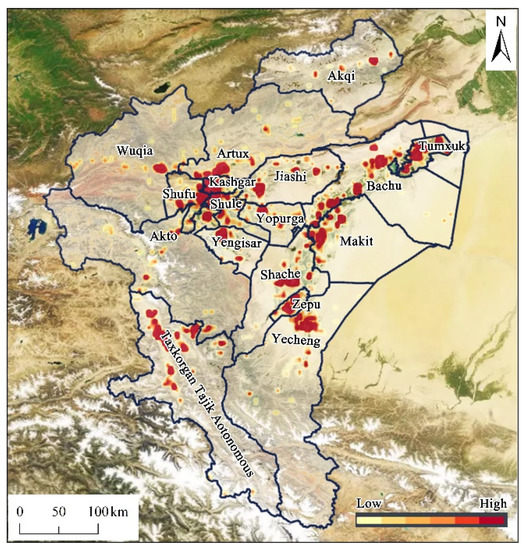
Figure 12.
All types of POI density hot spot maps.
6. Discussion
6.1. The City Size Distribution Characteristics
Our research shows that the KMA exhibits a primacy distribution. This finding is consistent with the existing research results. Previous studies have shown that there are obvious regional differences in the development degree of oasis cities in arid areas, and they all show the characteristics of high primacy [78,79]. There are two main reasons for this phenomenon. On the one hand, it is due to the political status of the city. In China, the primacy of metropolitan cities is also affected by the political status of cities. The higher-level governments are located in them, and they tend to have a larger population and a stronger economic agglomeration capacity [80]. Urumqi City and Kashgar City are the highest-level cities in Xinjiang and Kashgar Administrative Offices. In 2018, the two-city index of Urumqi in Xinjiang reached 2.35; Kashgar City had a two-city index of 1.37 in the KMA. On the other hand, these types of cities are affected by the special oasis environment in the arid areas. The distribution and size of cities in arid areas are determined by the location and area of oases [81]. Large oases with relatively sufficient water and land resources often produce large-scale cities. Kashgar City is located in a large oasis area in the middle and upper reaches of Kashgar River, which provides a good natural environment foundation for the development of Kashgar City (Figure 13).
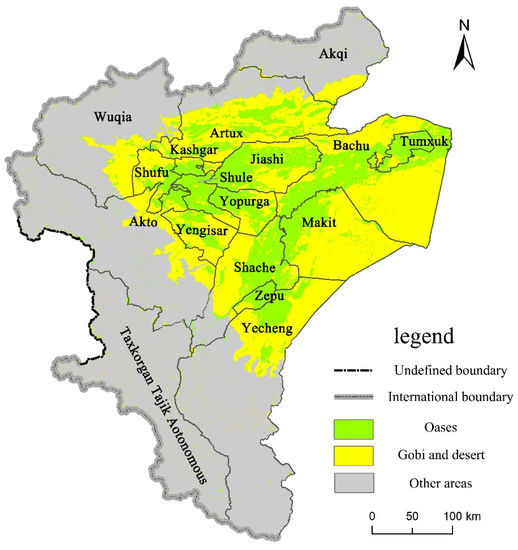
Figure 13.
The distribution of oases and deserts in KMA.
6.2. Policy Implications
Metropolitan areas are a double-edged sword. They gather a large number of economic factors and promote the development of the regional social economy. However, the development of metropolitan areas also has an impact on the surrounding sensitive ecological environment [82], such as occupying cultivated land and ecological habitats and producing some pollutants. Arid areas are widely of concern due to their fragile oasis ecological environment. The planning and construction of metropolitan areas in arid areas will inevitably influence the oases’ ecological environment. However, the economic development level of China’s arid areas obviously lags behind that of the whole country, which is an undeniable fact [83]. Most of the population is still concentrated in rural areas, and they are engaged in primary industry activities. Therefore, while building a metropolitan area in arid areas, it is also essential to protect the ecological environment. Therefore, the local government has also taken some measures, such as the Tarim river resource allocation plan, emphasizing the importance of ecological water use [84]. By analyzing the core circle, middle circle, and expansion circle of the Kashgar Metropolitan Area, our research mainly aimed to adopt different development models in the separate circles. The core circle has a higher economic level and a large urban population within the whole metropolitan area, and has a large oasis area and relatively sufficient water resources that can support the development of most of the population and economy of the metropolitan area. Therefore, the main goal of the core circle is to continue to accelerate the progress of urbanization, attract foreign populations and investment, and protect the ecological environment. Most of the cities in the outer circle are located at the edge of high-altitude mountains and deserts, and the water resources are relatively insufficient to carry a larger population and economy. Therefore, ecological protection should be the main goal; the middle circle connects the core circle and the outer circle. In the future, economic development and construction can be performed along the main traffic routes.
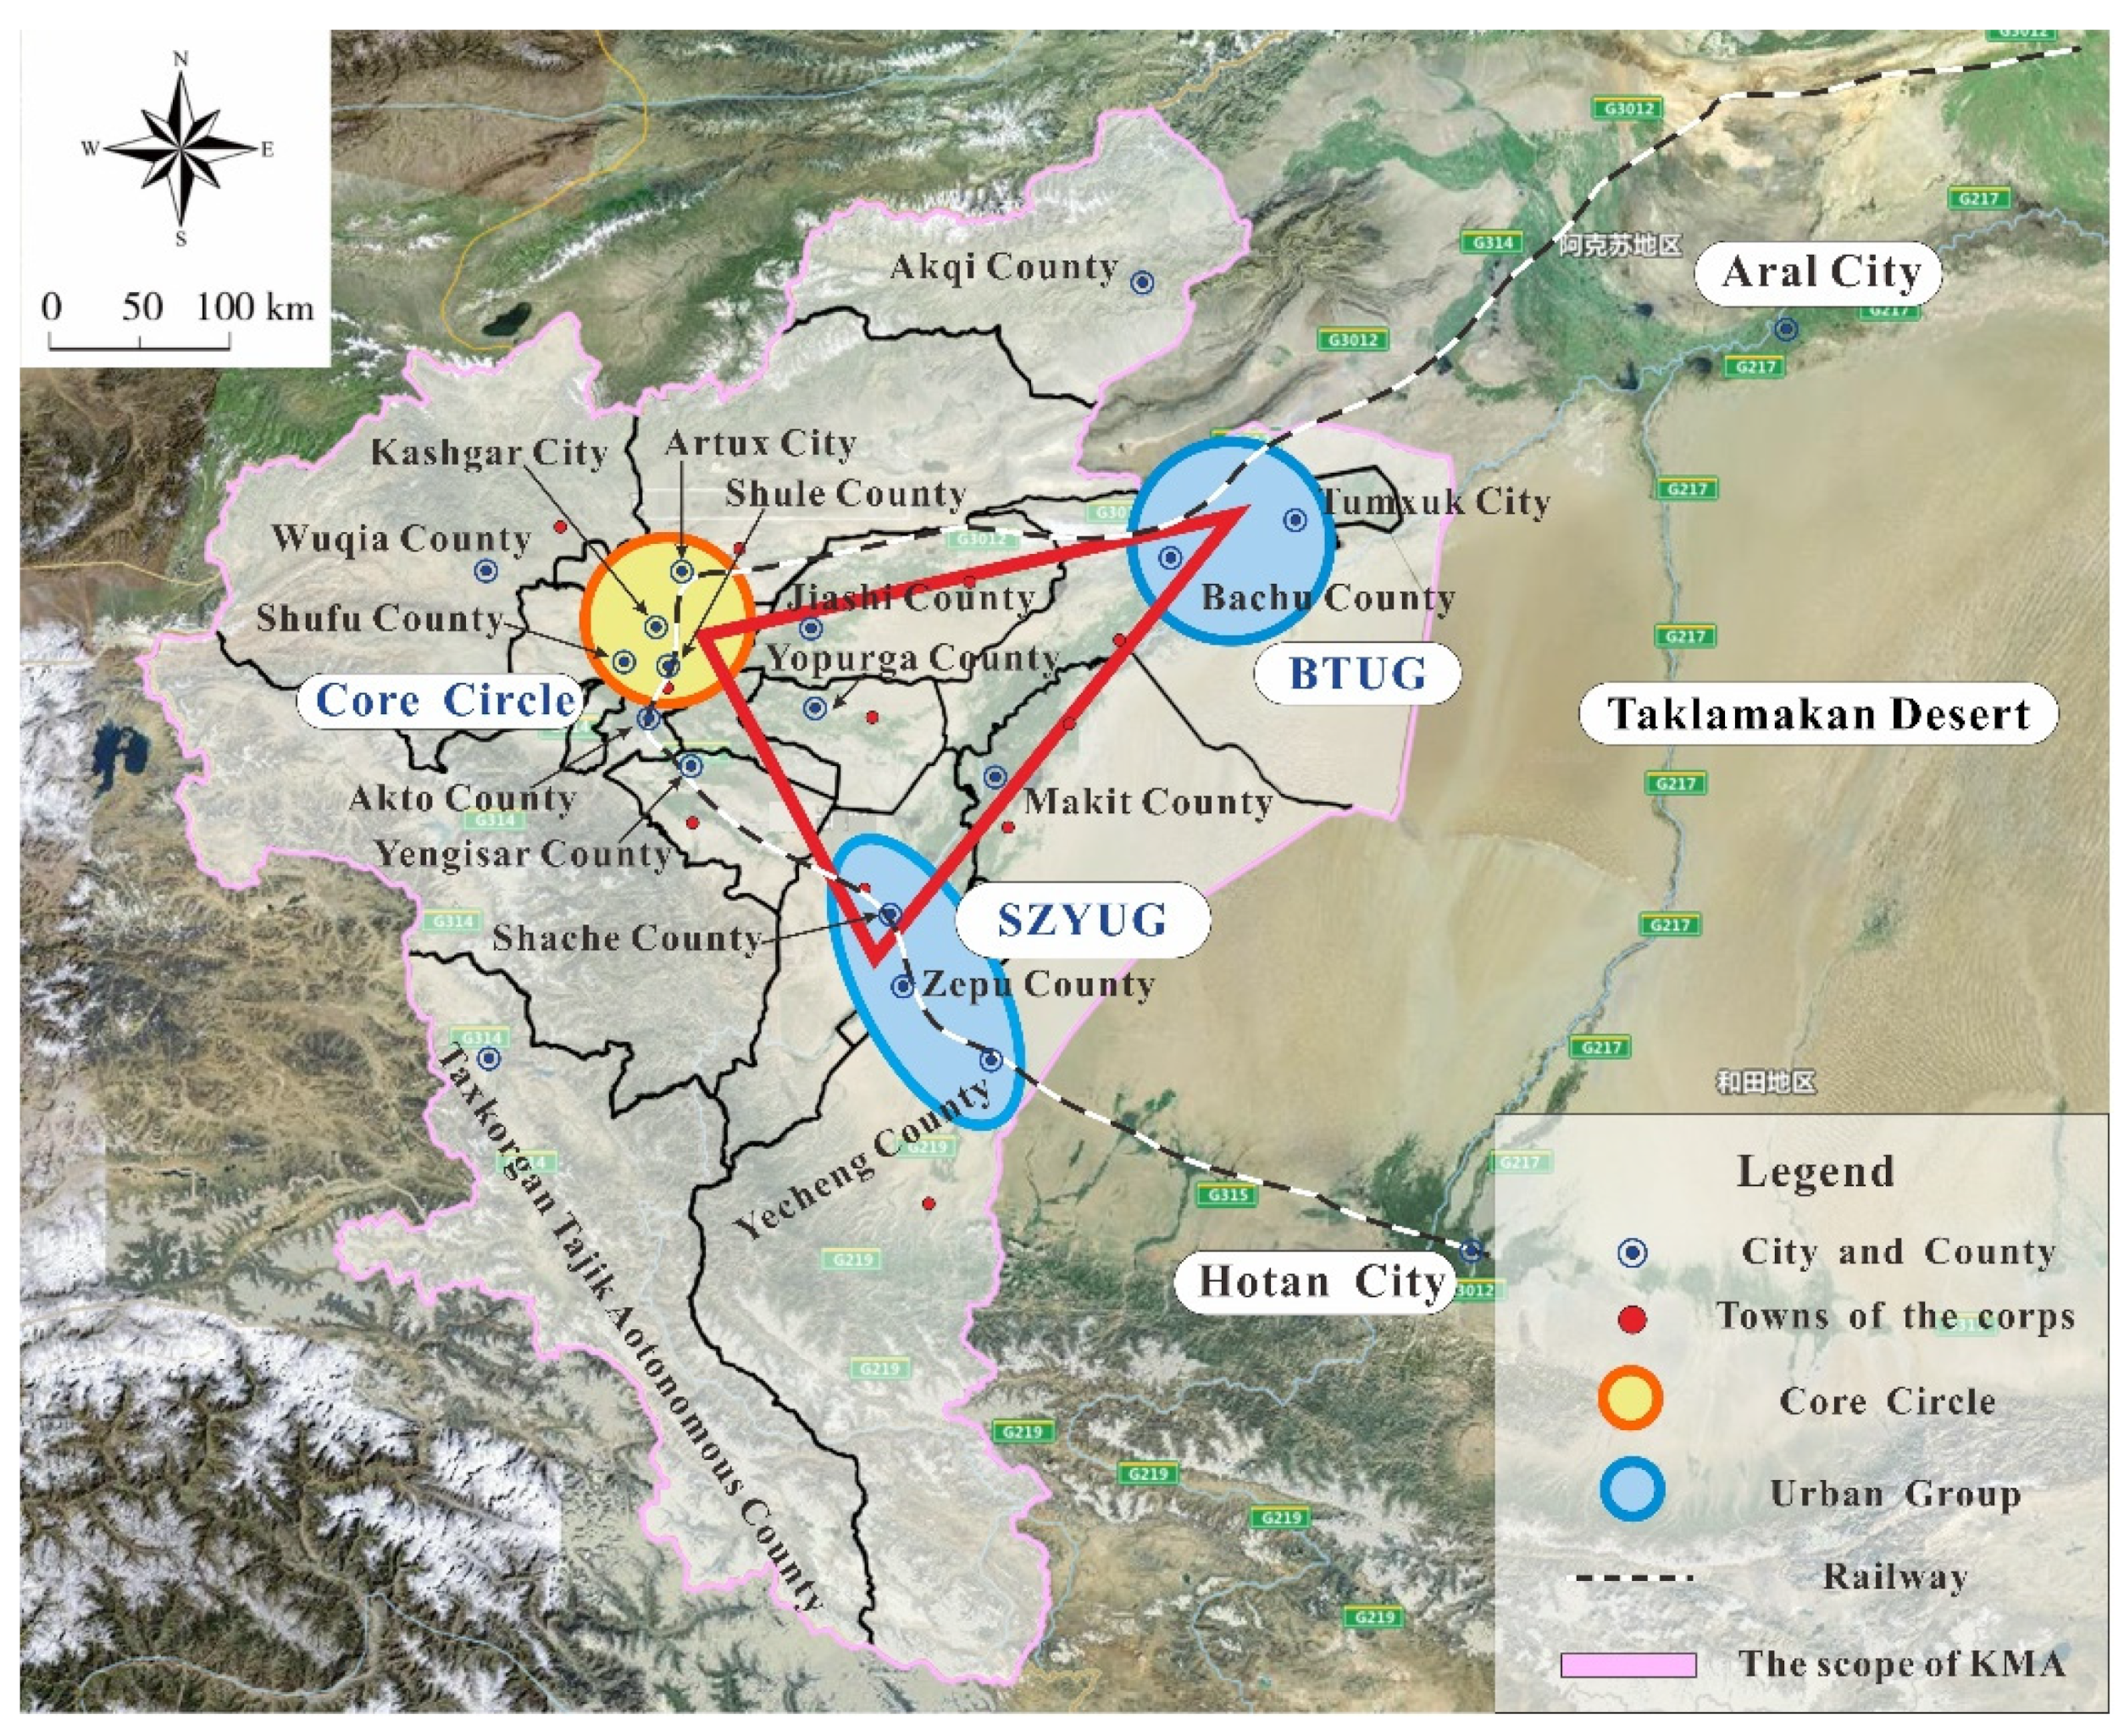
At present, the KMA is still in its initial stage of development. Like the Lhasa Metropolitan Area, the economic development of the KMA is lagging compared to other metropolitan areas in China. In the future, it is suggested that the local government should give priority to improving the economic development of the core circle in the metropolitan area; break the boundaries of administrative districts; promote the unified development of the market; unify the planning and design of traffic lines; and unify the governance of environmental pollution in order to achieve the integrated development of Kashgar, Artux, Shufu County, and Shule County. At the same time, the local government could provide preferential policies to actively develop the BTUG and SZYUG, and form a triangular spatial development structure for the KMA (Figure 14). Future development also needs to protect and save water resources. As is known, water resources are important for urban development in arid areas. Additionally, this could help protect the local ecological environment and prevent the Taklimakan desert from moving westward.
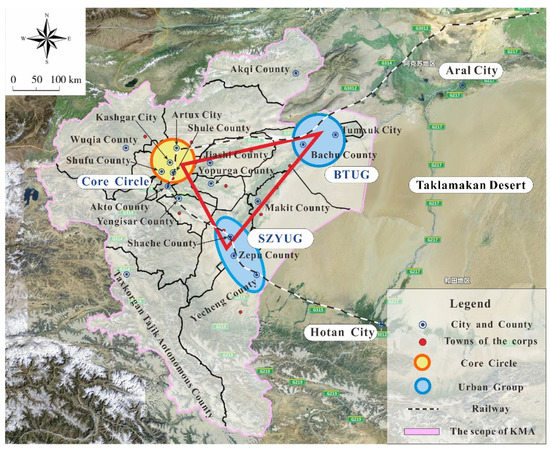
Figure 14.
A spatial development pattern of KMA.
6.3. Limitations and Future Research Directions
With the development of economic globalization, a single city cannot develop in isolation. It must cooperate with other cities to achieve greater economic benefits. Therefore, urban spatial organizations such as metropolitan areas and urban agglomerations are born [85]. Due to the constraints of the fragile natural environment, the construction of metropolitan areas in arid areas is more realistic than urban agglomeration. This is because urban agglomerations have a greater concentration of people, but the water resources in the KMA are not enough to support the population of an urban agglomeration.
This paper has taken the KMA in an arid area as a case study. We used the gravity model to quantitatively analyze the core city, core circle, middle circle, and outer circle of the KMA. Our results provide suggestions for the development of arid areas from a spatial perspective. However, there are also some shortcomings. Since official sources have not published the urban population data since 2019, the research period of this paper was limited to 2018, which, to some extent, affects the results of this study. In the future, we will further analyze the spatial structure characteristics of the KMA with smaller research units and pay attention to the influence of natural environments, such as deserts, on the spatial structure of the metropolitan area.
7. Conclusions
- (1)
- It was found that the Pareto index of the KMA from 2000 to 2018 was greater than 1, indicating that large cities have a high primacy of development, while small and medium-sized cities are underdeveloped. The change characteristics of the grade scale fitting curve show that the scale of high-primacy cities has decreased, but this is not obvious. This is also confirmed by the economic and urban population size of cities in the KMA. Therefore, at present, the KMA is a concentrated monocentric-pattern metropolitan area, with Kashgar City as its core city.
- (2)
- The urban built-up area of Kashgar City is expanding to the east and south, where it has broken through the administrative boundary and become integrated with the urban built-up area of Shule County. With the help of the gravity model, the spatial structure characteristics of the KMA have been further clarified. Shule County, Shufu County, and Artux City are the core circle; Akto County, Yengisar County, Shache County, and Jiashi County are the middle circle; and Yecheng County, Bachu County, Wuqia County, Makit County, Yopurga County, Zepu County, Tumxuk City, Taxkorgan Tajik Autonomous County, and Akqi County have a low economic correlation with the core city and form the outer circle.
- (3)
- Tumxuk City, Bachu County, Yecheng County, Shache County, and other counties are far from the core city and cannot be connected with Kashgar, but they are closely related to the surrounding cities, forming the Bachu–Tumxuk Urban Group and the Shache–Zepu–Yecheng Urban Group.
Author Contributions
J.L. (Jiangang Li) and S.L.: conceptualization, formal analysis, and writing; J.L. (Jun Lei) and X.Z.: conceptualization, supervision; J.Q.: visualization; B.T.: writing—review and editing; and Z.D.: conceptualization, data curation. All authors have read and agreed to the published version of the manuscript.
Funding
This research was funded by the Strategic Priority Research Program of the Chinese Academy of Sciences, Pan-Third Pole Environment Study for a Green Silk Road (Pan-TPE), grant number XDA20040400, Henan Philosophy and Social Science Planning Project , grant number 2021BJJ002, and Key Scientific Research Projects of Colleges and Universities in Henan Province, grant number 22A170003. And the APC was funded by the Strategic Priority Research Program of the Chinese Academy of Sciences, Pan-Third Pole Environment Study for a Green Silk Road (Pan-TPE).
Institutional Review Board Statement
Not applicable.
Informed Consent Statement
Not applicable.
Data Availability Statement
The data used to support the findings of this study are available from the authors upon request.
Acknowledgments
We thank the anonymous experts for their valuable suggestions, which helped to substantially improve the manuscript.
Conflicts of Interest
The authors declare no conflict of interest.
References
- Xu, J.; Yeh, A.G. Governance and Planning of Mega-City Regions: An International Comparative Perspective. In Devon: Routledge Studies in Human Geography; Routledge: Abingdon-on-Thames, UK, 2011. [Google Scholar]
- Scott, A.J. Global City-Regions: Trends, Theory, Policy; OUP: Oxford, UK, 2001. [Google Scholar]
- Ingram, G.K. Patterns of metropolitan development: What have we learned? Urban Stud. 1998, 35, 1019–1035. [Google Scholar] [CrossRef] [Green Version]
- Lin, G.C.S. Metropolitan development in a transitional socialist economy: Spatial restructuring in the Pearl River Delta, China. Urban Stud. 2001, 38, 383–406. [Google Scholar] [CrossRef]
- Ye, L. State-led metropolitan governance in China: Making integrated city regions. Cities 2014, 41, 200–208. [Google Scholar] [CrossRef]
- He, S.; Fang, C.; Zhang, W. A geospatial analysis of multi-scalar regional inequality in China and in metropolitan regions. Appl. Geogr. 2017, 88, 199–212. [Google Scholar] [CrossRef]
- OECD; European Commision. A New Perspective on Urbanization; OECD: Paris, France, 2020. [Google Scholar]
- Cherlet, M.; Hutchinson, C.; Reynolds, J.; Hill, J.; Sommer, S.; Von Maltitz, G. World Atlas of Desertification: Rethinking Land Degradation and Sustainable Land Management; Publications Office of the European Union: Luxembourg, 2018. [Google Scholar]
- IUCN. Drylands and Land Degradation. Available online: https://www.iucn.org/resources/issues-briefs/drylands-and-land-degradation (accessed on 5 March 2020).
- Mortimore, M.; Anderson, S.; Cotula, L.; Davies, J.; Faccer, K.; Hesse, C.; Morton, J.; Nyangena, W.; Skinner, J.; Wolfangel, C. Dryland Opportunities: A New Paradigm for People, Ecosystems and Development; International Union for Conservation of Nature: Gland, Switzerland, 2009. [Google Scholar]
- Reynolds, J.F.; Smith, D.M.; Lambin, E.F.; Turner, B.L.; Mortimore, M.; Batterbury, S.P.; Downing, T.E.; Dowlatabadi, H.; Fernandez, R.J.; Herrick, J.E.; et al. Global desertification: Building a science for dryland development. Science 2007, 316, 847–851. [Google Scholar] [CrossRef] [PubMed] [Green Version]
- Middleton, N.J.; Sternberg, T. Climate hazards in drylands: A review. Earth Sci. Rev. 2013, 126, 48–57. [Google Scholar] [CrossRef]
- Armah, F.A.; Odoi, J.O.; Yengoh, G.T.; Obiri, S.; Yawson, D.O.; Afrifa, E.K.A. Food security and climate change in drought-sensitive savanna zones of Ghana. Mitig. Adapt. Strateg. Glob. Change 2011, 16, 291–306. [Google Scholar] [CrossRef]
- Li, J.; Lei, J.; Li, S.; Yang, Z.; Tong, Y.; Zhang, S.; Duan, Z. Spatiotemporal analysis of the relationship between urbanization and the eco-environment in the Kashgar metropolitan area, China. Ecol. Indic. 2022, 135, 108524. [Google Scholar] [CrossRef]
- Xie, Y.; Ward, R.; Fang, C.; Qiao, B. The urban system in West China: A case study along the mid-section of the ancient Silk Road–He-Xi Corridor. Cities 2007, 24, 60–73. [Google Scholar] [CrossRef]
- Cai, Z.; Liu, Q.; Cao, S. Real estate supports rapid development of China’s urbanization. Land Use Policy 2020, 95, 104582. [Google Scholar] [CrossRef]
- Lin, J.; Lei, J.; Yang, Z.; Li, J. Differentiation of Rural Development Driven by Natural Environment and Urbanization: A Case Study of Kashgar Region, Northwest China. Sustainability 2019, 11, 6859. [Google Scholar] [CrossRef] [Green Version]
- Mamat, A.; Halik, Ü.; Rouzi, A. Variations of Ecosystem Service Value in Response to Land-Use Change in the Kashgar Region, Northwest China. Sustainability 2018, 10, 200. [Google Scholar] [CrossRef] [Green Version]
- Fang, C.L. China’s Urban Agglomeration and Metropolitan Area Construction under the New Development Pattern. Econ. Geogr. 2021, 41, 1–7. [Google Scholar]
- Gutierrez, J.; García-Palomares, J.C. New spatial patterns of mobility within the metropolitan area of Madrid: Towards more complex and dispersed flow networks. J. Transp. Geogr. 2007, 15, 18–30. [Google Scholar] [CrossRef]
- Lin, G.; Jiang, D.; Fu, J.; Zhao, Y. A Review on the Overall Optimization of Production–Living–Ecological Space: Theoretical Basis and Conceptual Framework. Land 2022, 11, 345. [Google Scholar] [CrossRef]
- Castañer, M. La ciudad real en Cataluña. Las áreas de cohesión. Ciudad. Y Territ. Estud. Territ. 1994, 99, 101–115. [Google Scholar]
- Fragkias, M.; Seto, K.C. Evolving rank-size distributions of intra-metropolitan urban clusters in South China. Comput. Environ. Urban Syst. 2009, 33, 189–199. [Google Scholar] [CrossRef]
- Mu, L.; Wang, X. Population landscape: A geometric approach to studying spatial patterns of the US urban hierarchy. Int. J. Geogr. Inf. Sci. 2006, 20, 649–667. [Google Scholar] [CrossRef]
- McGee, T.G. The emergence of Desa-kota regions in Asia: Expanding a hypothesis. In The Extended Metropolis: Settlement Transition in Asia; University of Hawaii Press: Mānoa valley, HI, USA, 1991. [Google Scholar]
- Gottmann, J. Megalopolis or the urbanization of the northeastern seaboard. Econ. Geogr. 1957, 33, 189–200. [Google Scholar] [CrossRef]
- Wei, W.; Zhao, G. Research on patterns of Japanese Metropolitans circles: A literature review. Contemp. Econ. Jpn. 2005, 140, 40–45. [Google Scholar]
- Martin, D. Automatic neighbourhood identification from population surfaces. Environ. Urban Syst. 1998, 22, 107–120. [Google Scholar] [CrossRef]
- Zhuo, Y.; Shi, Y. Toward establishing the concept of physical urban area in China. Acta Geogr. Sin. 1995, 50, 289–301. (In Chinese) [Google Scholar]
- Ning, Y. Definition of Chinese Metropolitan Areas and Large Urban Agglomerations: Role of Large Urban Agglomerations in Regional Development. Sci. Geogr. Sin. 2011, 31, 289–301. (In Chinese) [Google Scholar]
- Gu, C. A preliminary study on the division of urban economic regions in China. Acta Geogr. Sin. 1991, 46, 129–141. (In Chinese) [Google Scholar]
- Zhuo, Y. Urban Geography; Beijing Commercial Press: Beijing, China, 1995. (In Chinese) [Google Scholar]
- Wang, Z.; Li, J.; Liang, L. Identifying the scope of the Lhasa Metropolitan Area based on a spatial field energy model. J. Geogr. Sci. 2021, 31, 245–264. [Google Scholar] [CrossRef]
- Luo, S.; Johnston, A.; Chen, D. Approach to delimiting metropolitan regions’ boundary and grading urban hierarchy within a metropolitan region—A case study of Shanghai metropolitan region. Chin. Geogr. Sci. 2008, 18, 197–205. [Google Scholar] [CrossRef]
- Yue, W.; Chen, Y.; Thy, P.T.M.; Fan, P.; Liu, Y.; Zhang, W. Identifying urban vitality in metropolitan areas of developing countries from a comparative perspective: Ho Chi Minh City versus Shanghai. Sustain. Cities Soc. 2021, 65, 102609. [Google Scholar] [CrossRef]
- Dadashpoor, H.; Malekzadeh, N. Evolving spatial structure of metropolitan areas at a global scale: A context-sensitive review. GeoJournal 2021, 86, 1–28. [Google Scholar] [CrossRef]
- Baum-Snow, N. Changes in Transportation Infrastructure and Commuting Patterns in U.S. Metropolitan Areas, 1960–2000. Am. Econ. Rev. 2010, 100, 378–382. [Google Scholar] [CrossRef] [Green Version]
- McMillen, D.P. Employment Densities, Spatial Autocorrelation, and Subcenters in Large Metropolitan Areas. J. Reg. Sci. 2004, 44, 225–244. [Google Scholar] [CrossRef]
- Saghapour, T.; Moridpour, S.; Thompson, R.G. Public transport accessibility in metropolitan areas: A new approach incorporating population density. J. Transp. Geogr. 2016, 54, 273–285. [Google Scholar] [CrossRef]
- Mazzocchi, C.; Sali, G.; Corsi, S. Land use conversion in metropolitan areas and the permanence of agriculture: Sensitivity Index of Agricultural Land (SIAL), a tool for territorial analysis. Land Use Policy 2013, 35, 155–162. [Google Scholar] [CrossRef]
- Anas, A.; Arnott, R.; Small, K.A. Urban Spatial Structure. J. Econ. Lit. 1998, 36, 1426–1464. [Google Scholar]
- Lee, B. “Edge” or “Edgeless” Cities? Urban Spatial Structure in U.S. Metropolitan Areas, 1980 to 2000*. J. Reg. Sci. 2007, 47, 479–515. [Google Scholar] [CrossRef]
- Li, Y.; Derudder, B. Dynamics in the polycentric development of Chinese cities, 2001–2016. Urban Geogr. 2020, 43, 272–292. [Google Scholar] [CrossRef]
- Li, Y.; Liu, X. How did urban polycentricity and dispersion affect economic productivity? A case study of 306 Chinese cities. Landsc. Urban Plann. 2018, 173, 51–59. [Google Scholar] [CrossRef]
- Wei, W.; Zhang, X.; Liu, C.; Zhou, J.; Xie, B.; Li, C. Spatial Interaction of Urban-Rural System and Influence Pattern in the Arid Inland River Basin—A Case Study in Shiyang River Basin in Northwest China. Pol. J. Environ. Stud. 2021, 30, 3307–3316. [Google Scholar] [CrossRef]
- Paker, Y.; Yom-Tov, Y.; Alon-Mozes, T.; Barnea, A. The effect of plant richness and urban garden structure on bird species richness, diversity and community structure. Landsc. Urban Plann. 2014, 122, 186–195. [Google Scholar] [CrossRef]
- Tannier, C.; Thomas, I. Defining and characterizing urban boundaries: A fractal analysis of theoretical cities and Belgian cities. Comput. Environ. Urban Syst. 2013, 41, 234–248. [Google Scholar] [CrossRef]
- Christiaensen, L.; Todo, Y. Poverty Reduction during the Rural–Urban Transformation–The Role of the Missing Middle. World Devel. 2014, 63, 43–58. [Google Scholar] [CrossRef]
- Zhang, J.; Zou, J.; Wu, Q.; Chen, X. On the spatial organization of the metropolitan area. City Plan. Rev. 2001, 25, 19–23. [Google Scholar]
- Hsu, W.T. Central Place Theory and City Size Distribution. Econ. J. 2012, 122, 903–932. [Google Scholar] [CrossRef]
- Petrakos, G.; Brada, J.C. Metropolitan Concentration in Developing Countries. Kyklos 1989, 42, 557–578. [Google Scholar] [CrossRef] [PubMed]
- Hu, C.; Liu, W.; Jia, Y.; Jin, Y. Characterization of Territorial Spatial Agglomeration Based on POI Data: A Case Study of Ningbo City, China. Sustainability 2019, 11, 5083. [Google Scholar] [CrossRef] [Green Version]
- Chavhan, S.; Venkataram, P. Prediction based traffic management in a metropolitan area. J. Traffic Transp. Eng. Engl. Ed. 2020, 7, 447–466. [Google Scholar] [CrossRef]
- Nagy, J.A.; Benedek, J.; Ivan, K. Measuring Sustainable Development Goals at a Local Level: A Case of a Metropolitan Area in Romania. Sustainability 2018, 10, 3962. [Google Scholar] [CrossRef] [Green Version]
- Zhang, Q.; Su, S. Determinants of urban expansion and their relative importance: A comparative analysis of 30 major metropolitans in China. Habitat Int. 2016, 58, 89–107. [Google Scholar] [CrossRef]
- Molina, L.T.; Velasco, E.; Retama, A.; Zavala, M. Experience from Integrated Air Quality Management in the Mexico City Metropolitan Area and Singapore. Atmosphere 2019, 10, 512. [Google Scholar] [CrossRef] [Green Version]
- Dadashpoor, H.; Azizi, P.; Moghadasi, M. Land use change, urbanization, and change in landscape pattern in a metropolitan area. Sci. Total Environ. 2019, 655, 707–719. [Google Scholar] [CrossRef]
- Mumtaz, F.; Tao, Y.; de Leeuw, G.; Zhao, L.; Fan, C.; Elnashar, A.; Naeem, S. Modeling Spatio-temporal Land Transformation and Its Associated Impacts on land Surface Temperature (LST). Remote Sens. 2020, 12, 2987. [Google Scholar] [CrossRef]
- Xia, C.; Zhang, A.; Wang, H.; Zhang, B.; Zhang, Y. Bidirectional urban flows in rapidly urbanizing metropolitan areas and their macro and micro impacts on urban growth: A case study of the Yangtze River middle reaches megalopolis, China. Land Use Policy 2019, 82, 158–168. [Google Scholar] [CrossRef]
- Zhang, Q.; Li, J.; Singh, V.P.; Bai, Y. SPI-based evaluation of drought events in Xinjiang, China. Nat. Hazards 2012, 64, 481–492. [Google Scholar] [CrossRef]
- Auerbach, F. Das gesetz der belvolkerungskoncertration. Petermanns Geogr. Mitt. 1913, 59, 74–76. Available online: https://zs.thulb.uni-jena.de/receive/jportal_jpvolume_00158800 (accessed on 5 March 2020).
- Gabaix, X.; Ibragimov, R. Rank−1/2: A Simple Way to Improve the OLS Estimation of Tail Exponents. J. Bus. Econ. Stat. 2011, 29, 24–39. [Google Scholar] [CrossRef] [Green Version]
- Zipf, G.K. The P1 P2/D Hypothesis: On the Intercity Movement of Persons. Am. Sociol. Rev. 1946, 11, 677–686. [Google Scholar] [CrossRef]
- Zipf, G.K. Human Behaviour and The Principle of Least Effort; Addison-Wesley: Boston, MA, USA, 1949. [Google Scholar]
- Fan, X.; Pang, P. Spatial range recognition of the Xian metropolitan area based on multi source data. J. Xi’an Univ. Arch. Tech. Natl. Sci. Ed. 2021, 53, 254–264. (In Chinese) [Google Scholar]
- Zhou, X.; Tang, X. Wuhan Metropolitan Area Limits Based on Gravity Model and Its Optimization of Industrial Structure. Geomat. Spat. Inf. Technol. 2016, 39, 73–81. (In Chinese) [Google Scholar]
- Jung, W.-S.; Wang, F.; Stanley, H.E. Gravity model in the Korean highway. EPL Europhys. Lett. 2008, 81, 48005. [Google Scholar] [CrossRef] [Green Version]
- Berry, B.J. City Size Distributions and Economic Development. Econ. Dev. Cult. Change 1961, 9, 573–588. [Google Scholar] [CrossRef]
- Mori, T.; Smith Tony, E.; Hsu, W.-T. Common power laws for cities and spatial fractal structures. Proc. Natl. Acad. Sci. USA 2020, 117, 6469–6475. [Google Scholar] [CrossRef] [Green Version]
- Song, Y.X.; Zheng, H.B. Study on the optimum pattern of daqing urban spatial structure. Chin. Geogr. Sci. 2002, 12, 206–211. [Google Scholar] [CrossRef]
- Li, S.M.; Shum, Y.M. Impacts of the National Trunk Highway System on accessibility in China. J. Transp. Geogr. 2001, 9, 39–48. [Google Scholar] [CrossRef]
- Wei, W.U.; Cao, Y.H.; Cao, W.D.; Liang, S.B. Spatial Pattern of Regional Comprehensive Transportation Cost—The Case of Jiangsu Province. Sci. Geogr. Sin. 2009, 29, 485–492. [Google Scholar]
- Wu, R.; Wang, J.; Zhang, D.; Wang, S. Identifying different types of urban land use dynamics using Point-of-interest (POI) and Random Forest algorithm: The case of Huizhou, China. Cities 2021, 114, 103202. [Google Scholar] [CrossRef]
- Hu, T.; Yang, J.; Li, X.; Gong, P. Mapping Urban Land Use by Using Landsat Images and Open Social Data. Remote Sens. 2016, 8, 151. [Google Scholar] [CrossRef]
- Zhang, H.; Li, X.; Liu, X.; Chen, Y.; Ou, J.; Niu, N.; Jin, Y.; Shi, H. Will the development of a high-speed railway have impacts on land use patterns in China? Ann. Am. Assoc. Geogr. 2019, 109, 979–1005. [Google Scholar] [CrossRef]
- Yang, Z.; Bai, J.; Zhang, W. Mapping and assessment of wetland conditions by using remote sensing images and POI data. Ecol. Indic. 2021, 127, 107485. [Google Scholar] [CrossRef]
- Zhao, W.; Li, Q.; Li, B. Extracting hierarchical landmarks from urban POI data. J. Remote Sens. 2011, 15, 973–988. [Google Scholar]
- Sun, C.L.; Zhang, X.L.; Jin, N.; Du, H.R. Spatial difference features and organization optimization of cities and towns in Tarim River Basin. J. Arid. Land 2010, 2, 33–42. [Google Scholar]
- Zhang, Y.; Yang, D.; Zhang, X.; Dong, W.; Zhang, X. Regional structure and spatial morphology characteristics of oasis urban agglomeration in arid area—A case of urban agglomeration in northern slope of Tianshan Mountains, Northwest China. Chin. Geogr. Sci. 2009, 19, 341–348. [Google Scholar] [CrossRef]
- Yang, Z.; Lei, J.; Li, J.-G. Identifying the Determinants of Urbanization in Prefecture-Level Cities in China: A Quantitative Analysis Based on Spatial Production Theory. Sustainability 2019, 11, 1204. [Google Scholar] [CrossRef] [Green Version]
- Yang, Y.; Liu, Y. Spatio-temporal analysis of urbanization and land and water resources efficiency of oasis cities in Tarim River Basin. J. Geogr. Sci. 2014, 24, 509–525. [Google Scholar] [CrossRef]
- Baz, I.; Geymen, A.; Er, S.N. Development and application of GIS-based analysis/synthesis modeling techniques for urban planning of Istanbul Metropolitan Area. Adv. Eng. Softw. 2009, 40, 128–140. [Google Scholar] [CrossRef]
- Long, H.; Liu, Y.; Li, X.; Chen, Y. Building new countryside in China: A geographical perspective. Land Use Policy 2010, 27, 457–470. [Google Scholar] [CrossRef]
- Ye, Z.; Chen, S.; Zhang, Q.; Liu, Y.; Zhou, H. Ecological Water Demand of Taitema Lake in the Lower Reaches of the Tarim River and the Cherchen River. Remote Sens. 2022, 14, 832. [Google Scholar] [CrossRef]
- Fang, C.; Yu, D. Urban agglomeration: An evolving concept of an emerging phenomenon. Landsc. Urban Plann. 2017, 162, 126–136. [Google Scholar] [CrossRef]


Publisher’s Note: MDPI stays neutral with regard to jurisdictional claims in published maps and institutional affiliations. |
© 2022 by the authors. Licensee MDPI, Basel, Switzerland. This article is an open access article distributed under the terms and conditions of the Creative Commons Attribution (CC BY) license (https://creativecommons.org/licenses/by/4.0/).