
The Tongass National Forest, Southeast Alaska, USA: A Natural Climate Solution of Global Significance


Abstract
:1. Introduction
2. Methods
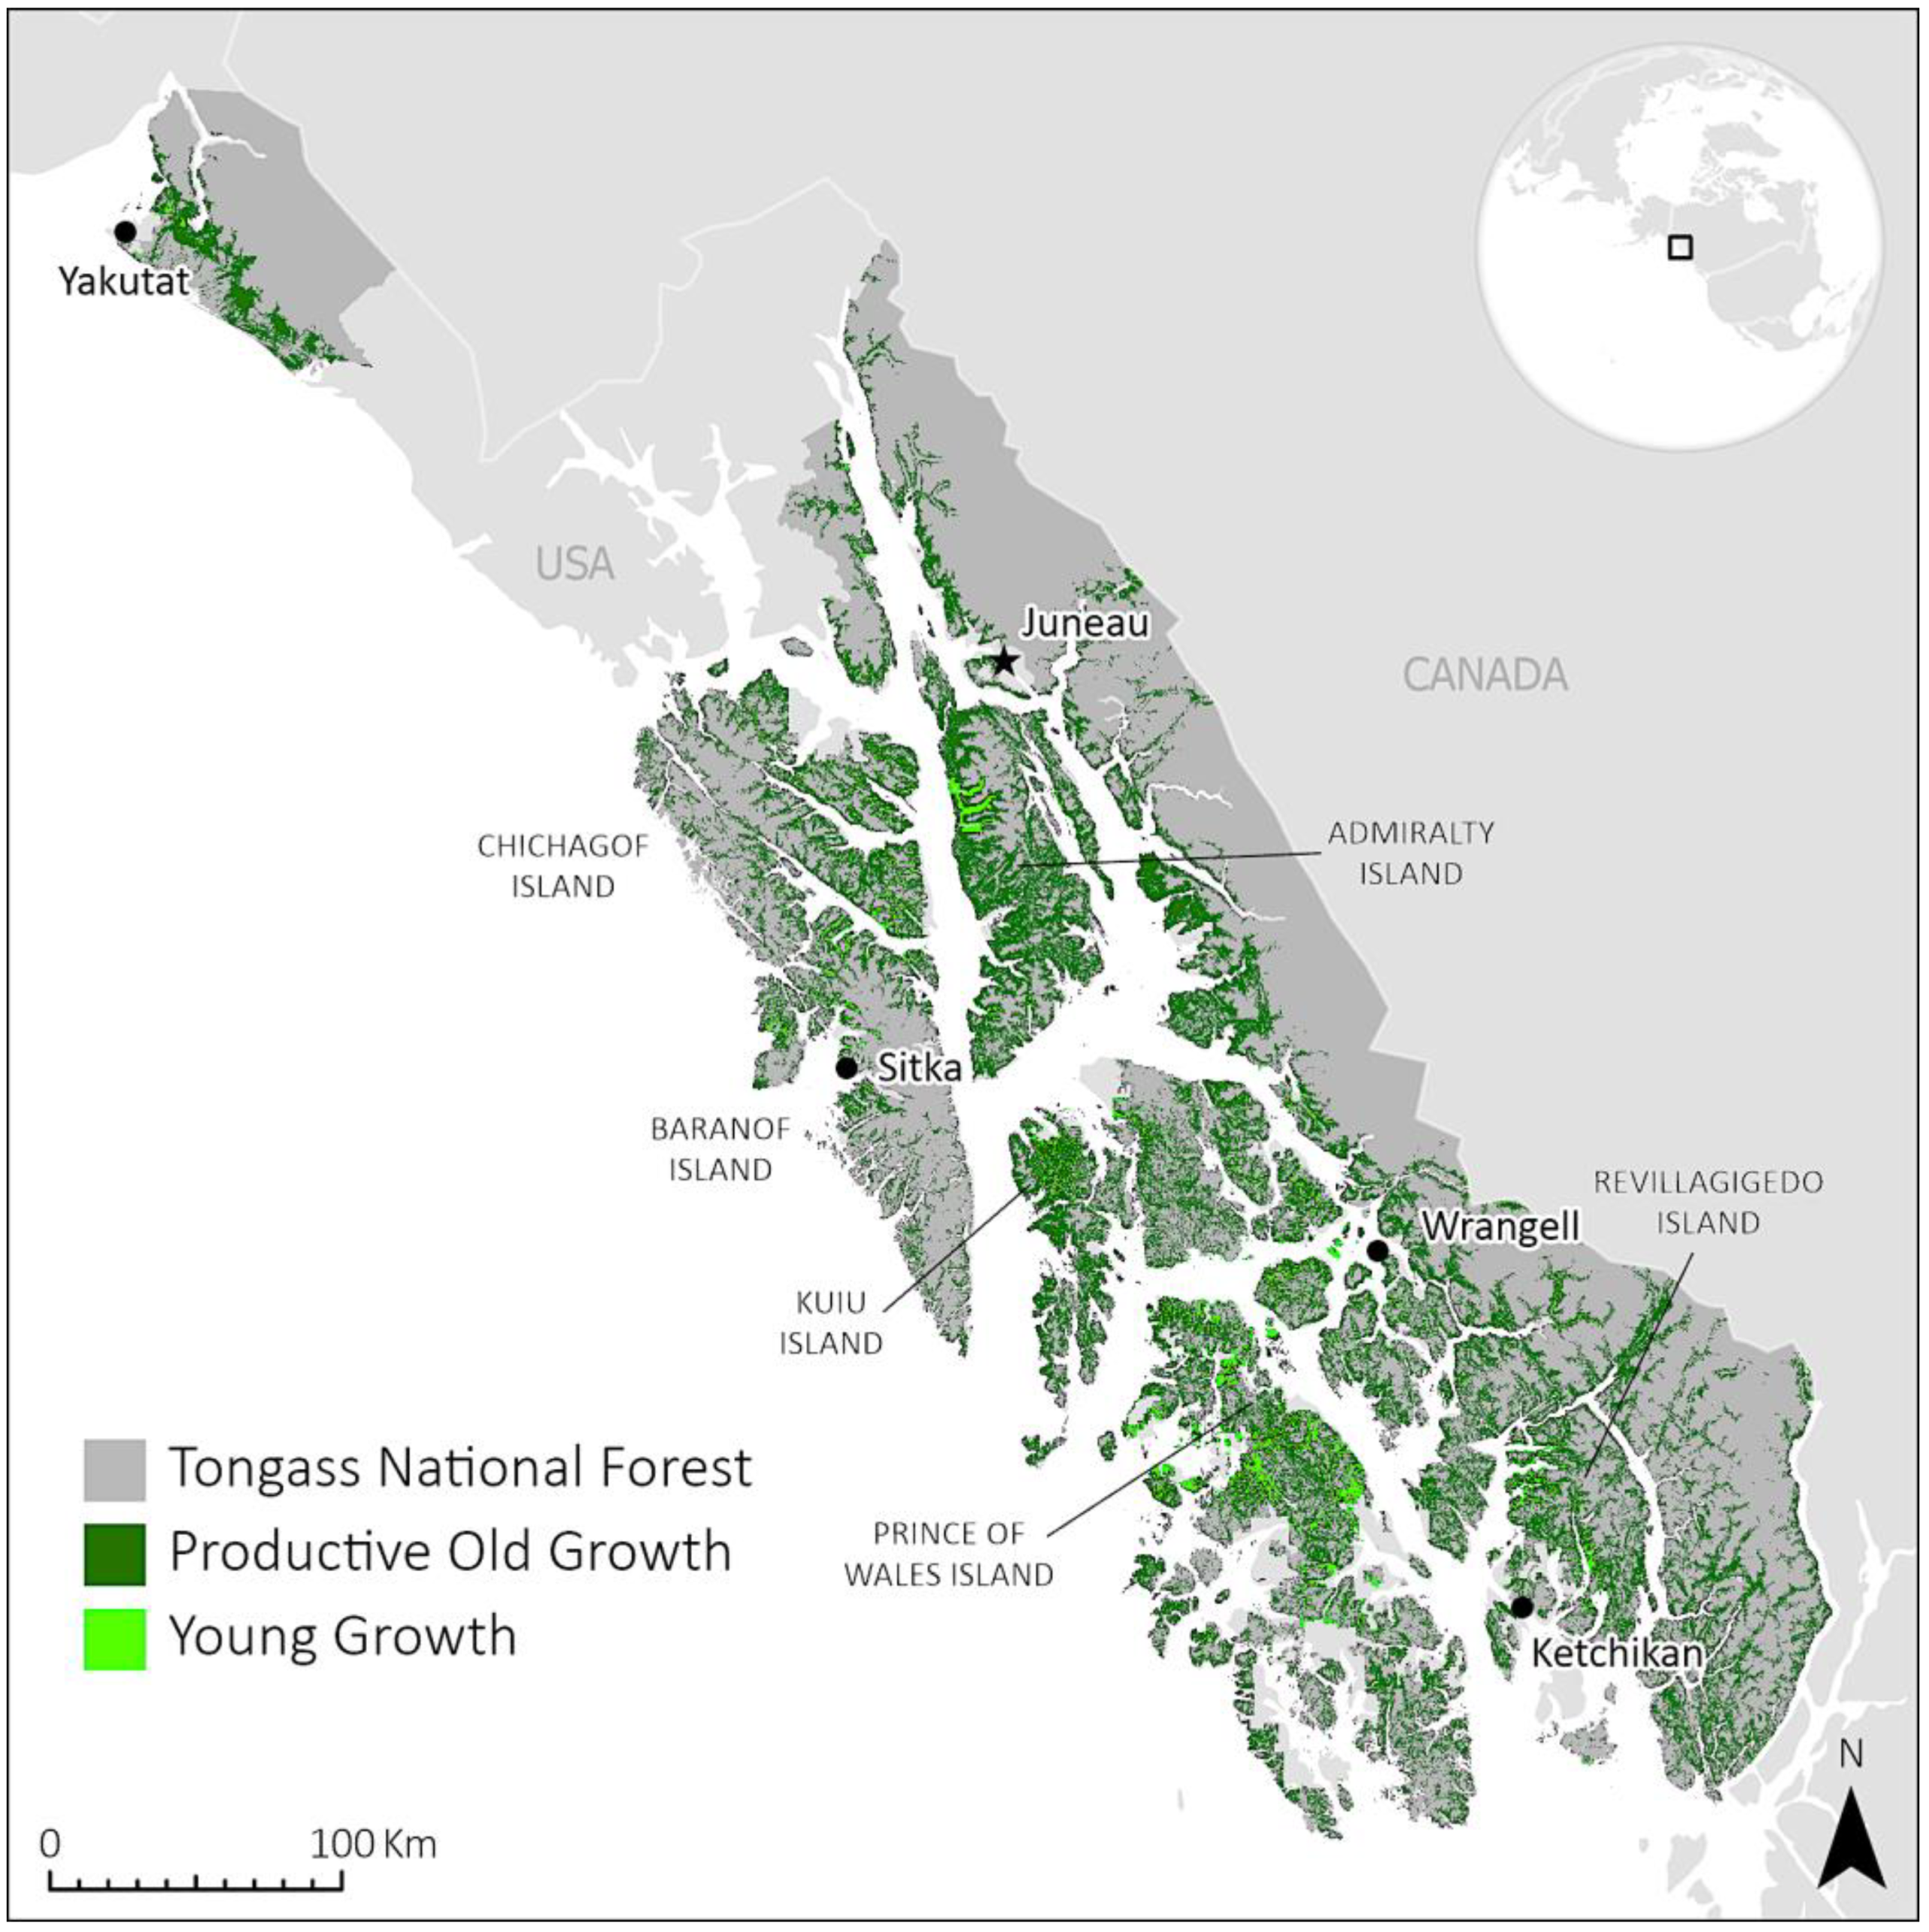
2.1. Study Area
2.2. Timber Sale Datasets
2.3. Carbon Datasets
2.4. GIS Overlays
2.5. Evaluating At-Risk IRA and POG Scenarios
2.6. Estimating Emissions from Harvested Wood Products
3. Results
3.1. Young vs. Productive Old Growth Forests
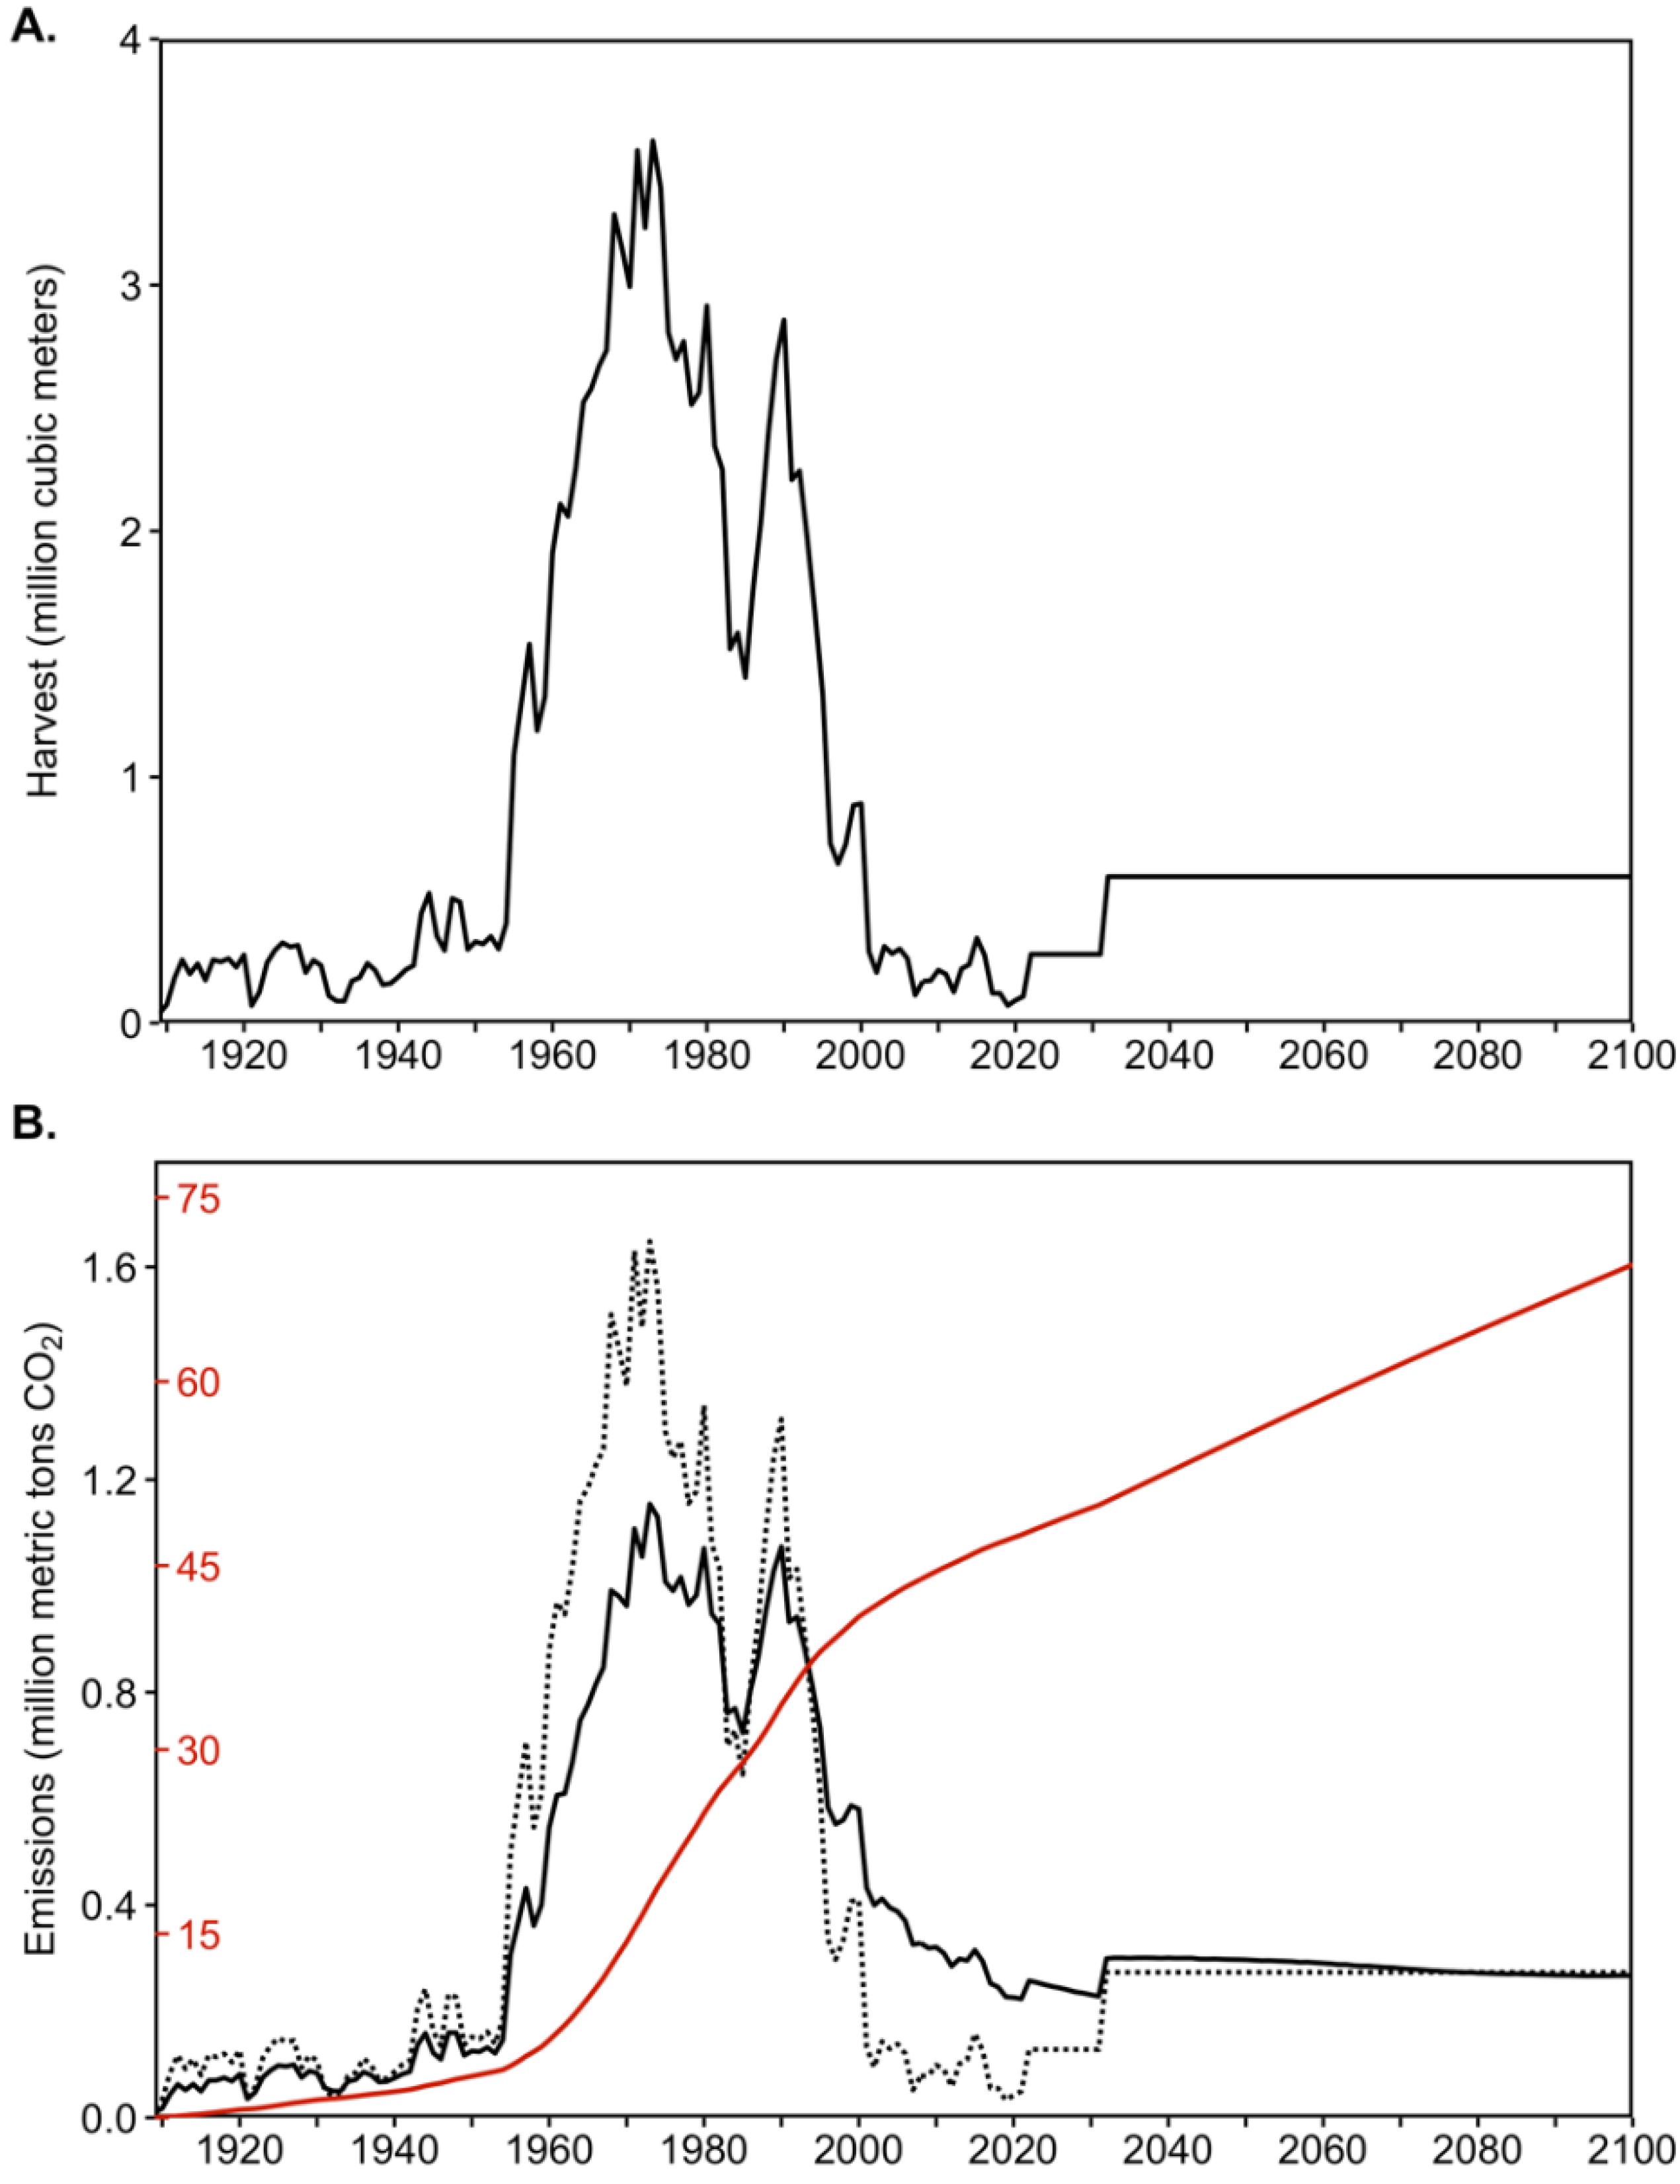
3.2. Timber Volume Sold by Time Period
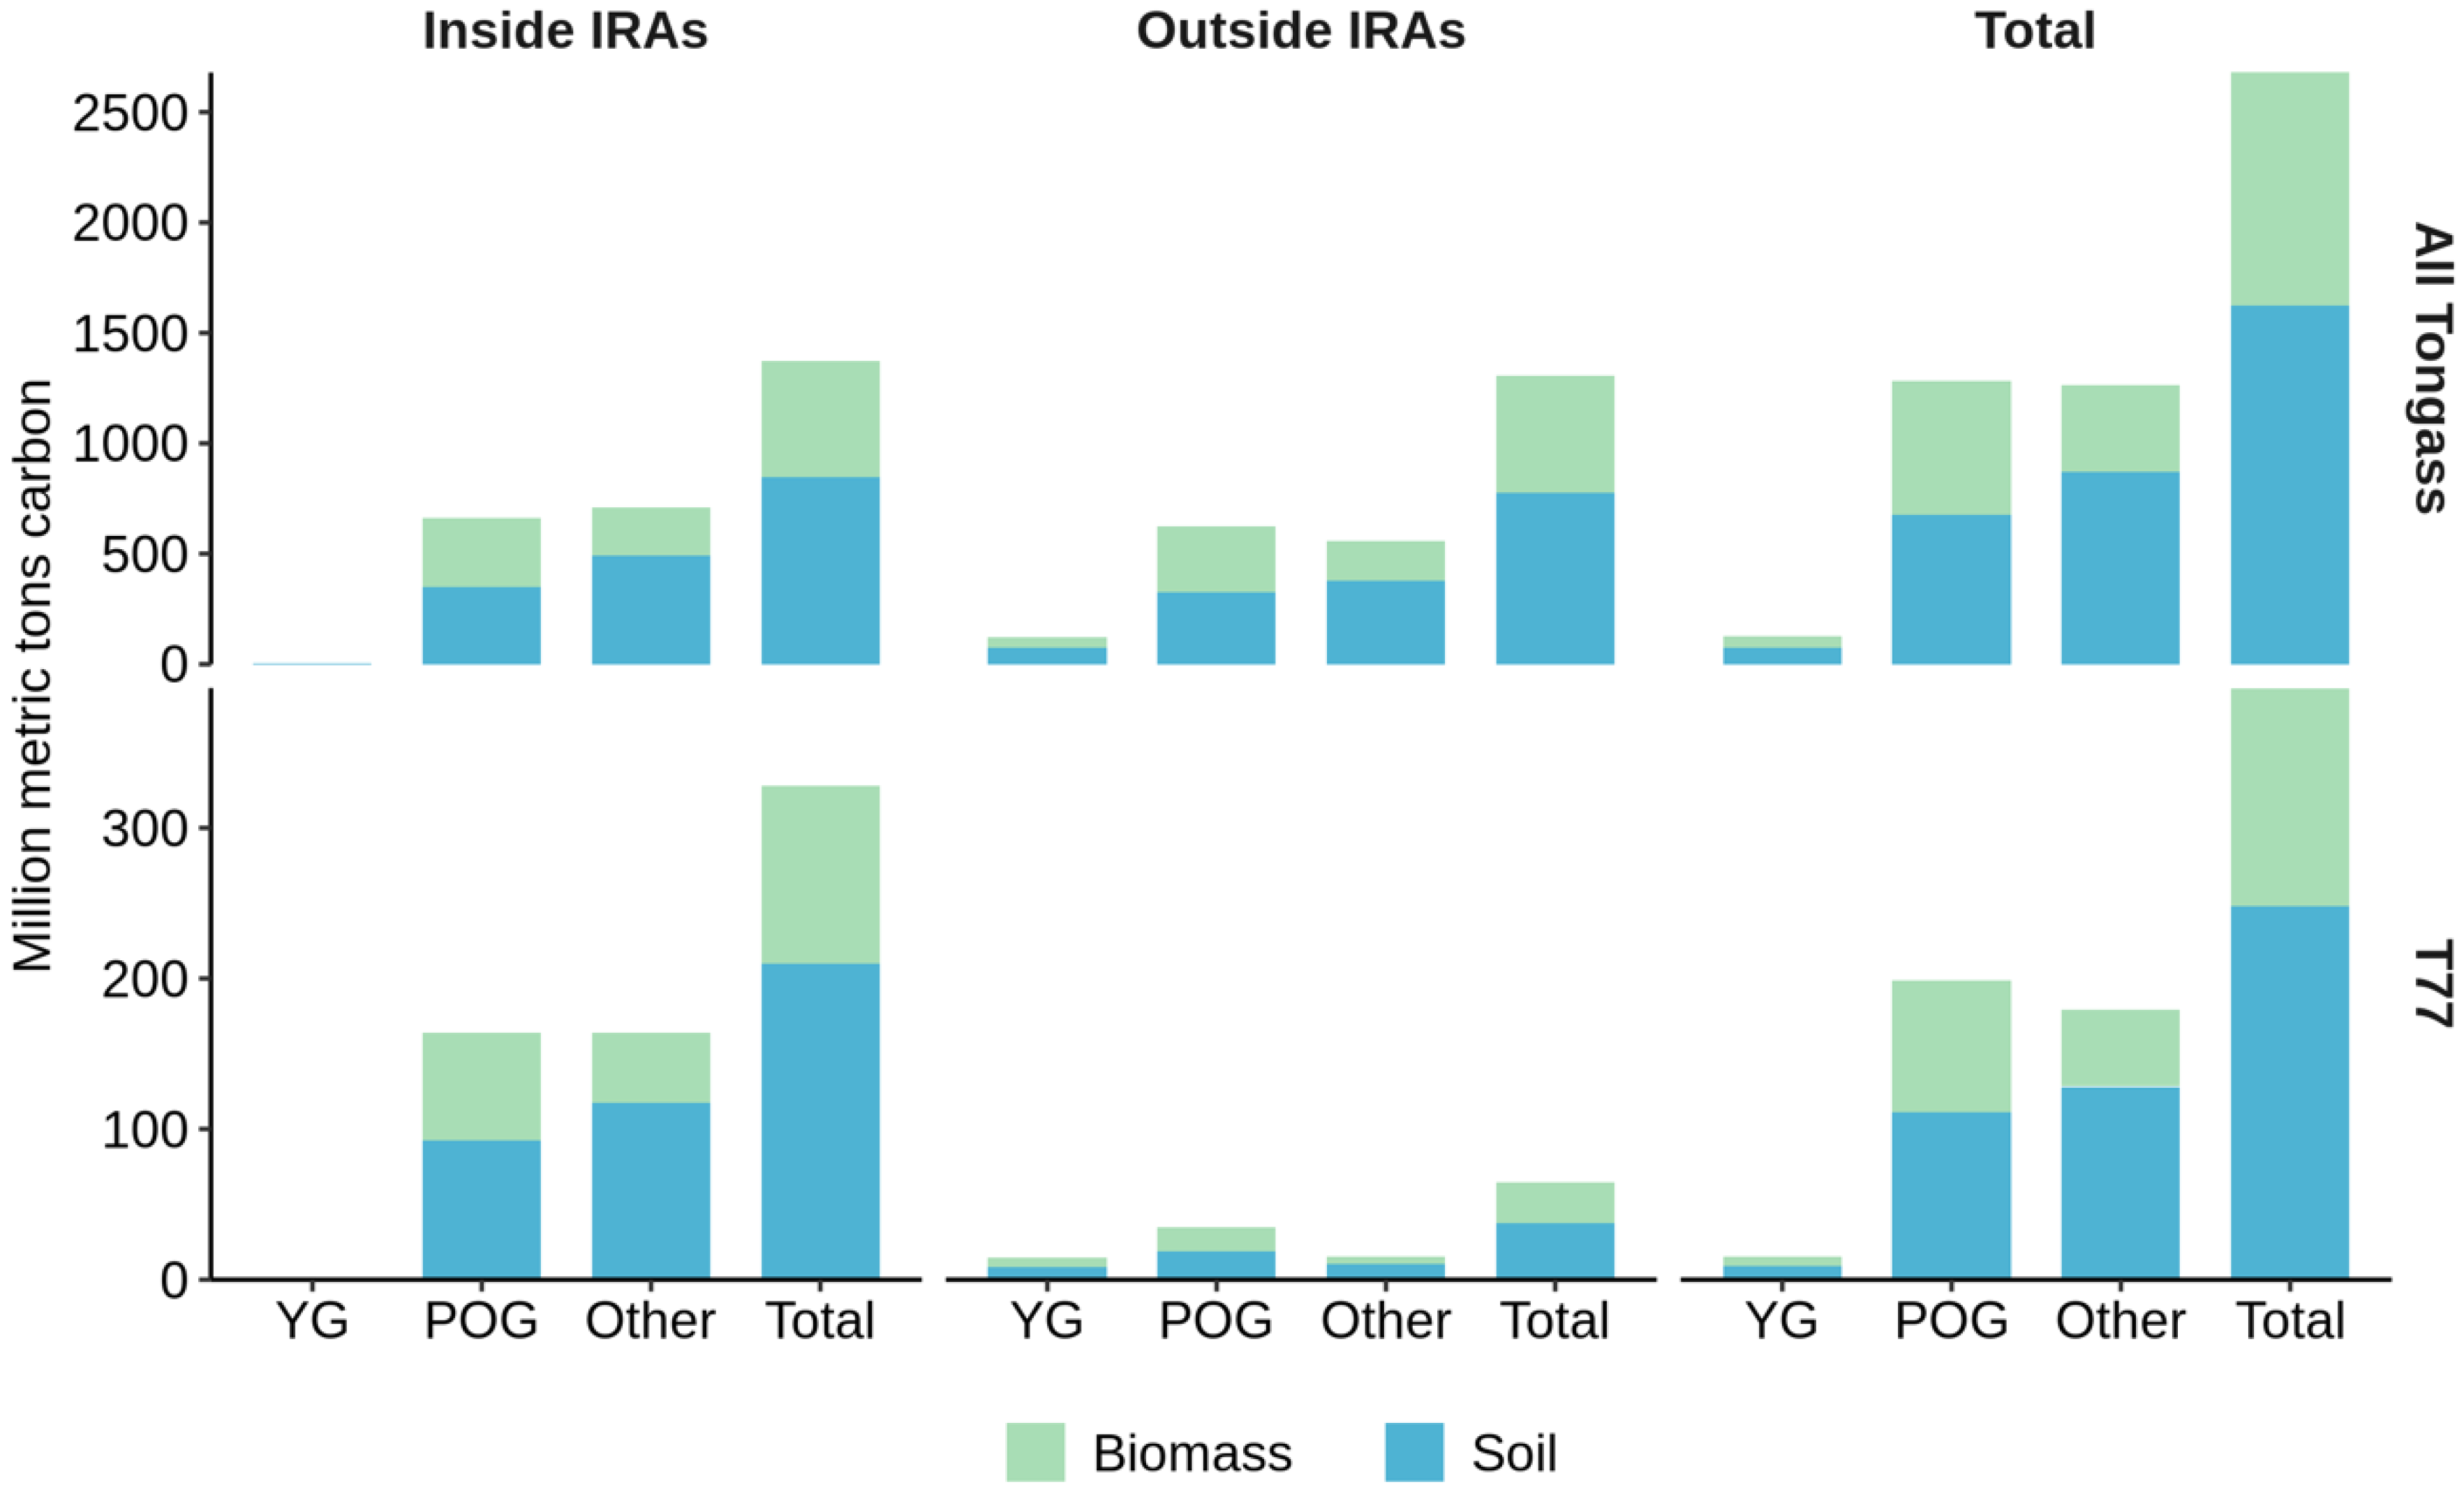
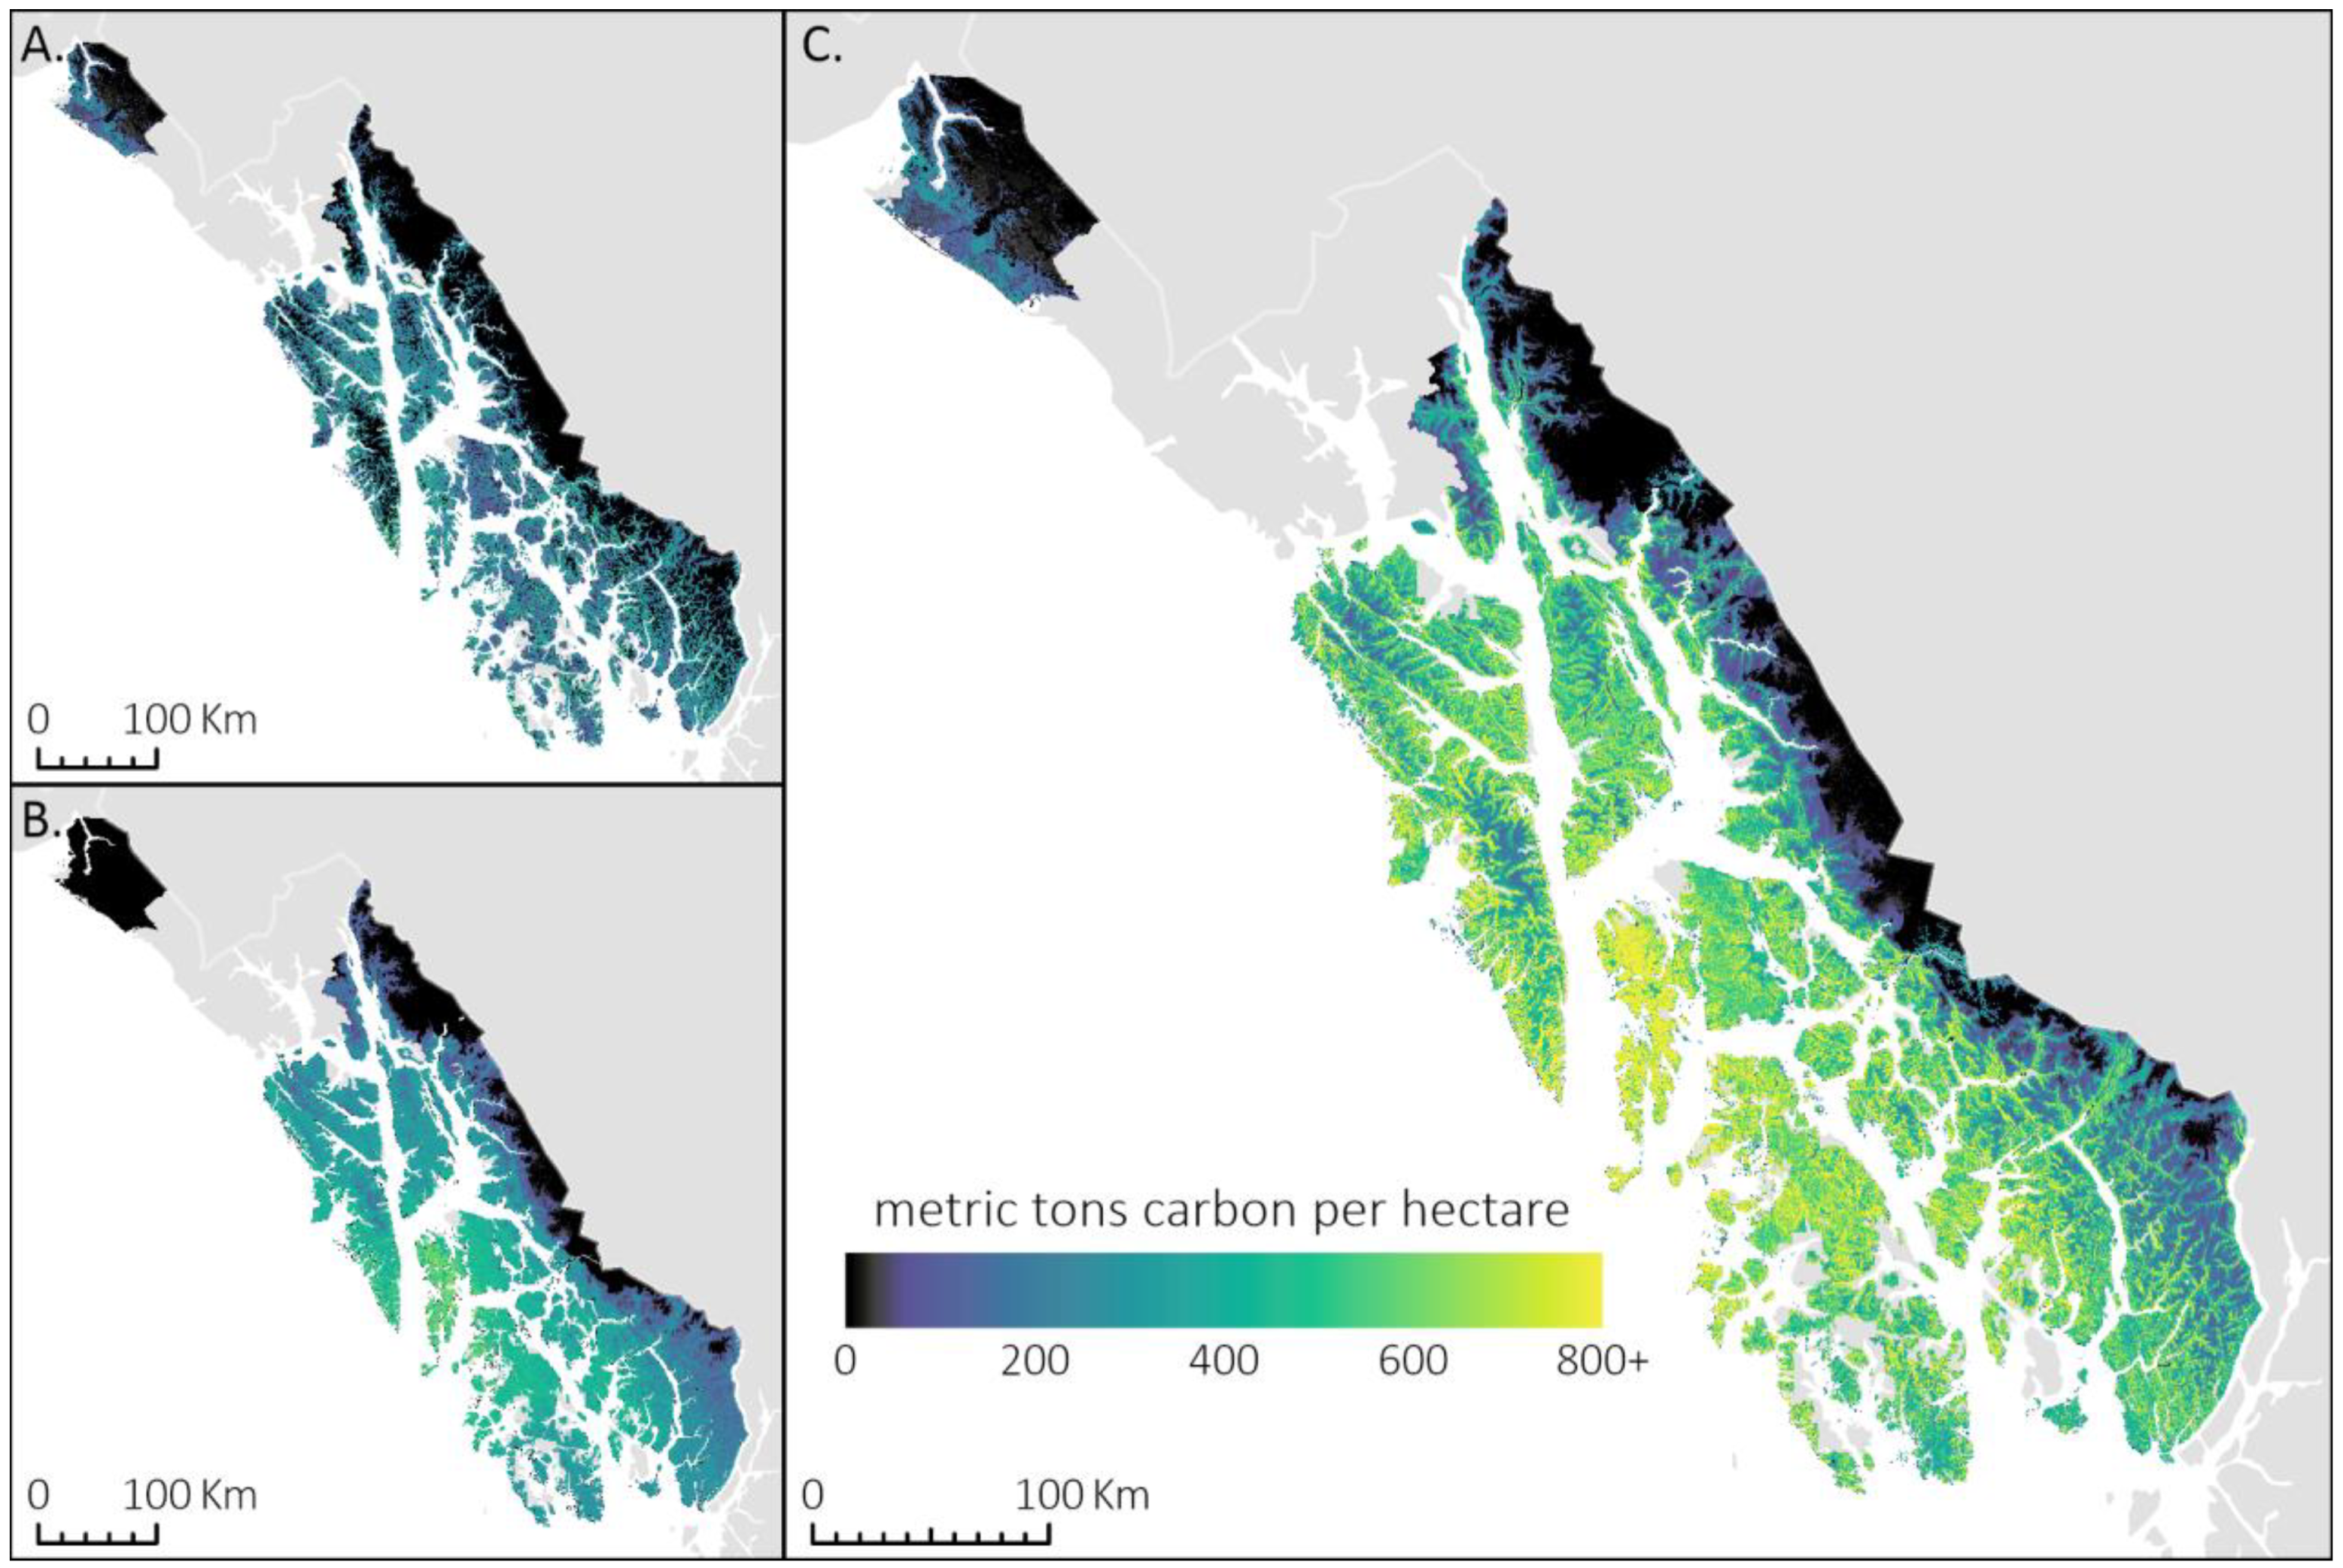
3.3. Carbon Stocks
3.4. At-Risk Scenarios
3.5. Estimated Carbon Emissions
4. Discussion
4.1. Timber Volume and Associated Impacts
4.2. Carbon Stock (Carbon Reservoir)
4.3. Importance of IRAs and Tongass 77 Watersheds
4.4. Stock Change Due to Logging
5. Conclusions
Supplementary Materials
Author Contributions
Funding
Institutional Review Board Statement
Informed Consent Statement
Data Availability Statement
Acknowledgments
Conflicts of Interest
References
- Albert, D.M.; Schoen, J.W. Use of Historical Logging Patterns to Identify Disproportionately Logged Ecosystems within Temperate Rainforests of Southeastern Alaska. Conserv. Biol. 2013, 27, 774–784. [Google Scholar] [CrossRef] [PubMed]
- Orians, G.; Schoen, J.W. North Pacific Temperate Rainforests: Ecology and Conservation; University of Washington Press: Seattle, WA, USA, 2013. [Google Scholar]
- DellaSala, D.A.; Moola, F.; Alaback, P.; Paquet, P.C.; Schoen, J.W.; Noss, R.F. Temperate and boreal rainforests of the Pacific Coast of North America. In Temperate and Boreal Rainforests of the World: Ecology and Conservation; DellaSala, D.A., Ed.; Island Press: Washington, DC, USA, 2011; pp. 42–81. [Google Scholar]
- USDA Forest Service. National Roadless Conservation Rule. 66 Fed. Reg. 2001, 3, 244–248. [Google Scholar]
- Strittholt, J.R.; DellaSala, D.A. Importance of roadless areas in biodiversity conservation in forested ecosystems: A case study—Klamath-Siskiyou ecoregion, U.S.A. Conserv. Biol. 2001, 15, 1742–1754. [Google Scholar] [CrossRef]
- Ibisch, P.L.; Hoffmann, M.T.; Kreft, S.; Pe’er, G.; Kati, V.; Biber-Freudenberger, L.; DellaSala, D.A.; Vale, M.M.; Hobson, P.R.; Selva, N. A global map of roadless areas and their conservation status. Science 2017, 354, 1423–1427. [Google Scholar] [CrossRef]
- Dietz, M.S.; Barnett, K.; Belote, R.T.; Aplet, G.H. The importance of U.S. national forest roadless areas for vulnerable wildlife species. Glob. Ecol. Conserv. 2021, 32, e01943. [Google Scholar] [CrossRef]
- Executive Office of the President. Roadless Rule Revision. 2021. Available online: https://www.reginfo.gov/public/do/eAgendaViewRule?pubId=202104&RIN=0596-AD51 (accessed on 5 April 2022).
- USDA Forest Service. Forest Management Reports and Accomplishments. Cut History 1908 to Present. 2021. Available online: https://www.fs.usda.gov/wps/portal/fsinternet/cs/detail/!ut/p/z1/04_Sj9CPykssy0xPLMnMz0vMAfIjo8zijQwgwNHCwN_DI8zPyBcqYKAfjlVBmA9cQRQx-g1wAEci9eNREIXfHD9KH0CHtDHb4KfR35uqn5BbmhohEGWCQCHVD_f/dz/d5/L2dBISEvZ0FBIS9nQSEh/?position=Not&ss=1110&navtype=&pnavid=160000000000000&navid=160120000000000&cid=fsbdev2_038785 (accessed on 12 April 2022).
- USDA Forest Service. Tongass National Forest—Land and Resource Management Plan Amendment. 2016. Available online: https://www.fs.usda.gov/Internet/FSE_DOCUMENTS/fseprd527907.pdf (accessed on 12 April 2022).
- Smith, M.A. (Ed.) Ecological Atlas of Southeast Alaska. Audubon Alaska. 2016. Available online: https://indd.adobe.com/view/bb243dff-5852-44c5-bdf5-4b1be96bdc53 (accessed on 12 April 2022).
- Leighty, W.W.; Hamburg, S.P.; Caouette, J. Effects of Management on Carbon Sequestration in Forest Biomass in Southeast Alaska. Ecosystems 2006, 9, 1051–1065. [Google Scholar] [CrossRef]
- Barrett, T.M. Storage and Flux of Carbon in Live Trees, Snags, and Logs in the Chugach and Tongass National Forests; Gen. Tech. Rep. PNW-GTR-889; U.S. Department of Agriculture, Forest Service, Pacific Northwest Research Station: Portland, OR, USA, 2014; 44p.
- Birdsey, R.A.; Dugan, A.J.; Healey, S.P.; Dante-Wood, K.; Zhang, F.; Mo, G.; Chen, J.M.; Hernandez, A.J.; Raymond, C.L.; McCarter, J. Assessment of the Influence of Disturbance, Management Activities, and Environmental Factors on Carbon Stocks of U.S. National Forests; Gen. Tech. Rep. RMRS-GTR-402; U.S. Department of Agriculture, Forest Service, Rocky Mountain Research Station: Fort Collins, CO, USA, 2019.
- D’Amore, D.; McGuire, A.D. Forestry as a Natural Climate Solution: The Positive Outcomes of Negative Carbon Emissions. USDA Forest Service PNW Research Station. 2020. Available online: https://www.fs.fed.us/pnw/sciencef/scifi225.pdf (accessed on 12 April 2022).
- Congressional Research Center (CRS). U.S. Forest Carbon Data: In Brief. Updated 5 May 2020. Prepared for Members and Committees of Congress. 2020. Available online: https://crsreports.congress.gov (accessed on 12 April 2022).
- USDA Forest Service. Draft Environmental Impact Statement Rulemaking for Alaska Roadless Areas. 2019. Available online: https://www.fs.usda.gov/nfs/11558/www/nepa/109834_FSPLT3_4876629.pdf (accessed on 12 April 2022).
- USDA Forest Service. Baseline Estimates of Carbon Stocks in Forests and Harvested Wood Products for National Forest System Units. Alaska Region. Climate Change Advisors Office of the Chief. Alaska Region, 34p. 6 March 2015. Available online: https://www.fs.fed.us/climatechange/documents/AlaskaRegionCarbonAssessment.pdf (accessed on 5 April 2022).
- United Nations. Paris Agreement. 2015. Available online: https://unfccc.int/sites/default/files/english_paris_agreement.pdf (accessed on 5 April 2022).
- Alaback, P. Biodiversity patterns in relation to climate: The coastal temperate rainforests of North America. In High-Latitude Rain Forests and Associated Ecosystems of the West Coast of the Americas: Climate, Hydrology, Ecology and Conservation; Lawford, R., Alaback, P., Fuentes, E.R., Eds.; Ecological Studies 116; Springer: Berlin/Heidelberg, Germany, 1995; pp. 105–133. [Google Scholar]
- DellaSala, D.A.; Hagar, J.C.; Engel, K.A.; McComb, W.C.; Fairbanks, R.L.; Campbell, E.G. Effects of silvicultural modifications of temperate rainforest on breeding and wintering bird communities, Prince of Wales Island, Southeast Alaska. Condor 1996, 98, 706–721. [Google Scholar] [CrossRef]
- USDA Forest Service. Tongass National Forest Land Management Plan Revision. 1997. Available online: https://www.fs.usda.gov/detail/tongass/landmanagement/planning/?cid=stelprdb5445359 (accessed on 5 April 2022).
- Brackley, A.M.; Rojas, T.D.; Haynes, R.W. Timber Products Output and Timber Harvests in Alaska: Projections for 2005-25. Gen. Tech. Rep. PNW-GTR-677. 2006. Available online: https://www.fs.usda.gov/Internet/FSE_DOCUMENTS/fsbdev2_038293.pdf (accessed on 5 April 2022).
- USDA Forest Service. Cut and Sold (New)—CUTS203F. 2020. Available online: https://www.fs.fed.us/forestmanagement/documents/sold-harvest/reports/2020/2020_Q1-Q4_CandS_R10.pdf (accessed on 12 April 2022).
- Buma, B.; Thompson, T. Long-term exposure to more frequent disturbances increases baseline carbon in some ecosystems: Mapping and quantifying the disturbance frequency-ecosystem C relationship. PLoS ONE 2019, 14, e0212526. [Google Scholar] [CrossRef] [Green Version]
- Hansen, M.C.; Potapov, P.V.; Moore, R.; Hancher, M.; Turubanova, S.A.; Tyukavina, A.; Thau, D.; Stehman, S.V.; Goetz, S.J.; Loveland, T.R.; et al. High-Resolution Global Maps of 21st-Century Forest Cover Change. Science 2013, 342, 850–853. [Google Scholar] [CrossRef] [Green Version]
- Harris, N.L.; Gibbs, D.A.; Baccini, A.; Birdsey, R.A.; De Bruin, S.; Farina, M.; Fatoyinbo, L.; Hansen, M.C.; Herold, M.; Houghton, R.A.; et al. Global maps of twenty-first century forest carbon fluxes. Nat. Clim. Chang. 2021, 11, 234–240. [Google Scholar] [CrossRef]
- McNicol, G.; Bulmer, C.; D’Amore, D.; Sanborn, P.; Saunders, S.; Giesbrecht, I.; Arriola, S.G.; Bidlack, A.; Butman, D.; Buma, B. Large, climate-sensitive soil carbon stocks mapped with pedology-informed machine learning in the North Pacific coastal temperate rainforest. Environ. Res. Lett. 2019, 14, 014004. [Google Scholar] [CrossRef]
- Hoover, C.M.; Birdsey, R.; Goines, B.; Lahm, P.; Marland, G.; Nowak, D.; Prisley, S.; Reinhardt, E.; Skog, K.; Skole, D.; et al. Chapter 6: Quantifying Greenhouse Gas Sources and Sinks in Managed Forest Systems. In Quantifying Greenhouse Gas Fluxes in Agriculture and Forestry: Methods for Entity-Scale Inventory; Eve, M., Pape, D., Flugge, M., Steele, R., Man, D., Riley-Gilbert, M., Biggar, S., Eds.; Technical Bulletin Number 1939; Office of the Chief Economist, US Department of Agriculture: Washington, DC, USA, 2014; 606p. [Google Scholar]
- Hudiburg, T.W.; Law, B.E.; Moomaw, W.R.; Harmon, M.E.; Stenzel, J.E. Meeting GHG reduction targets requires accounting for all forest sector emissions. Environ. Res. Lett. 2019, 14, 095005. [Google Scholar] [CrossRef]
- Skog, K.E. Sequestration of carbon in harvested wood products for the United States. For. Prod. J. 2008, 58, 56–72. [Google Scholar]
- Smith, J.E.; Heath, L.S.; Skog, K.E.; Birdsey, R.A. Methods for Calculating Forest Ecosystem and Harvested Carbon with Standard Estimates for Forest Types of the United States; US Department of Agriculture, Forest Service, Northern Research Station: Newtown Square, PA, USA, 2006.
- Loeffler, D.; Anderson, N.; Stockman, K.; Skog, K.; Healey, S.; Jones, J.G.; Morrison, J.; Young, J. Estimates of Carbon Stored in Harvested Wood Products from United States Forest Service Alaska Region, 1910–2012; Unpublished Report; U.S. Department of Agriculture, Forest Service, Rocky Mountain Research Station, Forestry Sciences Laboratory: Missoula, MT, USA, 2014; 27p.
- Harmon, M.E. Have product substitution carbon benefits been overestimated? A sensitivity analysis of key assumptions. Environ. Res. Lett. 2019, 14, 065008. [Google Scholar] [CrossRef] [Green Version]
- Albert, D.; Schoen, J.W. A conservation assessment for the Coastal Forests and Mountains Ecoregion of Southeastern Alaska and the Tongass National Forest. In Chapter 2, The Coastal Forests and Mountains Ecoregion of Southeastern Alaska and the Tongass National Forest: A Conservation Assessment and Resource Synthesis; Schoen, J., Dovichin, E., Eds.; The Nature Conservancy: Anchorage, AK, USA, 2007. [Google Scholar]
- Smith, J.E.; Domke, G.M.; Nichols, M.C.; Walters, B.F. Carbon stocks and stock change on federal forest lands of the United States. Ecosphere 2019, 10, e02637. [Google Scholar] [CrossRef]
- Moomaw, W.R.; Masino, S.A.; Faison, E.K. Intact forests in the United States: Proforestion mitigates climate change and serves the greatest good. Front. For. Glob. Chang. 2019, 2, 27. [Google Scholar] [CrossRef] [Green Version]
- Law, B.E.; Berner, L.T.; Buotte, P.C.; Mildrexler, D.J.; Ripple, W.J. Strategic forest reserves can protect biodiversity in the western United States and mitigate climate change. Commun. Earth Environ. 2021, 2, 254. [Google Scholar] [CrossRef]
- Turner, T. Roadless Rules: The Struggle for the Last Wild Forests; Island Press: Washington, DC, USA, 2009. [Google Scholar]
- Albert, D.M. Conservation Significance of Large Inventoried Roadless Areas on the Tongass National Forest. Audubon Alaska. 2019. Available online: https://ak.audubon.org/sites/default/files/2019_consv_significance_of_roadless_12-14-19.pdf (accessed on 12 April 2022).
- DellaSala, D.A.; Brandt, P.; Koopman, M.; Leonard, J.; Meisch, C.; Herzog, P.; Alaback, P.; Goldstein, M.I.; Jovan, J.; MacKinnon, A.; et al. Climate Change May Trigger Broad Shifts in North America’s Pacific Coastal Rainforests. In Reference Module in Earth Systems and Environmental Sciences; DellaSala, D.A., Goldstein, M.I., Eds.; Elsevier: Oxford, UK, 2015. [Google Scholar] [CrossRef]
- Vynne, C.; Dovichin, E.; Fresco, N.; Dawson, N.; Joshi, A.; Law, B.E.; Lertzman, K.; Rupp, S.; Schmiegelow, F.; Trammell, E.J. The importance of Alaska for climate stabilization, resilience, and biodiversity conservation. Front. For. Glob. Chang. 2021, 4, 1–17. [Google Scholar] [CrossRef]
- Buma, B.; Batllori, E.; Bisbing, S.; Holz, A.; Saunders, S.C.; Bidlack, A.L.; Creutzburg, M.K.; DellaSala, D.A.; Gregovich, D.; Hennon, P.; et al. Emergent freeze and fire disturbance dynamics in temperate rainforests. Austral Ecol. 2019, 44, 812–826. [Google Scholar] [CrossRef]
- Hennon, P.E.; A’more, D.V.; Schabergy, P.G.; Wittwer, D.T.; Shanley, C.S. Shifting climate, altered niche, and a dynamic conservation strategy for yellow-cedar in the North Pacific coastal rainforest. BioScience 2012, 62, 147–158. [Google Scholar] [CrossRef] [Green Version]
- Dawson, N.; MacDonald, S.O.; Cook, J.A. Endemic Mammals of the Alexander Archipelago. Southeast Alaska Conservation Assessment, Chapter 6.7. 2007. Available online: http://www.unm.edu/~msbweb/isles/Dawson_et_al%202007%20endemics%20AA.pdf (accessed on 5 April 2022).
- Schoen, J.; Person, D. Alexander Archipelago Wolf (Canis lupus ligoni). Chapter 6.4. Southeast Alaska Conservation Assessment. 2016. Available online: https://www.conservationgateway.org/ConservationByGeography/NorthAmerica/UnitedStates/alaska/seak/era/cfm/Documents/6.4_Wolf.pdf (accessed on 5 April 2022).
- DellaSala, D.A.; Furnish, J. Can young-growth forests save the Tongass Rainforest in Southwest Alaska? In Encyclopedia of the World’s Biomes; Goldstein, M.I., DellaSala, D.A., Eds.; Elsevier: Oxford, UK, 2019. [Google Scholar] [CrossRef]
- Brandt, P.; Abson, S.O.; DellaSala, D.A.; Feller, R.; von Wehrden, H. Multifunctionality and biodiversity: Ecosystem services in temperate rainforests of the Pacific Northwest, USA. Biol. Conserv. 2014, 169, 362–371. [Google Scholar] [CrossRef]
- Keenan, R.J.; Reams, G.A.; Achard, F.; de Freitas, J.V.; Grainger, A.; Lindquist, E. Dynamics of global forest area: Results from the Global Forest Resource Assessment 2015. For. Ecol. Manag. 2015, 352, 9–20. [Google Scholar] [CrossRef]
- United Nations Climate Change. Glasgow Leaders’ Declaration on Forests and Land Use. UN 2104 Clim. Change Conf. COP26 SEC—Glasg. 2021. Available online: https://ukcop26.org/glasgow2105leaders-declaration-on-forests-and-land-use/ (accessed on 19 April 2022).
- Intergovernmental Panel on Climate Change (IPCC). Climate Change Impacts, Adaptation, and Vulnerability. 2022. Available online: https://www.ipcc.ch/report/sixth-assessment-report-working-group-ii/ (accessed on 15 April 2022).
- Stockmann, K.; Anderson, N.; Stockman, K.; Young, J.; Skog, K.; Healey, S.; Morrison, J.; Young, J. Loeffler. Estimates of Carbon Stored in Harvested Wood Products from United States Forest Service Intermountain Region, 1911–2012; Unpublished Report; USDA, Forest Service, Rocky Mountain Research Station: Missoula, MT, USA, 2014.


| Years | Era | Average Harvest (1 × 10³ m3 yr−1) | Total Harvest (1 × 10³ m3) |
|---|---|---|---|
| 1909–1951 | Early Historical | 243 | 10,450 |
| 1952–2000 | Pulp | 2041 | 100,018 |
| 2001–2015 | Post Pulp | 230 | 3452 |
| 2016–2021 | Transition | 132 | 789 |
| 2022–2031 | Projections | 279 | 2793 |
| 2032–2100 | Projections | 595 | 41,059 |
| Area | Soil | Woody Biomass | Total | |
|---|---|---|---|---|
| (ha) | (Mt C) | (Mt C) | (Mt C) | |
| Inside T77 Watersheds | ||||
| Inside IRAs | ||||
| POG | 256,897 | 92.2 | 71.6 (63.2–79.8) | 163.7 (155.4–171.9) |
| YG | 1112 | 0.4 | 0.2 (0.2–0.3) | 0.6 (0.6–0.7) |
| Other | 429,312 | 117.6 | 46.1 (40.7–51.3) | 163.7 (158.3–168.9) |
| Subtotal | 687,321 | 210.2 | 117.9 (104.1–131.3) | 328.1 (314.4–341.5) |
| Outside IRAs | ||||
| POG | 52,143 | 18.8 | 16.1 (14.3–18.0) | 35.0 (33.1–36.8) |
| YG | 20,904 | 8.4 | 6.1 (5.4–6.8) | 14.5 (13.8–15.2) |
| Other | 35,251 | 10.6 | 4.7 (4.2–5.3) | 15.4 (14.8–15.9) |
| Subtotal | 108,298 | 37.8 | 27.0 (23.8–30.1) | 64.8 (61.7–67.9) |
| Total | ||||
| POG | 309,040 | 111.0 | 87.7 (77.5–97.8) | 198.7 (188.5–208.8) |
| YG | 22,015 | 8.8 | 6.3 (5.6–7.0) | 15.1 (14.4–15.9) |
| Other | 464,563 | 128.2 | 50.8 (44.9–56.6) | 179.0 (173.1–184.8) |
| Total | 795,619 | 248.1 | 144.8 (128.0–161.4) | 392.9 (376.0–409.4) |
| All Tongass | ||||
| Inside IRAs | ||||
| POG | 1,060,035 | 349.5 | 311.7 (275.5–347.4) | 661.2 (625.0–696.9) |
| YG | 7978 | 2.9 | 1.8 (1.6–2.0) | 4.7 (4.5–5.0) |
| Other | 2,657,417 | 493.0 | 214.8 (189.8–239.3) | 707.8 (682.7–732.3) |
| Subtotal | 3,725,431 | 845.4 | 528.3 (466.9–588.7) | 1373.7 (1312.3–1434.1) |
| Outside IRAs | ||||
| POG | 1,009,308 | 327.0 | 295.6 (261.3–329.5) | 622.6 (588.3–656.5) |
| YG | 178,473 | 73.3 | 50.7 (44.8–56.5) | 124.0 (118.1–129.8) |
| Other | 1,860,951 | 376.8 | 181.6 (160.5–202.3) | 558.4 (537.3–579.2) |
| Subtotal | 3,048,732 | 777.1 | 527.9 (466.6–588.3) | 1305.1 (1243.7–1365.4) |
| Total | ||||
| POG | 2,069,344 | 676.5 | 607.3 (536.8–676.9) | 1283.8 (1213.3–1353.3) |
| YG | 186,451 | 76.3 | 52.5 (46.4–58.5) | 128.8 (122.7–134.8) |
| Other | 4,518,369 | 869.8 | 396.5 (350.2–441.6) | 1266.3 (1220.0–1311.4) |
| Total | 6774,163 | 1622.6 | 1056.3 (933.4–1177.0) | 2678.8 (2556.0–2799.5) |
| Area | Soil | Woody Biomass | Total | |
|---|---|---|---|---|
| Scenario | (ha) | (Mt C) | (Mt C) | (Mt C) |
| 1. | 1,015,701 | 342.6 | 196.8 (173.9–219.3) | 539.4 (516.5–561.9) |
| 2. | 408,808 | 148.1 | 117.5 (103.9–131.0) | 265.6 (252.0–279.1) |
| 3. | 201,483 | 75.3 | 60.6 (53.6–67.6) | 135.9 (128.8–142.8) |
| Years | Era | Committed 100-Year Emissions | Realized 100-Year Emissions | ||
|---|---|---|---|---|---|
| Average (t CO2 yr−1) | Total (Mt CO2) | Average (t CO2 yr−1) | Total (Mt CO2) | ||
| 1909–1951 | Early Historical | 111,692 | 4.8 | 81,673 | 3.5 |
| 1952–2000 | Pulp | 938,147 | 46.0 | 761,687 | 37.3 |
| 2001–2015 | Post Pulp | 105,763 | 1.6 | 346,387 | 5.2 |
| 2016–2021 | Transition | 60,449 | 0.4 | 244,912 | 1.5 |
| 2022–2031 | Projections | 128,374 | 1.3 | 242,374 | 2.4 |
| 2032–2100 | Projections | 273,492 | 18.9 | 284,168 | 19.6 |
Publisher’s Note: MDPI stays neutral with regard to jurisdictional claims in published maps and institutional affiliations. |
© 2022 by the authors. Licensee MDPI, Basel, Switzerland. This article is an open access article distributed under the terms and conditions of the Creative Commons Attribution (CC BY) license (https://creativecommons.org/licenses/by/4.0/).
Share and Cite
DellaSala, D.A.; Gorelik, S.R.; Walker, W.S. The Tongass National Forest, Southeast Alaska, USA: A Natural Climate Solution of Global Significance. Land 2022, 11, 717. https://doi.org/10.3390/land11050717
DellaSala DA, Gorelik SR, Walker WS. The Tongass National Forest, Southeast Alaska, USA: A Natural Climate Solution of Global Significance. Land. 2022; 11(5):717. https://doi.org/10.3390/land11050717
Chicago/Turabian StyleDellaSala, Dominick A., Seth R. Gorelik, and Wayne S. Walker. 2022. "The Tongass National Forest, Southeast Alaska, USA: A Natural Climate Solution of Global Significance" Land 11, no. 5: 717. https://doi.org/10.3390/land11050717
APA StyleDellaSala, D. A., Gorelik, S. R., & Walker, W. S. (2022). The Tongass National Forest, Southeast Alaska, USA: A Natural Climate Solution of Global Significance. Land, 11(5), 717. https://doi.org/10.3390/land11050717