1. Introduction
A large body of archaeological and ethnobotanical evidence now indicates that the Amazon basin supported many pre-Columbian communities which actively managed the landscape for natural resources while raising local biodiversity [
1,
2,
3,
4,
5,
6]. Far from pristine, the Amazon “is actually a hugely important center of domesticated nature, contributing significantly to the global agricultural economy” [
7]. Correlations have also been recognized between regions of high biological and high linguistic diversity [
8]. The presence of large human populations in the history of the Amazon basin implies that socio-historical contexts should be taken into consideration when setting an ecological baseline for conservation [
9]. Pre-Columbian peoples managed the landscape, and they did so in the context of their own socio-economic and political factors [
5].
While it is now accepted that pre-Columbian peoples modified their environments, discussion continues as to the intensity of those modifications [
10,
11,
12,
13] and to what extent social lifeways and regional climate or environmental factors played in driving landscape change [
14,
15,
16,
17,
18]. Approaches to understanding these changes often attempt to first place them within the context of the local and regional environment alone. The location of archaeological features such as raised agricultural fields, are then explained as opportunistic structures taking advantage of pre-existing environmental gradients such as elevation or hydrologic patterns [
19,
20,
21]. Unfortunately, the efforts of humans to harness ecological forces, such as maintaining wetland habitats, are not always captured in the material record [
22]. However, they can still be detected through the analysis of past human-environment interactions [
16].
Problems arise if Amazonian landscapes are interpreted through an ecological lens, in which humans are secondary components to landscape change. Modern land management choices regarding issues such as deforestation and clearing land for farming are often related to a region’s perceived resilience to past human disturbance [
19]. Ignoring the past relationships between society and nature comes with the risk of supporting modern policy that over-exploits natural resources and results in further environmental degradation [
10,
23,
24]. Underrepresenting the relationships that past societies had with nature has made it easier to ignore the voices of indigenous groups who have their own history of managing the landscape [
9]. Understanding the landscape’s resilience to contemporary climate change calls for an understanding of not just how past peoples passively modified their environment but rather how their alterations may have changed the fundamental ecological functions of their environment [
25].
Within South America, archaeologists have a long history of attempting to connect environmental and cultural change [
6]. Early efforts to characterize tropical rainforest cultures in the Amazon emphasize the high regional variation and linguistic diversity of peoples who shared many common traits despite being dispersed across such a vast geographic area. Relating such complex cultural and environmental variation has long been problematic [
26]. Areas described simply as ‘tropical forest’ are actually a more complex mosaic of savanna and forest ecosystem that do not coincide with such sharp changes in cultural variation. The patterns observed in the archaeological record do not follow strict environmental gradients in Amazonia. Steward [
26] applied biological evolution to culture, making sweeping generalizations about how cultures could adapt to various environments leading to a linear form of cultural evolution [
27]. Meggers [
28] made similar connections between different traits of tropical rainforest cultures and their ecological settings. Characteristics of societies that reduced population size, such as increased tribal warfare or infanticide, were interpreted as the result of populations reaching their environmental carrying capacity. At the time, human populations were thought to be restricted in size and complexity by the dispersed and unreliable resources provided by a tropical rainforest ecosystem [
28]. As the dependent variable in an experiment, culture was ultimately treated as something that could be measured separately from nature.
Landscape archaeologists are well positioned to approach Amazonia as a cultural as well as natural landscape that is the product of historical social processes [
8]. Landscape archaeology is a term of growing popularity among archaeologists and other academics [
6,
29,
30]. The concept of landscape itself has had a variety of meanings across different disciplines and across its historical use in South America. Today, landscape archaeology approaches attempt to place society and nature in an interdependent relationship with one another rather than treating them as separable [
6,
31]. The investigation of archaeological sites across Amazonia has revealed a legacy of human-environment interactions in which local species richness and diversity were altered through the collection and domestication of economically useful plant species [
32,
33,
34]. Rather than simply responding to or exploiting environmental circumstances, pre-Columbian Amazonians took part in altering and managing ecological processes in order to shape the distribution of resources across the landscape [
35].
The Llanos de Mojos (or Mojos) of the Bolivian Amazon has been described as a domesticated or anthropogenic landscape [
17,
36,
37,
38] and provides an excellent case study for a landscape approach to interpreting past human-environment interactions at the community level. In the floodplains of Mojos, pre-Columbian communities constructed a variety of earthworks that are still visible in the landscape through aerial survey [
1,
32,
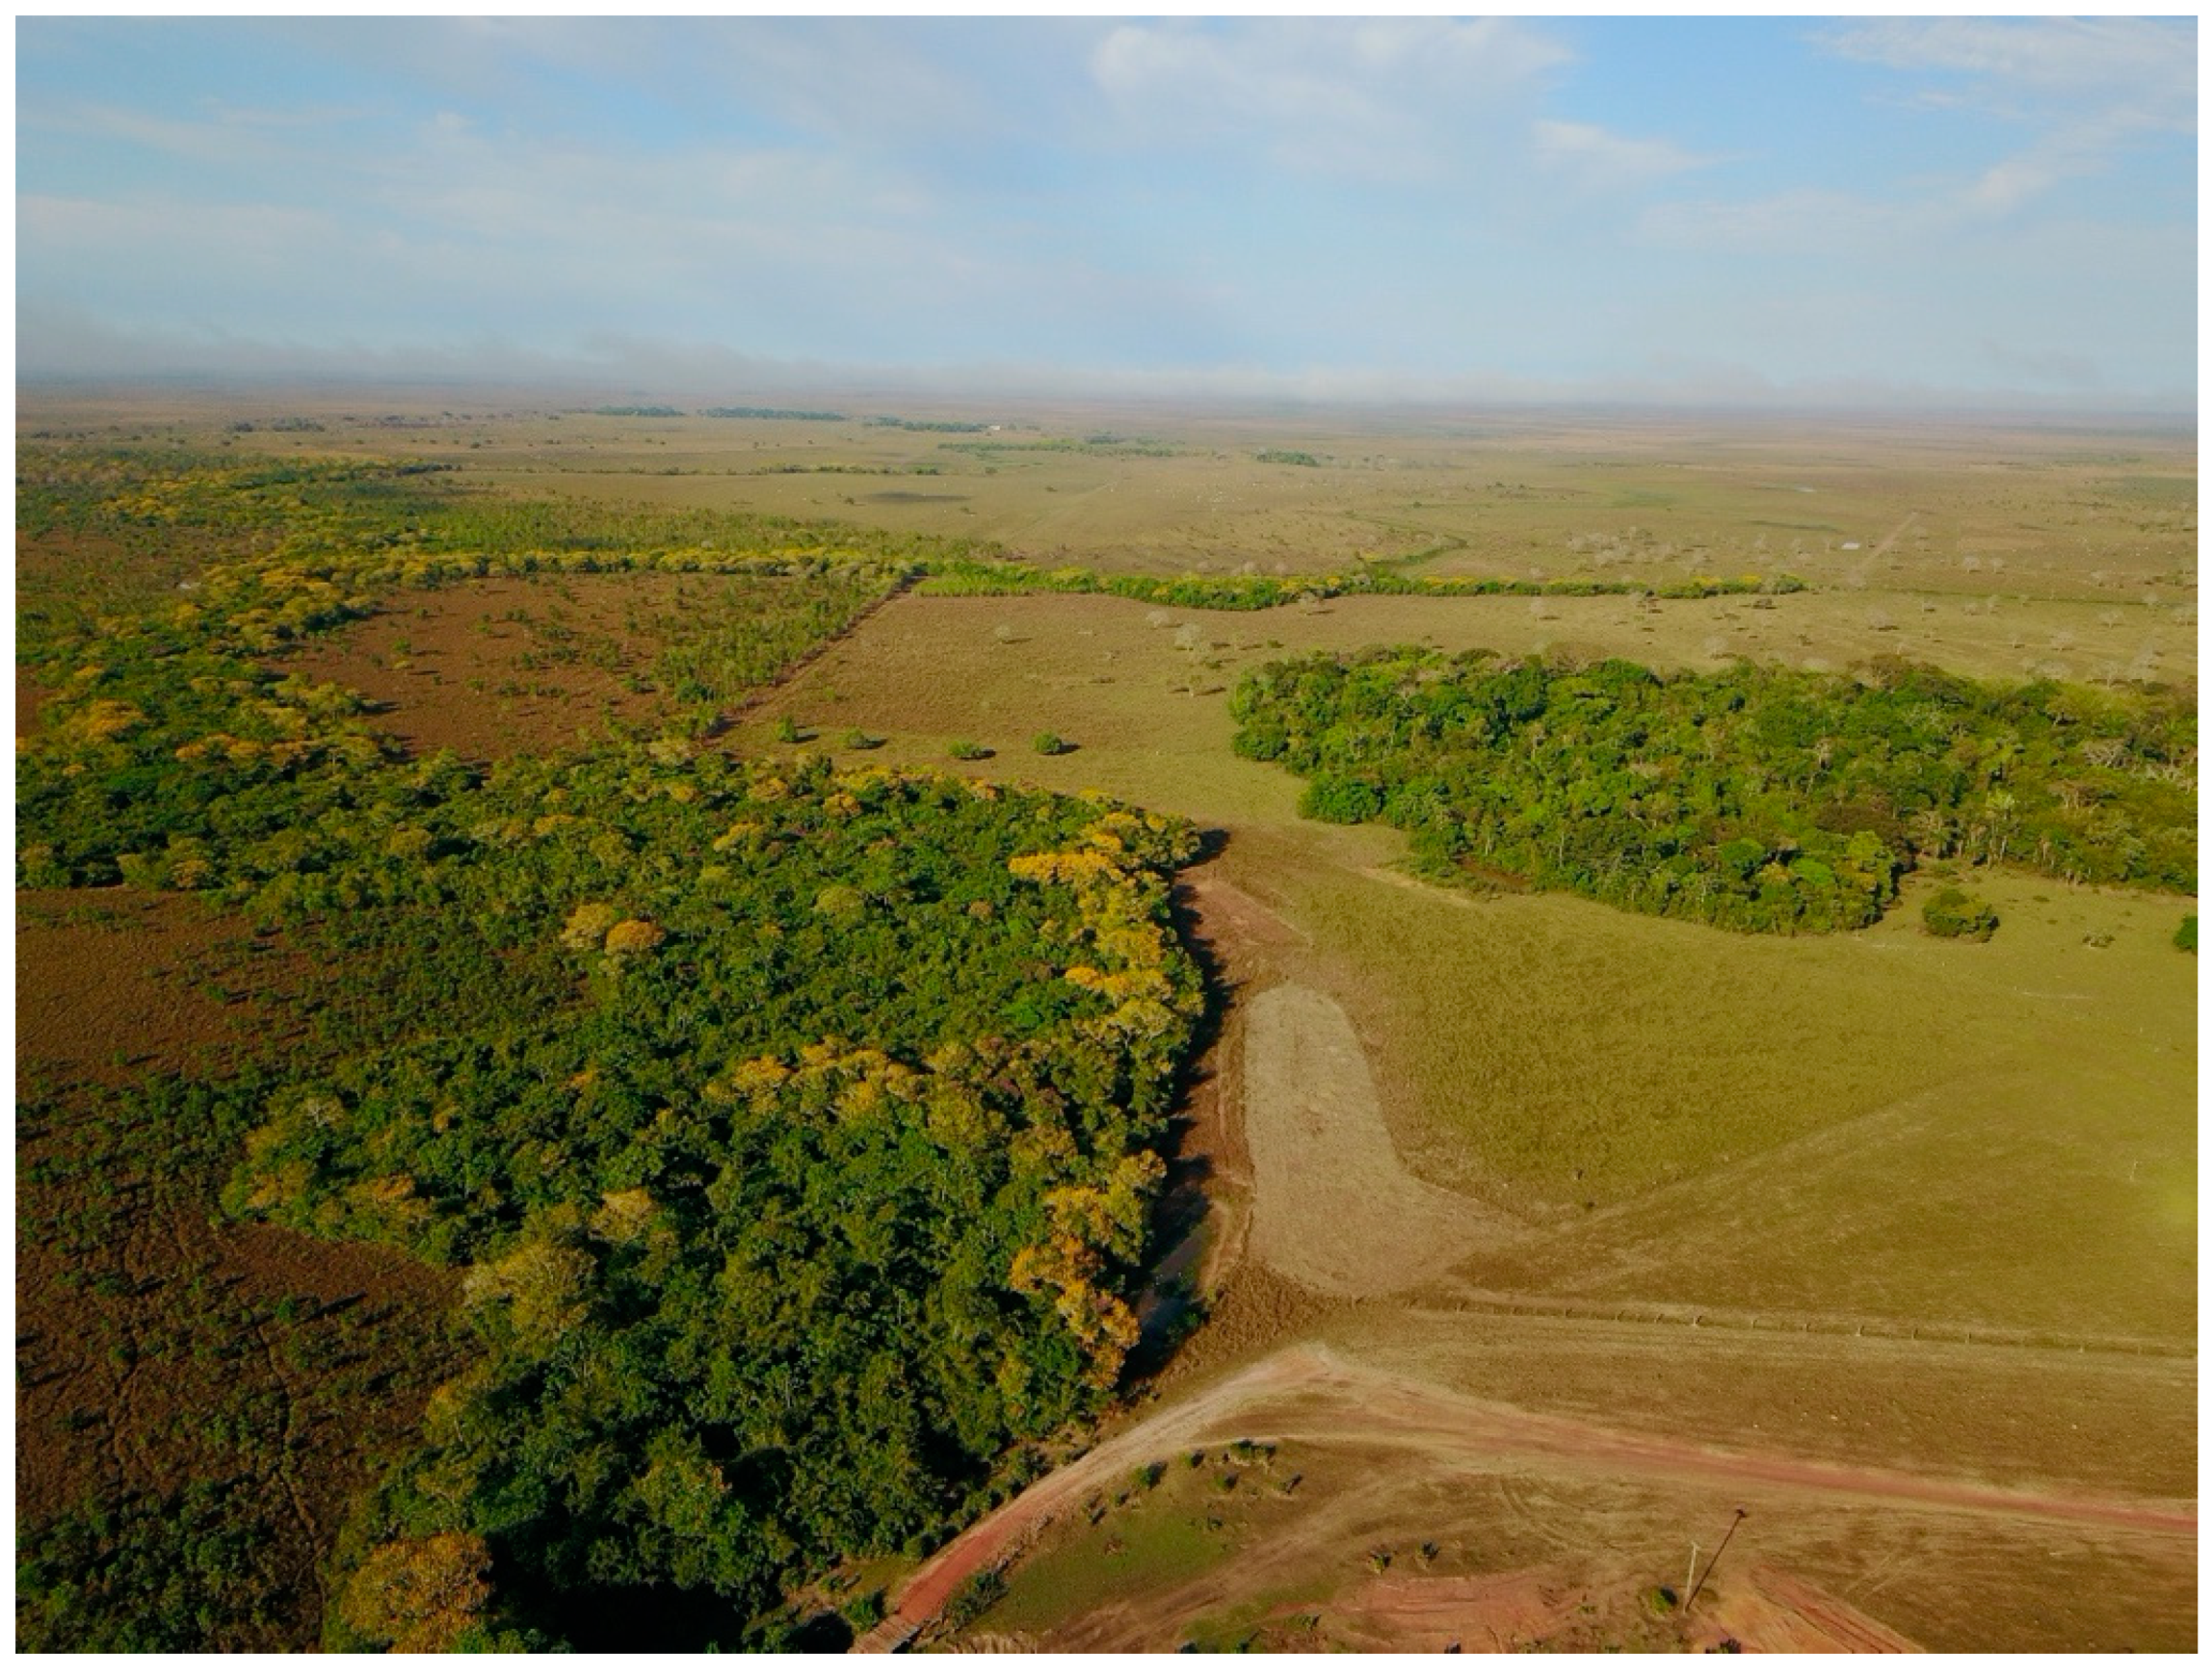
37]. Though difficult to see from the ground, many features are visible in satellite imagery making them accessible for mapping and analysis. The seasonality of the landscape also aids in the identification of forest island occupation sites. These discrete patches of forest stand out in contrast to the surrounding savanna grasses where they are most commonly found (
Figure 1). Forest islands are generally small (<0.5 ha) and circular in shape. However, they range from less than 1 to several hundred hectares in surface area. Today these islands represent the areas of habitable high ground with reduced exposure to inundation [
15,
16,
17]. A majority of surveyed forest islands in west Central Mojos (WCM) contained pre-Columbian ceramics on their surfaces with no continuous collections of finds extending into the savannas [
5]. This makes the distribution of forest islands in WCM a good proxy for the distribution of pre-Columbian settlements within the landscape.
1.1. Llanos de Mojos
Mojos as a whole is a large basin with elevation rising both to the southwest towards the Andes as well as the north and northeast towards the rock outcrops of the Precambrian and Brazilian Shield. Across the basin, topography varies less than 20 cm per km [
39]. The region is divided by the Mamoré river which cuts across landscape south to north as it flows into the Rio Madeira, one of the main tributaries of the Amazon. Tributaries of the Mamoré meander across western Mojos from southwest to northeast following the abandoned paleochannels cut by the Beni River as it altered its course across the landscape over time [
39,
40].
The forested high ground of Mojos is found in scattered islands or islas both along the major river networks as well as on the open savanna. Today these forests represent elevated areas in the landscape with sandy and better aerated soils that can support denser forests than those in the pampas [
39]. While forested levees are clearly created by the remnants of the old paleo rivers that cut through the region, there are several possible origins for the forest islands.
As of this writing, 55 individual forest islands in WCM have been surveyed on foot. Of these, test excavations were carried out on 24 islands, and of those large excavations were carried out on 6 islands. Of the 55 surveyed forest islands, 78% contained ceramics either in surface finds or excavations. Of surveyed forest islands, 91% contained either ceramics, burned earth, dark soil (by Munsell), or some combination of the three [
5,
41]. Given the high occurrence of evidence of human habitation on forest islands, it would be more difficult to prove that an island was not at some point inhabited by humans than to prove that it was. It is also true that only some of the smaller forest islands have ceramics distributed continuously across their surfaces. Most forest islands have ceramics concentrated into smaller areas of occupation within the forest boundary [
5].
Capriles [
42] identified burials within forest islands in southern Mojos dating between 4000 and 10,600 BP, making it possible that they were the first landscape features created by pre-Columbian peoples in the southwest Amazon. As shell middens, these forest islands show a strong correlation with permanent wetlands and seasonality. By altering the landscape near wetland resources, the inhabitants may have been able to enhance those resources over time. Forest islands in Mojos exemplify a blend of human and natural influences.
These settlements are spaced along the rivers at regular intervals as well as strung along seasonal streams in the open savanna. Villages could maintain communication networks between river and savanna sites through networks of seasonal streams as well as networks of landscape features [
5]. Block [
43] notes that populations periodically divided, moving from large river sites to smaller fragmented savanna sites. However, this movement is attributed to sporadic political events or changes in the size of the population rather than a possible seasonal subsistence strategy [
43].
Walker [
5] also notes that forest islands associated with large raised fields generally follow one of two patterns. Forest islands are either located atop river levees adjacent to the permanent rivers or they are placed in close proximity to seasonal creeks further out in the savanna. The distribution of Mojos settlements empowered “communities to enter or exit relations with a larger riverine social world, moving with the seasonal changes brought by flooding… [
5].”
Ditched enclosures have been documented across the southern rim of the Amazon basin. In Mojos these enclosures are known as ‘ring ditches’ and are found within forest islands [
44]. In northeast Mojos, ring ditches are monumental in size compared to those in WCM [
5]. They were dug to depths several meters deep and encircling areas more than 1000 m in width [
45,
46]. When measured by environmental factors such as vegetation, the relationship between Mojos and greater Amazonia is not so clear [
40]. However, the overlap of earthwork constructions such as that seen with ditched enclosures demonstrates that human society cannot so easily be separated from these two contexts.
1.2. Large Raised Fields
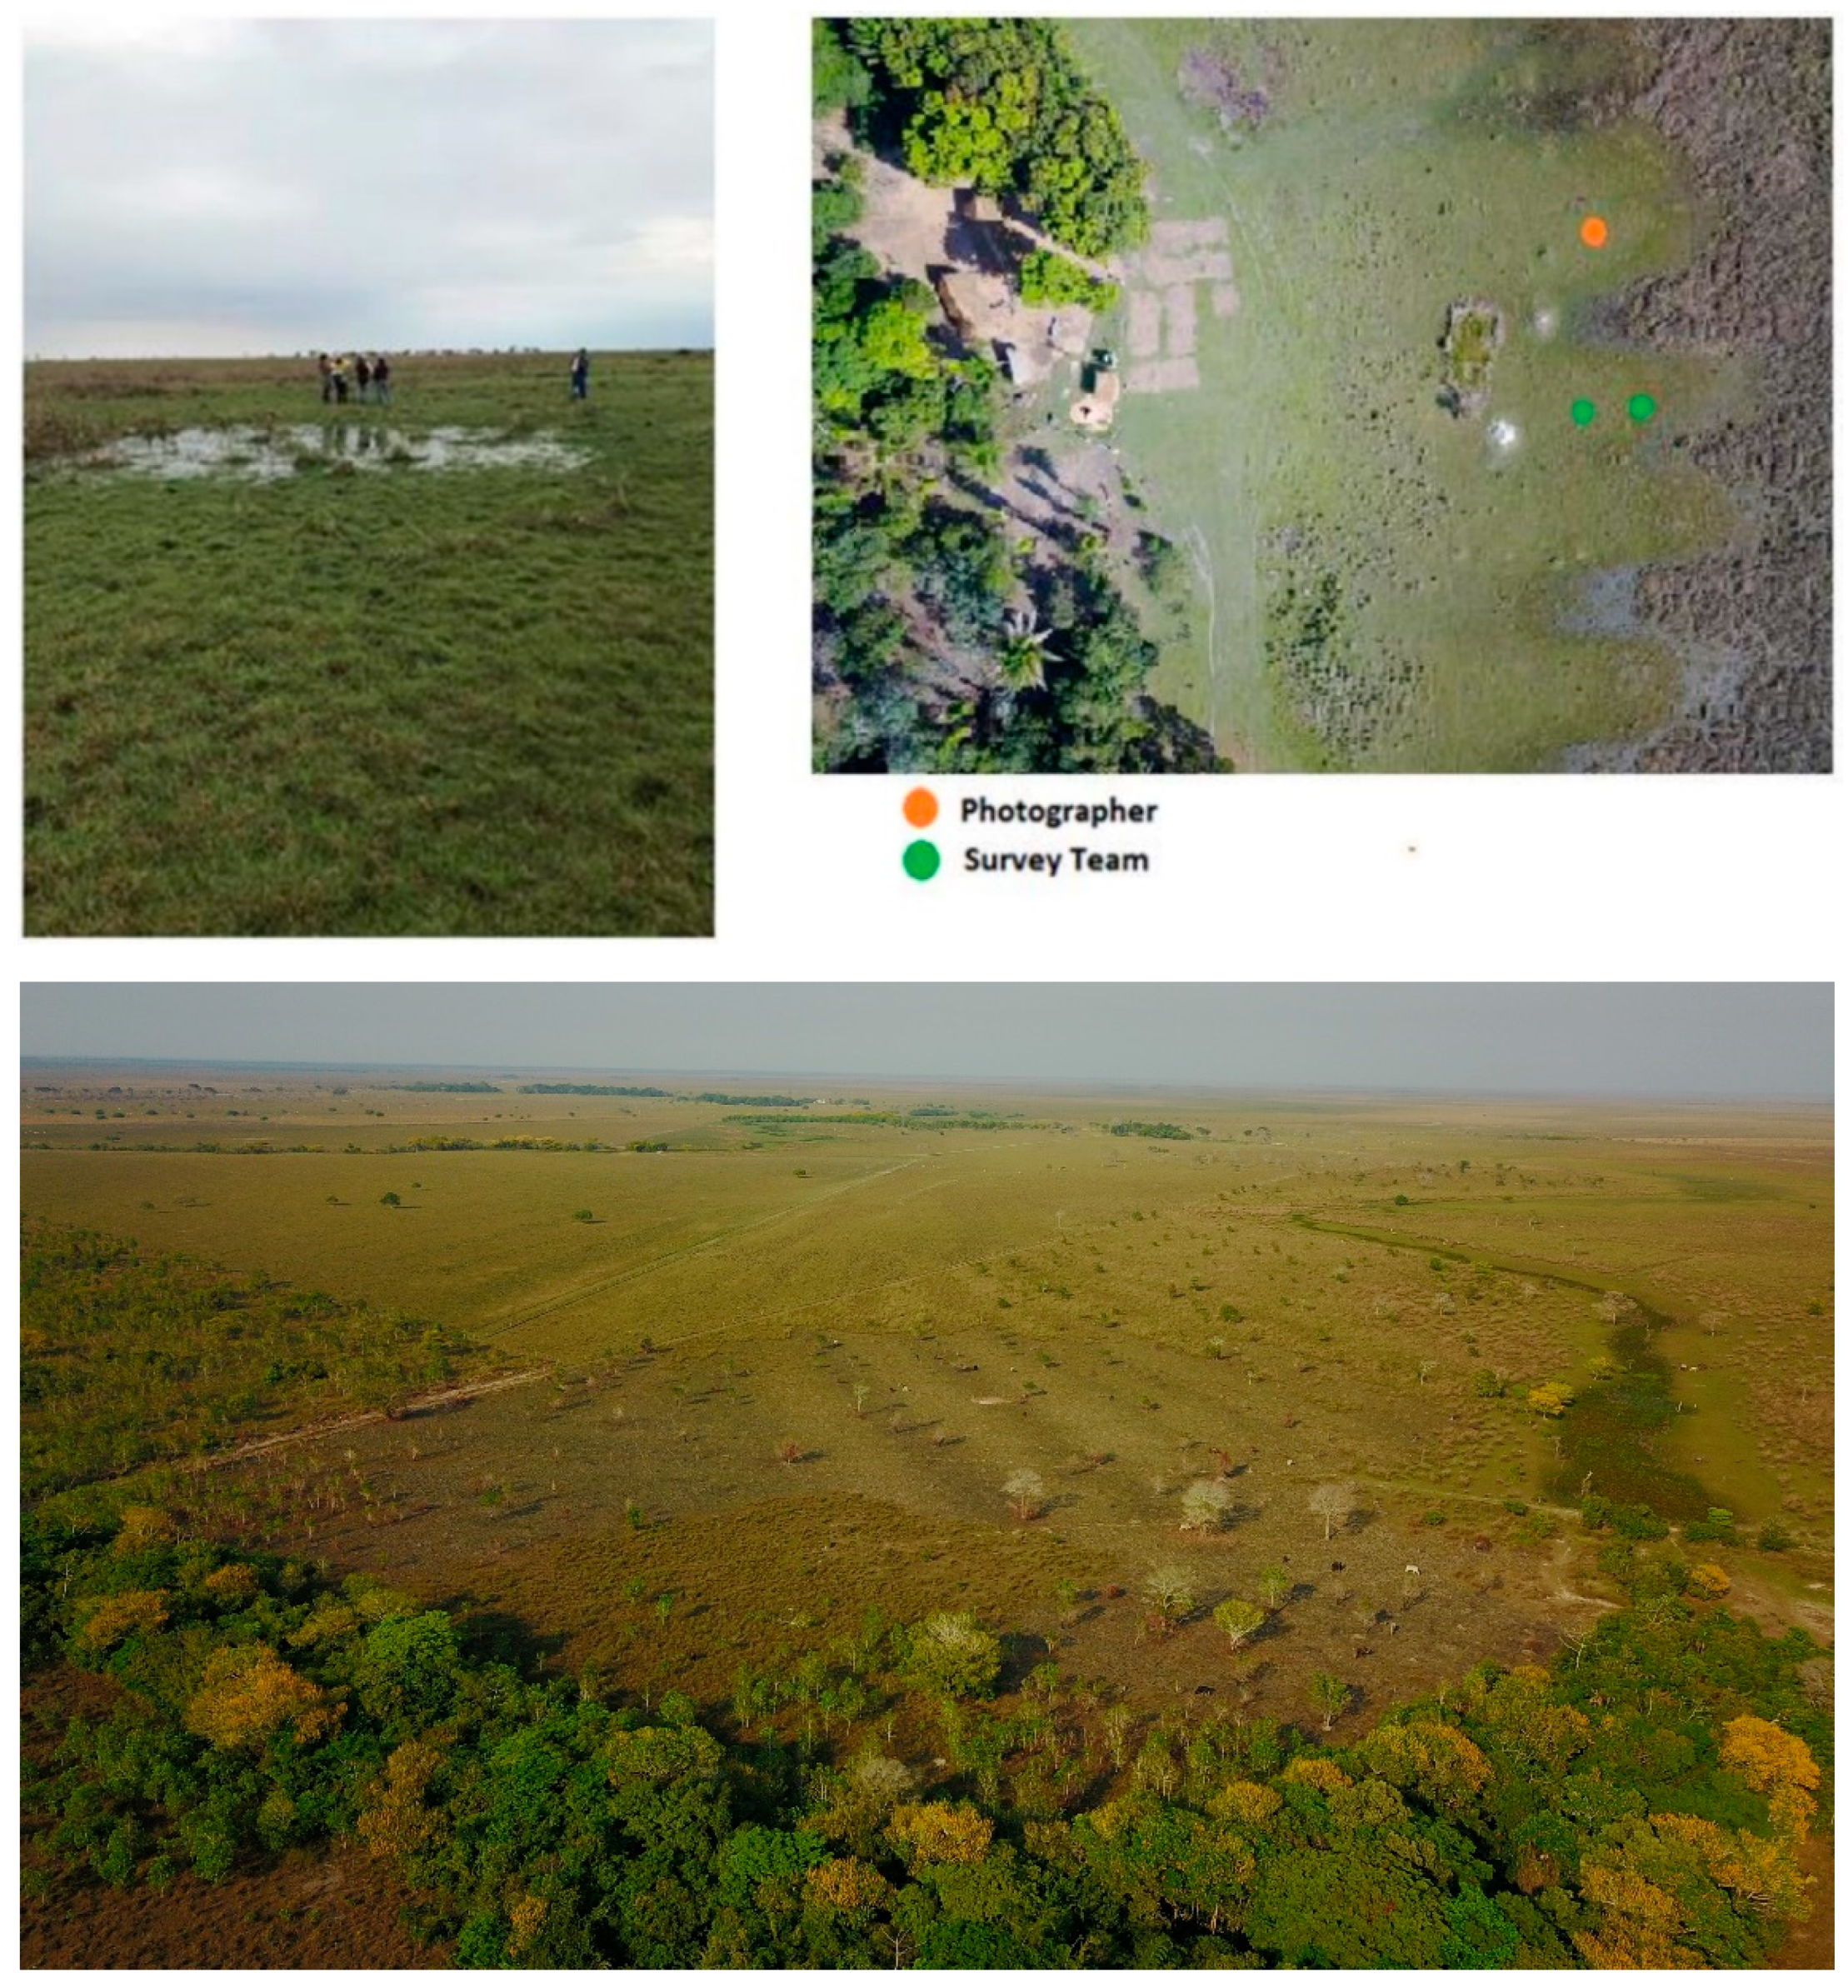
Large raised fields are one of the most extensive modifications to the Mojos landscape but also one of the most difficult types of features to identify and survey from the ground. From the air, they appear by the thousands as large rectangular platforms of mounded earth. Today they are only several cm tall. Even with the assistance of aerial photographs, ground proofing the locations of raised fields is not an easy task for the present-day farmer or archaeologist alike (
Figure 2). The grass growing atop the platforms is less dense than the surrounding area given the better drained soils of the more elevated surface. From the air, the less dense patches of grass make the vegetation appear lighter in color outlining the shapes of the raised fields in contrast to the surrounding area [
39]. With improving access to better satellite imagery, a clearer picture of the extent of large raised field agriculture is available and more than 40,000 large raised fields have been identified and mapped in satellite imagery.
One of the most visible functions of raised field platforms is the draining of ground for farming through the mounding of earth and digging of adjacent canals or ditches. Raised platforms protect crops from flood waters and the intervening canals or ditches create low spots that retain water longer into the dry season [
39]. As a result of their construction, raised fields have the effect of ecologically engineering a landscape by transforming a homogenous savanna environment into a mosaic of different ecosystems with more complex ecological functions and much higher levels of animal and plant diversity [
47]. In the Quinato wetland, raised agricultural fields have been found in close proximity to artificial wetlands. However, their regional hydrological functions remain unclear [
16].
Charcoal and pollen records from lake cores in WCM indicate periods of increased fire use that coincides with the presence of maize pollen. As fire use increased, arboreal pollen from savanna trees was greatly reduced in the lake cores suggesting that fire was being used to prevent the regrowth of trees on the savanna. The large increases in charcoal in the lake cores likely resulted from large-scale fires associated with the construction and farming of raised fields [
48]. The presence of diatoms in WCM sediment cores has been used to indicate the creation of permanent wetland environments in WCM during periods of increasingly dryer climate [
16]. Mojos farmers were manipulating both terrestrial and aquatic environments as part of managing the landscape.
Large raised fields in Mojos today range from 10 cm to more than 50 cm in height above the surrounding savanna. Excavations of the canals between raised fields indicate that as much as 20 cm of soil have eroded from the tops of the fields into the canals since their abandonment [
5]. Estimating a conservative average height of 20 cm in Pre-Columbian times, the 120.2 km
2 (12,020 ha) of raised field platforms mapped in this study represent a total of just over 24 million m
3 of soil that was moved during the construction of raised fields. This is a volume roughly 10 times the volume of the great pyramid at Giza. The construction of raised agricultural fields is thought to have required high inputs of labor [
47]. Erickson [
49] estimated that constructing a single hectare of raised field required at least 800 person-days of labor. However, their continued maintenance probably required less than the initial construction. Based on experiments reconstructing large raised fields in Mojos, it has been suggested that raised fields were constructed by community work parties [
50]. The GIS analysis of large raised fields has shown that fields are clustered into oriented groups in which the estimated carrying capacity of a single field in the group is comparable to the subsistence requirements of a community work party large enough to build a single field in the group. It was estimated that community work parties with as few as 20 individuals could have been responsible for constructing groups of large raised field platforms [
41].
Unlike industrial forms of intensive agriculture that emphasize monocropping, traditional kin-based agricultural systems controlled by a household usually intercrop a variety of different wild and domesticated plants in their fields [
51]. Jesuit Padre Castillo provided a list of plants cultivated by Mojos communities: maize, beans, squash, sweet potato, peanut, papaya, red pepper, cotton, a variety of edible tubers, tobacco, and plantains [
39]. Paleobotanical evidence such as starch grain and phytolith analysis has confirmed that maize, squash, peanuts, beans, sweet potato, arrowroot, urucu, pumpkins, gourds, bananas, sugarcane, cayenne pepper, palm fruits, cotton and tobacco were all cultivated near settlements in Mojos [
16,
17,
48,
52,
53]. Whitney [
48] provides evidence of maize and sweet potato cultivation on large raised field platforms near El Cerro in WCM. Paleobotanical evidence also indicates that Mojos farmers were domesticating several species of plants and trees including yuca, peach palm, pepper, peanut, achiote, and cocoyam [
5].
The raised fields that remain in Mojos today have had all nutrients leached from their surface soils since abandonment [
48] and farmers in the Beni report that savannas cannot be farmed [
39]. However, the Paleobotanical evidence above confirms that before their abandonment, raised agricultural fields supported a diverse group of plant species, including nutrient intensive crops such as maize [
48]. Understanding the ecological functioning of raised fields as a sustainable form of agriculture will require placing this system in its social and historical contexts.
1.3. Problems and Objectives
With just under 50,000 individually mapped landscape features spread across more than 10,000 square kilometers of study area, the task of creating associations between any two features becomes quite complicated. In west central Mojos (WCM), there is no ethnographic comparison to indicate at what distances a set of landscape features become more or less associated with one another. While the relationships between agricultural fields and their surrounding forest islands may be difficult to identify at the local scale, analysis of the regional distribution of these features can reveal patterns in their spatial organization within the landscape. It has been argued that the complex factors behind landscape formation can be explored with analytical approaches to the spatial structure of archaeological features at multiple scales [
54].
The purpose of this project is to utilize a landscape approach to the interpretation of regional settlement patterns in WCM. The first objective was to reconstruct the pre-Columbian landscape by mapping the distribution of three types of landscape features: forest islands, raised agricultural fields and water systems (rivers, streams, and wetlands). Utilizing methods proposed by Ingold [
55], Walker [
5] identified four types of patterned clustering or ‘constellations’ of these landscape features in WCM. These constellations and the immediate area of the landscape that surrounds them are referred to here as ‘landscape units’. Each of the four types of constellations or landscape units afforded its inhabitants a specific set of community tasks associated with that particular cluster of landscape features (discussed below).
The second objective was the mapping of analytical landscape units based on the increasing or decreasing proximity of any point on the landscape to each constellation of features. The primary objective was the identification of patterns in the distribution of landscape units in relation to one another across the region. These patterns represent interactions between agricultural communities and the landscape they domesticated. A regional investigation can demonstrate correlations between agricultural and settlement related activities not visible at the local scale. Given the relatively consistent topography across WCM, variable patterns in the distribution of farming communities to permanent water networks would demonstrate a type of variability not directly resulting from any pre-existing environmental gradient.
2. Materials and Methods
At the University of Central Florida, student volunteers for the Archaeological GIS project of the Beni (Proyecto Arqueológico SIG del Beni/ProSIGAB) have for 15 years been using software such as Google Earth and ArcMap to digitize archaeological features from open access satellite imagery. To date this group has mapped more than 60,000 pre-Columbian raised agricultural fields, 4000 forest islands, several hundred kilometers of river and water network, and hundreds of other features such as contemporary farms, visible ring ditches, earthen causeways, and fish weirs. These digitized spatial data are then uploaded to GIS software such as ArcMap for further spatial analysis. The first stage of this project was to utilize ArcMap to sort through spatial data in the ProSIGAB database and select from it a layer of data in which each individual archaeological feature of interest (raised agricultural field, forest island, and water network) was represented by a single polygon.
Working with a body of data created by crowdsourcing has advantages and disadvantages. This project analyzed ProSIGAB spatial data going back as far as 2010 and included the work of more than a dozen different digitizers working at different periods of time on satellite imagery from a variety of platforms and time periods. The quality of available imagery is constantly improving, and issues such as cloud cover in one year may be improved in another year. Even when features can be readily identified in satellite imagery, their exact shapes are not always so easy to distinguish and outline. For instance, when cattle move from one raised field to another, they trample down the ends of the agricultural fields making them appear to blend together into one single field. Other fields have well preserved ends that can be drawn out neatly with little question. To further complicate the problem, students often overlap their work and create multiple digitized versions of the same field from which a single field must be selected for analysis.
The efficiency and accuracy of mapping tens of thousands of landscape features can be greatly enhanced with the advancements in AI technology combined with access to highly accurate LIDAR data. Changes in elevation are the primary drivers of grass density atop raised fields which in turn directly affect their ability to be visually identified from satellite imagery. An accurate digital elevation model created from LIDAR data has the potential to automate the identification and mapping of archaeological features [
56,
57]. Raised agricultural fields and forest islands could be identified within the landscape even when the changes in surface vegetation are not strong enough to detect with the human eye. In the absence of a detailed digital elevation model, identifying archaeological features on the landscape requires a trained eye.
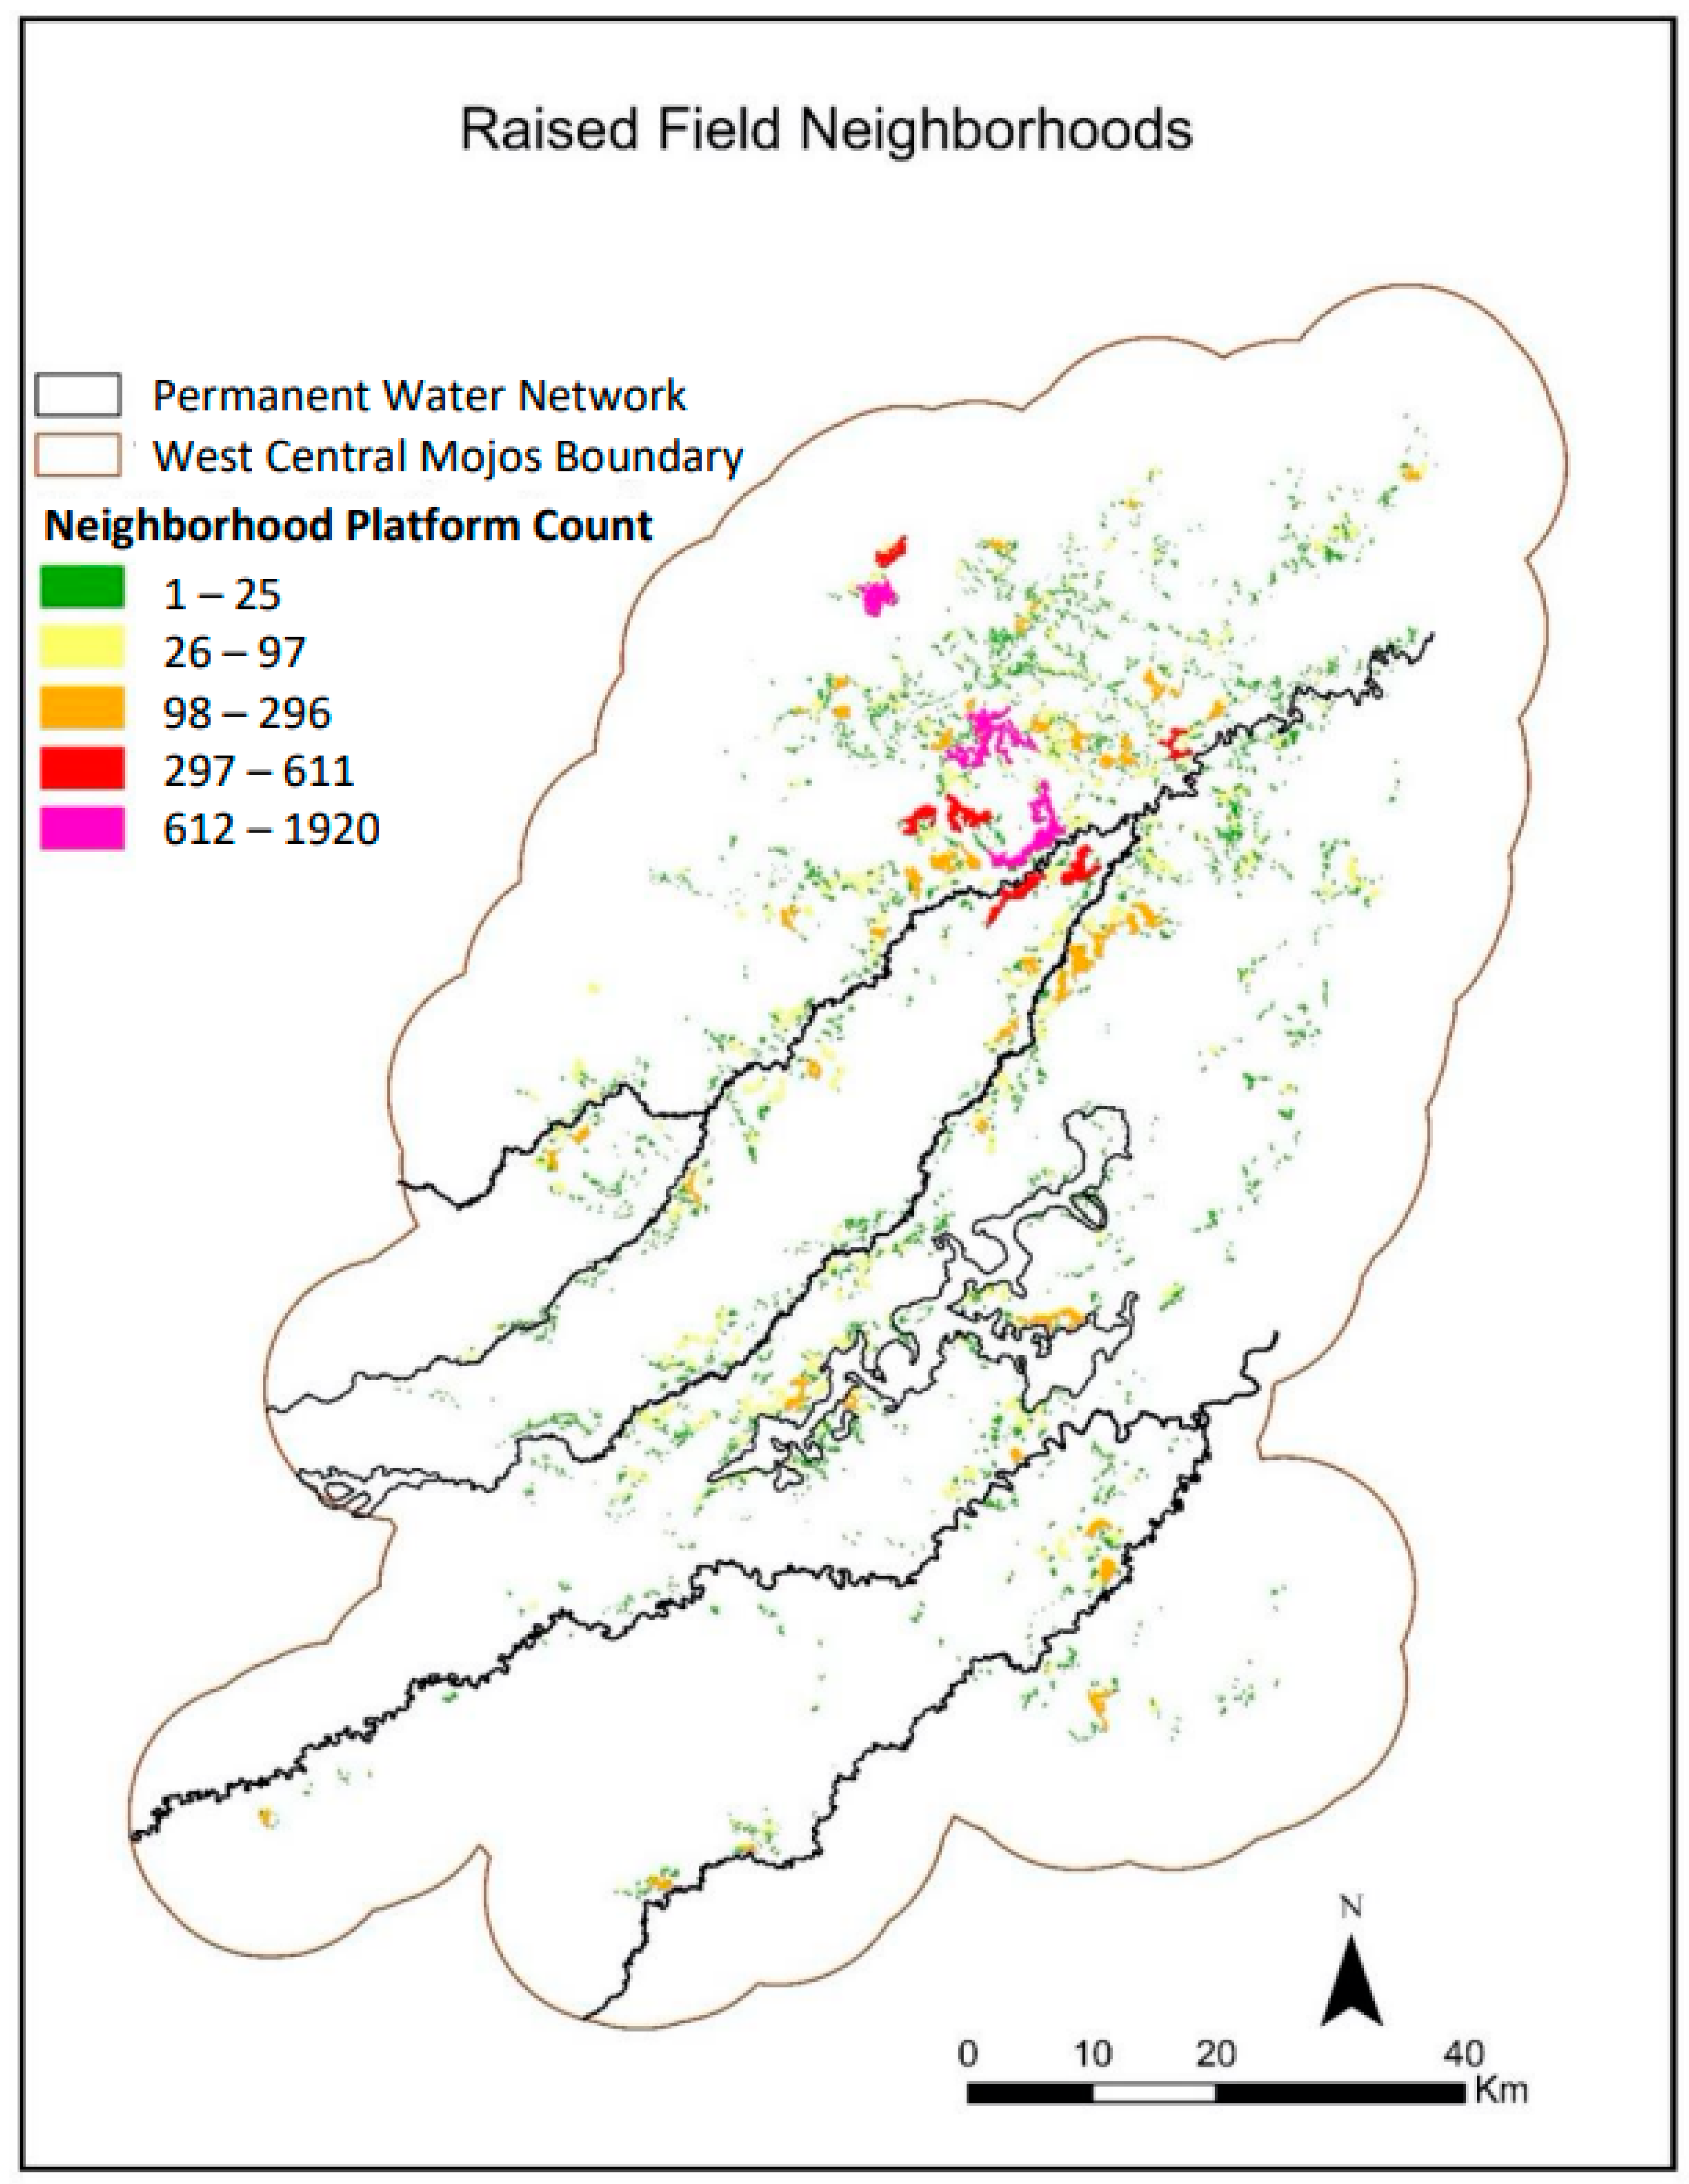
When trying to sort raised fields into spatial groups, one of the simplest relationships that can be inferred is between two fields that are adjacent. When one field is built next to another field it takes up limited space available for a group of farmers to expand and build more fields next to ones currently in use. The assumption here is that building one field adjacent to another required some form of cooperation between those who had rights to access the fields. The next step in the study was assigning each field into a local neighborhood grouping based on proximity to nearby fields. Each neighborhood is given a unique identifier and can be analyzed for attributes such as total area and field count (
Figure 3).
Preliminary analysis of the data revealed an average distance of less than 10 m between any field and the nearest neighboring field. The average width of a field was estimated to be approximately 20 m. Field width measurements were taken with the Minimum Bounding Geometry tool, but since no field is perfectly rectangular this measurement was slightly skewed towards a higher value and 20 was selected as a more accurate estimate based on manual measuring of sampled polygons. Based on these figures, it was determined that 40 m was the minimum width of an area needed to construct a raised field platform. This includes 20 m for the platform itself and two adjacent canals each with a 10 m width. 40 m is consistent with methods used by [
41] in creating raised field neighborhoods based on proximity. Raised fields with less than 40 m separating them are more closely associated with one another since there is not enough room between the fields to build another field. The construction of one field has impacted the adjacent field by taking up a limited amount of space allowing fields to be constructed side by side. Fields with more than 40 m separating them from adjacent fields are less associated as there was enough available space for more fields to have been constructed between them. Intentionally spacing fields apart from one another may have been a basic principle of organization and is the basis for the neighborhood designation here. No field platform was assigned to more than one neighborhood. Individual fields isolated from all other fields by more than 40 m were still assigned neighborhood identifications, though their neighborhood count would be only 1 platform.
Walker [
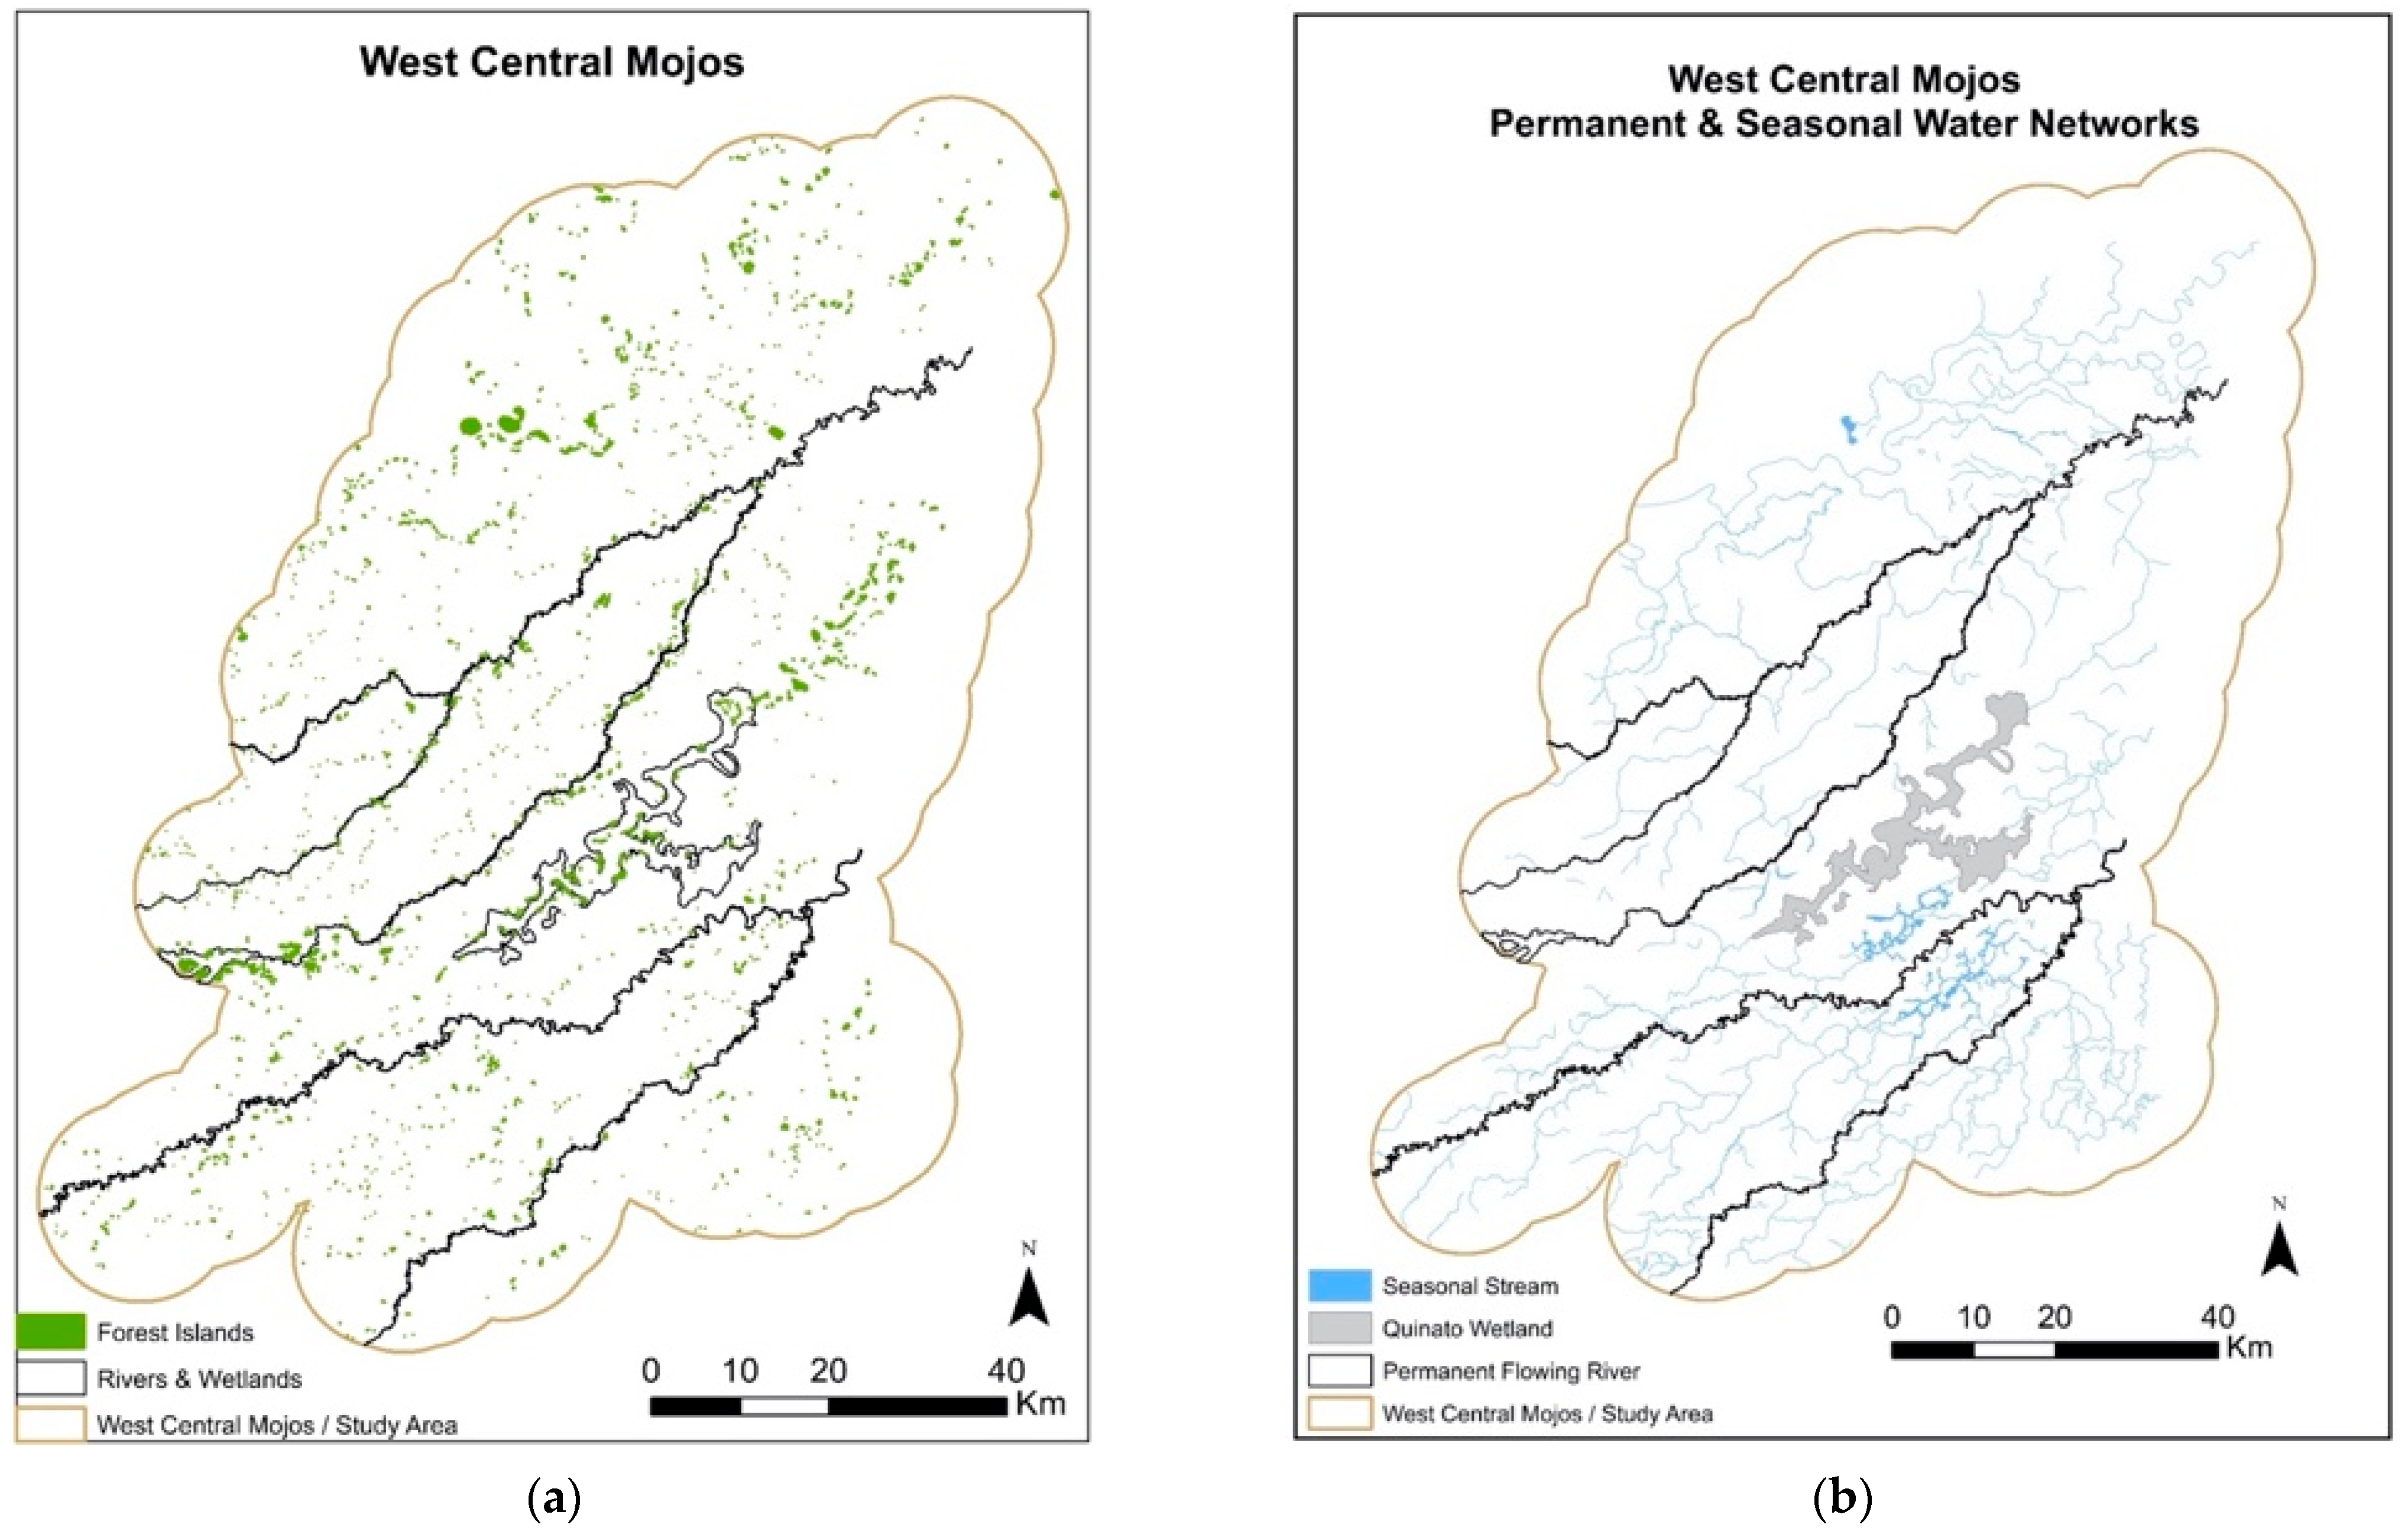
5] defines west central Mojos (WCM) as any area within 10 km of a raised field platform. A study area was created based on the known location of raised field platforms and a 10-km proximity rule. Raised field neighborhoods are restricted to WCM by definition. However, forest islands and water networks extend beyond the study area in every direction. The forest island and water network data sets discussed below were selected based on their intersection with the WCM study area polygon (
Figure 4).
A distinction must be made between forest islands and patches of forests growing atop raised agricultural fields. In the northwest part of the study area large sections of forest were removed from the project dataset of forest island polygons since the forest margins are restricted to the surface of the field platforms with no trees growing in the intervening ditches. It is difficult to determine whether these areas represent actual habitation sites since they are both non-circular and are not associated with ceramic finds. It is also unclear what role the fields play in the origins of the forest given the lack of growth in the surrounding canals. Many of these forests are scattered across what appear to be meandering river levees from an abandoned paleo-river channel. As with the river levees along the rivers further south, there are still patches of high ground and solid forest areas that can be selected out as forest islands from the larger levee areas. The total amount of forest island surface area varies depending on how this type of forest cover is treated. This project included a layer of 1940 polygons representing 8786.4 ha of forest island that intersected with the project study area. These figures do not include gallery forests or scrubland and only include circular to irregular forest islands with clear boundaries. Four permanent rivers cross west central Mojos: the Iruyañez, Omi, Yacuma and Rapulo. Though they vary in size and sediment load, each meander across the region from southwest to northeast following larger channels left by abandoned paleo-rivers (
Figure 4). Though technically not a ‘living’ river, the Quinato wetland was also digitized as a permanent water network for the purpose of this project. The transition from savanna grasses to reeds and other aquatic plants is very clear in satellite imagery of the Quinato and the entire wetland was digitized as a single polygon. The wetland is surrounded in all directions by savanna as well as seasonal streams.
Each of the permanent rivers contain arroyos and stream networks branching off into the surrounding savanna. However, many of these secondary water sources are seasonal rather than permanent. As the stream networks move further into the savanna the reduction of the gallery forests is notable in the satellite imagery. In the savanna, unforested stream networks are difficult to distinguish from cattle trails and modern roads and canals. Therefore, only the most visible savanna stream networks were mapped with the criteria that their paths be traceable back to some part of the permanent and forested sections of the river system. Savanna stream networks often move through a mosaic of marshes and swamps. Where permanent wetlands were most identifiable, they were digitized as polygons to capture their more distinguishable margins. Most stream networks, however, were digitized as polylines marking the center of the stream network. The stream polylines were buffered into 5 m wide polygons to represent the stream networks. Only the four permanent rivers with permanent forests along their banks had both banks mapped individually.
2.1. Building Analytical Units
Landscape is a popular term that has been used with a variety of meanings across different disciplines and throughout its historical use in South America [
6]. This project defines a landscape as an experience. Through the act of dwelling, humans experience landscapes that they create and maintain. A place can be characterized by the experiences it affords and the types of activities or tasks that inhabitants of that place engage in [
55]. landscape features in this project are assumed to afford inhabitants opportunities to take part in a variety of tasks. Through continued presence within the landscape, a feature such as an agricultural field continues to afford a variety of tasks for farmers to take part in over time. Tasks may be individually listed but are intrinsically linked to larger groups of tasks related to the landscape and to the encompassing social networks that surround daily life [
55]. This understanding of the landscape as a patterned social experience is essential to investigating the historical processes behind landscape change.
Walker [
5,
36] utilizes a taskscape approach suggested by [
55] to compare different agricultural landscapes based on the tasks required to create and maintain earthworks. Different landscapes present a different matrix of overlapping tasks afforded the inhabitants dwelling there. If the construction of a raised causeway interferes with the function of a nearby agricultural field, then cooperation would be required between the farmers with stakes in the conflicting tasks. When comparing different agricultural landscapes in Mojos, some taskscapes are more complex than others [
58].
Walker [
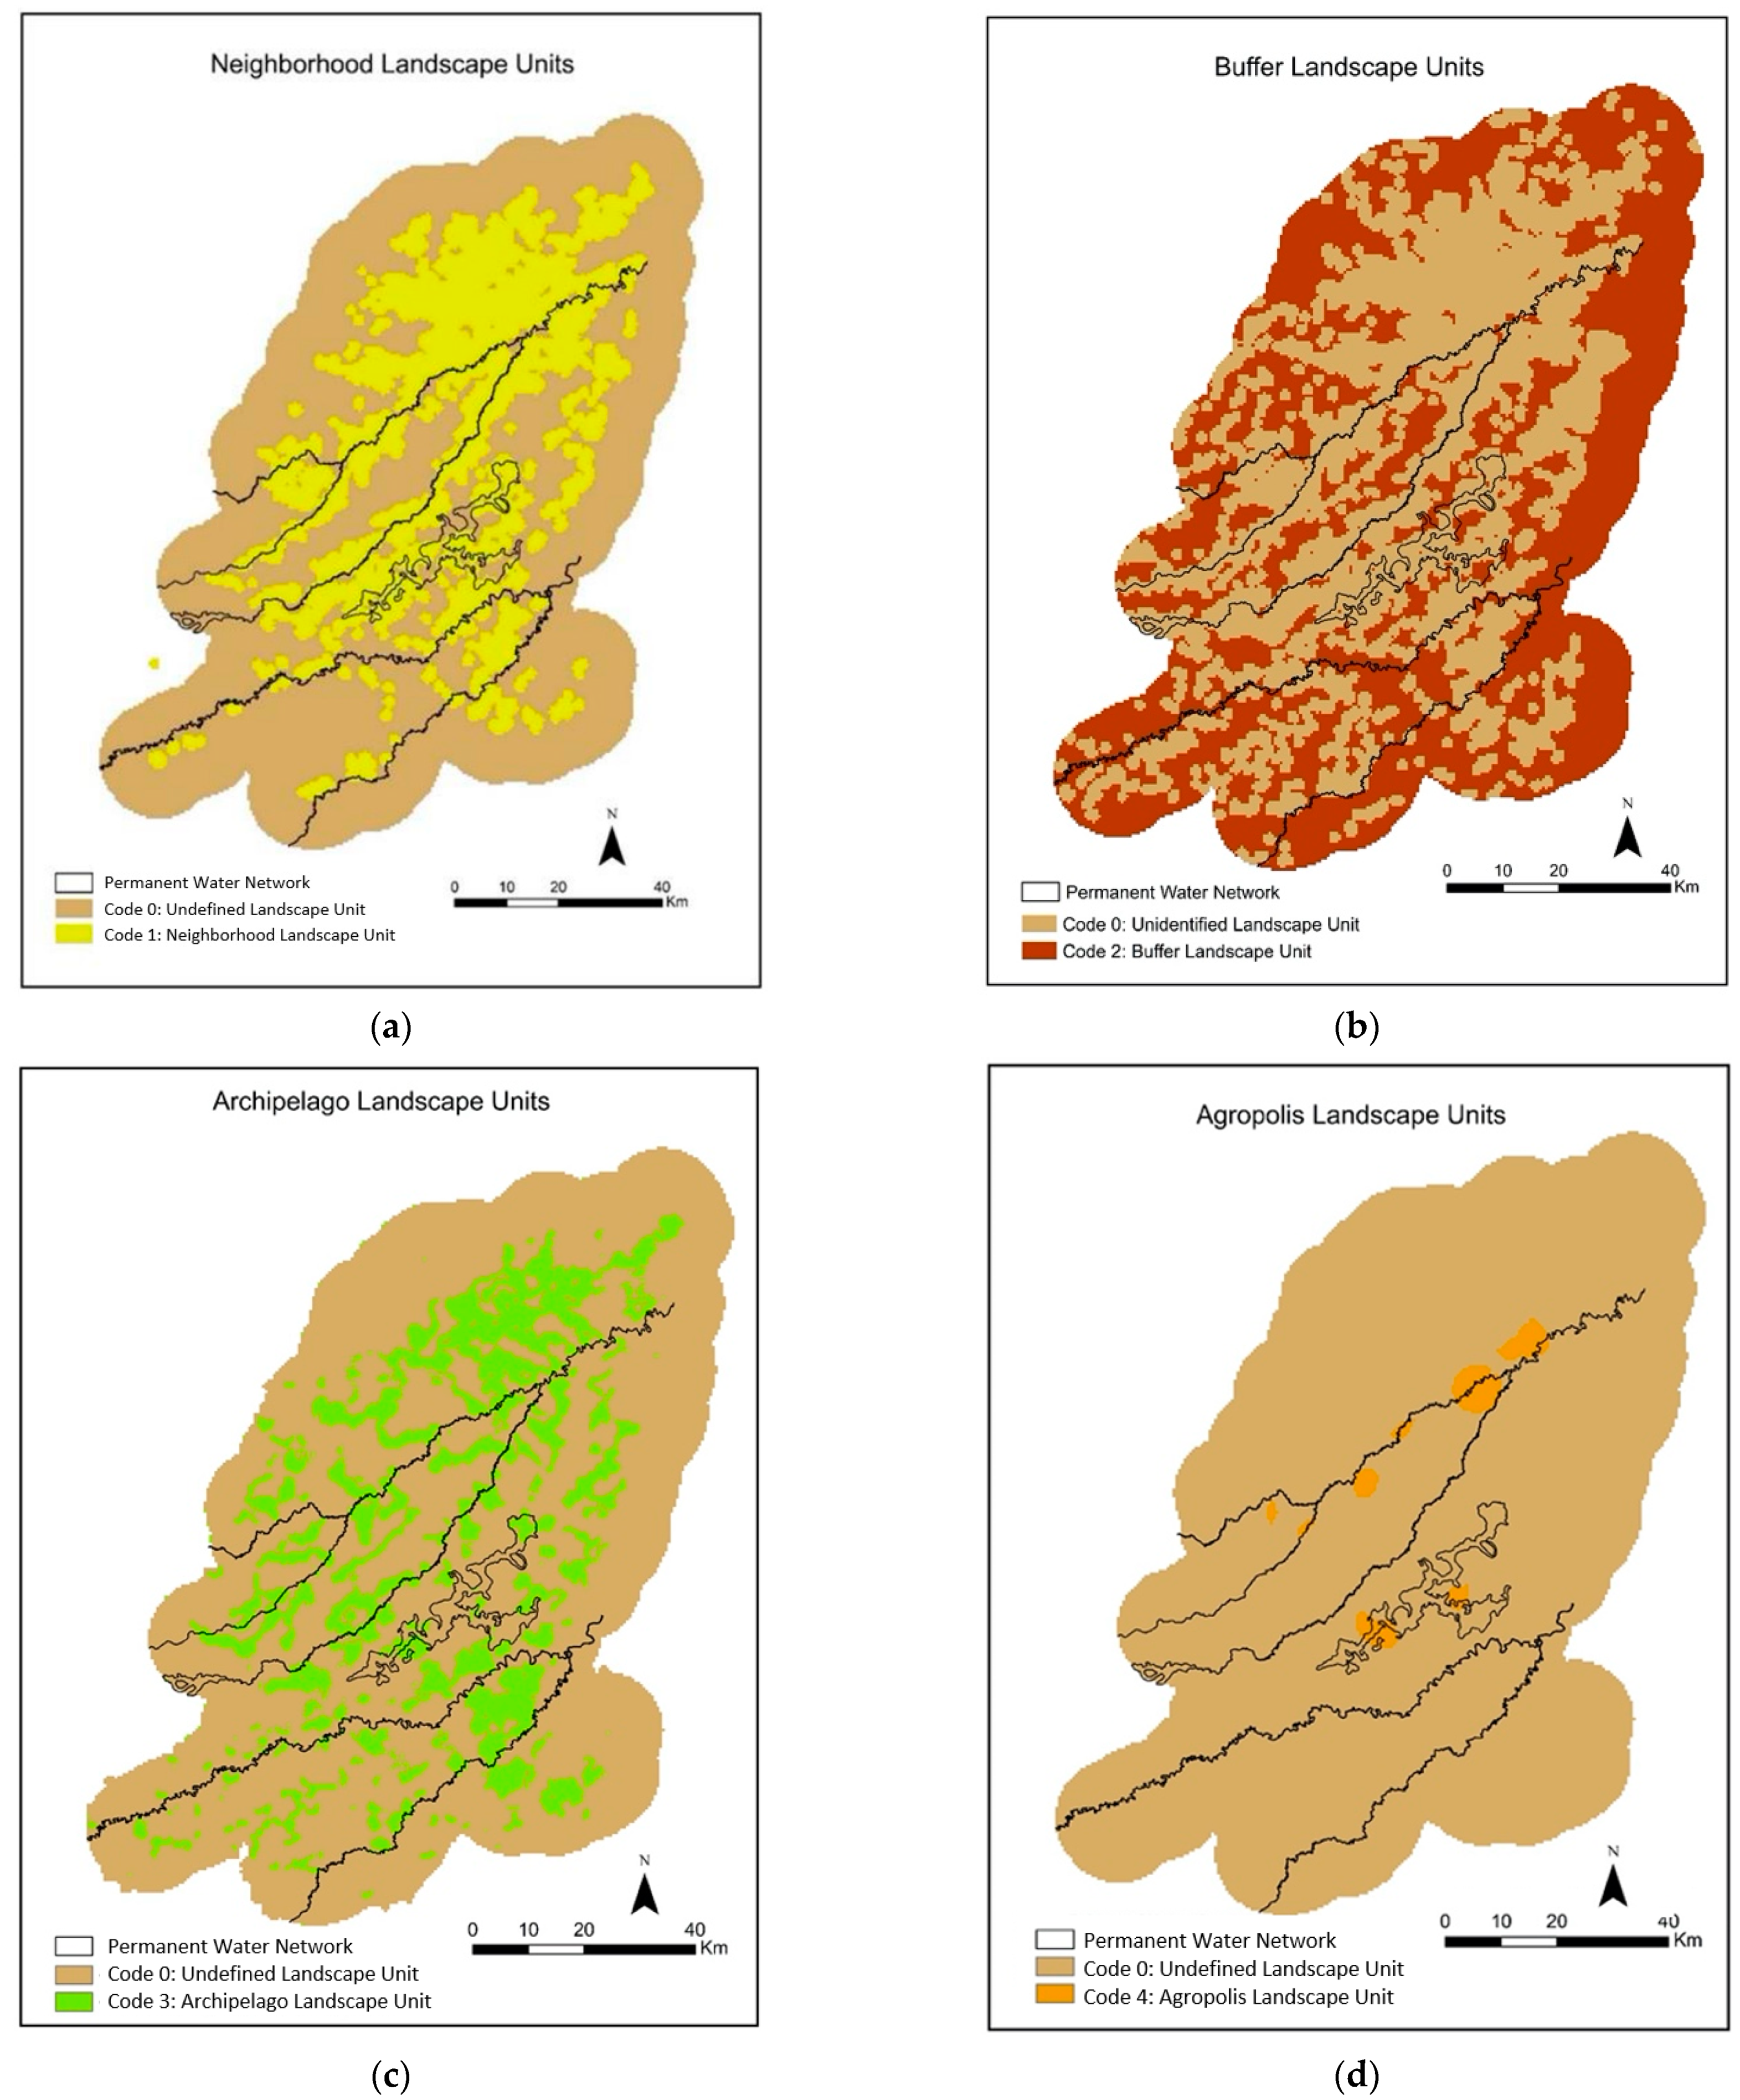
5] utilizes six categories of tasks (“farming, construction, hunting, water control, fire control, and transportation”) to analyze different clusters or ‘constellations’ of landscape features representing community level taskscapes acting on the landscape. These constellations and the immediate area of the landscape that surrounds them are referred to here as landscape units. The project analyzes the relationships between three primary sets of spatial data: forest islands, raised agricultural fields, and water sources. The primary objective was the creation of four maps representing the distribution of agropolis, archipelago, neighborhood, and buffer landscape units as proposed by Walker [
5]. A combined map of the four different landscape units can be used to identify patterns in the regional distribution of communities across the landscape.
2.2. Landscape Units
Areas of the landscape are analyzed based on the variety of tasks that members of a community carry out to construct and maintain patterned groups of landscape features [
5]. For example, areas with numerous raised fields as well as permanent rivers afford inhabitants a wide range of tasks relating to farming on raised fields as well as trade and transportation along permanent rivers. While carrying out these tasks members of a community move between forest island and raised field and river experiencing more of the landscape than just the platforms of raised fields or the interior of a forest island. Areas with fewer or no agricultural fields and no permanent rivers may be associated with other tasks such as setting fires on the savanna, hunting game, or visiting a fishing spot. Landscape units represent ways in which permanent modifications to the landscape had the potential to pattern the daily activities of the communities who dwelled there.
A series of suitability maps were created for each of the four landscape units described below. These suitability maps represent the proximity of each point on the landscape to a given landscape feature. Suitability maps were created by buffering each of the vector-based datasets and assigning a ranking value to each of the buffered regions identified. All vector-based maps were converted to 500 m pixel rasters for analysis. More details on this methodology and its assumptions are available elsewhere [
5,
59,
60].
2.2.1. Neighborhoods
Neighborhoods are defined as areas of the landscape in close proximity to a raised field neighborhood. They are constructed from a vector-based map of raised fields, grouped by proximity. Raised field neighborhoods are represented by groups of raised field platforms close enough in proximity to prevent new fields being built between existing fields. Isolated fields (more than 40 m from the nearest raised field) are uncommon and most raised fields are found in neighborhoods as well as oriented groups (see [
38]). Individual raised field platforms could have been constructed by community work parties and the size of an oriented group is comparable to the food requirements of the work party needed to construct the field. In this sense a neighborhood represents a level of organization one step above that of the oriented groups and raised field platforms. Fields may not all have been constructed in one event or a planned sequence of events but represent some level of cooperation among the same community of individuals investing in the landscape.
2.2.2. Archipelagos
Archipelagos are defined here as any area of the landscape with strong associations to seasonal streams, small raised field neighborhoods and small forest islands (≤0.8 ha). Seasonal streams run from the permanent flowing rivers out into the more remote areas of the savanna. Walker [
5] describes groups of small forest islands with associated raised field neighborhoods strung along these streams both close to the permanent rivers as well as further out in the savanna. Archipelagos are interpreted from a combined landscape suitability map representing each portion of the landscape rated on its combined distance to the nearest seasonal stream, small forest island, and small raised field neighborhood combined.
2.2.3. Agropolises
Agropolises are defined as any area of the landscape with strong associations to large forest islands, large concentrations of raised field neighborhoods and one of the permanent flowing rivers or the Quinato wetland. Strong associations have been noted between large forest islands and large concentrations of raised field neighborhoods [
5]. These landscapes were mapped using a combined landscape suitability map representing each portion of the landscape rated on its combined distance to the nearest large forest island, large, raised field neighborhood, and permanent river or major wetland. Agropolises represent areas of the landscape where the greatest variety of tasks intersect together in one location on the landscape.
2.2.4. Buffers
Buffers are defined as any area of the landscape that lacks a strong association with either raised field neighborhoods or forest island landscape features. These landscape units are interpreted from a combined landscape suitability map representing each portion of the landscape rated on its combined distance to the nearest forest island as well as raised field neighborhoods.
Landscape units have the potential of revealing patterns within their individual distribution as well as in their distribution in relation to one another. Walker [
5] discusses the possibility of a more seasonal view of large habitation sites. Seasonal networks of streams can temporarily link isolated chains of small forest islands up to the larger river network. As the dry season sets in, these locations become isolated rather than connected to the main river and must be traveled to by foot. The four maps of landscape units will be compared to one another to further demonstrate patterns in the regional distribution of farming communities.
3. Results
The 4 maps of analytical units created in this project are shown in
Figure 5. Based on a 40 m proximity rule, 44,224 individual raised field platforms were organized into 4444 individual raised field Neighborhoods (
Figure 3). The neighborhoods have a combined total platform surface area of 120.3 km
2. This figure represents only the elevated surfaces of the raised fields. If the areas within 20 m of the platforms are also taken into account, then the area of the landscape associated with raised field farming increases to 387.8 km
2. The average distance between two field platforms is 20 m and represents the canals surrounding the platforms. The average size of a neighborhood by platform total surface area is 27,065 m
2 (2.7 ha) +/− 142,402 m
2 (
Table 1).
Smaller Neighborhoods (<26 individual field platforms) are most commonly found within less than 200 m of another small neighborhood unit. Neighborhoods are found throughout the entire study area and can be found at any distance up to 20 km from the permanent rivers. While small neighborhoods can be found as far as 7500 m from a forest island, no large neighborhoods were found more than 2500 m from a forest island.
A total of 1940 forest islands were mapped in west central Mojos. Forest islands have a total combined area of 8786 ha (87.86 km
2) of forest within the 10,281 km
2 study area. When examining the entire population of forest islands, the average size of a forest island is 4.5 +/− 13.6 ha (
Table 2). Forest islands range in size from 0.0179 to 318 ha. Of the 1940 forest islands, 1558 are less than 4.84 ha in size.
Three trends in the distribution of forest islands are visible. The first is a band of forest islands stretching from the western extent of the Omi through the Quinato wetlands and continuing northeast roughly midway between the Omi and Yacuma rivers. The second is a band of forest islands along the northern portion of the study area near a stagnant river or wetland known as the Río Tapado. This area appears similar in characteristics to the Quinato wetlands regarding the appearance of a large, abandoned paleo river channel and the intersection of what appears to be many abandoned levees (covered with raised fields) and permanent wetlands. The third area is that of the Iruyañez river, which is the only river in the study with forest islands greater than 26.2 ha in area distributed along its banks.
The average distance between forest islands is relatively small when considering the entire population (546 +/− 686 m on average). This value increases when measuring the distance between forest islands of larger sizes with other forest islands of the same size. For instance, the average distance between islands between 26.2 and 66.6 ha jumps to 4795 +/− 6203 m. Large forest islands appear to be more dispersed than the smaller forest islands. However, they are still visible in three bands or chains. Within the bands themselves the average distance between large forest islands is much lower along the Quinto wetland. When forest islands larger than 26.2 ha within 2 km of the Quinato wetland are singled out, the average distance between forests drops to 1660 +/− 1544 m. When the forest islands larger than 26.2 ha and within 2 km of the Iruyañez are selected for analysis, the average distance between forest islands increases to 10,750 +/− 1559 m. The average distance from the largest forest islands (>26.2 ha) to the nearest forest island of any size is 588.7 +/− 953.3 m. While large forest islands are dispersed from each other, they still have smaller islands scattered about in closer proximity. Large forest islands along the Quinato are clustered more tightly together than large forest islands along the Iruyañez river.
The average distance between a forest island and the nearest river is 7878 +/− 7188 m. This measurement remains relatively consistent for all different size-ranks of forest islands. Both large and small forest islands can be found directly adjacent to the river as well as far off in the Savanna at the midpoints between the rivers.
Forest islands that were not the closest forest island to a neighborhood are not necessarily completely unassociated with raised fields. In many instances raised field platforms are in close proximity to several forest islands. Some forests are at great distances from raised field platforms. However, this is to be expected given the definition of WCM which includes up to 10 km of the area surrounding the raised fields themselves.
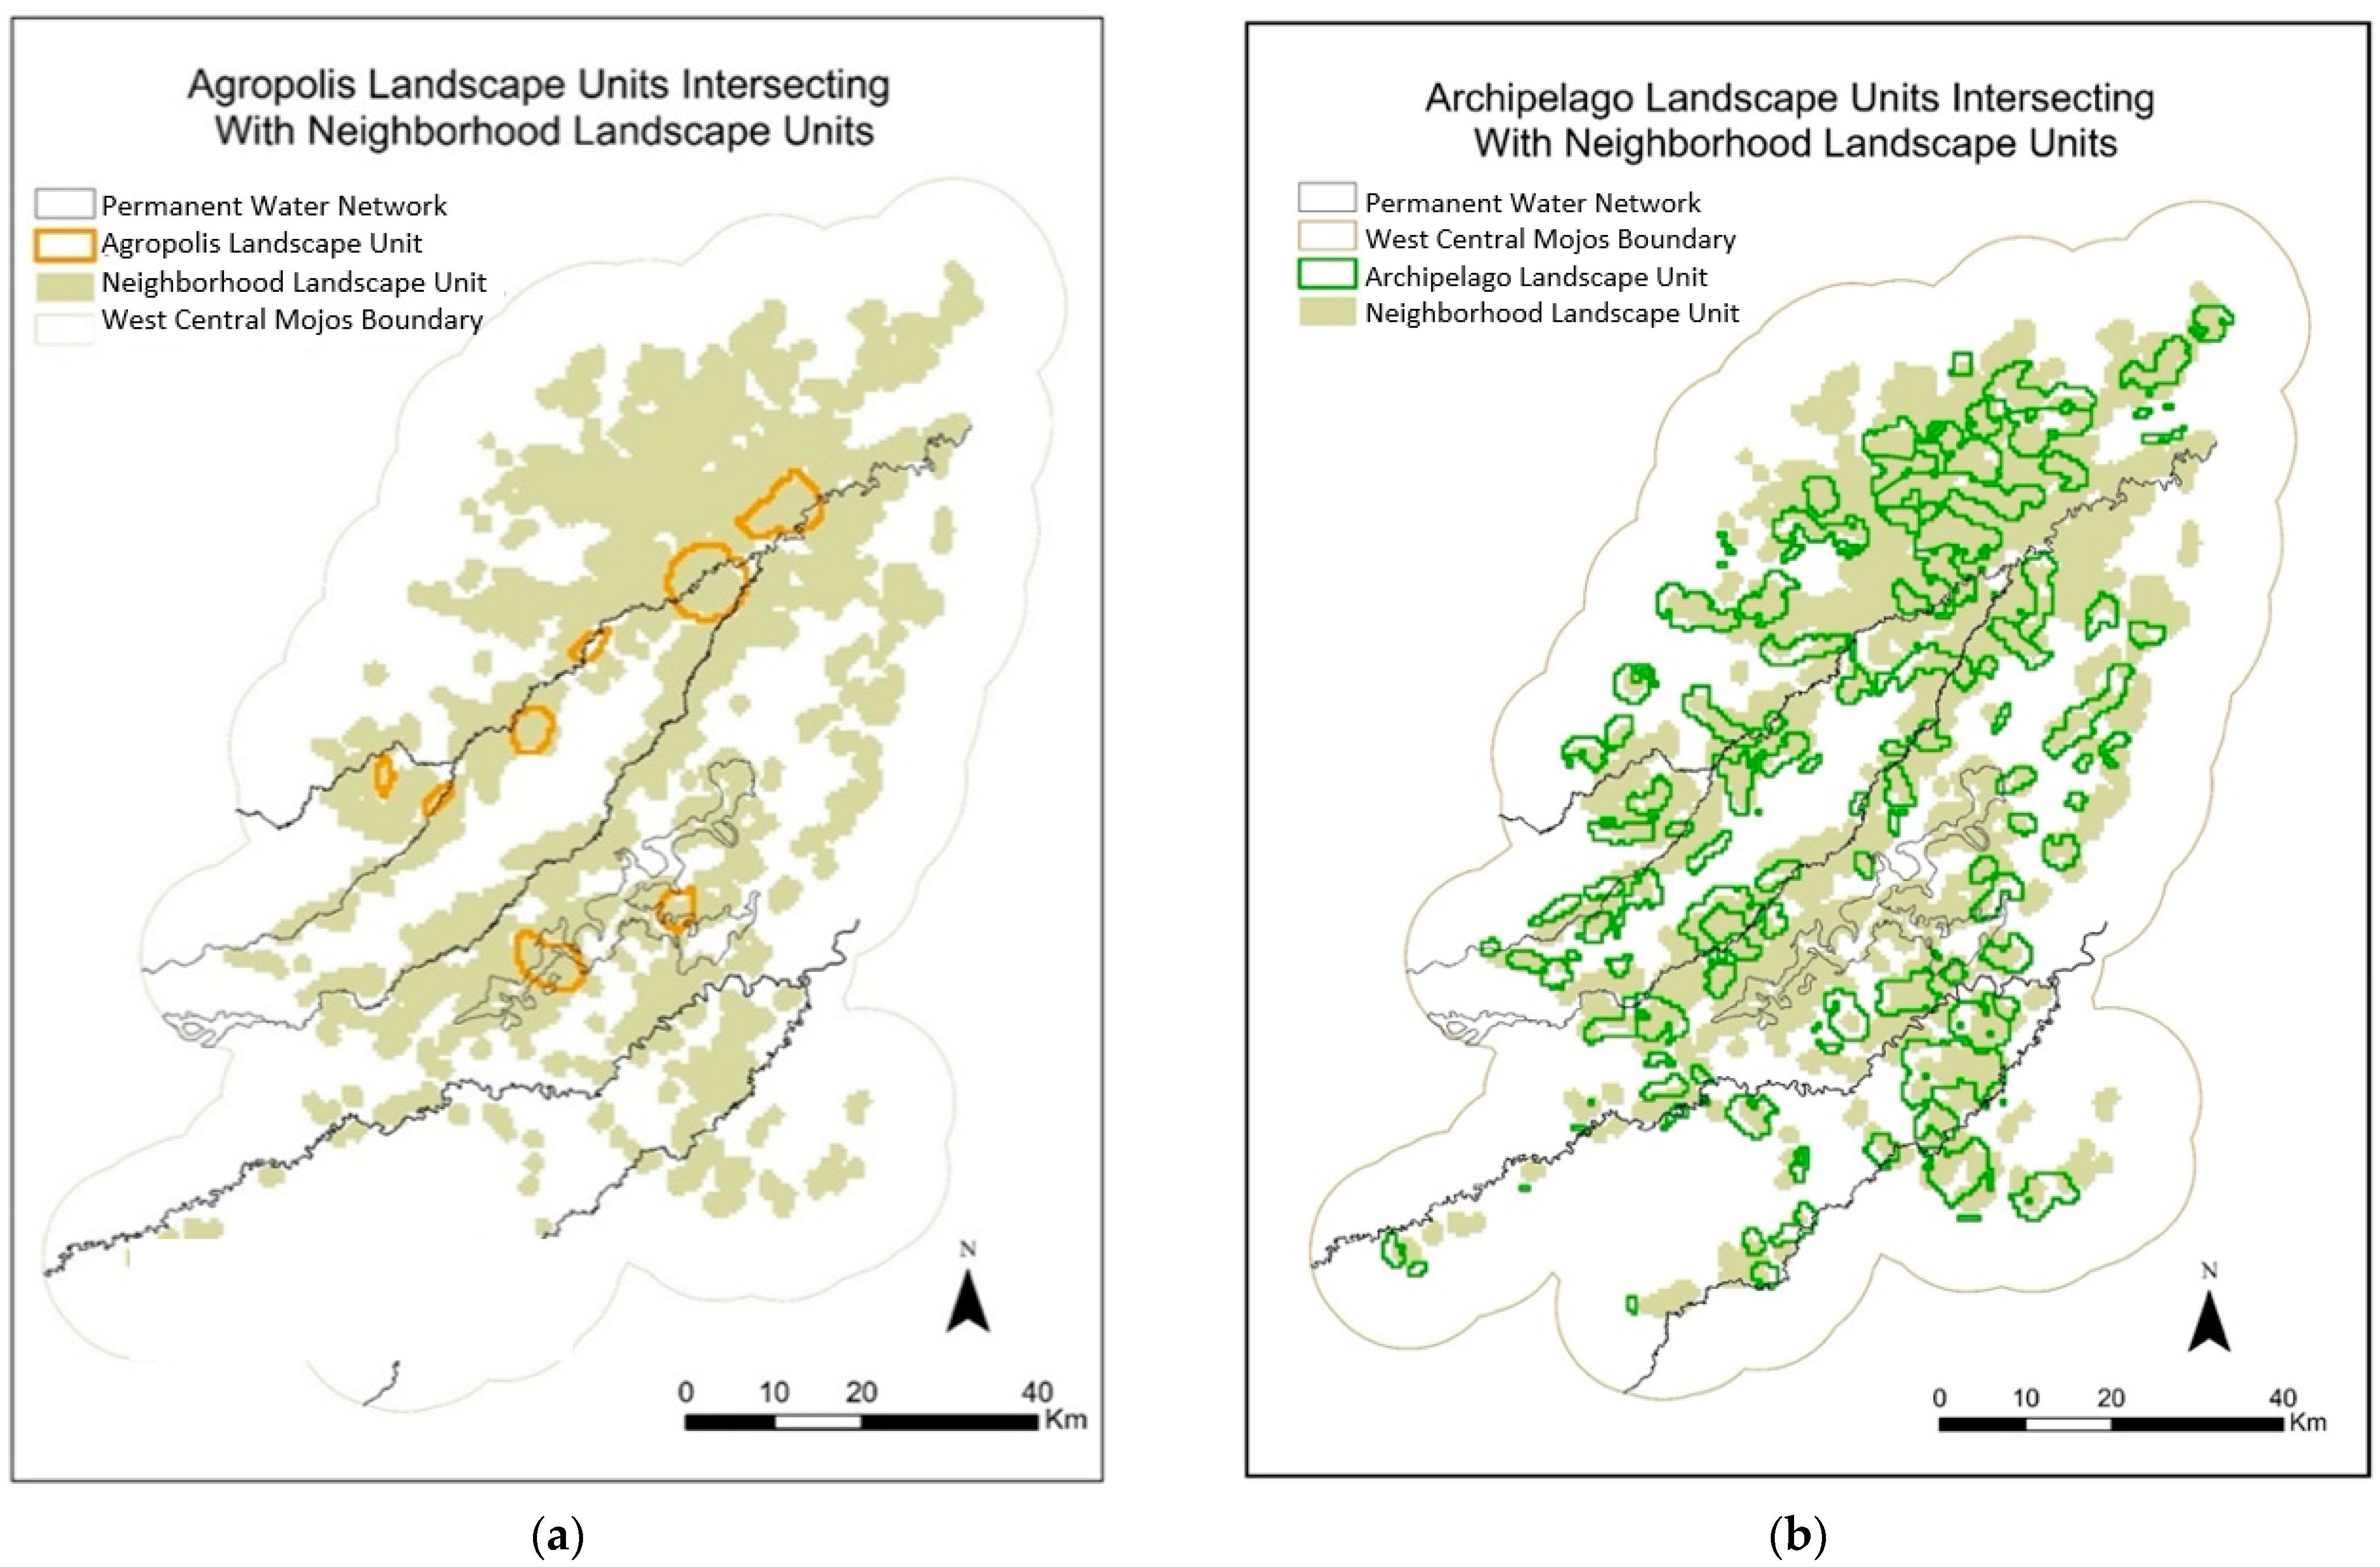
All forest islands were sorted into one of three groups. The smallest forest islands were used to identify archipelago landscape units (
Figure 6). The largest forest islands were used to identify agropolis landscape units. All forests that are too large for the Archipelago units and too small for the agropolis units are part of a third unclassified group (
Table 3). Archipelago forest islands are less than or equal to 0.8 ha in size. Of all the forest islands in the study area, 37% fit the criteria for an archipelago landscape unit by island count. Only 3% fit the criteria for an agropolis landscape unit by count. However, this 3% represents 38.3% of all forest island surface area in WCM. Approx. 60% of all forest islands were unclassified as they did not meet the criteria for either archipelago or agropolis. These unclassified forest islands are spread throughout the entire study area and overlap with archipelago and agropolis regions. It is interesting to note that of the 1145 forest islands not associated with either archipelago or agropolis landscape units, 536 were also identified as the closest forest island to a raised field neighborhood. This category of forest islands merits further archaeological research and remote sensing analysis.
Of the 1940 forest islands in the study, 735 met the size criteria for an archipelago landscape unit. Archipelago forests are found both along the four primary rivers as well as scattered across the surrounding savanna and continue outside the designated study area for this project. Several hundred small forest islands are found in chains along major streams that are not associated directly with raised field neighborhoods. However, archipelago landscape units in this project only included forests in combination with small raised field neighborhoods (platform count < 97).
After associating each of the chosen constellations of features with the surrounding landscape, a total of 1368 km
2 of archipelago landscape units were identified. This represents 13.3% of the total study area (
Table 4). A total of 109 individual archipelago landscapes were defined (
Figure 6). The average size of an archipelago is 12.4 +/− 11.9 km
2. archipelago landscape units contain on average 318,999 +/− 631,426m
2 of raised field platform surface area. This is significantly less than the agropolises with more than 2 square kilometers per unit (
Table 5). Within archipelagos, farmers did not travel any further to tend their fields than they would within agropolises. However, neighborhoods within archipelago landscapes can be more than 10 km from a permanent river. This demonstrates how archipelago landscapes can be located near the permanent rivers where they meet with smaller streams and are spread along these streams spanning out into the savanna.
Agropolises were defined as any area of the landscape meeting three sets of criteria: located within 4 km of a permanent flowing river or major wetland system, within 4 km of a large forest island greater than or equal to 26.4 ha in size, and within 2 km of a large raised field Neighborhood containing at least 96 or more raised field platforms. These portions of the landscape are those most strongly associated with intensive forms of agriculture, large permanent occupations, and trade or transportation over permanent river networks.
Of the 1940 forest islands, 60 fit the size criteria for an Agropolis. Of these 60, forest islands along the Tapado represent the only area containing a significant number of large forest islands that are found at several thousand km distance from either a permanent river or the Quinato wetland. Northeast of the Quinato a band of forest islands extend beyond the mapped boundary of the Quinato also. Only three forest islands large enough to be considered an agropolis can be found south of the Quinato. After applying the criteria of (2) proximity to a permanent river or the Quinato as well as (3) being in proximity of large raised field Neighborhoods; only seven large Agropolis forest islands met all three criteria.
Figure 7 shows the location of the most suitable agropolis landscape units surrounding the seven identified agropolis forest islands. Note that the two landscape units furthest west are associated with a single agropolis forest island and were combined and considered a single multi-part unit. The area separating the multi-part units is not necessarily unassociated with an agropolis. However, its level of association is decreased given the proximity based ranking system used by the project. This multi-part agropolis highlights the variety of tasks afforded by the landscape given its mosaic nature and the farmers’ level of mobility.
A total of 183 km
2 of agropolis landscape units were identified. The average size of an agropolis is 26.1 +/− 26.9 km
2. The average sum coverage of raised field neighborhoods within an agropolis is 2.1 +/− 2.7 km
2, nearly seven times that of the archipelago (
Table 5). Despite being comprised of significantly larger forest islands by definition, the agropolis landscape units have a lower ratio of forest island area to neighborhood area given how much larger Neighborhoods are within the agropolises. This is significant considering that the criteria for agropolis landscape units included buffers up to 4 km compared to just 2 km for archipelago units. More landscape and larger forests are included in the agropolis landscape units by definition. However, they still maintain a lower ratio of sum forest island area to sum neighborhood area given the exponential increase in the amount of Neighborhood surface area per landscape unit. The average size of an individual raised field platform within an agropolis is 3244 m
2 +/− 1216 (
Table 5). This is similar to that of the Archipelagos (3112 +/− 1709 m) and higher than the average for all 44,224 raised fields (2445 +/− 2014 m). Agropolises contain larger concentrations of fields. However, they do not contain larger individual platforms on average. Farmers in archipelago landscape units constructed platforms of the same size if not larger than those found in agropolis landscape units.
When examining the near distance between a forest island and its nearest neighborhood of raised fields, agropolis forest islands have a much shorter average walking distance than archipelago forest islands from forest to field (
Table 5). However, this does not take into account the fact that those neighborhoods may extend for more than a kilometer away from the Agropolis and require a greater amount of traveling to tend to fields.
Agropolises show a significant increase (22.7 to 72.7 ha) in the total area of forest island when compared to archipelagos. The average number of forest islands within the unit only increases from 8.1 to 9.8 between archipelagos and agropolises. However, the average size of an individual forest island increases from 2.7 to 13.2 ha as is expected. The ratio of average forest island area to raised field neighborhood area significantly drops from the archipelago to the agropolis landscape units also (1.0 to 0.2) indicating the increase in the surface area of raised field neighborhoods is much greater than that of the increase in available forest island area.
Table 6 lists each of the 7 agropolis landscape units and their individual statistics. agropolis landscape units 1, 2 and 7 (Cerro, San Juan and Miraflores), represent the largest and most continuous units identified, each being at least 3 times larger than the other units. These three landscape units are also distinguishable given their total number of intersecting raised field neighborhoods. However, these units are different from each other in several ways. Twice as much forest island area is found in Agropolis 7 (Miraflores) compared to that of Agropolis 1 (El Cerro), although Cerro is one of the largest forest islands in the dataset. Cerro has a greater average distance between itself and the nearest forest islands leaving it isolated relative to other forests, especially large forests. San Juan, though relatively close to Cerro, has 13 other forest islands in proximity, whereas Cerro only has one. The average distance between forest islands within the agropolis landscape units also shows a pattern of increased forest island proximity in the Miraflores region compared to Cerro and San Juan (
Table 7).
A significant difference between the agropolises along the Quinato and those along the Iruyañez is their increased distance from a permanent river (
Figure 7). Also as previously noted, the raised field Neighborhoods in these regions have different average sizes to their platforms. Raised field platforms in the Cerro Agropolis have an average size of 1541 +/− 1207 m
2 despite having neighborhoods with more than 100 fields per neighborhood. This is a clear difference from the San Juan Agropolis with an average platform size of 3827 +/− 3518 m
2.
When forest islands larger than 26.2 ha that are within 2 km of the Quinato wetland are singled out, the average distance between forests drops to 1660 m +/− 1544 m. When the forest islands larger than 26.2 ha and within 2 km of the Iruyañez are selected for analysis, the average distance between forest islands increases to 10,750 m +/− 1559 m. The average distance from the largest forest islands (>26.2 ha) to the nearest forest island of any size is 588.7 m +/− 953.3 m. While large forest islands are dispersed from each other, they still have smaller islands scattered about in closer proximity. Large forest islands along the Quinato are clustered more tightly together than large forest islands along the Iruyañez river.
4. Discussion
With the main activities of the landscape mapped into analytical units, the task becomes the identification of patterns which may reflect the socio spatial organization of west central Mojos (WCM) farmers. Shifting the scale of observation from individual field and forest island to the entire distribution of landscape features, suggests a strong relationship between agriculture and settlement and that the landscape has significant differences between its northern and southern parts.
4.1. Agriculture & Settlement
Small neighborhood landscape units are generally found within less than 300 m of another neighborhood as well as less than 1300 m from a forest island. Small neighborhoods maintain a strong relationship with each other and with forest islands throughout the entire region, with few exceptions. These patterned relationships indicate that levels of cooperation between farming communities were enhanced by the agricultural landscape.
There is also a correlation between agriculture and settlement when examining the large neighborhoods. While large neighborhoods were constructed at great distances from the river, they were not being constructed at great distances from forest islands. Large neighborhoods of raised fields are never more than 2 km from a forest island. While farmers may travel extended distances between forest islands and smaller neighborhoods of agricultural fields, they are not required to do so between forest islands and large neighborhoods.
Larger neighborhoods could be interpreted as having required more work parties coordinating field construction over a shorter period of time, or fewer work parties constructing fields over longer periods of time. The consistency of field sizes in large neighborhoods are less likely to be the result of a long period of slow field building given the lack of fluctuation in sizes of individual field platforms locally. Over time fluctuations in the populations of farmers could be expected to result in greater variability in the sizes of work parties and the resulting raised field surface constructed [
51]. The presence of large forest islands (>26.2 ha surface area) near large neighborhoods also suggests that farmers were more intensely dwelling on the landscape near these large neighborhoods rather than regularly traveling greater distances to reach them.
Larger communities of farmers, or greater numbers of communities, would have created more opportunities for interaction and building reciprocal relationships such as exchanging labor in work parties. It follows that as communities increase their proximity and level of cooperation, historical processes involving settlement and agriculture resulted in the presence of raised fields in the landscape encouraging the continued cooperation and development of more raised fields. This would explain the lower ratio of forest island to raised field surface area within agropolis units when compared to archipelago units. Larger neighborhoods show a seven-fold increase in size when located near a large forest island. However, the total surface area of forest islands surrounding the large neighborhoods of raised fields only shows a threefold increase in surface area. The scale of the benefits of large neighborhoods to biodiversity and ecosystem services likely increased with the size of a neighborhood, especially if any permanent to semi-permanent wetlands were created. For a variety of reasons, the presence of raised fields in the landscape may have encouraged the proliferation of more raised fields and their underlying ecological functions which supported habitation.
Forest islands represent the most suitable locations for habitation but make up less than 1% of the total landscape. As with neighborhoods, small forest islands are also more common across WCM with 80% of all forest islands being less than 4.6 ha in size. Lombardo et al. [
17] reports that conservatively at least 70% of forest islands in all of Mojos are anthropogenic and that artificial forest islands have an average size of 0.5 ha. However, this regional study does not attempt to quantify non-artificial forest, does not include any forests greater than 16 ha, and excludes many forest islands placed atop river levees and hidden amidst gallery forests. However, the results from WCM are consistent with those identified in the greater region regarding the general size and distribution of artificial islands. In WCM 78% of surveyed forest islands had ceramics on their surface and 91% had evidence of human activity such as burned earth or dark soils [
5,
41]. From the local to regional scale, the evidence suggests that forest islands are strongly associated with the habitation and subsistence activities of agricultural communities.
4.2. Regional Variation
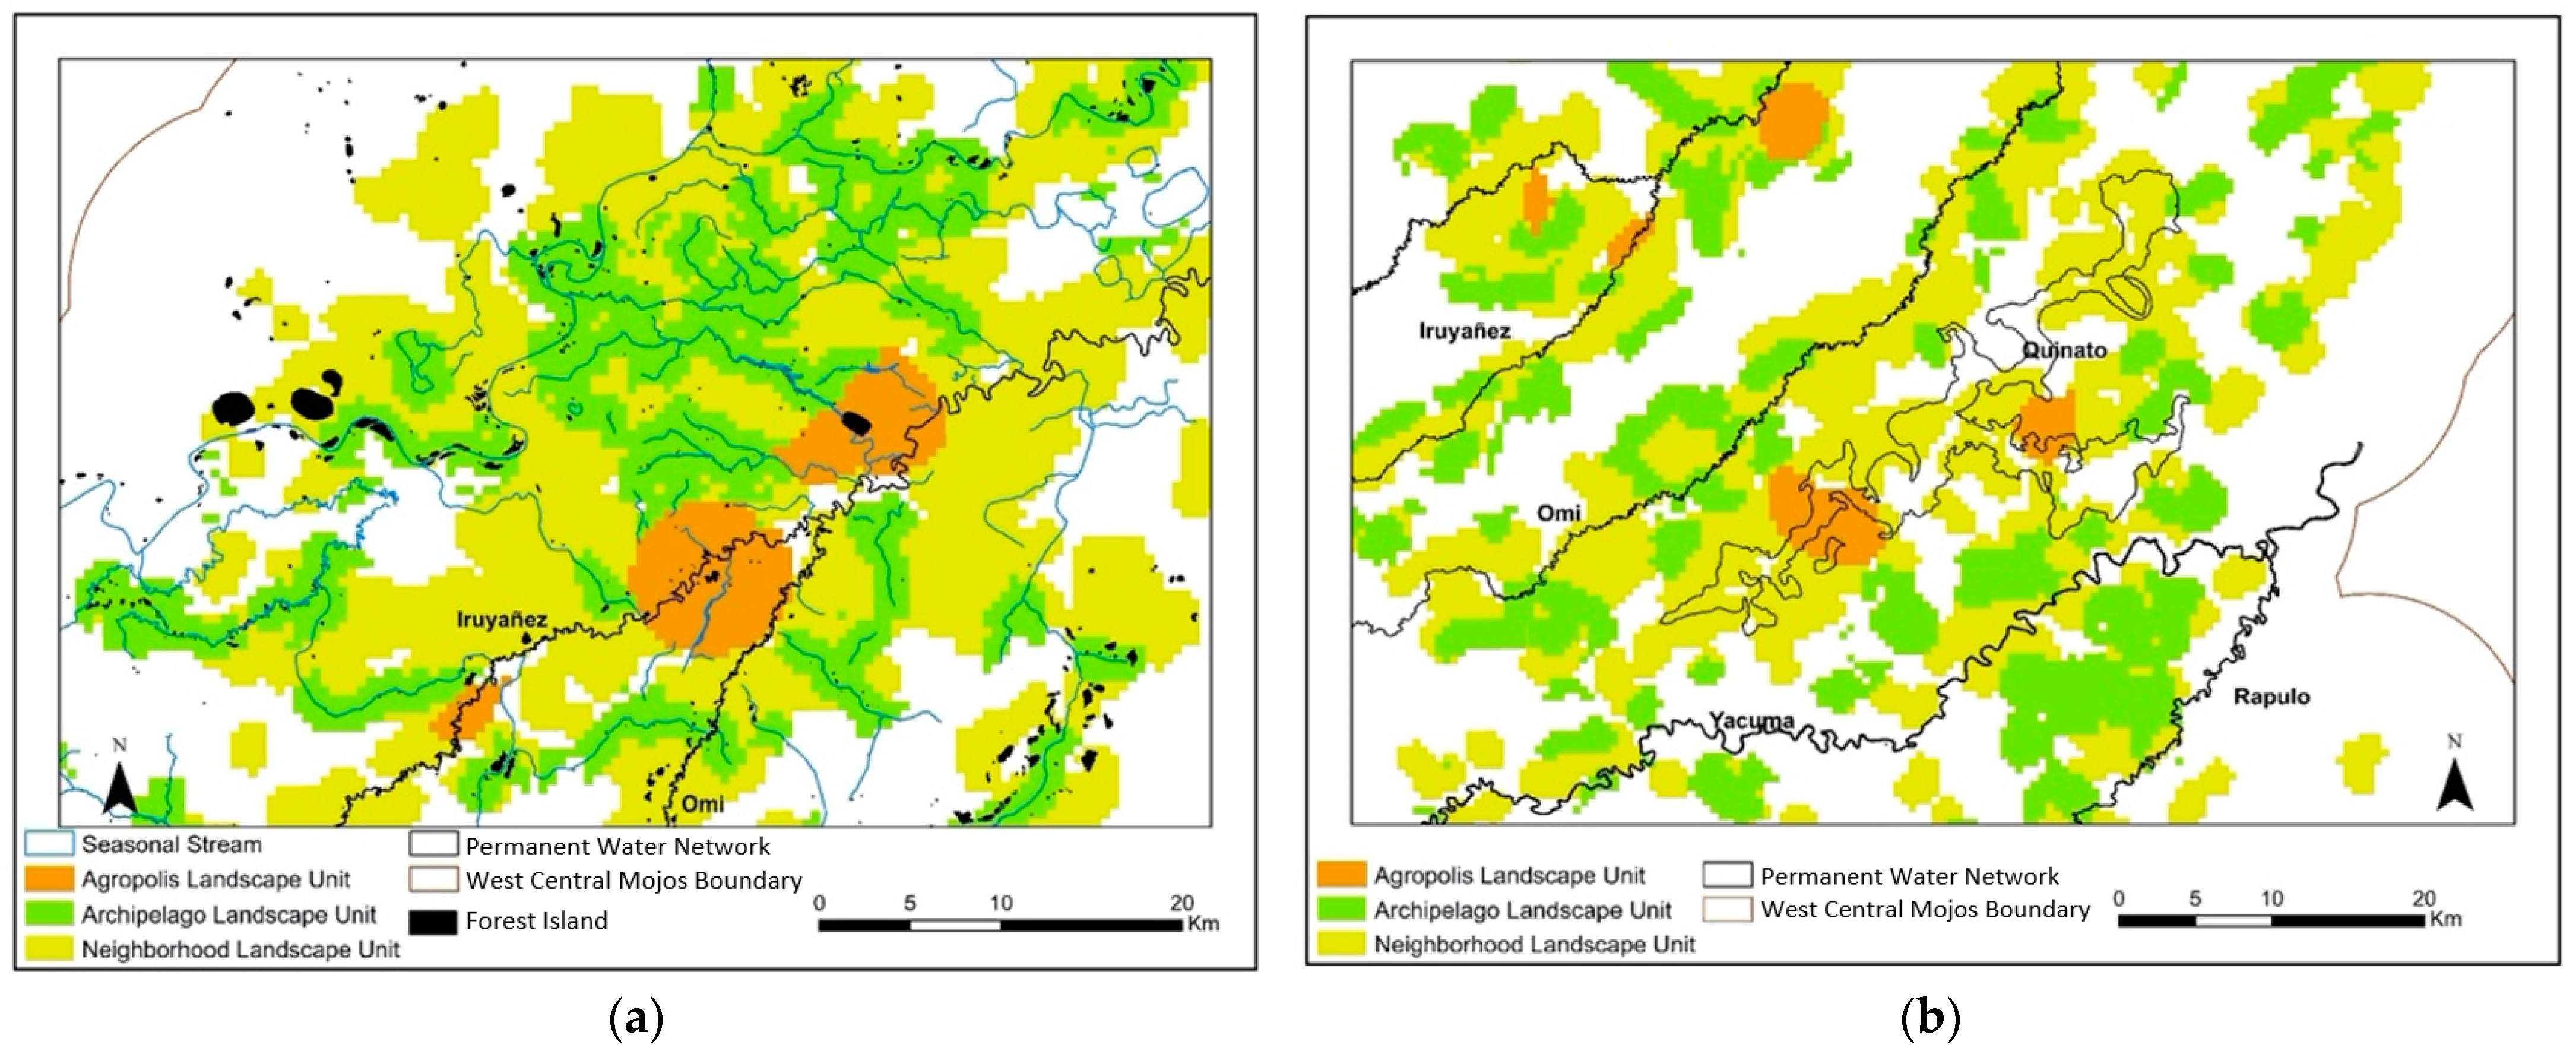
Two distinct settlement patterns are visible within WCM. Both patterns demonstrate an integration of remote savanna locations with permanent river networks. The first region is in the northern part of the study area and is highlighted by the arrangement of agropolises at intervals along the Iruyañez river. The second region is in the southern part of the study area and is highlighted by the arrangement of agropolises along the Quinato wetland (
Figure 8). These two regions, north and south, are similar in that they both incorporate large portions of the landscape by the organization of archipelagos and neighborhoods around a series of agropolises.
These northern and southern regions are, however, distinct from each other in seven observable ways:
The association of agropolis landscape units with either permanent river networks or remote savanna locations.
The varying extent of the distribution of neighborhoods of raised fields in relation to other landscape units.
The varying patterns in the average size of raised field platforms.
The varying patterns in the orientation of raised field platforms to cardinal directions.
The varying patterns in the distribution of large forest islands in relation to other large forest islands.
The known distribution of ring ditch earthworks.
The buffer or transitional zone separating the two regions.
1. The northern portion of the study area is crossed from southwest to northeast by the Iruyañez river. Along the Iruyañez river, agropolises are distributed entirely within 2 km of the riverbank. In each instance, agropolises intersect with Archipelagos which in turn extend several thousand meters out into the surrounding savanna (
Figure 8). Portions of the savanna separating the Iruyañez and Omi rivers are spanned completely by archipelagos and neighborhoods facilitating interactions between the two rivers. In the north, agropolis landscape units are river centered.
Along the Quinato wetland to the south, another region is highlighted incorporating the portions of the landscapes between the rivers. Agropolises along the Quinato are several thousand meters from both the Omi and Yacuma rivers (
Figure 8). In the southern region, agropolises are still surrounded by a network of Archipelago and Neighborhood Landscape Units, just as they were in the north along the Iruyañez. By associating agropolises, archipelagos and neighborhoods; connections may be made between areas along the upper Omi with areas along the Yacuma even though these two rivers never merge. As in the north, two drainage systems are connected by a built environment. However, in the south, Agropolis landscape units are encountered in the savanna far from the permanent rivers.
2. These northern and southern regions are also distinguishable from each other based on the geographic extent of the neighborhoods they contain. Raised field neighborhoods are much more extensive near the confluences of the Iruyañez and Omi Rivers with a near continuous distribution of fields extending out into the savannas to the north [
59,
60,
61]. Along the Iruyañez river, neighborhoods dominate the landscape spatially. Almost all Archipelagos are completely surrounded by neighborhoods. In this northern region farming related activities are taking place at greater distances from the Archipelagos and their established stream networks. In contrast, the neighborhoods in the southern region are in many cases entirely restricted to the regions identified as Archipelagos or Agropolises. In the southern region farmers were not traveling as far from water networks and small forest islands to construct and use raised field platforms. This pattern was not visible when measuring the entire distribution of landscape units and only appears at the intermediate scale within these two regions.
3. The northern and southern regions are distinguishable based on the average size of individual field platforms within each region. The largest Neighborhoods are concentrated near the intersection of the Iruyañez and Omi rivers in the northern region. However, the raised field platforms which comprise these large Neighborhoods contain some of the smallest field platforms on average (1541 +/− 1207 m). The largest raised field platforms are constructed in the southern region along the Quinato wetlands (5382 +/− 2635 m). It is unlikely that these smaller fields experienced any variability in erosion from location to location as they have similar topographies, elevations, and similar environmental conditions affecting general rates of erosion and deposition [
20].
4. Northern and southern regions are also distinguishable based on the organization of large forest islands within each region. Along the Iruyañez river to the north, large forest islands are spaced out along the banks of the river with an average of 10,750 +/− 1559 m separating them. In contrast, along the Quinato wetlands in the south; large forest islands are clustered closer together with an average distance of 1660 +/− 1544 m between islands. Large forest islands represent 695 ha of total forest spread along the banks of the Iruyañez. Large forest islands along the Quinato have a sum surface area of 866 ha. In an area half the size of that crossed by the Iruyañez river in the north, the Quinato wetland contains more large forest island area with increased clustering between the largest forest islands.
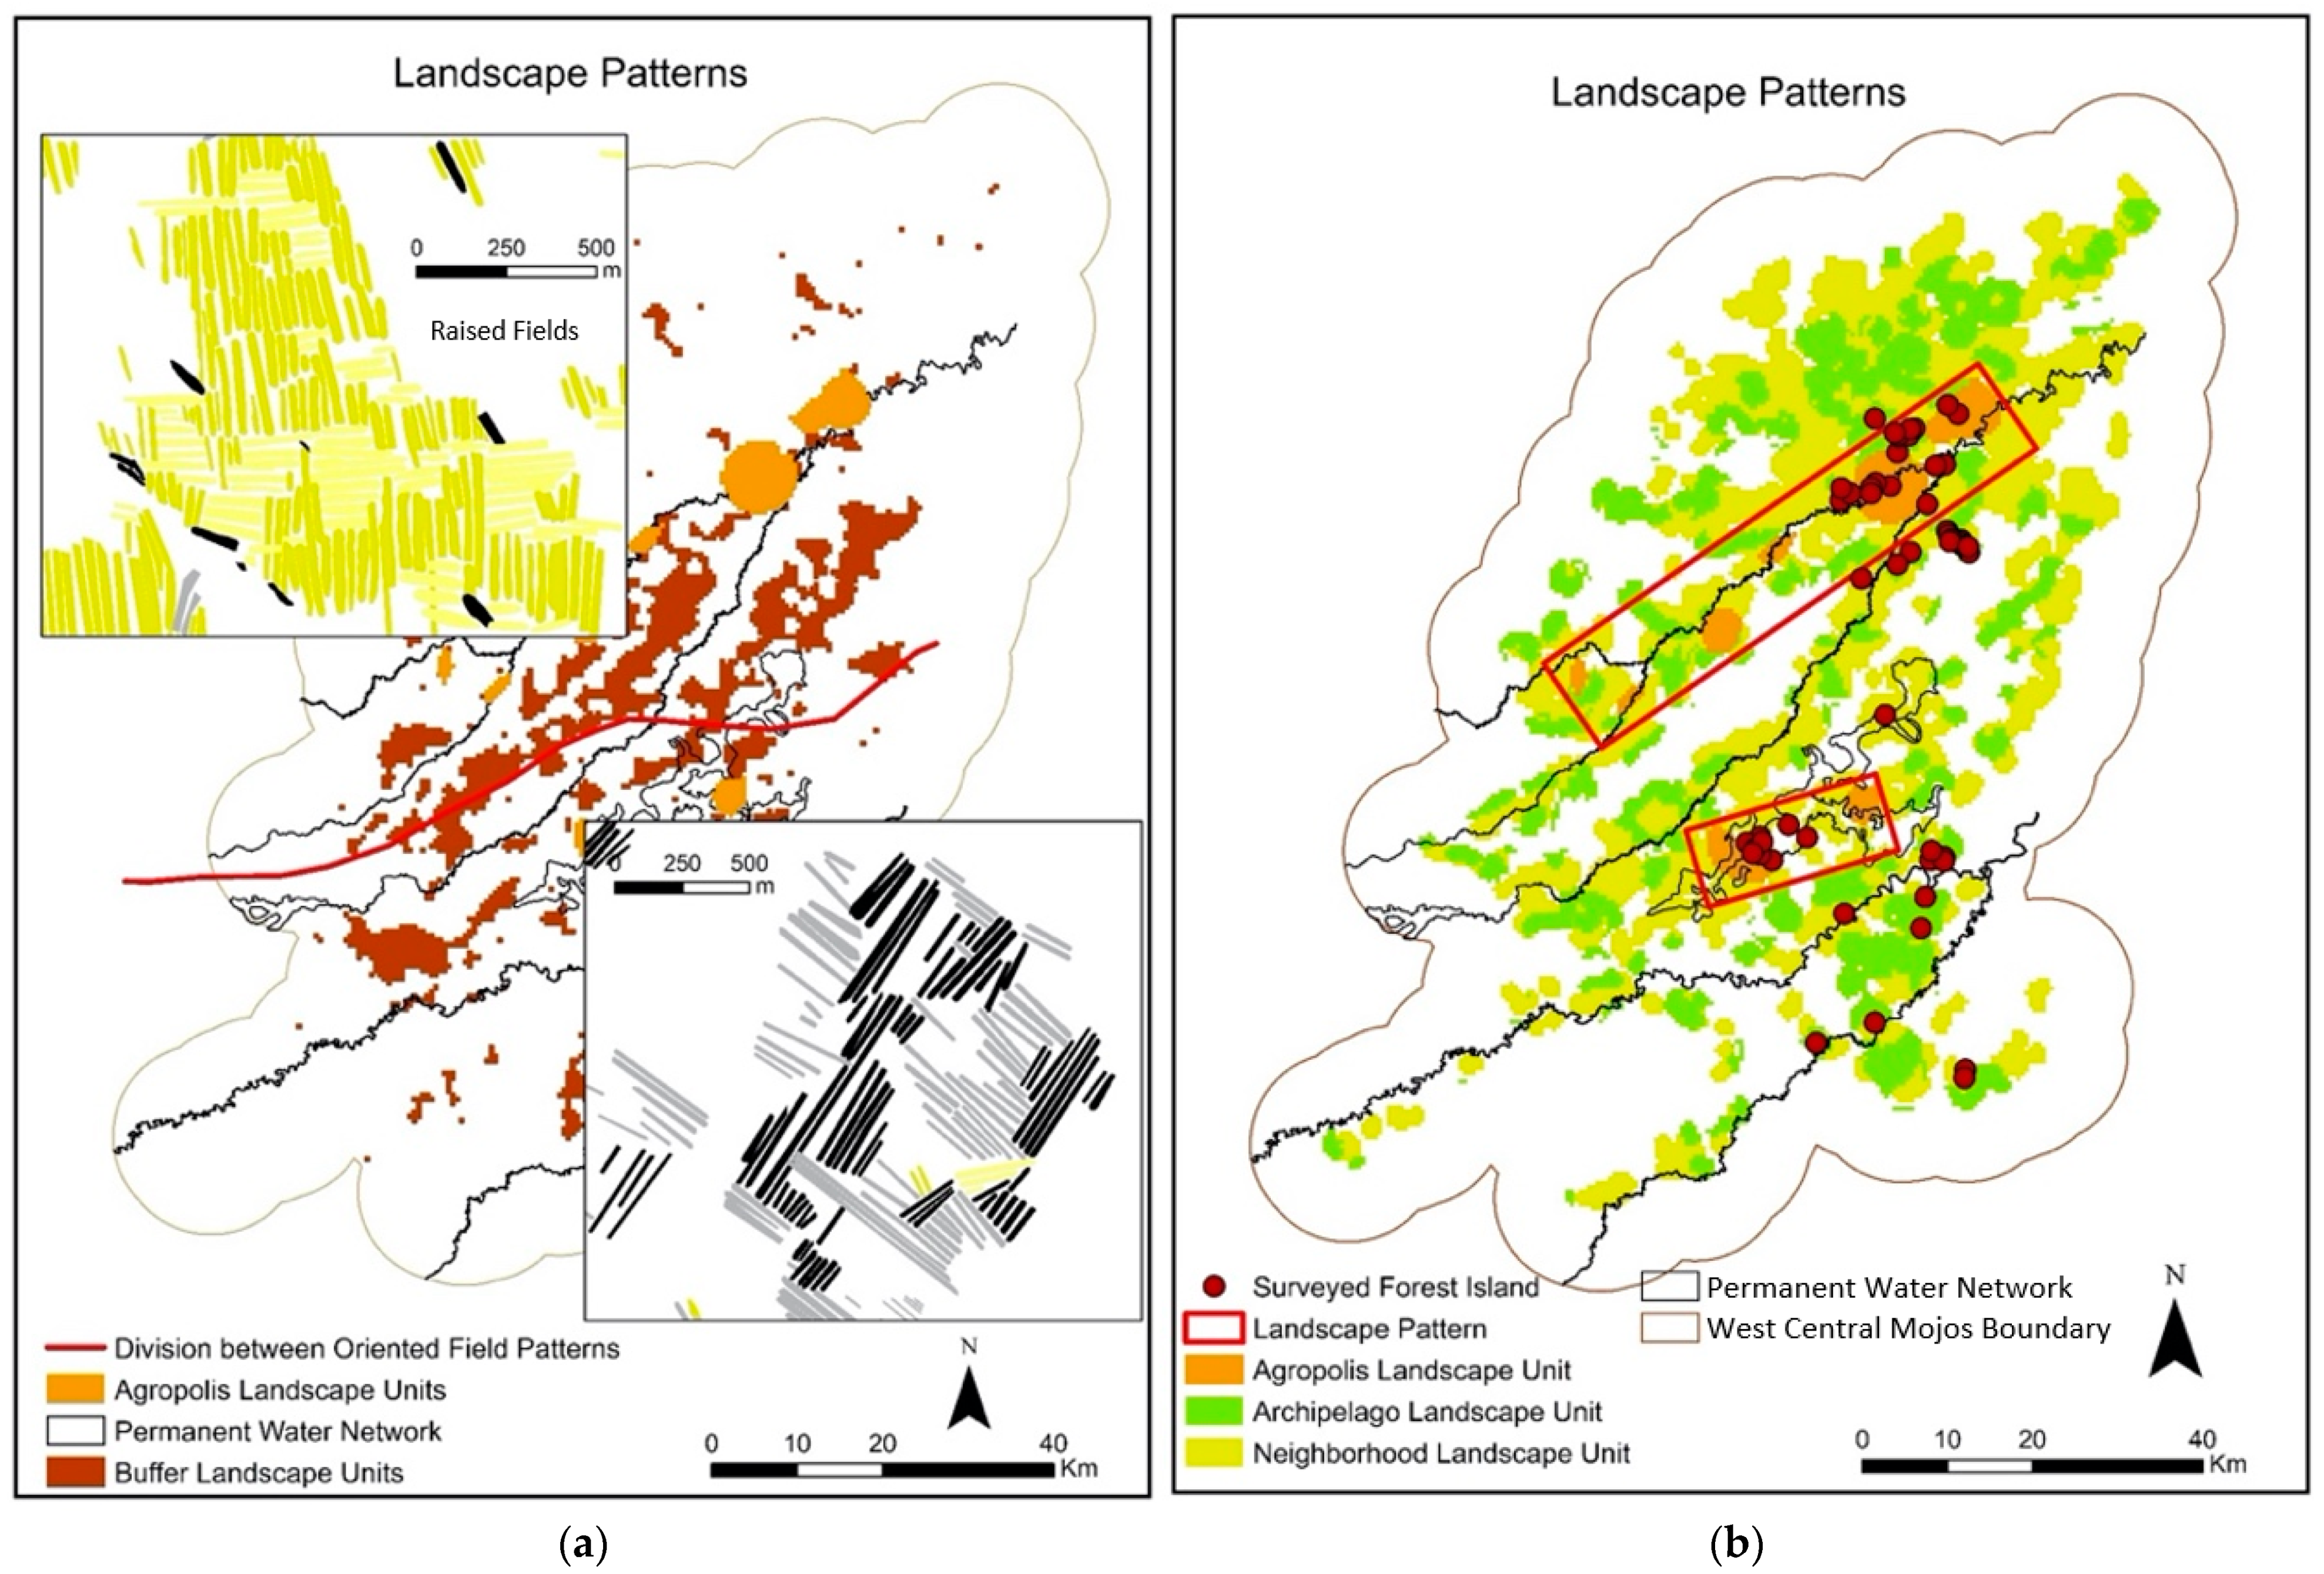
5. Lee [
59] documents a regional pattern in the orientation of raised field platforms to cardinal direction (
Figure 8). Based on this pattern, west central Mojos was divided into a northern and southern region with a distinct transition from one pattern of orientation to the other. The northern distribution of raised fields demonstrates a pattern of fields being oriented on a roughly north/south or east/west axis. Groups of raised fields are oriented at right angles to each other with one group having all its fields oriented on a north/south access and the adjacent field groups having all its fields oriented on an east/west axis. There is a clear 45-degree shift in this pattern in the southern portion of the region where fields are oriented on a southeast/northeast or southwest/northwest axis. This shift in regional pattern does not appear to follow any clear environmental gradient and is difficult to identify without a regional analysis [
5].
The northern and southern regions identified by Lee [
59] overlap with the northern and southern regions identified in this study. Neighborhoods along the Iruyañez river to the north are predominantly oriented on a north/south or east/west axis. Neighborhoods along the Quinato wetland to the south are predominantly oriented on a southeast/northeast or southwest/northwest axis. The transitional zone between these two oriented regions also overlaps with the transitional zone identified by this study and is discussed below.
6. The northern and southern regions identified here are also distinguishable based on the known distribution of ring ditches in west central Mojos. To date no ring ditches have been identified north of the Quinato wetland, however, ring ditches are present in the Quinato as well as eastern Mojos and other locations along the southern rim of Amazonia [
5,
44,
62]. Ring ditches in west central Mojos have been dated to just before the 16th century CE (Cal CE 1200–1500) [
5].
7. These two regions are also distinguishable based on the transitional zone between them. This transitional zone can be identified by the large concentration of Buffer Landscape Units that are surrounded on all sides by neighborhoods. This zone stands out from the surrounding neighborhoods, especially considering that the study area itself is defined by the presence of raised field neighborhoods. The Omi river which runs through the center of this transitional zone is clearly absent of any large forest islands though it does have a near continuous distribution of raised field platforms along its banks. A very narrow strip of buffer landscape units connects with the Omi river near the center of this transitional zone.
4.3. Wetland Domestication
While two distinct patterns are present in west central Mojos, it is important to note that these two patterns are not necessarily exclusive of one another. Their constituent landscapes are constructed from the same constellations of landscape features even if the analytical units are organized differently in relation to one another. The buffers that separate these two regions are crossed by chains of forest islands not associated with raised field Neighborhoods. Buffer landscapes become far less prominent when the mobility of a raised field farmer is pushed out beyond 2 km from a neighborhood or forest island. The term ‘buffer’ may be inappropriate for this central portion of the landscape as it implies an area of less activity and therefore less interaction between communities. Rather, these buffer landscape units at the center of west central Mojos may be better explained by a different set of land management tasks that may have been taking place.
The distribution of permanent fish weirs recently confirmed and analyzed in WCM (and extending beyond WCM) [
63] primarily overlaps with the lands between the Iruyañez and Yacuma rivers. This distribution could increase as more weirs are mapped and ground proofed, however, the current distribution consumes the transitional zone described here. Recent evidence that the communities of the Quinato were able to create permanent wetlands during periods of dryer regional climate [
16] also indicates that manipulating the ecology of aquatic ecosystems was a historical aspect of domesticating the WCM landscape. Archaeological fishponds and fish weirs have been documented in other parts of Mojos [
37]. More recently it has been suggested that the role of waterscapes and pre-Columbian peoples’ relationships with shaping aquatic environments warrants further research when considering domestication of Amazonian landscapes [
64].
Whatever the topic of future research, from continued Paleobotanical studies on landscape change, to aquatic resource management and AI mapping, it is imperative that west central Mojos be approached as a both social as well as natural system. Amazonia itself cannot be defined by patterns in vegetation and annual precipitation alone. Rather, Amazonia must be approached as a complex system with a long history of interaction between humans and ecological processes.


