
Severe Drought Monitoring by Remote Sensing Methods and Its Impact on Wetlands Birds Assemblages in Nuntași and Tuzla Lakes (Danube Delta Biosphere Reserve)


Abstract
:1. Introduction
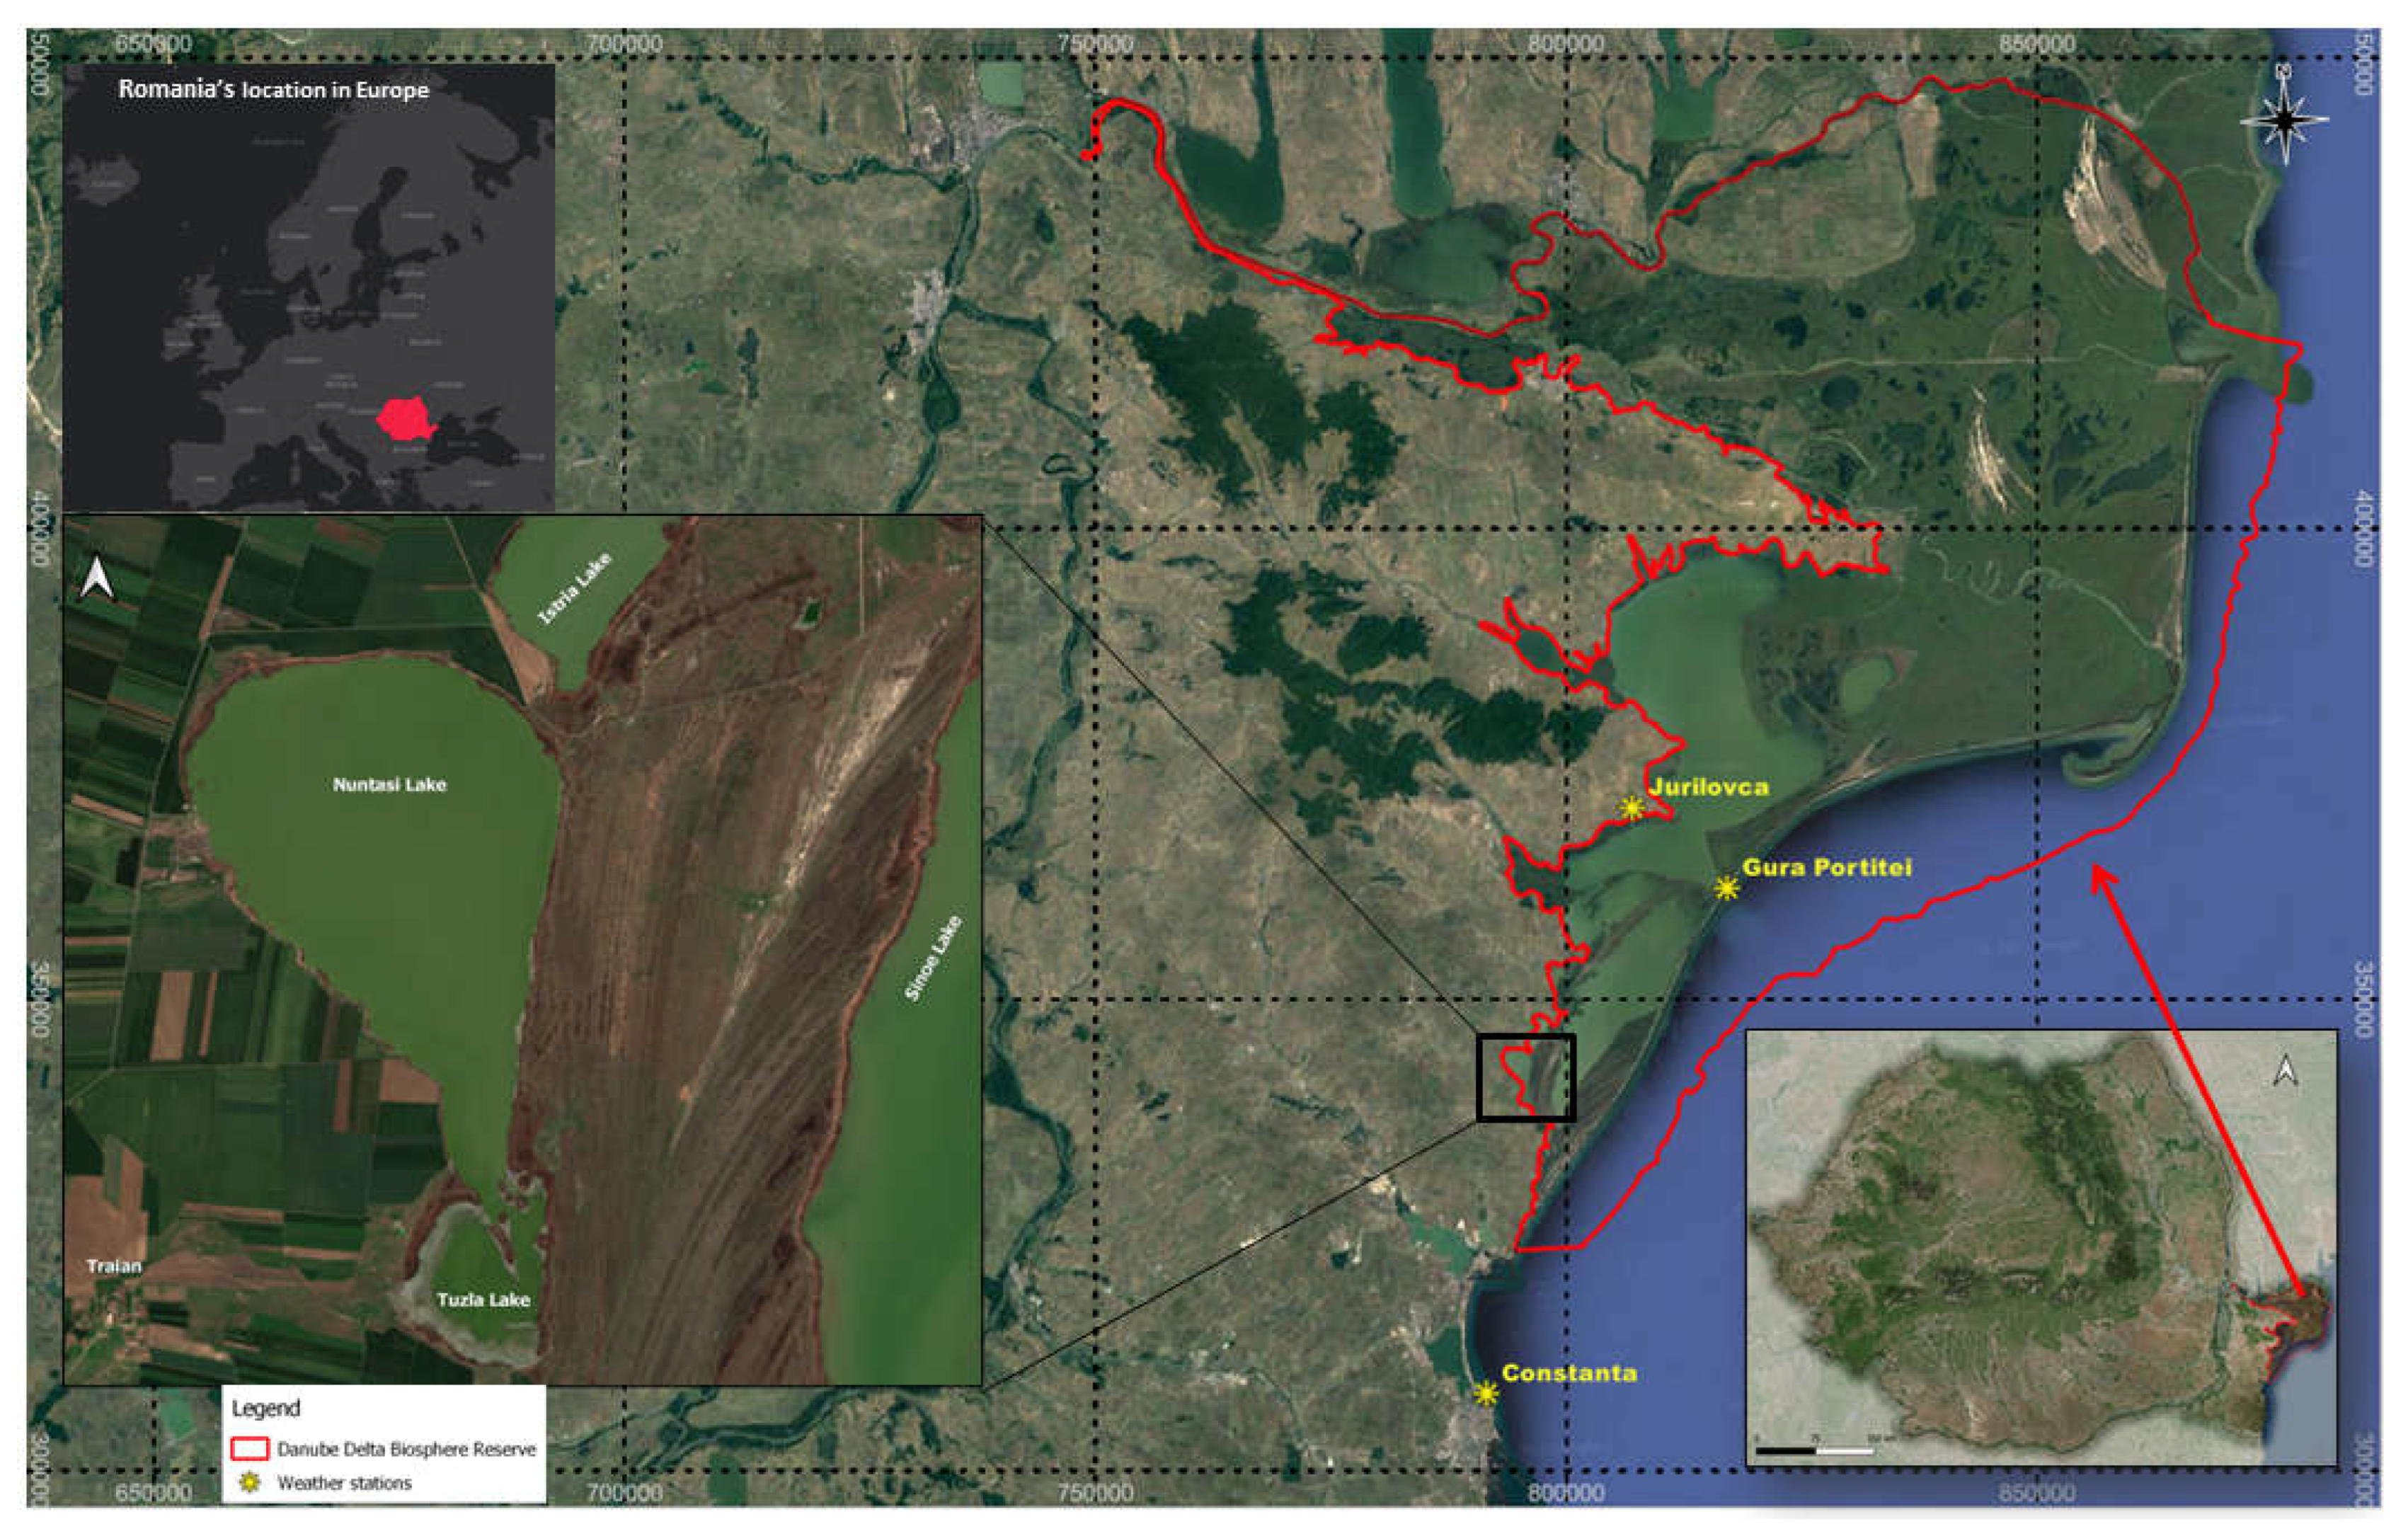
2. Study Area
3. Methodology
3.1. Bird Census
3.2. Climate Data
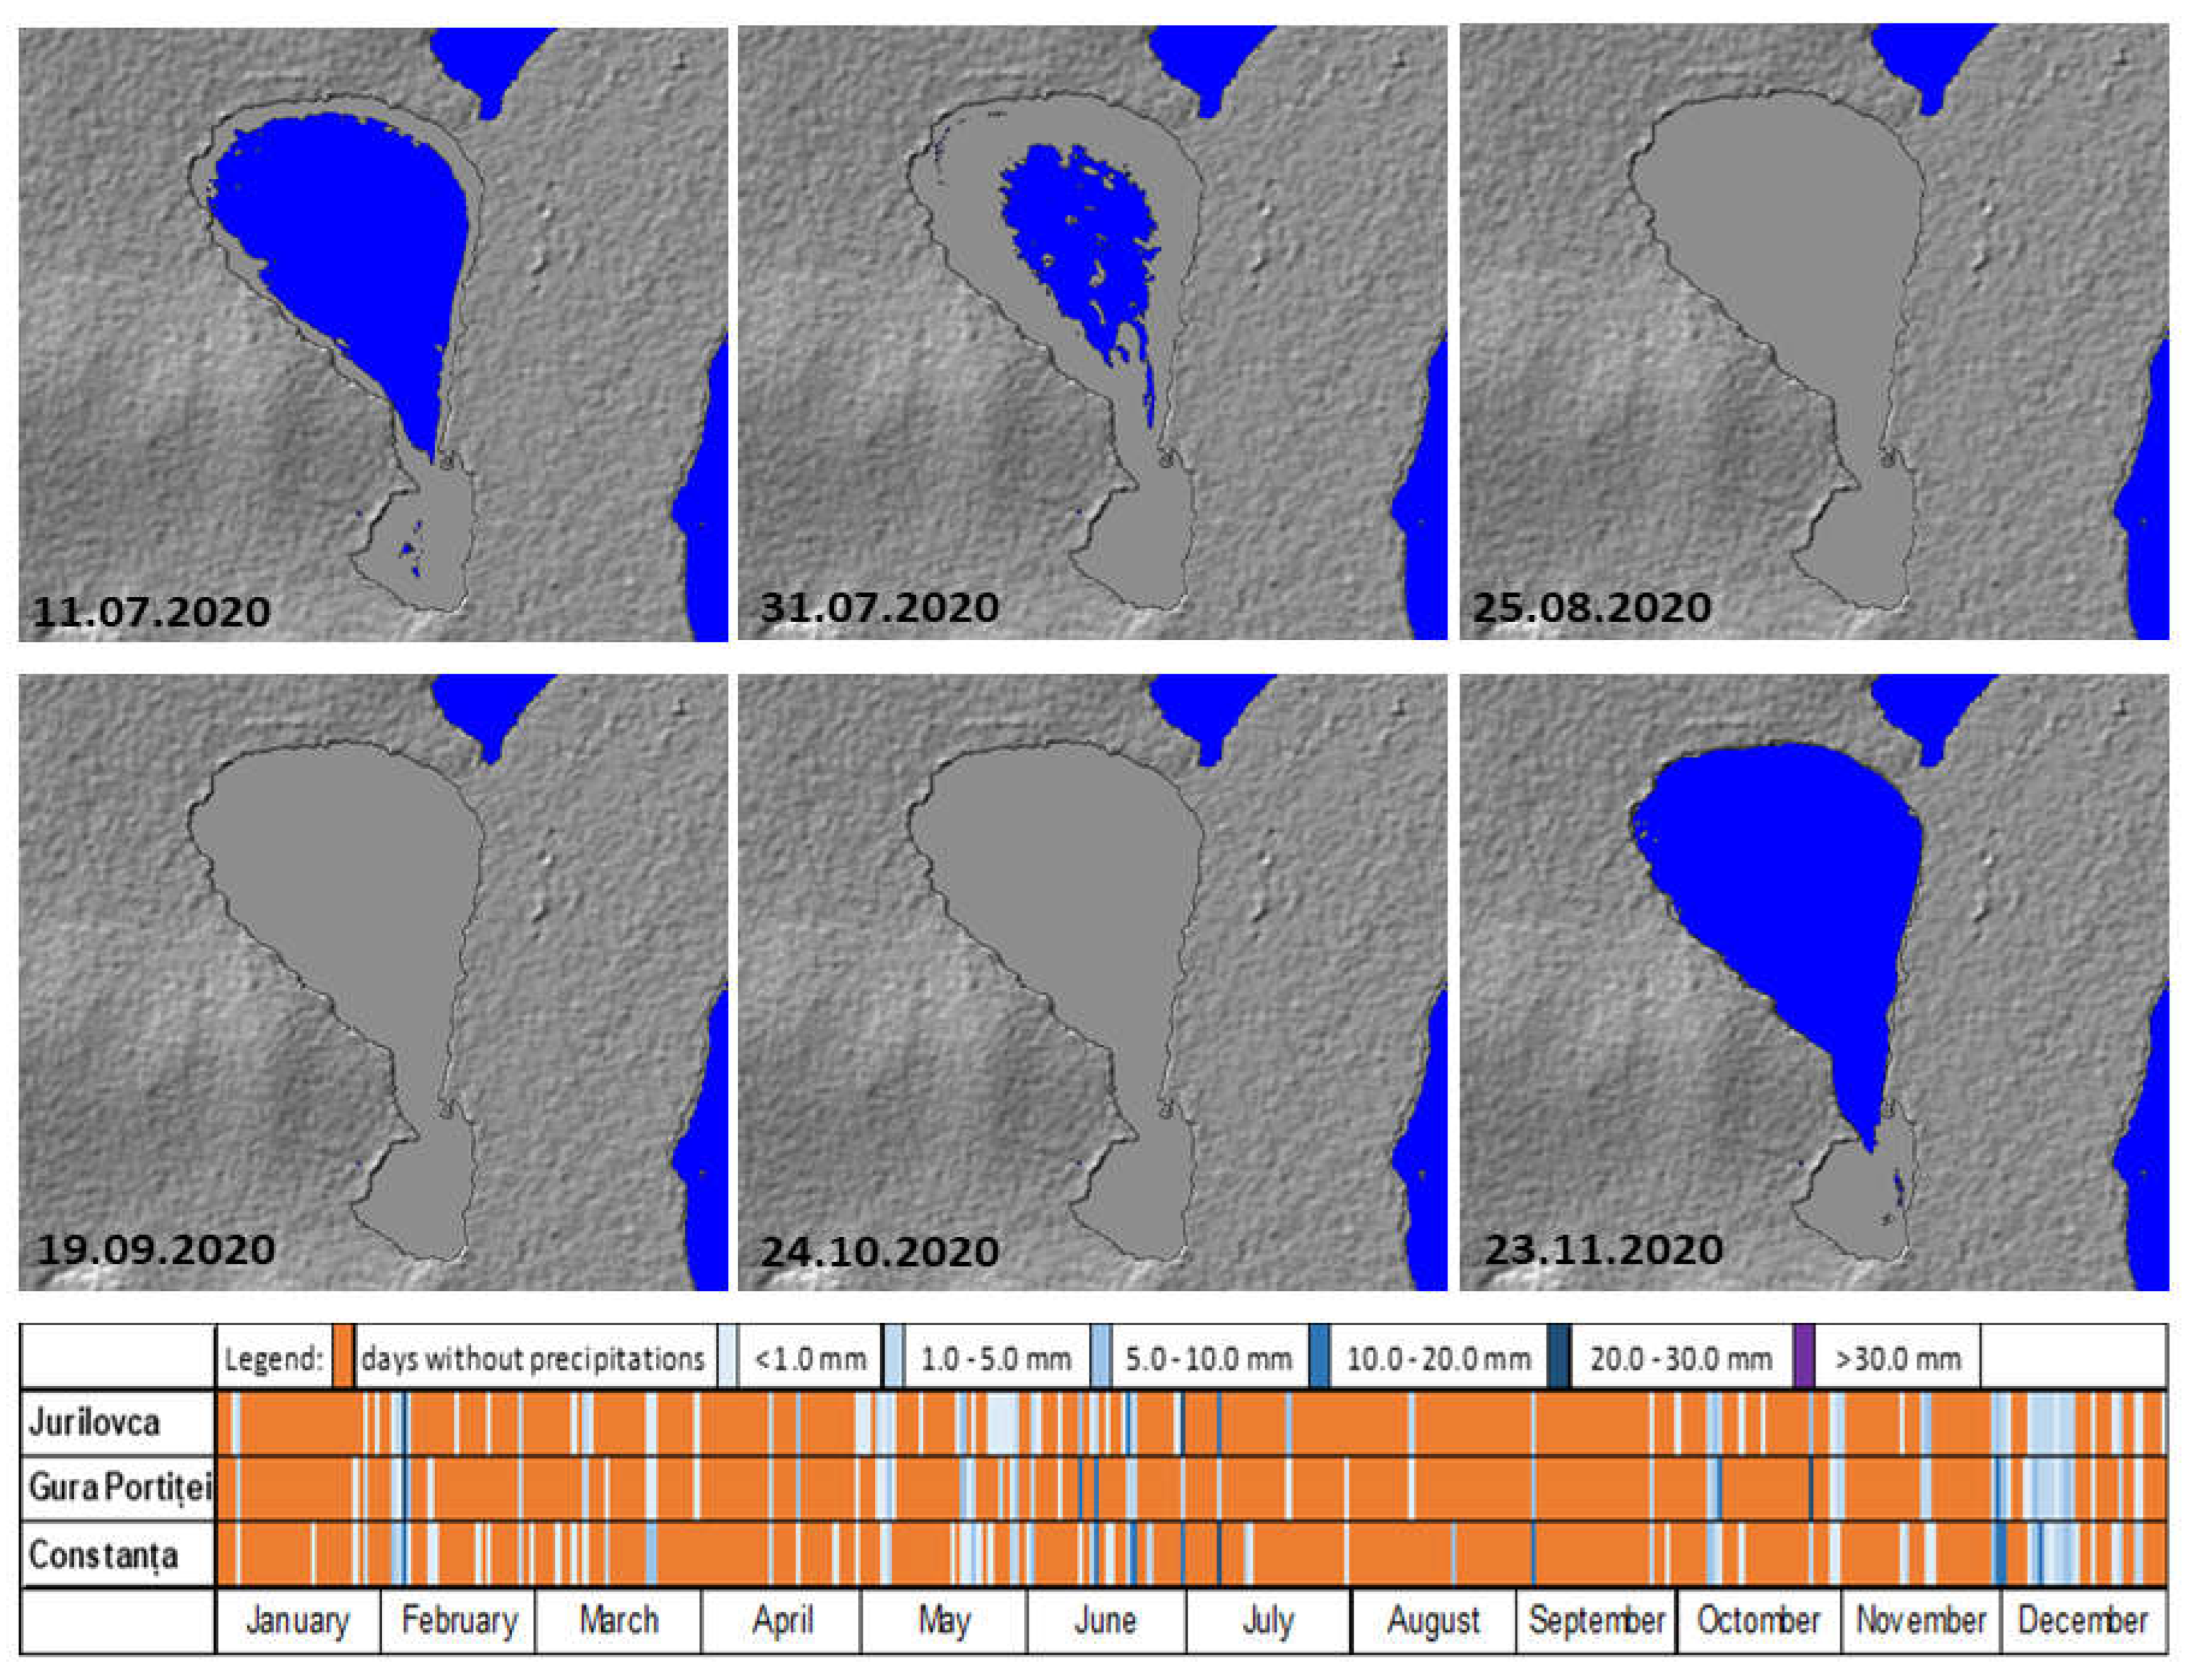
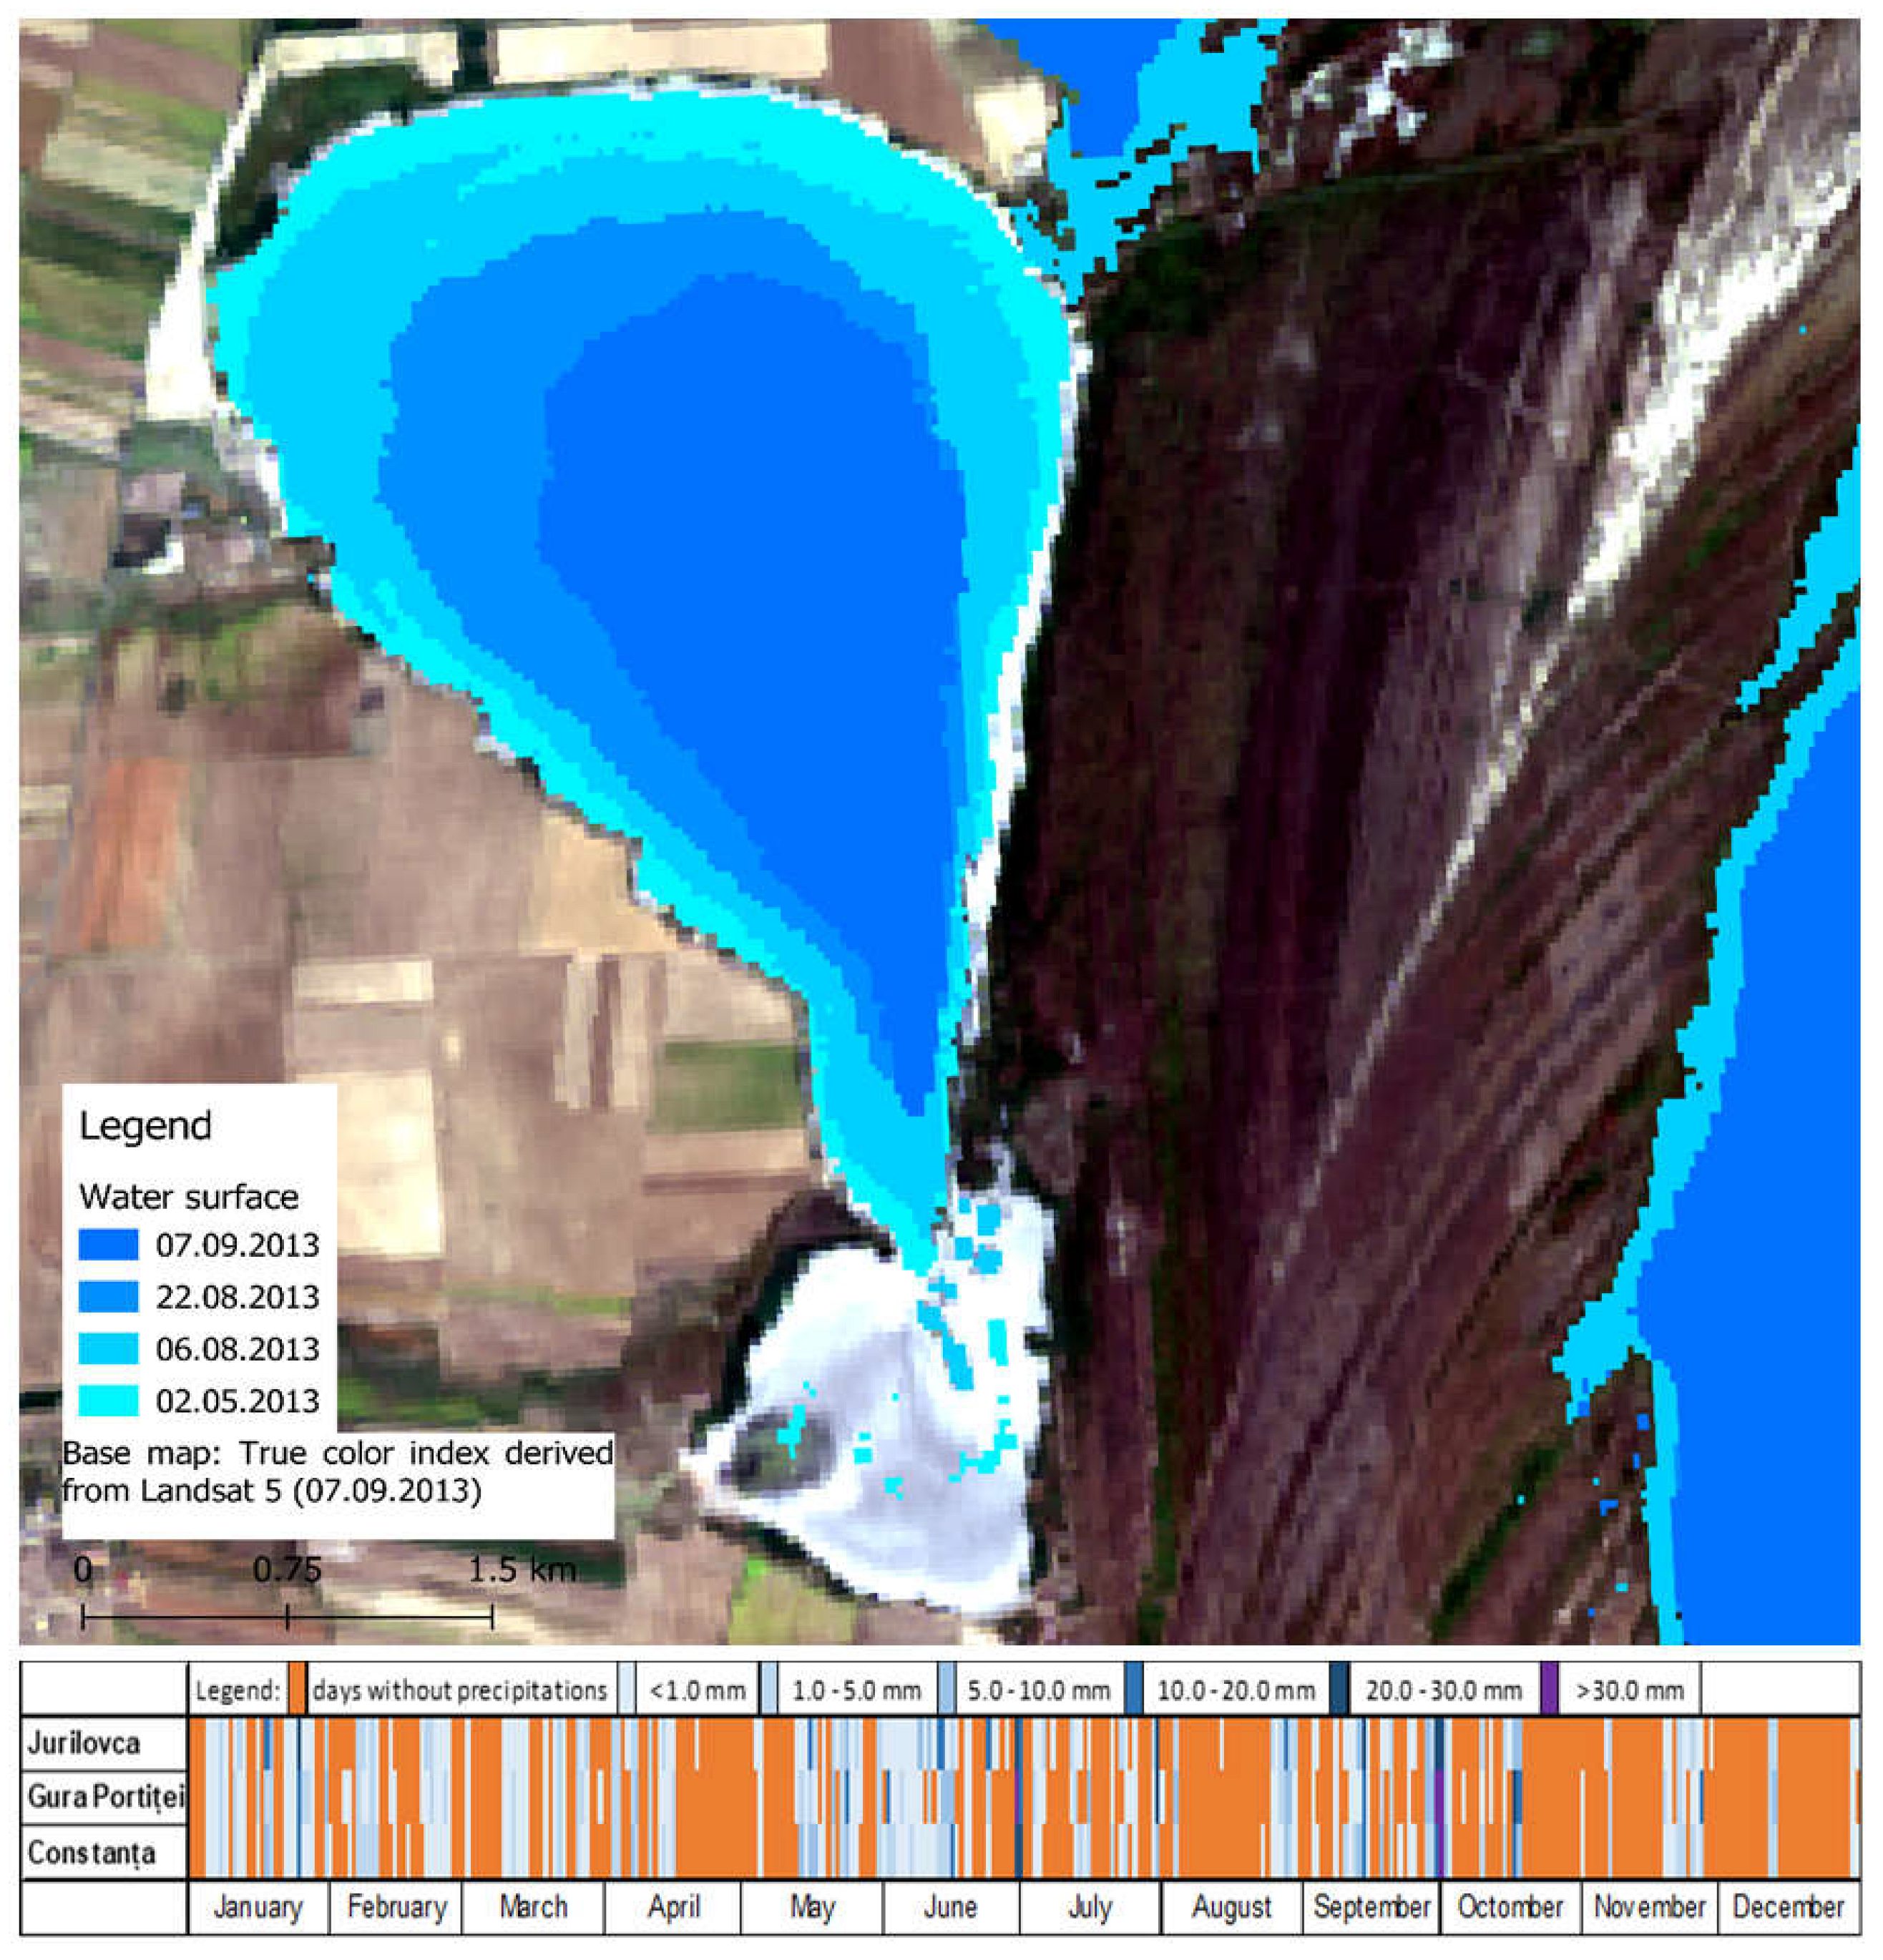
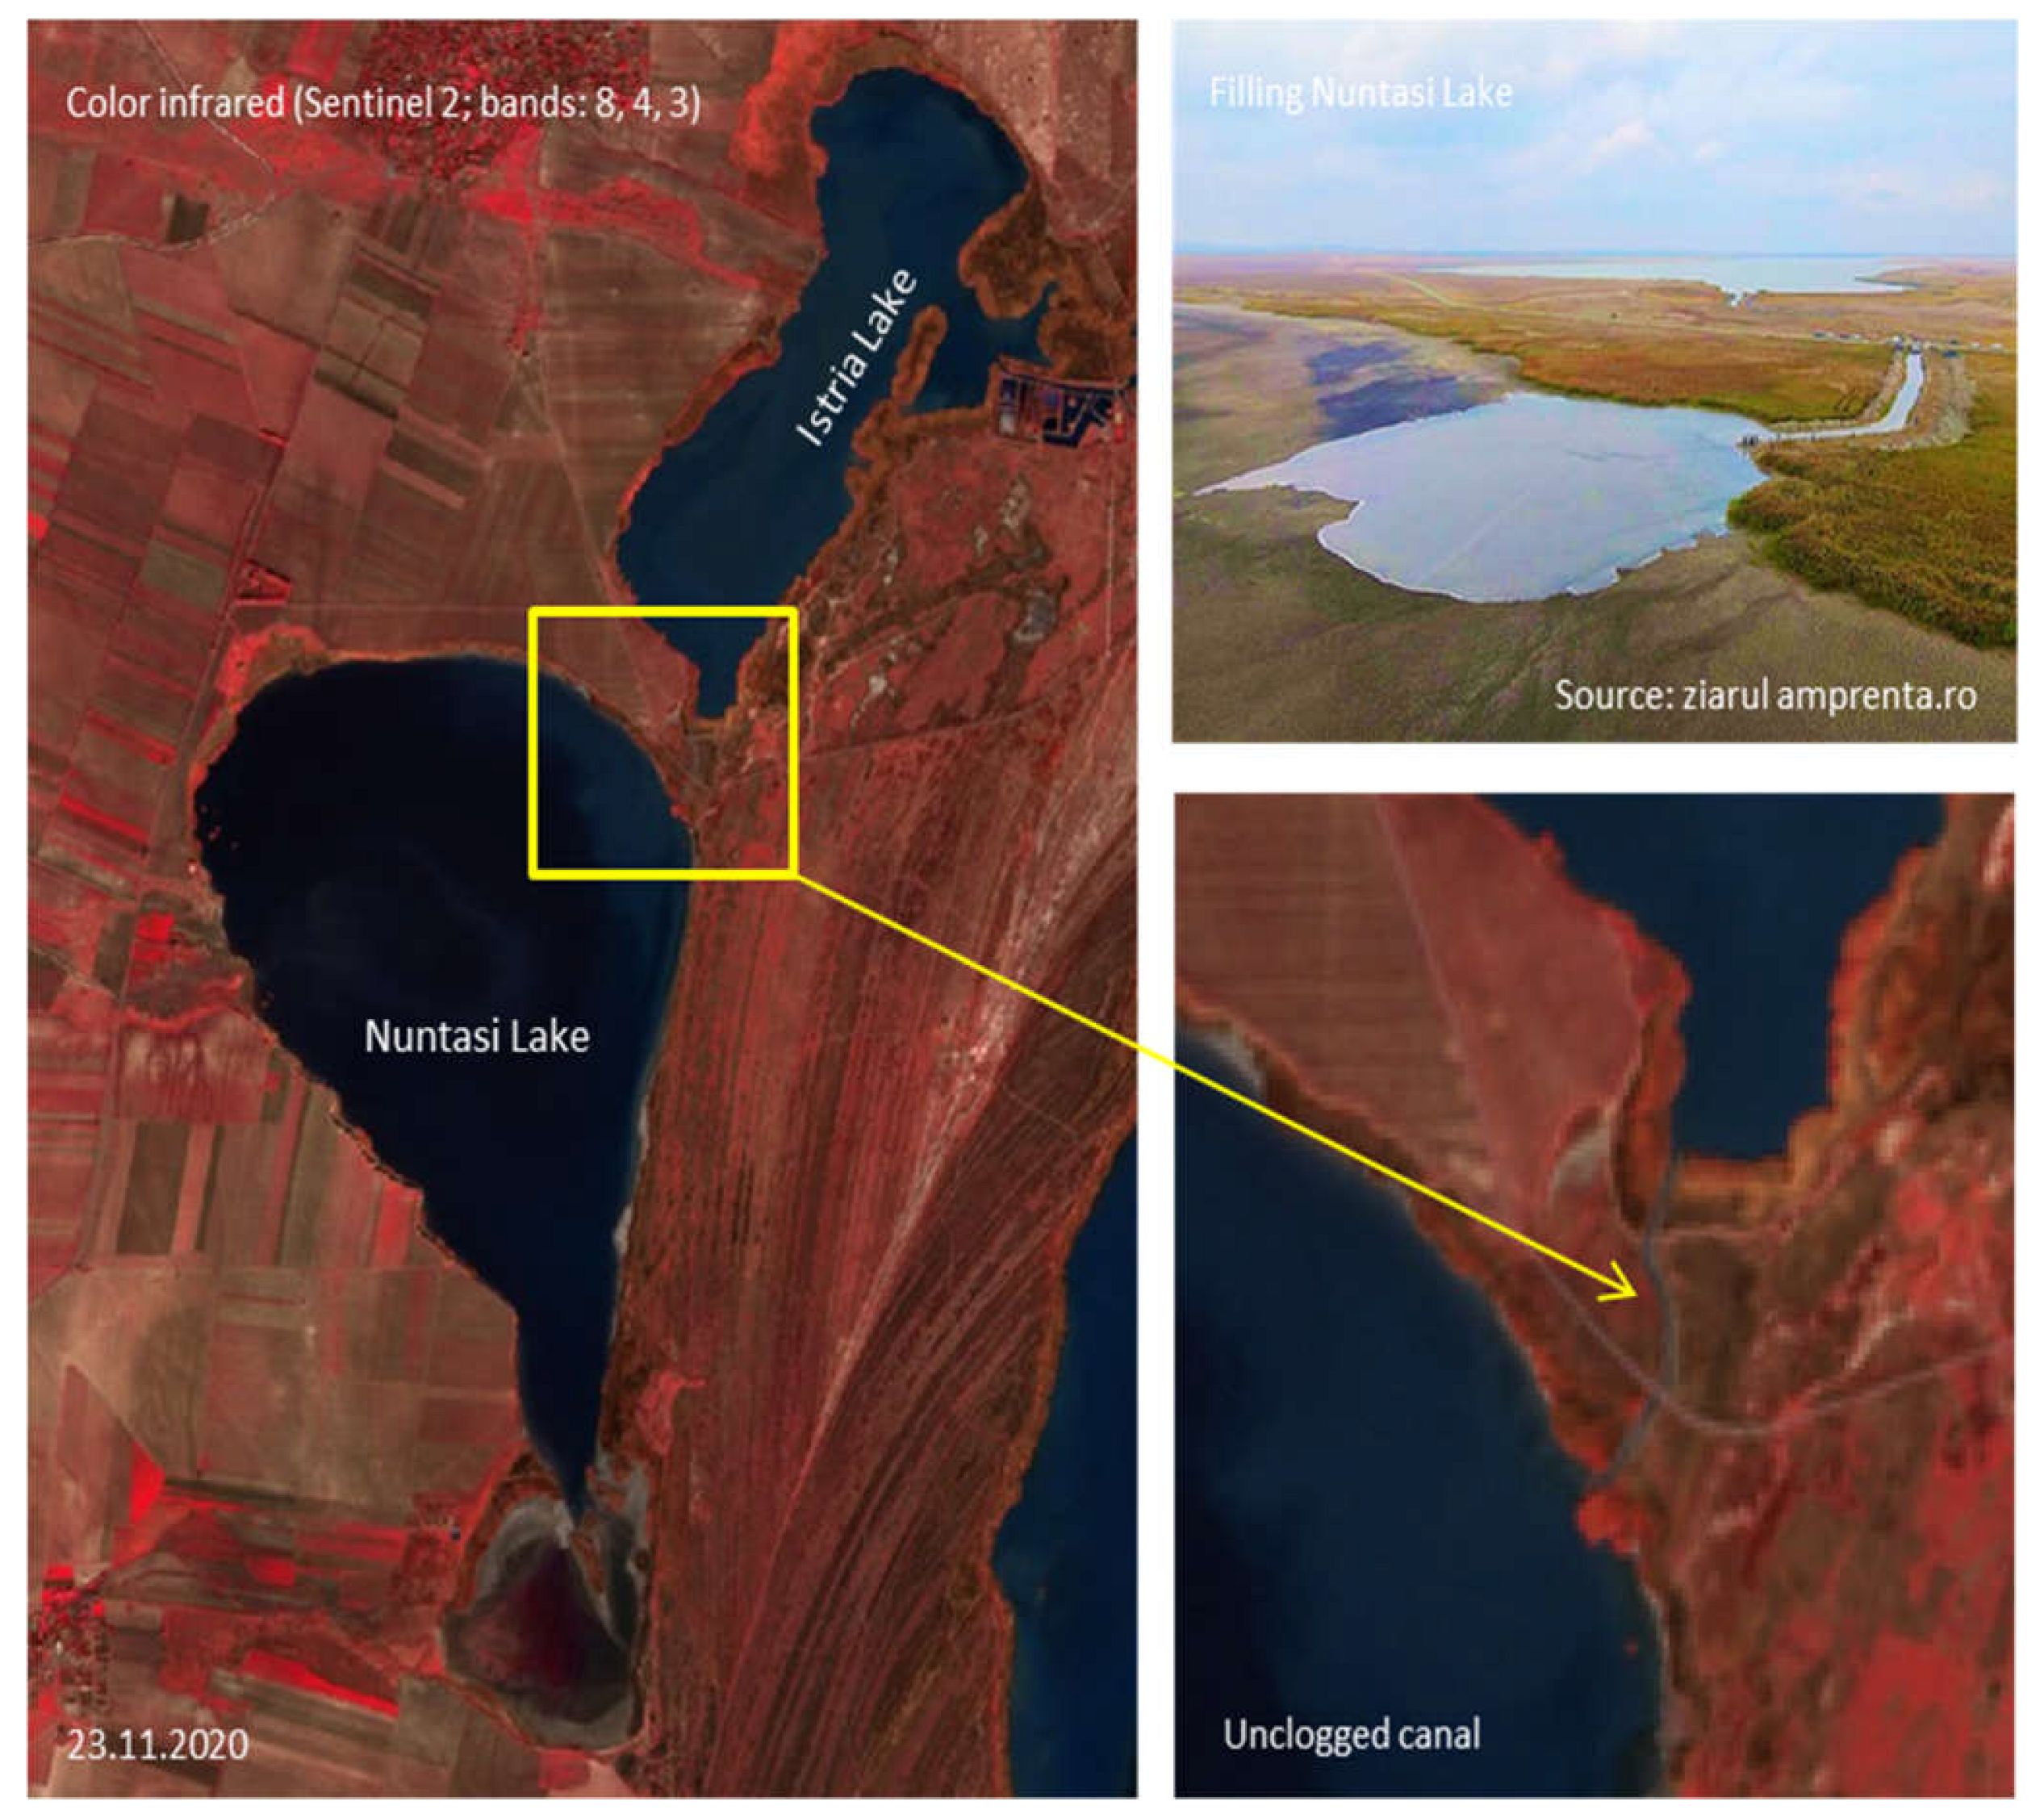
3.3. Satellite Data
3.4. Data Analysis
4. Results
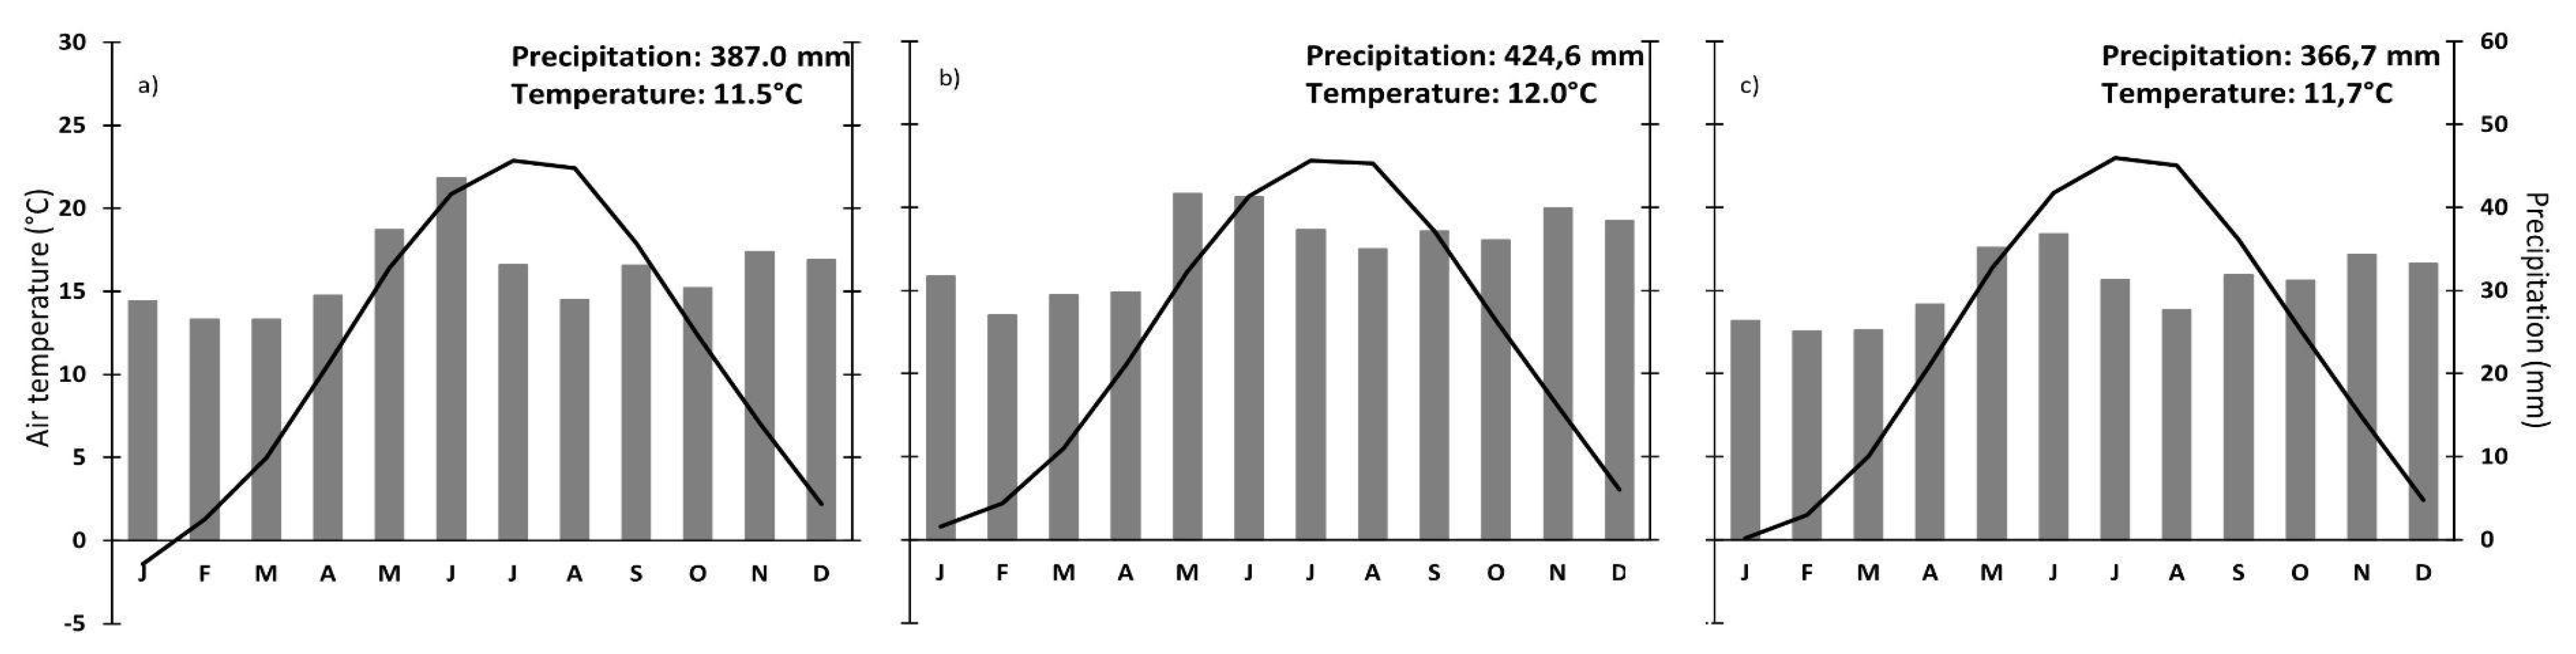
4.1. Climatic Background
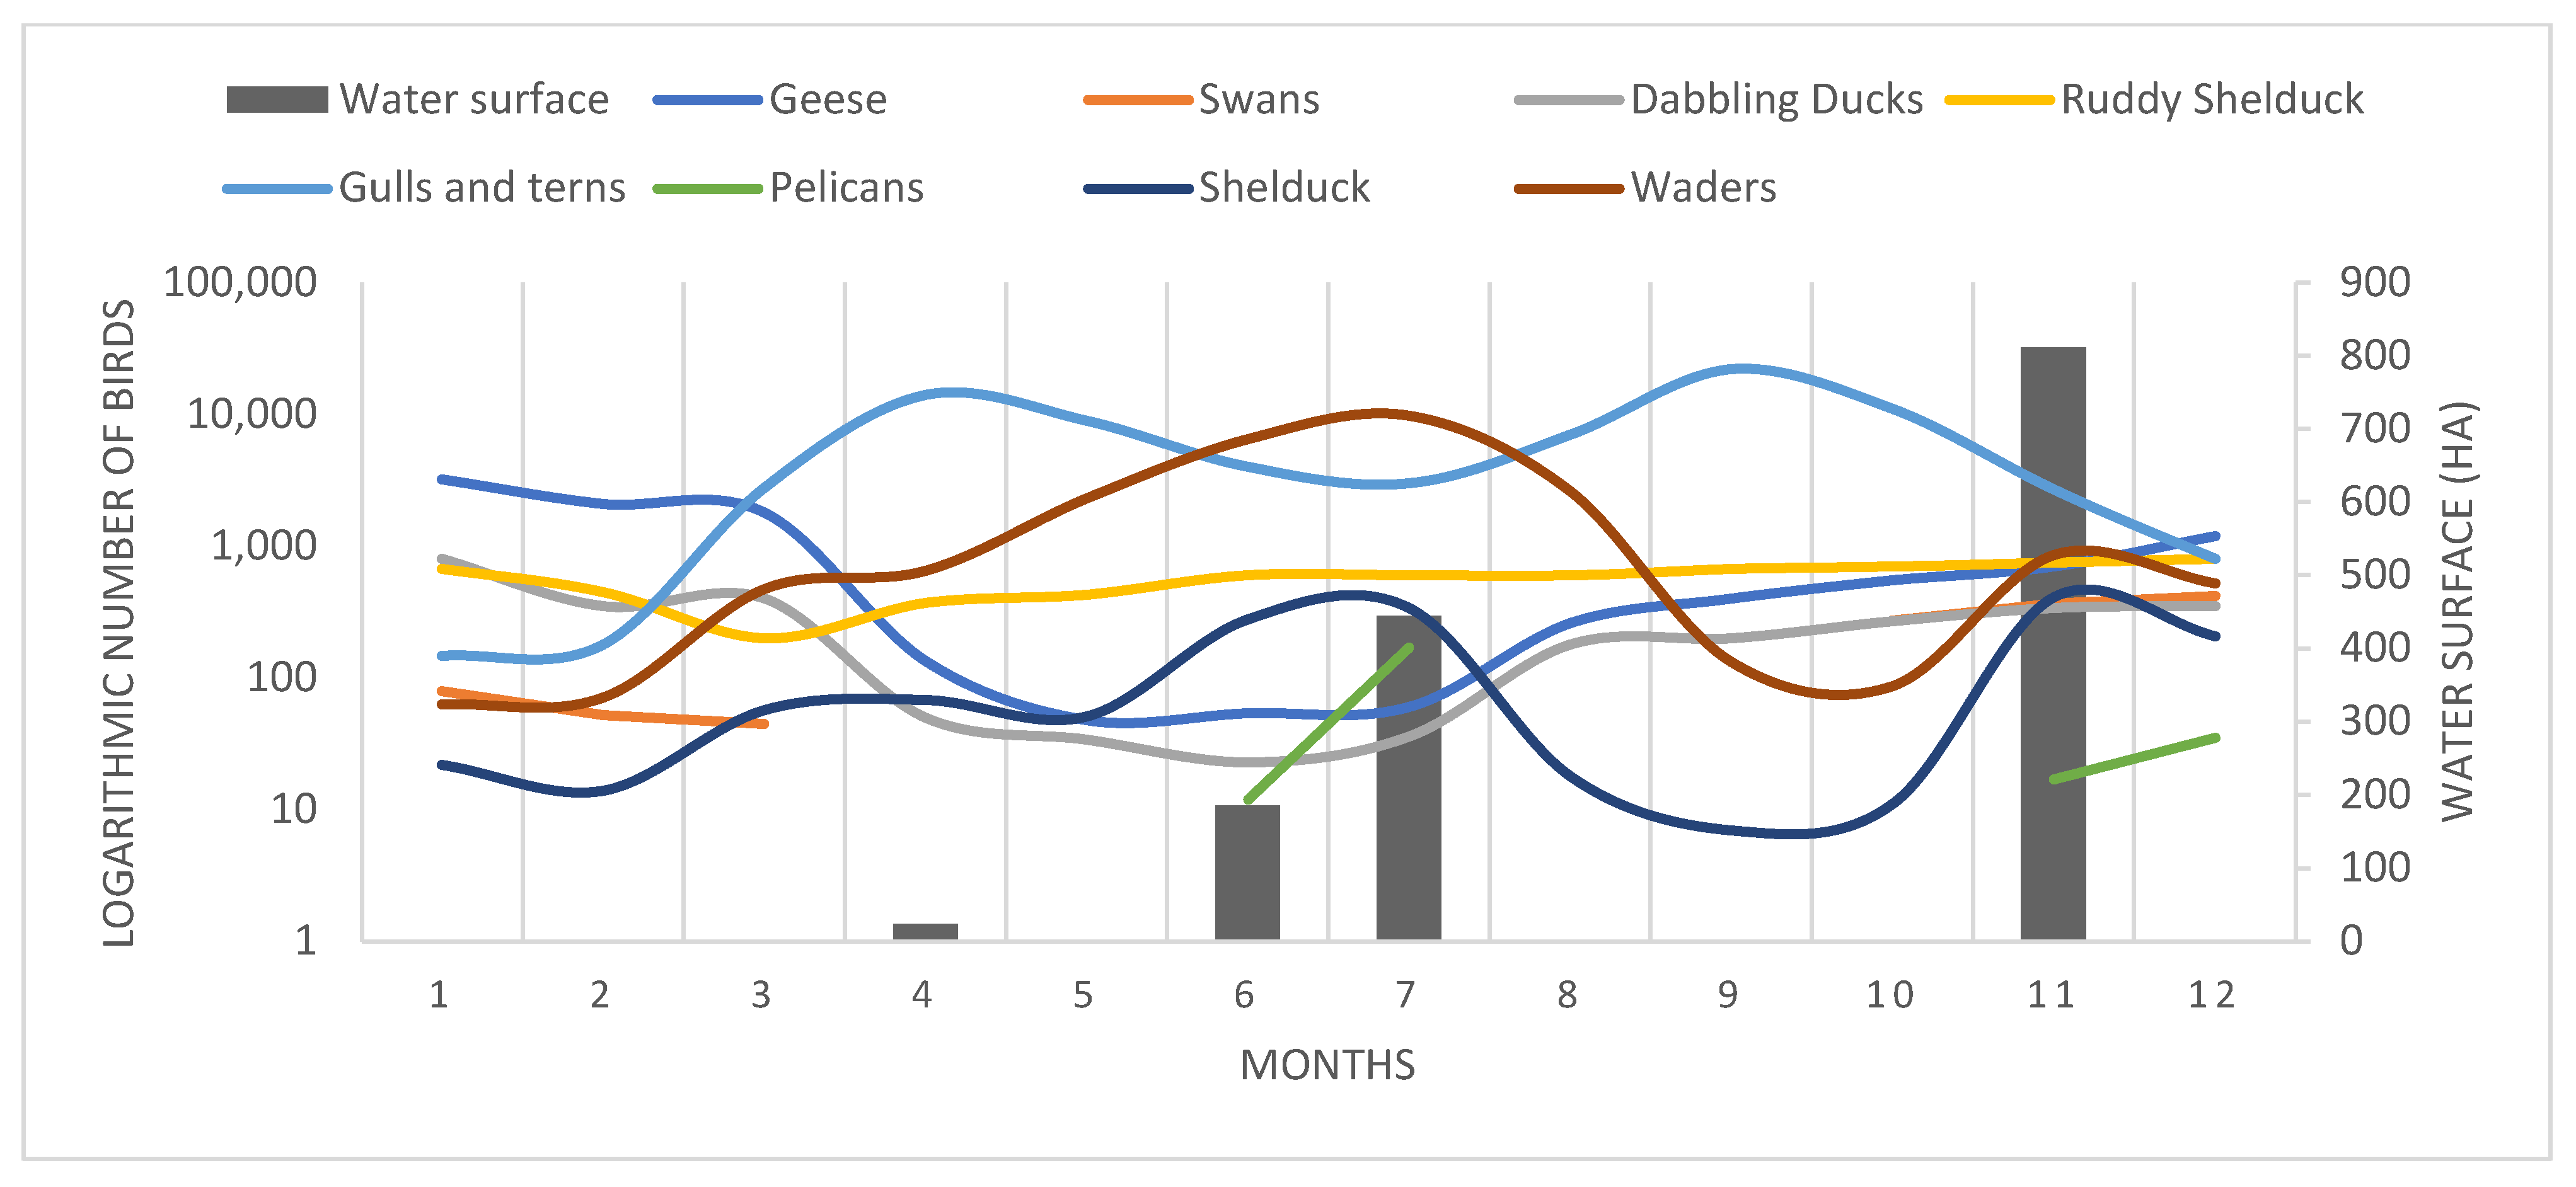
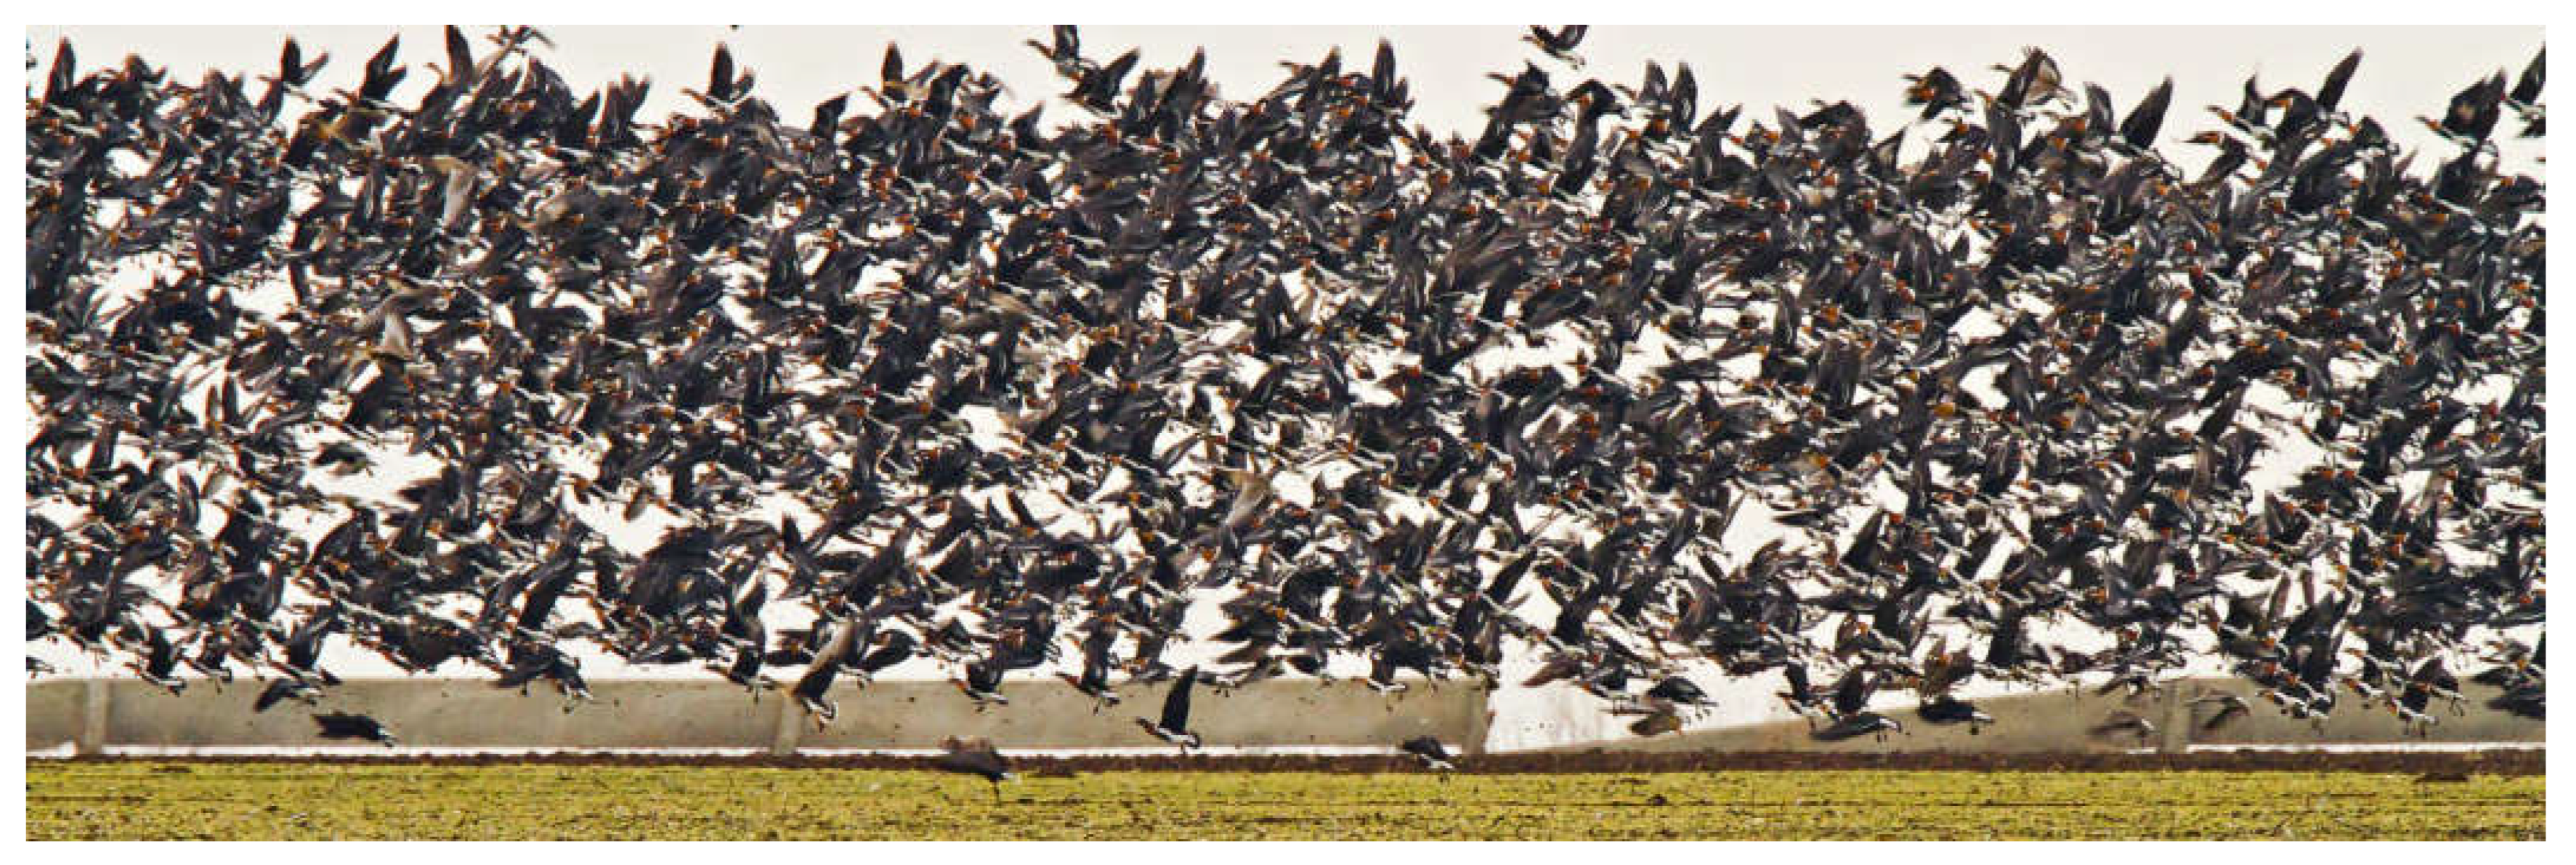
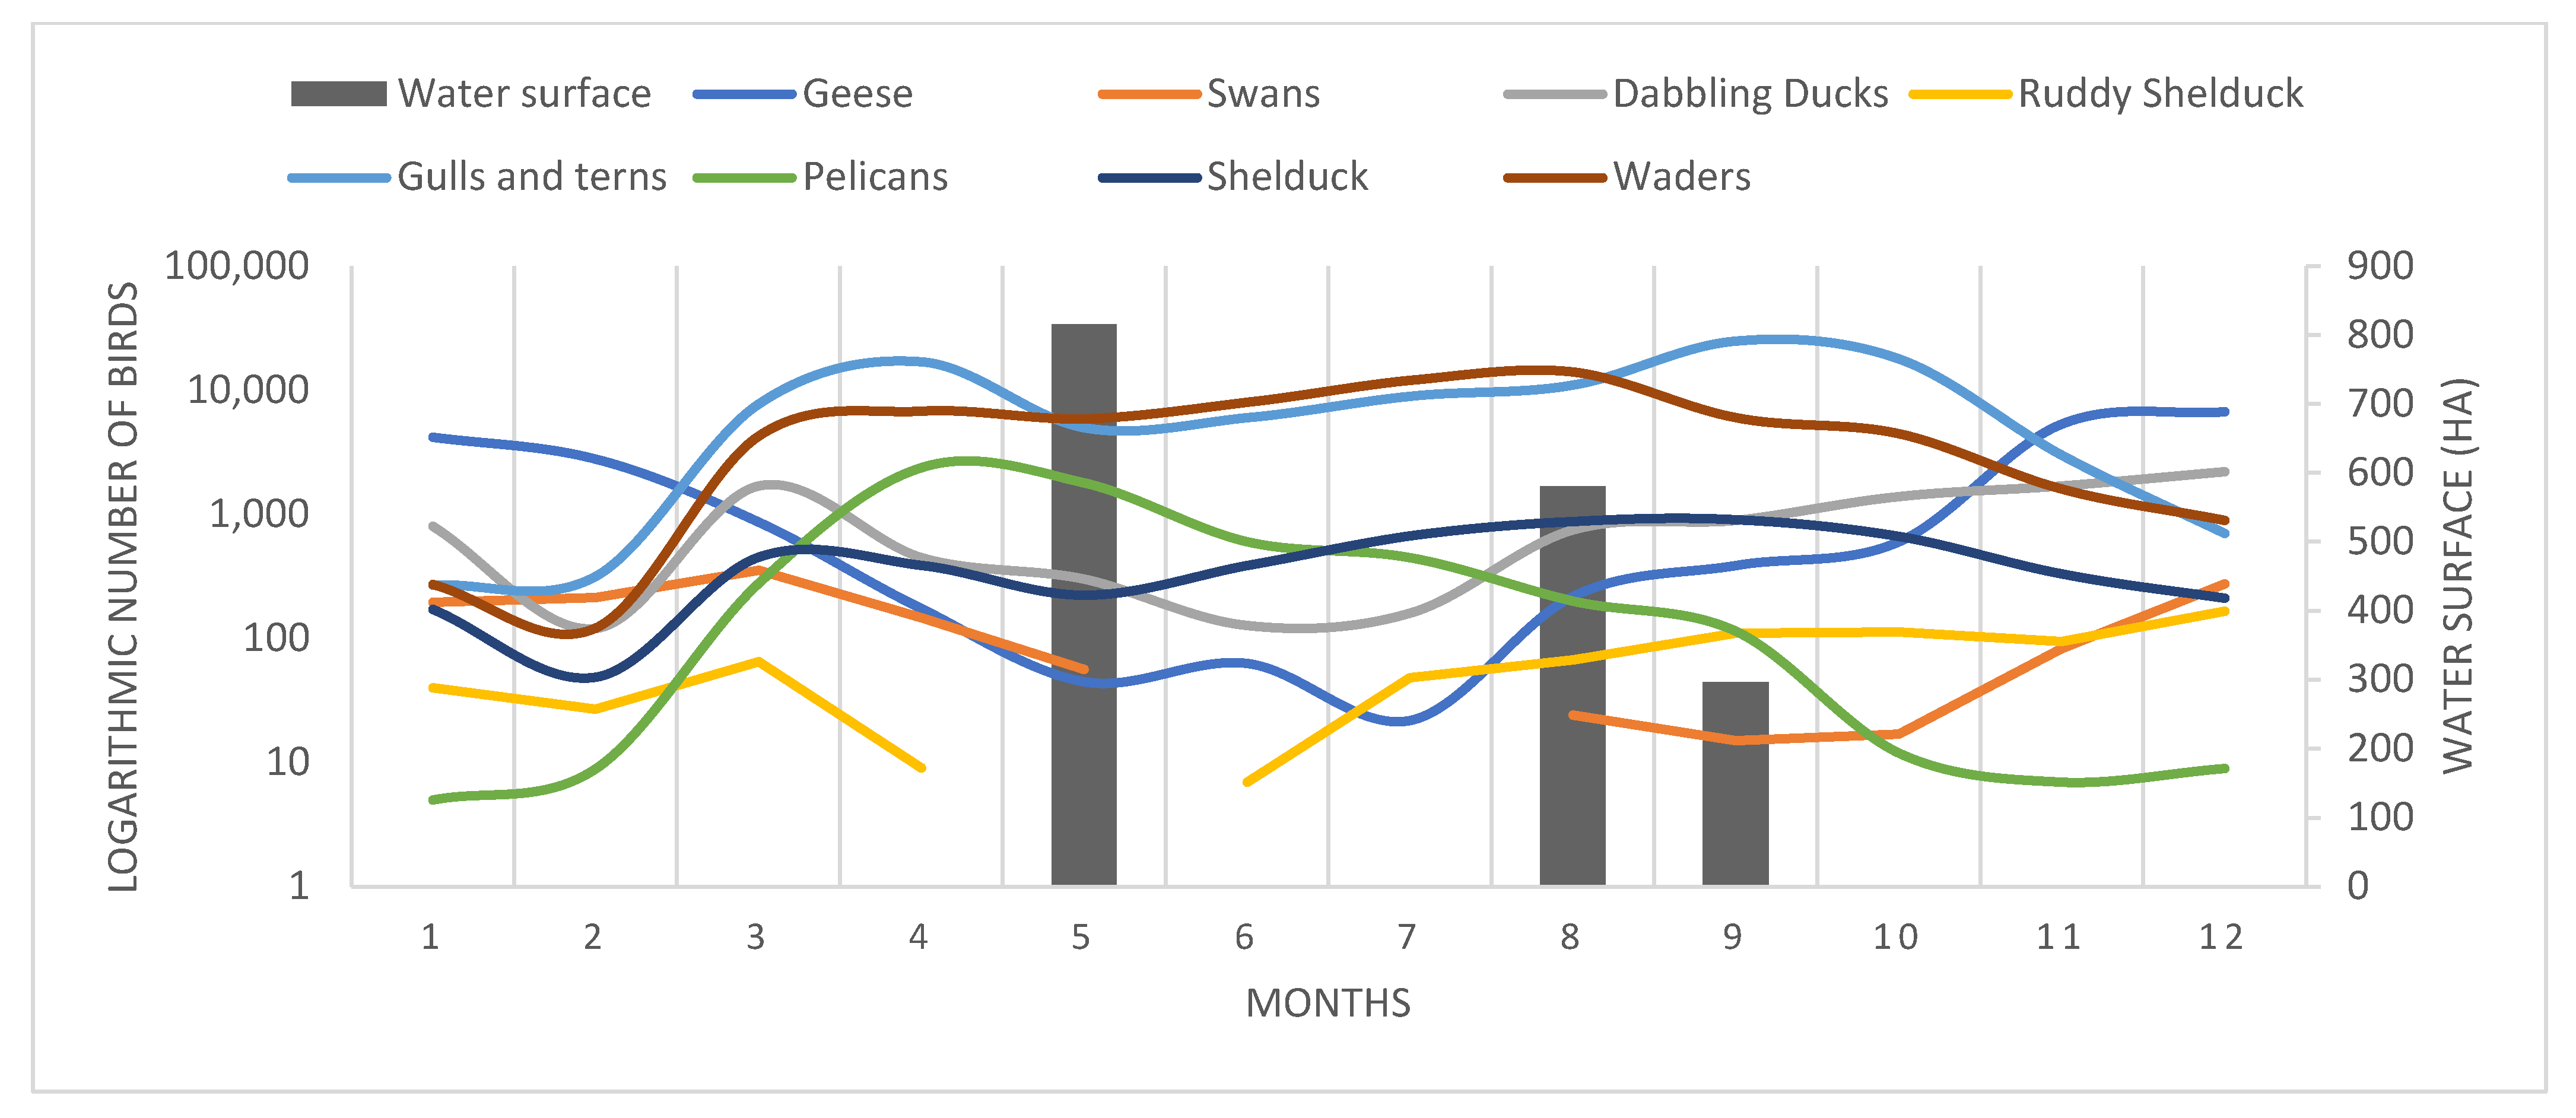
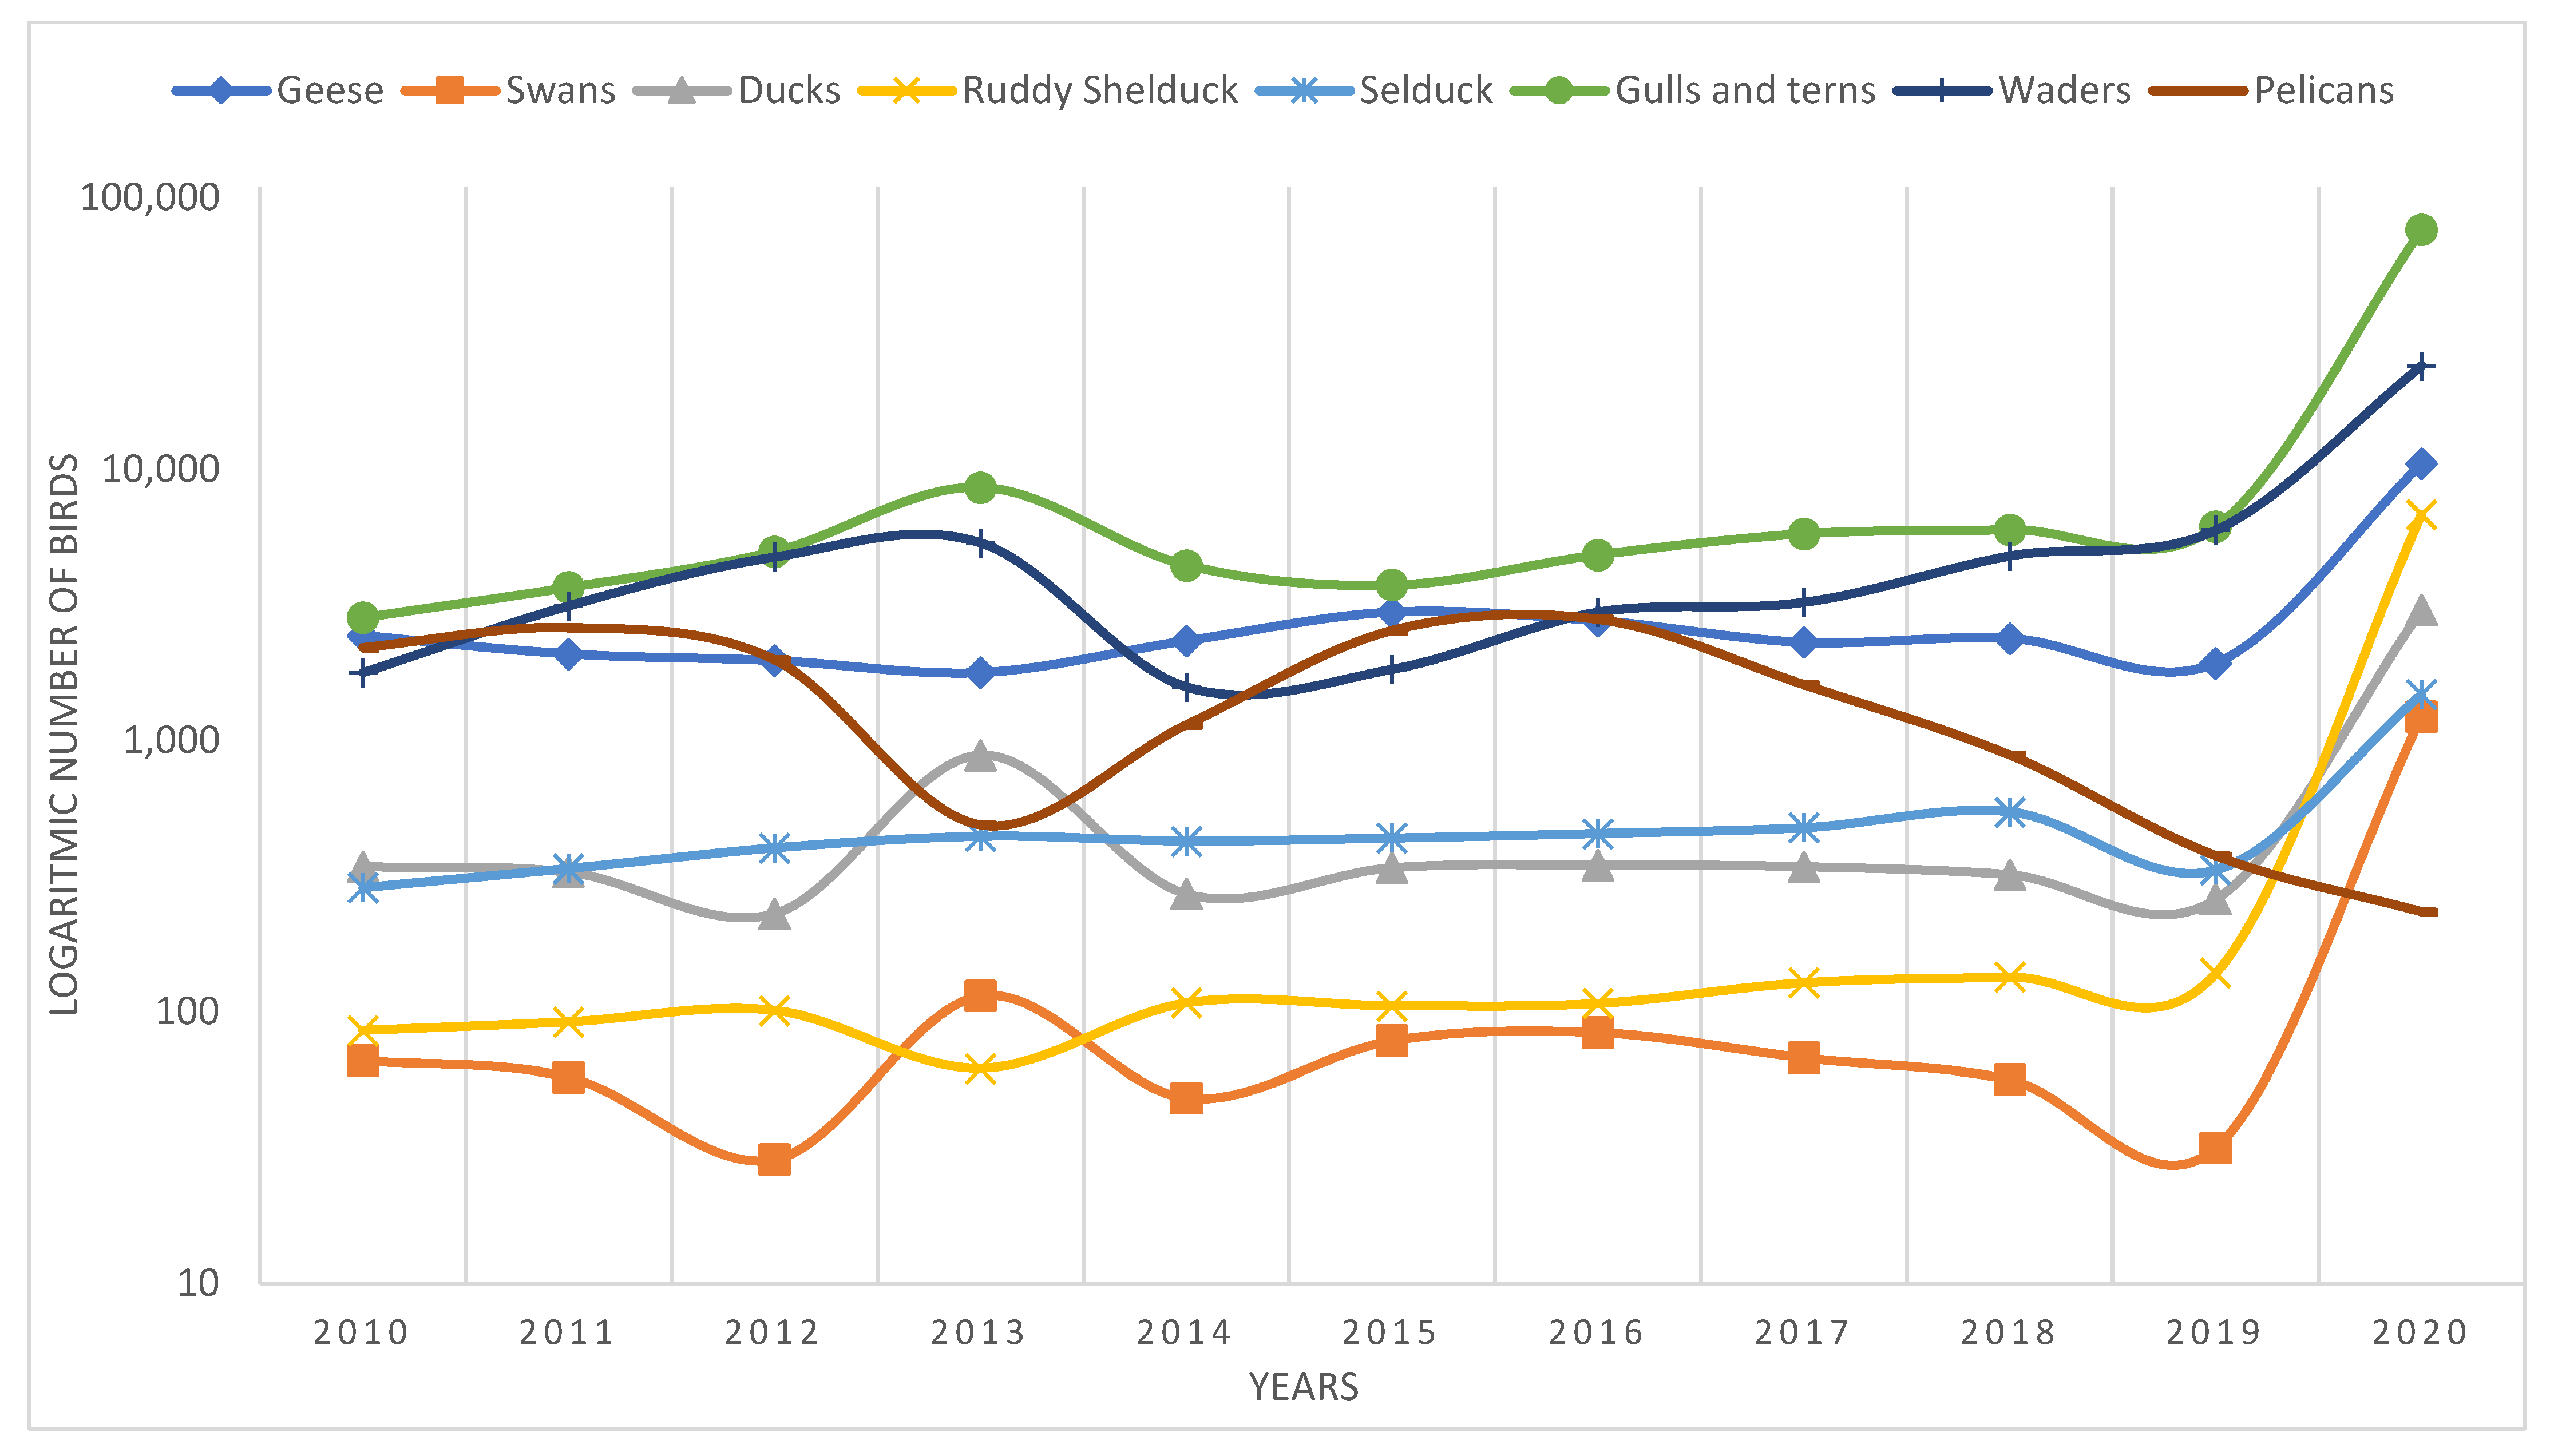
4.2. Bird Observation
5. Discussion
6. Conclusions
Author Contributions
Funding
Institutional Review Board Statement
Informed Consent Statement
Data Availability Statement
Acknowledgments
Conflicts of Interest
References
- Dai, A. Drought under global warming: A review. WIREs Clim. Chang. 2011, 2, 45–65. [Google Scholar] [CrossRef] [Green Version]
- Wilhite, D.A.; Glantz, M.H. Understanding: The Drought Phenomenon: The Role of Definitions. Water Int. 1985, 10, 111–120. [Google Scholar] [CrossRef] [Green Version]
- Wang, R.; Peng, W.; Liu, X.; Wu, W.; Chen, X.; Zhang, S. Responses of Water Level in China’s Largest Freshwater Lake to the Meteorological Drought Index (SPEI) in the Past Five Decades. Water 2018, 10, 137. [Google Scholar] [CrossRef] [Green Version]
- Hao, Z.; Singh, V.P. Drought characterization from a multivariate perspective: A review. J. Hydrol. 2015, 527, 668–678. [Google Scholar] [CrossRef]
- Zhao, H.; Gao, G.; An, W.; Zou, X.; Li, H.; Hou, M. Timescale differences between SC-PDSI and SPEI for drought monitoring in China. Phys. Chem. Earth Parts A/B/C 2017, 102, 48–58. [Google Scholar] [CrossRef]
- IPCC. Climate Change 2013: The Physical Science Basis: Summary for Policymakers, a Report of Working Group I of the IPCC: Technical Summary, a Report Accepted by Working Group I of the IPCC but Not Approved in Detail: And Frequently Asked Questions: Part of the Working Group I Contribution to the Fifth Assessment Report of the Intergovernmental Panel on Climate Change; Stocker, T., Qin, D., Eds.; WMO: Geneva, Switzerland; UNEP: Nairobi, Kenya, 2013; ISBN 978-92-9169-138-8. [Google Scholar]
- Dobri, R.-V.; Sfîcă, L.; Amihăesei, V.-A.; Apostol, L.; Țîmpu, S. Drought Extent and Severity on Arable Lands in Romania Derived from Normalized Difference Drought Index (2001–2020). Remote Sens. 2021, 13, 1478. [Google Scholar] [CrossRef]
- Minea, I.; Iosub, M.; Boicu, D. Multi-scale approach for different type of drought in temperate climatic conditions. Nat. Hazards 2022, 110, 1153–1177. [Google Scholar] [CrossRef]
- Pedro-Monzonís, M.; Solera, A.; Ferrer, J.; Estrela, T.; Paredes-Arquiola, J. A review of water scarcity and drought indexes in water resources planning and management. J. Hydrol. 2015, 527, 482–493. [Google Scholar] [CrossRef] [Green Version]
- Bolger, D.T.; Patten, M.A.; Bostock, D.C. Avian reproductive failure in response to an extreme climatic event. Oecologia 2005, 142, 398–406. [Google Scholar] [CrossRef]
- McCreedy, C.; Van Riper, C. Drought-caused delay in nesting of Sonoran Desert birds and its facilitation of parasite- and predator-mediated variation in reproductive success. Auk 2015, 132, 235–247. [Google Scholar] [CrossRef] [Green Version]
- Magoulick, D.D.; Kobza, R.M. The role of refugia for fishes during drought: A review and synthesis: Refugia for Fishes during Drought. Freshw. Biol. 2003, 48, 1186–1198. [Google Scholar] [CrossRef]
- Batanero, G.L.; León-Palmero, E.; Li, L.; Green, A.J.; Rendón-Martos, M.; Suttle, C.A.; Reche, I. Flamingos and drought as drivers of nutrients and microbial dynamics in a saline lake. Sci. Rep. 2017, 7, 12173. [Google Scholar] [CrossRef] [PubMed] [Green Version]
- Cady, S.M.; O’Connell, T.J.; Loss, S.R.; Jaffe, N.E.; Davis, C.A. Species-specific and temporal scale-dependent responses of birds to drought. Glob. Chang. Biol. 2019, 25, 2691–2702. [Google Scholar] [CrossRef] [PubMed]
- Albright, T.P.; Pidgeon, A.M.; Rittenhouse, C.D.; Clayton, M.K.; Wardlow, B.D.; Flather, C.H.; Culbert, P.D.; Radeloff, V.C. Combined effects of heat waves and droughts on avian communities across the conterminous United States. Ecosphere 2010, 1, 1–22. [Google Scholar] [CrossRef]
- Rajpar, M.N.; Zakaria, M. Bird Species Abundance and Their Correlationship with Microclimate and Habitat Variables at Natural Wetland Reserve, Peninsular Malaysia. Int. J. Zool. 2011, 2011, 1–17. [Google Scholar] [CrossRef] [Green Version]
- Baschuk, M.S.; Koper, N.; Wrubleski, D.A.; Goldsborough, G. Effects of Water Depth, Cover and Food Resources on Habitat use of Marsh Birds and Waterfowl in Boreal Wetlands of Manitoba, Canada. Waterbirds 2012, 35, 44–55. [Google Scholar] [CrossRef]
- Liu, W.T.; Kogan, F.N. Monitoring regional drought using the Vegetation Condition Index. Int. J. Remote Sens. 1996, 17, 2761–2782. [Google Scholar] [CrossRef]
- Huovinen, P.; Ramírez, J.; Caputo, L.; Gómez, I. Mapping of spatial and temporal variation of water characteristics through satellite remote sensing in Lake Panguipulli, Chile. Sci. Total Environ. 2019, 679, 196–208. [Google Scholar] [CrossRef]
- Croitoru, A.E.; Piticar, A.; Sfîcă, L.; Roșca, C.-F.; Tudose, T.; Horvath, C.; Ionuț, M.; Ciupertea, A.-F.; Scripcă, S.; Harpa, G. Extreme Temperature and Precipitation Events in Romania, Editura Academiei Române; The Romanian Academy: Bucharest, Romania, 2018; p. 359. ISBN 978-973-27-2833-8. [Google Scholar]
- Șerban, C.; Maftei, C.; Dobrică, G. Surface Water Change Detection via Water Indices and Predictive Modeling Using Remote Sensing Imagery: A Case Study of Nuntasi-Tuzla Lake, Romania. Water 2022, 14, 556. [Google Scholar] [CrossRef]
- Available online: https://ebird.org/region/RO-CT/hotspots?yr=all&m= (accessed on 15 December 2021).
- Vespremeanu-Stroe, A.; Preoteasa, L.; Hanganu, D.; Brown, A.G.; Bîrzescu, I.; Toms, P.; Timar-Gabor, A. The impact of the Late Holocene coastal changes on the rise and decay of the ancient city of Histria (southern Danube delta). Quat. Int. 2013, 293, 245–256. [Google Scholar] [CrossRef]
- Maftei, C.; Dobrica, G.; Cerneaga, C.; Buzgaru, N. Drought Land Degradation and Desertification—Case Study of Nuntasi-Tuzla Lake in Romania. In Water Safety, Security and Sustainability: Threat Detection and Mitigation; Vaseashta, A., Maftei, C., Eds.; Springer International Publishing: Cham, Switzerland, 2021; pp. 583–597. [Google Scholar]
- Breier, A. Lacurile de pe Litoralul Romanesc al Marii Negre; Studiu Hidrogeografic; Editura Academiei Republicii Socialiste România: Bucuresti, Romania, 1976. [Google Scholar]
- Jeppesen, E.; Peder Jensen, J.; Søndergaard, M.; Lauridsen, T.; Junge Pedersen, L.; Jensen, L. Top-Down Control in Freshwater Lakes: The Role of Nutrient State, Submerged Macrophytes and Water Depth. In Shallow Lakes ’95; Kufel, L., Prejs, A., Rybak, J.I., Eds.; Springer: Dordrecht, The Netherlands, 1997; pp. 151–164. ISBN 978-94-010-6382-1. [Google Scholar]
- Heredia, B.; Rose, L.; Painter, M. Globally Threatened Birds in Europe: Action Plans; Council of Europe: Strasbourg, France, 1996; ISBN 92-871-3066-3. [Google Scholar]
- Available online: https://europe.wetlands.org/wpcontent/uploads/sites/3/2016/08/Protocol_for_waterbird_counting_En_.pdf (accessed on 10 November 2021).
- Dumitrescu, A.; Birsan, M.-V. ROCADA: A gridded daily climatic dataset over Romania (1961–2013) for nine meteorological variables. Nat. Hazards 2015, 78, 1045–1063. [Google Scholar] [CrossRef]
- McFeeters, S.K. Using the Normalized Difference Water Index (NDWI) within a Geographic Information System to Detect Swimming Pools for Mosquito Abatement: A Practical Approach. Remote Sens. 2013, 5, 3544–3561. [Google Scholar] [CrossRef] [Green Version]
- Environmental Protection Agency; Queensland Government. Wetland Mapping and Classification Methodology: Overall Framework; A Method to Provide Baseline Mapping and Classification for Wetlands in Queensland; Environmental Protection Agency; Queensland Government: Brisbane, QL, Australia, 2005; ISBN 978-0-9757344-6-9. [Google Scholar]
- Murray, N.J.; Phinn, S.R.; Clemens, R.S.; Roelfsema, C.M.; Fuller, R.A. Continental Scale Mapping of Tidal Flats across East Asia Using the Landsat Archive. Remote Sens. 2012, 4, 3417–3426. [Google Scholar] [CrossRef] [Green Version]
- Rokni, K.; Ahmad, A.; Selamat, A.; Hazini, S. Water Feature Extraction and Change Detection Using Multitemporal Landsat Imagery. Remote Sens. 2014, 6, 4173–4189. [Google Scholar] [CrossRef] [Green Version]
- Fathizad, H.; Tazeh, M.; Kalantari, S.; Shojaei, S. The investigation of spatiotemporal variations of land surface temperature based on land use changes using NDVI in southwest of Iran. J. Afr. Earth Sci. 2017, 134, 249–256. [Google Scholar] [CrossRef]
- Muttitanon, W.; Tripathi, N.K. Land use/land cover changes in the coastal zone of Ban Don Bay, Thailand using Landsat 5 TM data. Int. J. Remote Sens. 2005, 26, 2311–2323. [Google Scholar] [CrossRef]
- Kinyanjui, M.J. NDVI-based vegetation monitoring in Mau forest complex, Kenya. Afr. J. Ecol. 2011, 49, 165–174. [Google Scholar] [CrossRef]
- Pei, F.; Wu, C.; Liu, X.; Li, X.; Yang, K.; Zhou, Y.; Wang, K.; Xu, L.; Xia, G. Monitoring the vegetation activity in China using vegetation health indices. Agric. For. Meteorol. 2018, 248, 215–227. [Google Scholar] [CrossRef]
- Sruthi, S.; Aslam, M.M. Agricultural Drought Analysis Using the NDVI and Land Surface Temperature Data; a Case Study of Raichur District. Aquat. Procedia 2015, 7, 1258–1264. [Google Scholar] [CrossRef]
- Jitariu, V.; Vasiliniuc, I.; Rusu, C.; Rosca, B. The Use of Sentinel 2 Images for Drought Phenomenon Monitoring in Apple Orchards. In Proceedings of the International Multidisciplinary Scientific GeoConference SGEM, Albena, Bulgaria, 28 June–6 July 2019; Volume 19, pp. 671–678. [Google Scholar]
- Gao, Y.; Quevedo, A.; Szantoi, Z.; Skutsch, M. Monitoring Forest Disturbance Using Time-Series MODIS NDVI in Michoacán, Mexico. Geocarto Int. 2021, 36, 1768–1784. [Google Scholar] [CrossRef]
- Schultz, M.; Clevers, J.G.P.W.; Carter, S.; Verbesselt, J.; Avitabile, V.; Quang, H.V.; Herold, M. Performance of vegetation indices from Landsat time series in deforestation monitoring. Int. J. Appl. Earth Obs. Geoinf. 2016, 52, 318–327. [Google Scholar] [CrossRef]
- Dong, Z.; Wang, Z.; Liu, D.; Song, K.; Li, L.; Jia, M.; Ding, Z. Mapping Wetland Areas Using Landsat-Derived NDVI and LSWI: A Case Study of West Songnen Plain, Northeast China. J. Indian Soc. Remote Sens. 2014, 42, 569–576. [Google Scholar] [CrossRef]
- Omute, P.; Corner, R.; Awange, J.L. The use of NDVI and its Derivatives for Monitoring Lake Victoria’s Water Level and Drought Conditions. Water Resour. Manag. 2012, 26, 1591–1613. [Google Scholar] [CrossRef] [Green Version]
- Han, Q.; Niu, Z. Construction of the Long-Term Global Surface Water Extent Dataset Based on Water-NDVI Spatio-Temporal Parameter Set. Remote Sens. 2020, 12, 2675. [Google Scholar] [CrossRef]
- Zhai, K.; Wu, X.; Qin, Y.; Du, P. Comparison of surface water extraction performances of different classic water indices using OLI and TM imageries in different situations. Geo Spat. Inf. Sci. 2015, 18, 32–42. [Google Scholar] [CrossRef]
- Rouse, J.W., Jr.; Haas, R.H.; Schell, J.A.; Deering, D.W. Paper a 20. In Proceedings of the Third Earth Resources Technology Satellite-1 Symposium: Section AB. Technical presentations; Scientific and Technical Information Office, National Aeronautics and Space, Greenbelt, MD, USA, 10–14 December 1973; Volume 1, p. 309. [Google Scholar]
- Marusteri, M.; Bacarea, V. Comparing Groups for Statistical Di Erences: How to Choose the Right Statistical Test? Indian J. Ophthalmol. 2011, 59, 85–86. [Google Scholar]
- Van Strien, A.; Pannekoek, J.; Hagemeijer, W.; Verstrael, T. A Loglinear Poisson Regression Method to Analyse Bird Monitoring. Data. Bird 2004, 482, 33–39. [Google Scholar]
- Azizoğlu, E.; Adizel, O.; Kara, R. A statistical approach on seasonal population changes and habitat preferences on coastal and waterfowl species around Ekşisu Reeds (Erzincan-Turkey): Using negative binomial regression. Appl. Ecol. Environ. Res. 2021, 19, 653–665. [Google Scholar] [CrossRef]
- García-Núñez, R.M.; Romero-Díaz, C.; Ugalde-Lezama, S.; Tinoco-Rueda, J.A. Vegetation and habitat structure that determines the diet of insectivorous birds in agroforestry systems. Rev. Mex. Cienc. Agríc. 2020, 11, 4. [Google Scholar]
- Encyclopædia Britannica; Encyclopædia Britannica, Inc.: Chicago, IL, USA, 2016.
- Rousi, E.; Rust, H.W.; Ulbrich, U.; Anagnostopoulou, C. Implications of Winter NAO Flavors on Present and Future European Climate. Climate 2020, 8, 13. [Google Scholar] [CrossRef] [Green Version]
- Lindsey, R.; Dahlman, L. Climate Variability: North Atlantic Oscillation. Climate. gov. Last modified 30 August 2009. 2009. Available online: https://www.climate.gov/news-features/understanding-climate/climate-variability-north-atlantic-oscillation (accessed on 15 February 2022).
- Wan, W.; Xiao, P.; Feng, X.; Li, H.; Ma, R.; Duan, H.; Zhao, L. Monitoring lake changes of Qinghai-Tibetan Plateau over the past 30 years using satellite remote sensing data. Chin. Sci. Bull. 2014, 59, 1021–1035. [Google Scholar] [CrossRef]
- Nitze, I.; Grosse, G.; Jones, B.M.; Arp, C.D.; Ulrich, M.; Fedorov, A.; Veremeeva, A. Landsat-Based Trend Analysis of Lake Dynamics across Northern Permafrost Regions. Remote Sens. 2017, 9, 640. [Google Scholar] [CrossRef] [Green Version]
- Deus, D.; Gloaguen, R. Remote Sensing Analysis of Lake Dynamics in Semi-Arid Regions: Implication for Water Resource Management. Lake Manyara, East African Rift, Northern Tanzania. Water 2013, 5, 698–727. [Google Scholar] [CrossRef]
- Policelli, F.; Hubbard, A.; Jung, H.C.; Zaitchik, B.; Ichoku, C. Lake Chad Total Surface Water Area as Derived from Land Surface Temperature and Radar Remote Sensing Data. Remote Sens. 2018, 10, 252. [Google Scholar] [CrossRef] [Green Version]
- Besnard, A.G.; Davranche, A.; Maugenest, S.; Bouzillé, J.-B.; Vian, A.; Secondi, J. Vegetation Maps Based on Remote Sensing Are Informative Predictors of Habitat Selection of Grassland Birds across a Wetness Gradient. Ecol. Indic. 2015, 58, 47–54. [Google Scholar] [CrossRef] [Green Version]
- Koma, Z.; Seijmonsbergen, A.C.; Grootes, M.W.; Nattino, F.; Groot, J.; Sierdsema, H.; Foppen, R.P.B.; Kissling, W.D. Better together? Assessing different remote sensing products for predicting habitat suitability of wetland birds. Divers. Distrib. 2022, 28, 685–699. [Google Scholar] [CrossRef]
- Constantin, I.; Ştefan, B.E.; Ursu, A.; Lucian, S.; Elena, I.A.; Constantin, S.C. Relationship between Environmental Features and Bird Assemblages in the Wetlands of Eastern Romania. Present Environ. Sustain. Dev. 2019, 13, 265–290. [Google Scholar] [CrossRef]
- Sfîcă, L.; Croitoru, A.-E.; Iordache, I.; Ciupertea, A.-F. Synoptic Conditions Generating Heat Waves and Warm Spells in Romania. Atmosphere 2017, 8, 50. [Google Scholar] [CrossRef] [Green Version]
- Available online: https://ec.europa.eu/environment/nature/biodiversity/strategy/index_en.htm (accessed on 10 November 2021).
- Available online: http://sgglegis.gov.ro/legislativ/docs/2014/01/w2nphs85kcdr0b1zgj3f.pdf (accessed on 10 November 2021).
- Sekercioglu, C.H.; Schneider, S.H.; Fay, J.P.; Loarie, S.R. Climate Change, Elevational Range Shifts, and Bird Extinctions. Conserv. Biol. 2008, 22, 140–150. [Google Scholar] [CrossRef]
- Sekercioglu, C.H. Conservation Ecology: Area Trumps Mobility in Fragment Bird Extinctions. Curr. Biol. 2007, 17, R283–R286. [Google Scholar] [CrossRef] [Green Version]
- Cox, G.W. Bird Migration and Global Change; Island Press: Washington, DC, USA, 2010; ISBN 1-59726-969-7. [Google Scholar]
- Cooke, G.D.; Welch, E.B.; Peterson, S.A.; Newroth, P.R. Restoration and Management of Lakes and Reservoirs; Lewis Publishers: Boca Raton, FL, USA, 1993. [Google Scholar]
- Atkinson, S.T.; Cale, D.; Pinder, A.; Chambers, J.M.; Halse, S.A.; Robson, B.J. Substantial long-term loss of alpha and gamma diversity of lake invertebrates in a landscape exposed to a drying climate. Glob. Chang. Biol. 2021, 27, 6263–6279. [Google Scholar] [CrossRef] [PubMed]
- MARINOV, M.; HULEA, D.; CONDAC, M. Dinamica avifaunei din RBDD în corelatia cu principalii factori de mediu. Anal. Ştiintifice Inst. Delta Dunării 1996, 5, 211–226. [Google Scholar]
- Gonzalez, A.L.; Sepúlveda, P.V.; Schlatter, R. Waterbird Assemblages and Habitat Characteristics in Wetlands: Influence of Temporal Variability on Species-Habitat Relationships. Waterbirds 2009, 32, 225–233. [Google Scholar] [CrossRef]
- Marinov, M.; Doroșencu, A.; Alexe, V.; Bolboacă, L.-E.; Kiss, J.B. Current status of bird species in annex 1 of the birds directive for which special protection areas have been designated on the territory of the danube delta biosphere reserve. Rom. J. Biol. Zool. 2020, 65, 61–70. [Google Scholar]
- Ma, Z.; Cai, Y.; Li, B.; Chen, J. Managing Wetland Habitats for Waterbirds: An International Perspective. Wetlands 2010, 30, 15–27. [Google Scholar] [CrossRef]
- Sebastián-González, E.; Green, A.J. Habitat Use by Waterbirds in Relation to Pond Size, Water Depth, and Isolation: Lessons from a Restoration in Southern Spain. Restor. Ecol. 2014, 22, 311–318. [Google Scholar] [CrossRef]


| Satellite | Sensor | Year | Day/Month | Resolution (m) | Wavelength (µm) |
|---|---|---|---|---|---|
| Landsat-5 | TM | 2013 | 2/May 6/August 22/August 7/September | 30 | Band 1: 0.45–0.52 Band 2: 0.52–0.60 Band 3: 0.63–0.69 Band 4: 0.76–0.90 Band 5: 1.55–1.75 Band 6: 10.40–12.50 Band 7: 2.08–2.35 |
| Sentinel-2 | 2A/2B | 2020 | 26/June 11/July 31/July 25/August 9/September 19/September 24/October 23/November | 60 | Band 1: 0.443 |
| 10 | Band 2: 0.490 | ||||
| 10 | Band 3: 0.560 | ||||
| 10 | Band 4: 0.665 | ||||
| 20 | Band 5: 0.705 | ||||
| 20 | Band 6: 0.740 | ||||
| 20 | Band 7: 0.783 | ||||
| 10 | Band 8: 0.842 | ||||
| 20 | Band 8A: 0.865 | ||||
| 60 | Band 9: 0.945 | ||||
| 60 | Band 10: 1.375 | ||||
| 20 | Band 11: 1.610 | ||||
| 20 | Band 12: 2.190 |
| J | F | M | A | M | J | J | A | S | O | N | D | ||
|---|---|---|---|---|---|---|---|---|---|---|---|---|---|
| Mean number | Jurilovca | 4.9 | 5.0 | 4.7 | 5.3 | 7.2 | 6.3 | 5.1 | 4.4 | 4.8 | 4.3 | 5.3 | 5.8 |
| Constanța | 5.3 | 5.0 | 5.1 | 5.5 | 7.0 | 6.4 | 5.3 | 4.0 | 4.4 | 4.7 | 5.7 | 6.4 | |
| Gura Portiței | 4.9 | 5.1 | 4.8 | 5.4 | 7.3 | 6.7 | 5.2 | 4.4 | 5.0 | 4.6 | 5.6 | 6.2 | |
| 2013 | Jurilovca | 5 | 5 | 2 | 7 | 7 | 9 | 6 | 4 | 7 | 6 | 4 | 0 |
| Constanța | 9 | 4 | 4 | 6 | 6 | 8 | 5 | 4 | 6 | 4 | 4 | 2 | |
| Gura Portiței | 6 | 5 | 3 | 7 | 7 | 8 | 6 | 3 | 9 | 6 | 5 | 2 | |
| 2020 | Jurilovca | 1 | 4 | 1 | 2 | 4 | 6 | 2 | 1 | 1 | 5 | 5 | 10 |
| Constanța | 1 | 4 | 3 | 1 | 5 | 7 | 3 | 1 | 2 | 4 | 3 | 11 | |
| Gura Portiței | 2 | 5 | 1 | 2 | 5 | 6 | 1 | 0 | 2 | 6 | 5 | 9 | |
| p-Values: | 2010 | 2011 | 2012 | 2013 | 2014 | 2015 | 2016 | 2017 | 2018 | 2019 | 2020 |
|---|---|---|---|---|---|---|---|---|---|---|---|
| 2010 | 1 | 0.807 | 0.822 | 0.611 | 0.969 | 0.725 | 0.551 | 0.653 | 0.674 | 0.883 | 0.031 |
| 2011 | 0.807 | 1 | 0.984 | 0.792 | 0.777 | 0.914 | 0.725 | 0.837 | 0.860 | 0.922 | 0.056 |
| 2012 | 0.822 | 0.984 | 1 | 0.777 | 0.792 | 0.899 | 0.710 | 0.822 | 0.845 | 0.938 | 0.054 |
| 2013 | 0.611 | 0.792 | 0.777 | 1 | 0.584 | 0.876 | 0.930 | 0.953 | 0.930 | 0.717 | 0.100 |
| 2014 | 0.969 | 0.777 | 0.792 | 0.584 | 1 | 0.695 | 0.525 | 0.625 | 0.646 | 0.853 | 0.028 |
| 2015 | 0.725 | 0.914 | 0.899 | 0.876 | 0.695 | 1 | 0.807 | 0.922 | 0.945 | 0.837 | 0.072 |
| 2016 | 0.551 | 0.725 | 0.710 | 0.930 | 0.525 | 0.807 | 1 | 0.883 | 0.860 | 0.653 | 0.120 |
| 2017 | 0.653 | 0.837 | 0.822 | 0.953 | 0.625 | 0.922 | 0.883 | 1 | 0.977 | 0.762 | 0.089 |
| 2018 | 0.674 | 0.860 | 0.845 | 0.930 | 0.646 | 0.945 | 0.860 | 0.977 | 1 | 0.784 | 0.083 |
| 2019 | 0.883 | 0.922 | 0.938 | 0.717 | 0.853 | 0.837 | 0.653 | 0.762 | 0.784 | 1 | 0.045 |
| 2020 | 0.031 | 0.056 | 0.054 | 0.100 | 0.028 | 0.072 | 0.120 | 0.089 | 0.083 | 0.045 | 1 |
Publisher’s Note: MDPI stays neutral with regard to jurisdictional claims in published maps and institutional affiliations. |
© 2022 by the authors. Licensee MDPI, Basel, Switzerland. This article is an open access article distributed under the terms and conditions of the Creative Commons Attribution (CC BY) license (https://creativecommons.org/licenses/by/4.0/).
Share and Cite
Jitariu, V.; Dorosencu, A.; Ichim, P.; Ion, C. Severe Drought Monitoring by Remote Sensing Methods and Its Impact on Wetlands Birds Assemblages in Nuntași and Tuzla Lakes (Danube Delta Biosphere Reserve). Land 2022, 11, 672. https://doi.org/10.3390/land11050672
Jitariu V, Dorosencu A, Ichim P, Ion C. Severe Drought Monitoring by Remote Sensing Methods and Its Impact on Wetlands Birds Assemblages in Nuntași and Tuzla Lakes (Danube Delta Biosphere Reserve). Land. 2022; 11(5):672. https://doi.org/10.3390/land11050672
Chicago/Turabian StyleJitariu, Vasile, Alexandru Dorosencu, Pavel Ichim, and Constantin Ion. 2022. "Severe Drought Monitoring by Remote Sensing Methods and Its Impact on Wetlands Birds Assemblages in Nuntași and Tuzla Lakes (Danube Delta Biosphere Reserve)" Land 11, no. 5: 672. https://doi.org/10.3390/land11050672
APA StyleJitariu, V., Dorosencu, A., Ichim, P., & Ion, C. (2022). Severe Drought Monitoring by Remote Sensing Methods and Its Impact on Wetlands Birds Assemblages in Nuntași and Tuzla Lakes (Danube Delta Biosphere Reserve). Land, 11(5), 672. https://doi.org/10.3390/land11050672