Article

A Practical Assessment of Using sUASs (Drones) to Detect and Quantify Wright Fishhook Cactus (Sclerocactus wrightiae L.D. Benson) Populations in Desert Grazinglands

1
Tuscarora Field Office, Bureau of Land Management, Elko District 3900 E Idaho Street, Elko, NV 89801, USA
2
Department of Plant and Wildlife Sciences, Brigham Young University, 4105 LSB, Provo, UT 84602, USA
3
Department of Biology, Brigham Young University, 4102 LSB, Provo, UT 84602, USA
4
Richfield Field Office, Bureau of Land Management, 150 E 900 N, Richfield, UT 84701, USA
*
Author to whom correspondence should be addressed.
Land 2022, 11(5), 655; https://doi.org/10.3390/land11050655
Submission received: 19 March 2022 / Revised: 14 April 2022 / Accepted: 24 April 2022 / Published: 28 April 2022

Abstract

:
Obtaining accurate plant population estimates has been integral in listing, recovery, and delisting species under the U.S. Endangered Species Act of 1973 and for monitoring vegetation in response to livestock grazing. Obtaining accurate population estimates remains a daunting and labor-intensive task. Small unmanned aircraft systems (sUASs or drones) may provide an effective alternative to ground surveys for rare and endangered plants. The objective of our study was to evaluate the efficacy of sUASs (DJI Phantom 4 Pro) for surveying the Wright fishhook cactus (Sclerocactus wrightiae), a small (1–8 cm diameter) endangered species endemic to grazinglands in the southwest desert of Utah, USA. We assessed sUAS-based remotely sensed imagery to detect and count individual cacti compared to ground surveys and estimated optimal altitudes (10 m, 15 m, or 20 m) for collecting imagery. Our results demonstrated that low altitude flights provided the best detection rates (p < 0.001) and counts (p < 0.001) compared to 15 m and 20 m. We suggest that sUASs can effectively locate cactus within grazingland areas, but should be coupled with ground surveys for higher accuracy and reliability. We also acknowledge that these technologies may have limitations in effectively detecting small, low-growing individual plants such as the small and obscure fishhook cactus species.

1. Introduction

Since the creation of the U.S. Endangered Species Act (ESA) in 1973, identifying critical habitat and obtaining accurate population estimates of species has been an integral part of the listing, recovery, and delisting processes [1,2,3]. Originally, Congress intended that each species listed would have critical habitat designated as part of the listing process [1]. A vulnerable species can become threatened when humans collect or eradicate individuals, or when biological information regarding species requirements, conservation, or adaptations is inadequate. However, these species may also become listed when habitat is not protected and the prescribed designation of critical habitat is lacking [2,3].
In October of 1979, the U.S. Fish and Wildlife Service (USFWS) listed the Wright fishhook cactus (Sclerocactus wrightiae L.D. Benson) as endangered due to its known limited range and population size (five known populations), as well as its popularity for field collection by amateur and professional cactus collectors (i.e., threat from human take) [4]. Although range and population size are mentioned in the original listing, only a small portion of its potential habitat had been surveyed (resulting in only five known populations), and critical habitat was not defined [4,5].
The Wright fishhook cactus is a small, globose cactus endemic to the San Rafael desert of south-central Utah, USA (Figure 1). It is only readily distinguishable from its widespread relative, the small-flower fishhook cactus (Sclerocactus parviflorus Clover & Jotter), using flower and filament color. The Wright fishhook cactus has white flowers and magenta filaments as opposed to pink flowers and green filaments of the small-flower fishhook cactus [6,7]. The range of these two species often overlaps, presenting a challenge for land use agencies because the Wright fishhook cactus only flowers from late April through May, making accurate population estimates and habitat delineation particularly difficult to obtain.
Since its listing in 1979, Capitol Reef National Park (CRNP) and the Bureau of Land Management (BLM), the two agencies primarily responsible for managing federal lands where the Wright fishhook cactus is found, have invested significant resources searching for cactus populations and documenting its attributes: location, diameter, stems, reproductive effort, and disturbance by livestock grazing, primarily from cattle [8,9]. As of 2013, more than 300 Wright fishhook cactus populations had been documented on BLM and CRNP lands, expanding its potential range from only two key areas to more than 90 key areas across 128,000 ha [4,9].
Over the years, population estimates for the Wright fishhook cactus have varied dramatically. Some early surveys estimated a range-wide population as high as 50,000–100,000 individuals [9,10,11]. These estimates were dismissed by the USFWS in 2005, and a more conservative estimate of 4500–21,000 individuals was accepted [12,13]. Subsequent surveys have continued to challenge these numbers. In 2013, the BLM reported having documented over 12,000 individual cacti, and concluded that the early estimates of 50,000–100,000 individuals may have been conservative [5]. While these estimates and surveys provide valuable information, they are highly variable and required hundreds of person hours to complete. Surveys and population estimates may be vastly improved by using technologies based on small unmanned aircraft systems (sUASs or drones). These data can be used to more effectively monitor plant response to livestock grazing and trampling in sensitive environments.
sUASs present seemingly endless applications for researchers and land managers. In many ways, they represent the frontier of ecological data acquisition. Over the past decade, numerous articles have been published on the use of sUAS and object-based image analysis (OBIA) to distinguish plants or plant groups from the surrounding vegetation [14,15]. These studies principally rely on large plants, or groupings of plants, to aid in detection and identification. However, very few studies have explored the possibilities of counting small individual objects or plants, particularly in relation to livestock grazing in desert environments [16,17]. At maturity, the Wright fishhook cactus averages 4–8 cm in diameter [6,7]. Detecting and counting plants of this size using sUASs will test the limits of current technology.
In an effort to improve population estimates and aid in critical habitat designation for the Wright fishhook cactus, our study had two objectives: (1) assess the effectiveness of using sUAS-based remotely sensed imagery to conduct cactus surveys (i.e., detect and count individual cacti) relative to ground surveys and (2) determine the optimal sUAS flight altitude for conducting these remote sensing surveys. We hypothesized that sUAS-based imagery would prove an effective tool to supplement ground surveys in improving plant detection and monitoring, and that the lowest altitude flights (10 m) would provide the more accurate survey results.

2. Materials and Methods

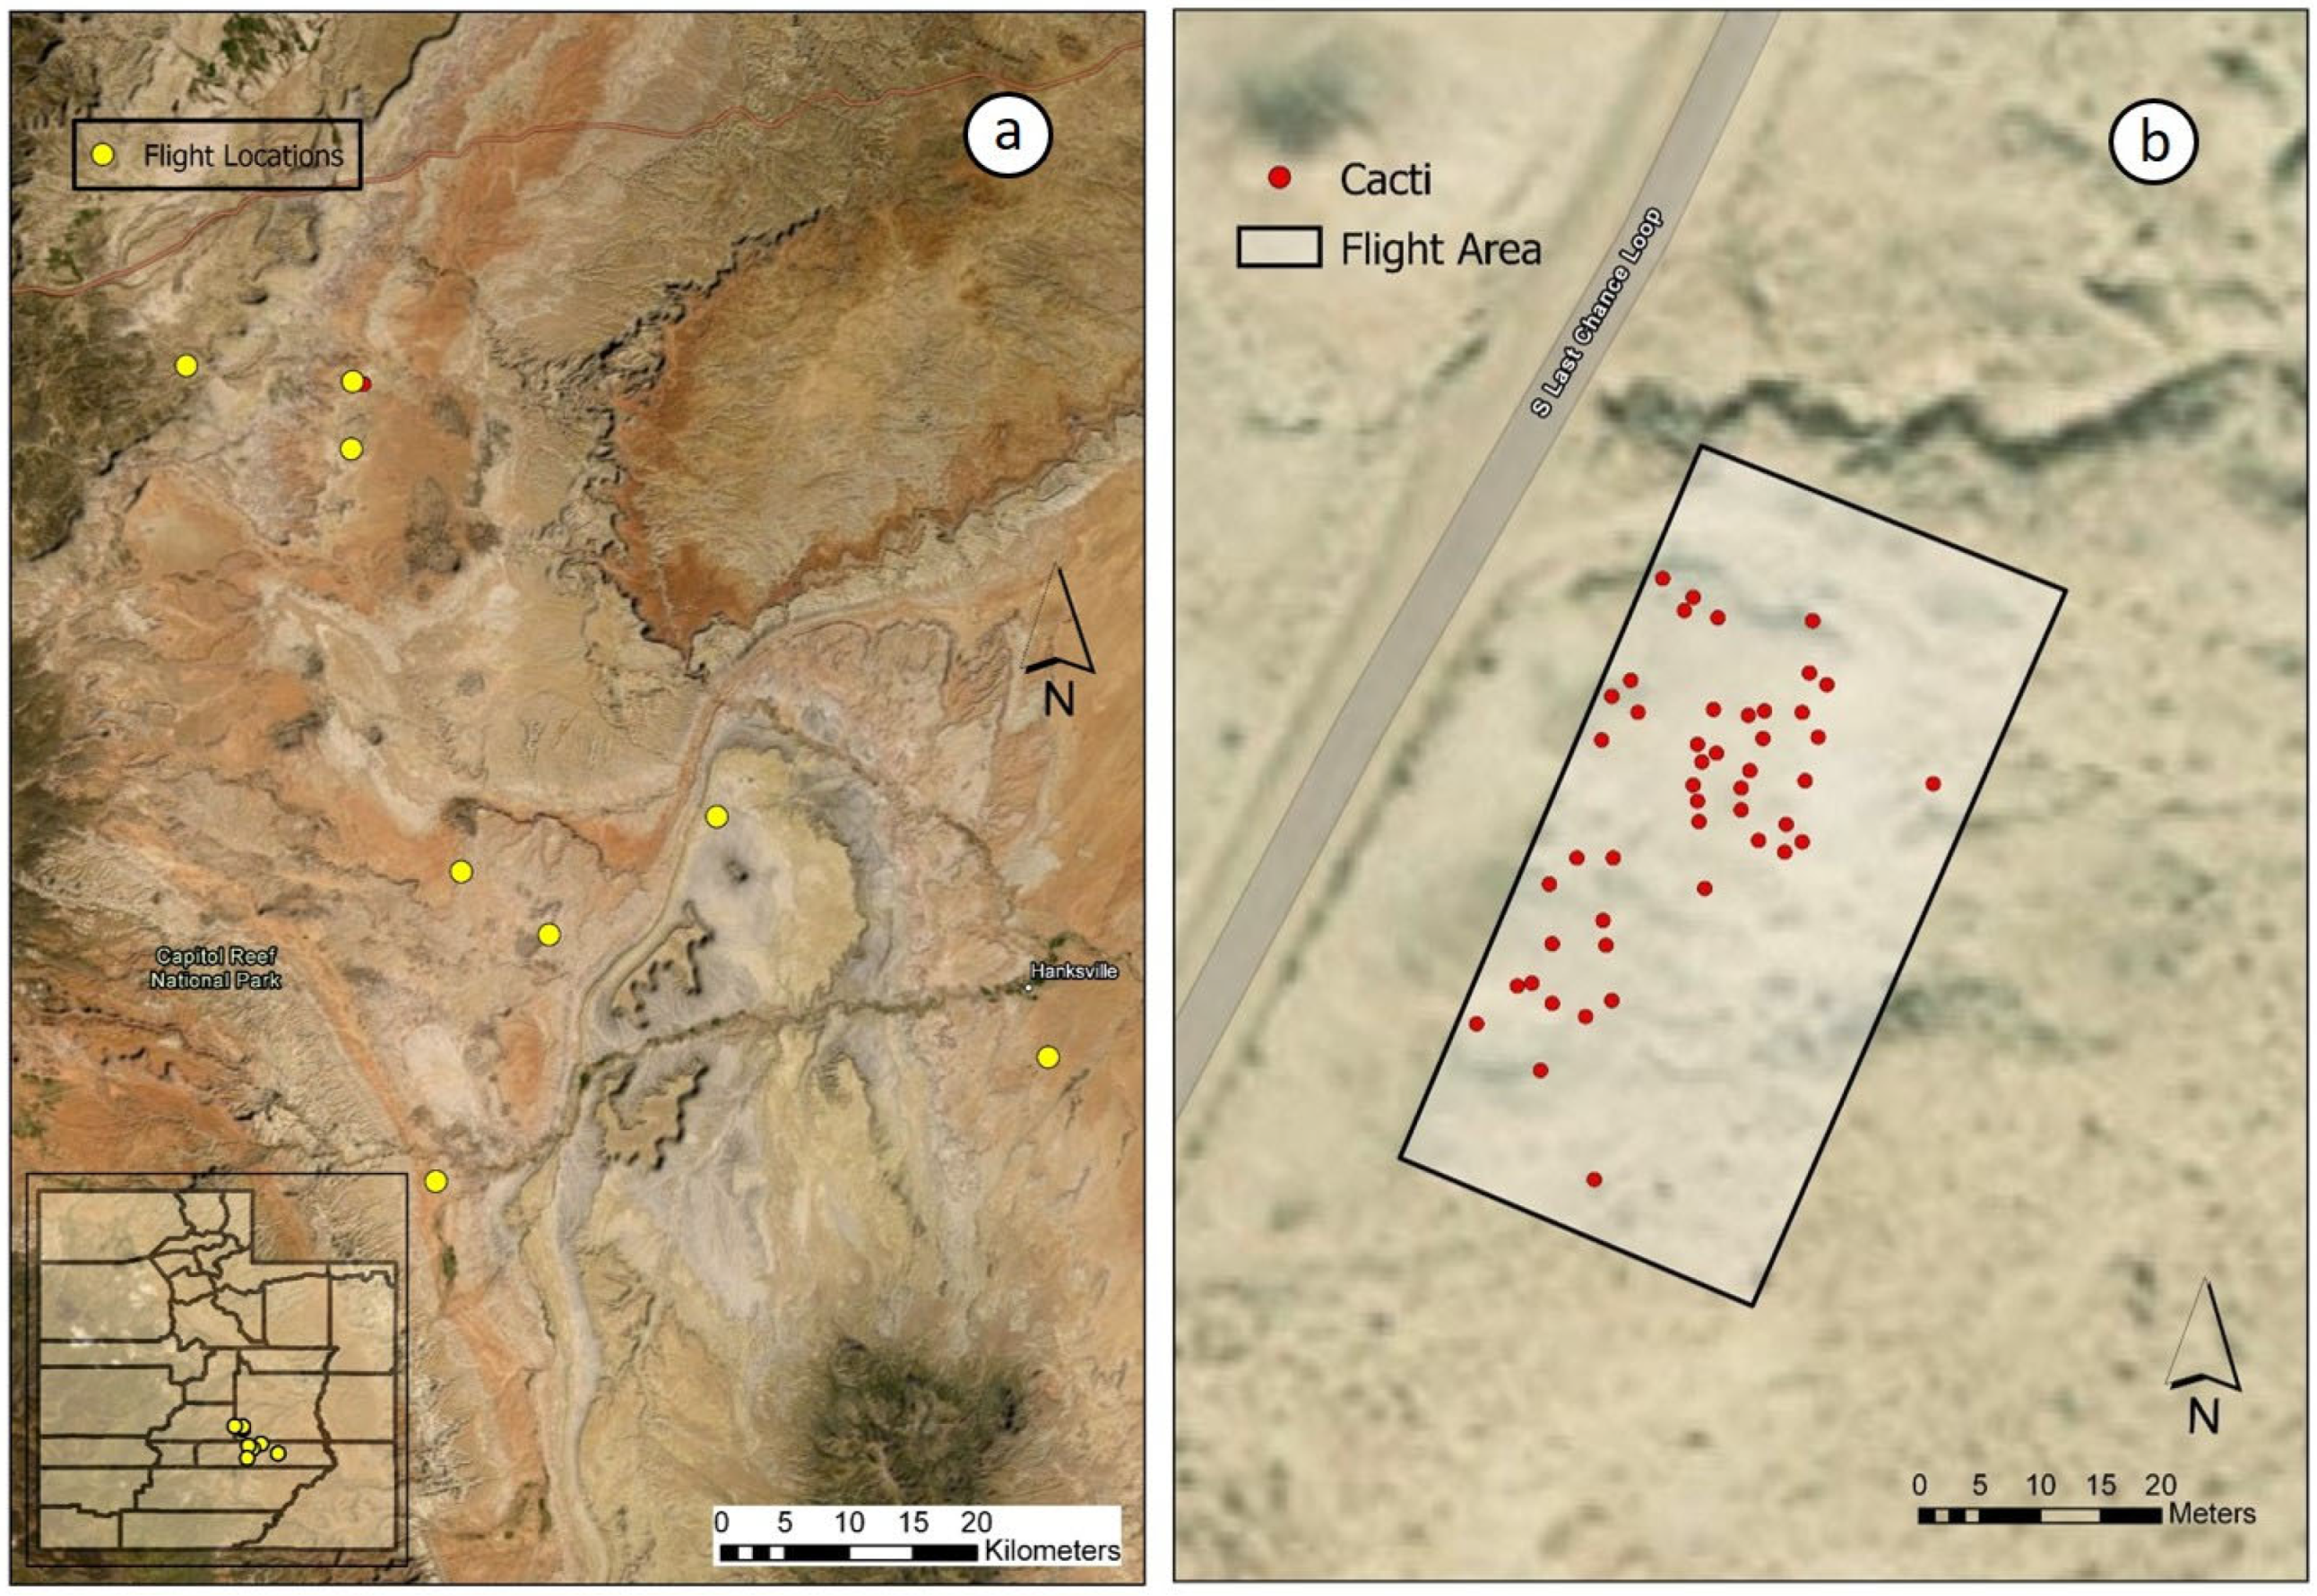
2.1. Study Area and Survey Locations

The Wright fishhook cactus is endemic to the San-Rafael Swell region of Emery, Sevier, and Wayne counties, Utah. This cactus occupies habitats ranging from 1280–2320 m in elevation and is found on several geologic formations including: Mancos Shale, Dakota, Morrison, Summerville, and Entrada [7,9]. The associated climate is arid desert with an average annual precipitation of 15.88 cm (PRISM). The Wright fishhook cactus grows in areas with low vegetative cover, where the soils are predominately sandy clay loam in texture. Some of the most common associated plant species include Gardner’s saltbush (Atriplex gardneri (Moq.) D.Dietr.), shadscale (Atriplex confertifolia (Torr. & Frém.) Wats.), mat saltbush (Atriplex corrugata S. Watson), alkali sacaton (Sporobolus airoides (Torr.) Torr.), galleta (Hilaria jamesii (Torr.) Benth.), Torrey’s ephedra (Ephedra torreyana S. Watson), Indian rice grass (Achnatherum hymenoides (Roem. & Schult.) Barkworth), prickly pears (Opuntia spp.), Russian thistle (Salsola tragus L.), and halogeton (Halogeton glomeratus (M. Bieb.) C.A. Mey.).
From 2011–2012, the BLM selected 15 sites for monitoring livestock disturbance on Wright fishhook cactus population trends. In 2018, 25 m × 50 m paired macro-plots were established at ten of these sites. Cactus populations were inventoried, and GPS coordinate locations were recorded for each cactus. Each coordinate was collected with a hand-held Trimble Juno GPS (Trimble Inc., Sunnyvale, CA, USA) coupled with WAAS enabling capabilities, providing sub-meter accuracy for all position recorded. In 2019, 20 macro-plots were randomly selected for sUAS surveys (Figure 2). Five plots were removed from the study because they lacked cactus plants, had environmental conditions not suitable for cactus establishment, or supported species other than Wright fishhook cactus. The remaining 15 macro-plots represented eight of the ten paired plot locations, and were widely distributed across cactus habitat on BLM lands ranging from 8.5 km SE of Fremont Junction, Utah (lat 38°63’ N, long 111°33’ W), to 5 km S of Hanksville, Utah (lat 38°22’ N, long 110°42’ W).

2.2. Mission Planning and Flights

Before conducting flights, we explored the possibilities of using near infrared (NIR) and Red-Green-Blue (RGB) imagery to detect Wright fishhook cacti. While some herbaceous species, including the prickly pear cactus (Opuntia sp.), were readily distinguished and classifiable within our images resulting from distinct reflectance signatures in NIR and RBG bands, the signature of Wright fishhook cacti was limited and less effective in distinguishing Wright fishhook cactus plants in both NIR and RGB images. In comparison, Atitallah et al. [18] were able to detect larger cactus plants using sUASs whereas Cerrejon et al. [19] found detection of small rare plants to be limiting. This weakness in our study is likely associated with Wright fishhook cactus morphological and surface properties including high densities of large clustered non-photosynthetic thorns, small short plant stature, dust accumulation across the plant surface, and small size of flowers in relation to the image resolution. Small flower size typically results in few, often isolated pixels that are easily confused with other surface features and are challenging to classify.
Survey flights and imagery that was utilized in this study were completed using a stock DJI Phantom 4 Pro (SZ DJI Technology Co., Ltd., Shenzhen, China) with a standard DJI RGB camera (Table 1). NIR/RGB images were obtained using a Sony Qx1 camera transported by a 3DR Solo RTF quadcopter. Each flight was programmed using the Pix4D capture application (Pix4D S.A. Lausanne, Switzerland) on an iPad:6th Gen (Apple, Cupertino, CA, USA). The iPad was then interfaced with the sUAS remote control during the flights. Each macro-plot was surveyed at three different altitudes: 10 m, 15 m, and 20 m above ground level producing images with 0.25, 0.40, and 0.55 GSD (ground sample distance (cm/pixel); resolution), respectively (Table 1; Figure 3). Due to the level aspect of the terrain and the relatively small survey areas (1250 m2), elevation models were not incorporated into flight planning.
Plots were censused on foot for cacti immediately following the three flights. Each cactus location was marked using the same GPS, and the following attributes were recorded: location (UTM), diameter (cm), number of stems, and any damage or disturbance to the plant. All flights were conducted during the peak flowering period (29 April–14 May) so that flowers could be used to aid in both ground censuses and aerial surveys.

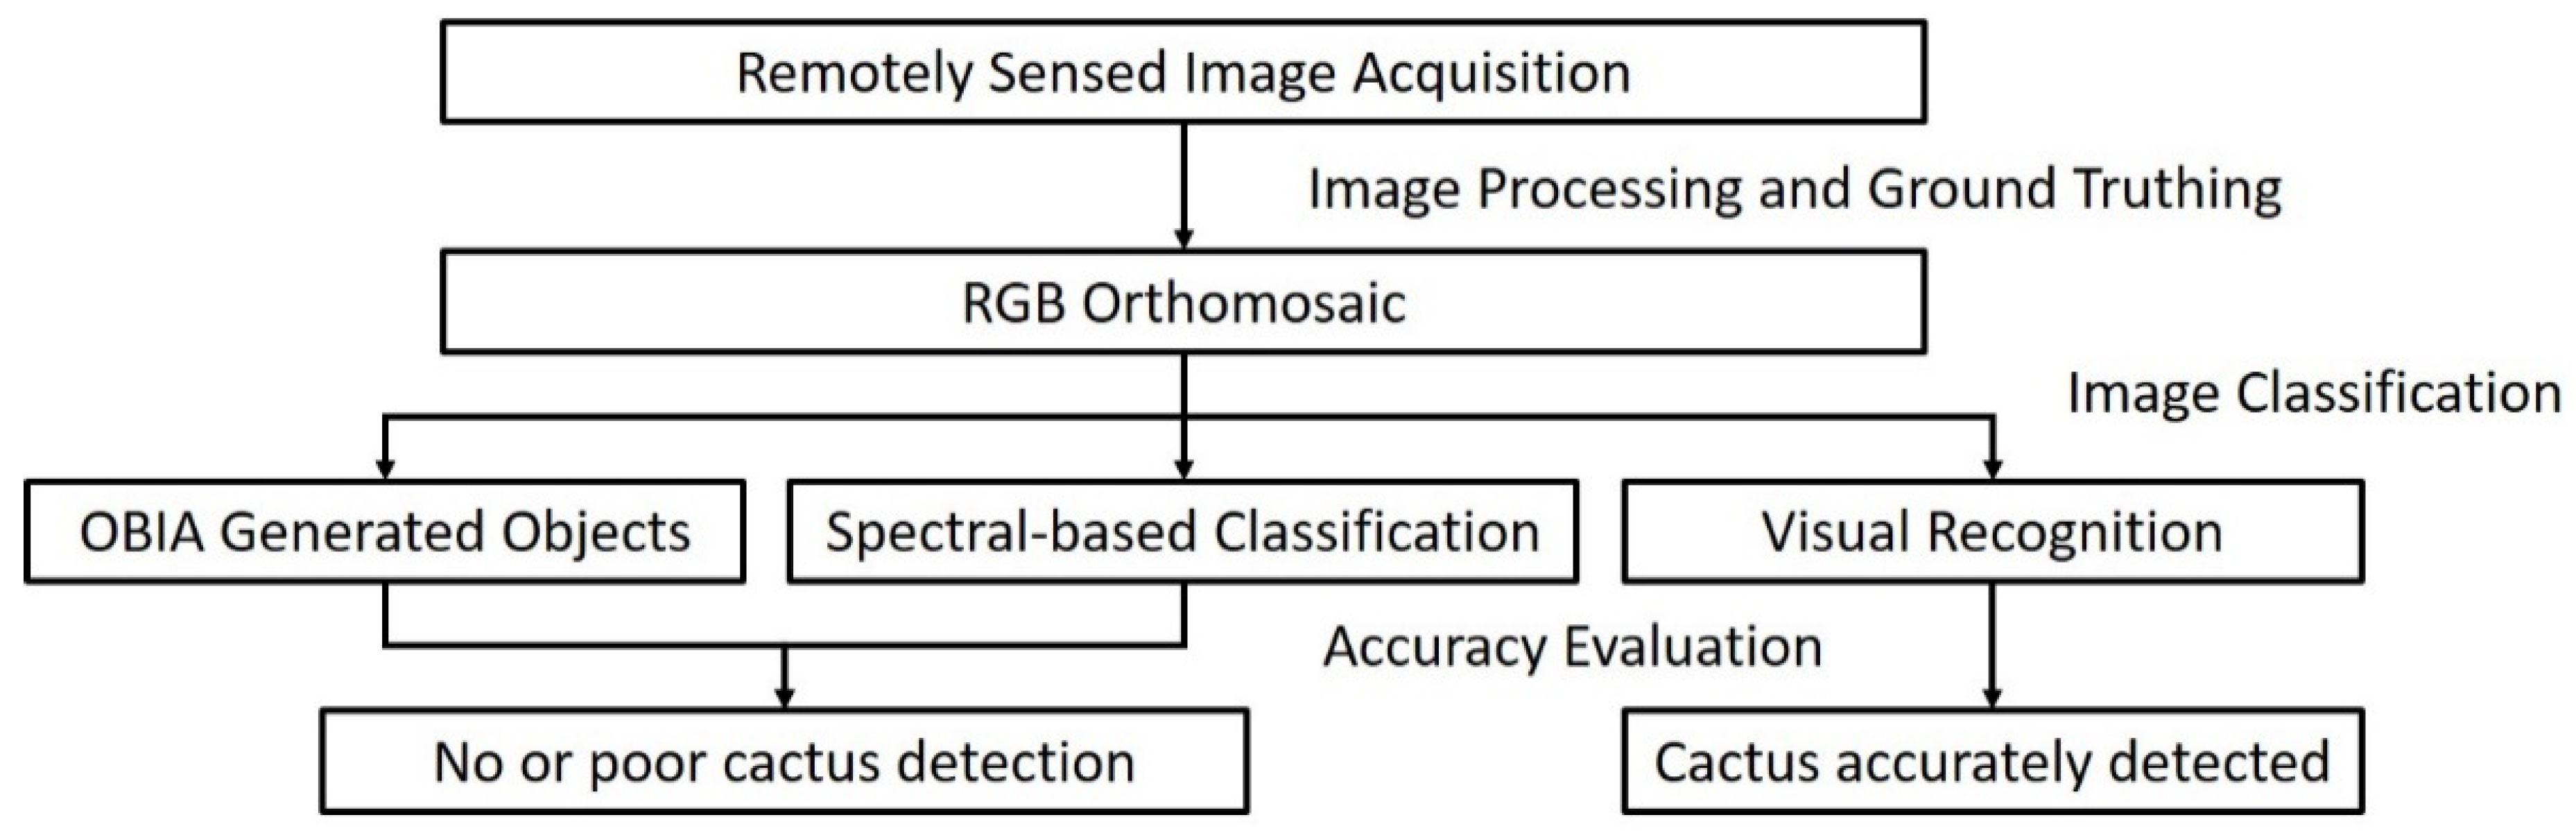
2.3. Image Processing and Ground Truthing

Flight images were stitched into an orthomosaic using Pix4D (Pix4D S.A. Lausanne, Switzerland). Images were georectified using GPS coordinate locations of distinct cactus plants in each image as ground control. Images were loaded into ArcGIS Pro where orthomasics were georectified using GPS coordinate locations of distinct cactus plants in each image as ground control. Each image was overlaid with a 1-m square grid using the “grid index features” tool and then systematically searched within grids. Each plant that was identified in the image was marked and a total count of plants was recorded. This number was compared to the ground-based measurements to determine sample accuracy.
Our original intent was to use object-based image analysis (OBIA) in eCognition (Trimble Inc., Sunnyvale, CA, USA) to identify and number the number of cacti in each image. However, following numerous attempts using OBIA and spectral classification to detect cactus plants from the surrounding environmental matrix (due to morphological and surface characteristics described previously), considering the resulting low or lack of plant detection using these methods along with low cactus densities in each study area (an average of 35 individuals per macro-plot), we determined that hand counting individuals from the images would be the optimal alternative. To accomplish this, remotely sensed images were loaded into ArcGIS Pro (Esri, Redlands, CA, USA) and clipped to the macro-plot boundaries. We then overlaid these clipped images with a 1 m2 grid to ensure a consistent search scale and thorough coverage of the entire image (Figure 3). Potential cacti were marked based on a combination of hue, circular shape, size (approximately 1–8 cm), and visible flowers or buds. Pictures from the 10 m flights, GPS locations, and descriptions of each marked cactus point were then taken to the field and verified on the ground.

2.4. Analyses

Cactus counts between the different survey altitudes and ground censuses were compared using two techniques: (1) a validation data matrix adapted from Rominger and Meyer [17] and (2) mixed effects modeling (glmer and lmer). In all analyses, 14 flights were used for analysis at each flight altitude. One of the original 15 flights was not included due to distortion caused by high winds at the time of the flight. The workflow depicting the steps we used to conduct this process is presented in Figure 4.

2.5. Validation Matrix

For the validation data matrix, all potential cacti that were marked in the images were labeled “Marked”. Each “Marked” cactus that was verified on the ground was labeled “Confirmed”. The total number of cacti that were recorded during the ground census was labeled “Actual”. Cacti that were not detected during the sUAS flights but were present on the ground were labeled “Missed”. “False Positive” were for cacti that were marked but found not to be Wright fishhook cactus, the source of commission error. The validation data matrix also included three correction terms for errors of omission (EOO), errors of commission (EOC), and net error. The purpose of the correction terms is to enable estimates of population from the number of marked individuals. These correction terms were determined using the criteria developed by Rominger and Meyer [17].
Errors of commission were defined as the percentage of cacti that were falsely identified (false positive), which increased as accurate identification decreased. Errors of omission were defined as the ratio of actual cacti to the number that were undetected. Net error can be multiplied by the net error correction term (Table 2) to obtain population estimates. Correction terms were evaluated independently for each of the different survey altitudes and were used for estimating populations from the number of marked individuals. Errors of omission will tend to lead to an underestimation of population size, so the greater the omission error, the larger the correction term should be. Errors of commission tend to lead to an overestimation of population size, so the greater the commission error, the smaller the correction term should be (a complement of the commission error). The net error correction term is the net adjustment that needs to be made to estimate population size, taking into account both errors of omission and commission (which act to cancel each other out). Thus, the correction terms are derived from the errors, but are not themselves errors as far from it in the cases of the EOC and net error correction terms.

2.6. Mixed Modeling

Generalized and linear mixed-effects regression analyses (glmer and lmer) were conducted in R [20] using packages lme4 [21], lmerTest [22], and MuMIn [23] to analyze cactus detection rates (%) and cactus counts (#) relative to flight altitude. Ime4 provides functions for fitting and analyzing mixed models, MuMln performs model selection and averaging, and ImerTest provides p-values in type I, II or III summary tables for linear mixed models. Prior to conducting linear mixed-effects regression, each cactus was assigned to one of three diametric size classes as previously defined by Kass [24]: size class 1 (≤ 2.0 cm), size class 2 (2.1 cm–4 cm), and size class 3 (4.1 cm–9 cm). Count data were transformed using the square root transformation, and detection data were transformed to the logit scale to meet the assumptions of normality and homoscedasticity. Cactus detection rates (%) and cactus counts (#) were modeled individually using Equation (1):
Rates or Counts = Altitude + Size Class + (Altitude × Size Class) + (Site)
Altitude of sUAS flight and size class were used as fixed effects while site was incorporated as a random effect to adjust for any variation due to image quality. Satterthwaite’s approximation for degrees of freedom and the differences of least squares means were used to obtain difference estimates and p-values. Generalized linear mixed effects regression analysis (glmer) was used to conduct logistic regression on the probability of detection relative to cactus diameter (cm). For this analysis, the data were configured into a binomial error structure and the following Equation (2) was applied:
Detection = Altitude + Diameter + (ID) + (Site)
Altitude and diameter were included as fixed effects, while cactus ID and site were included as random effects.

3. Results

3.1. Validation Matrix
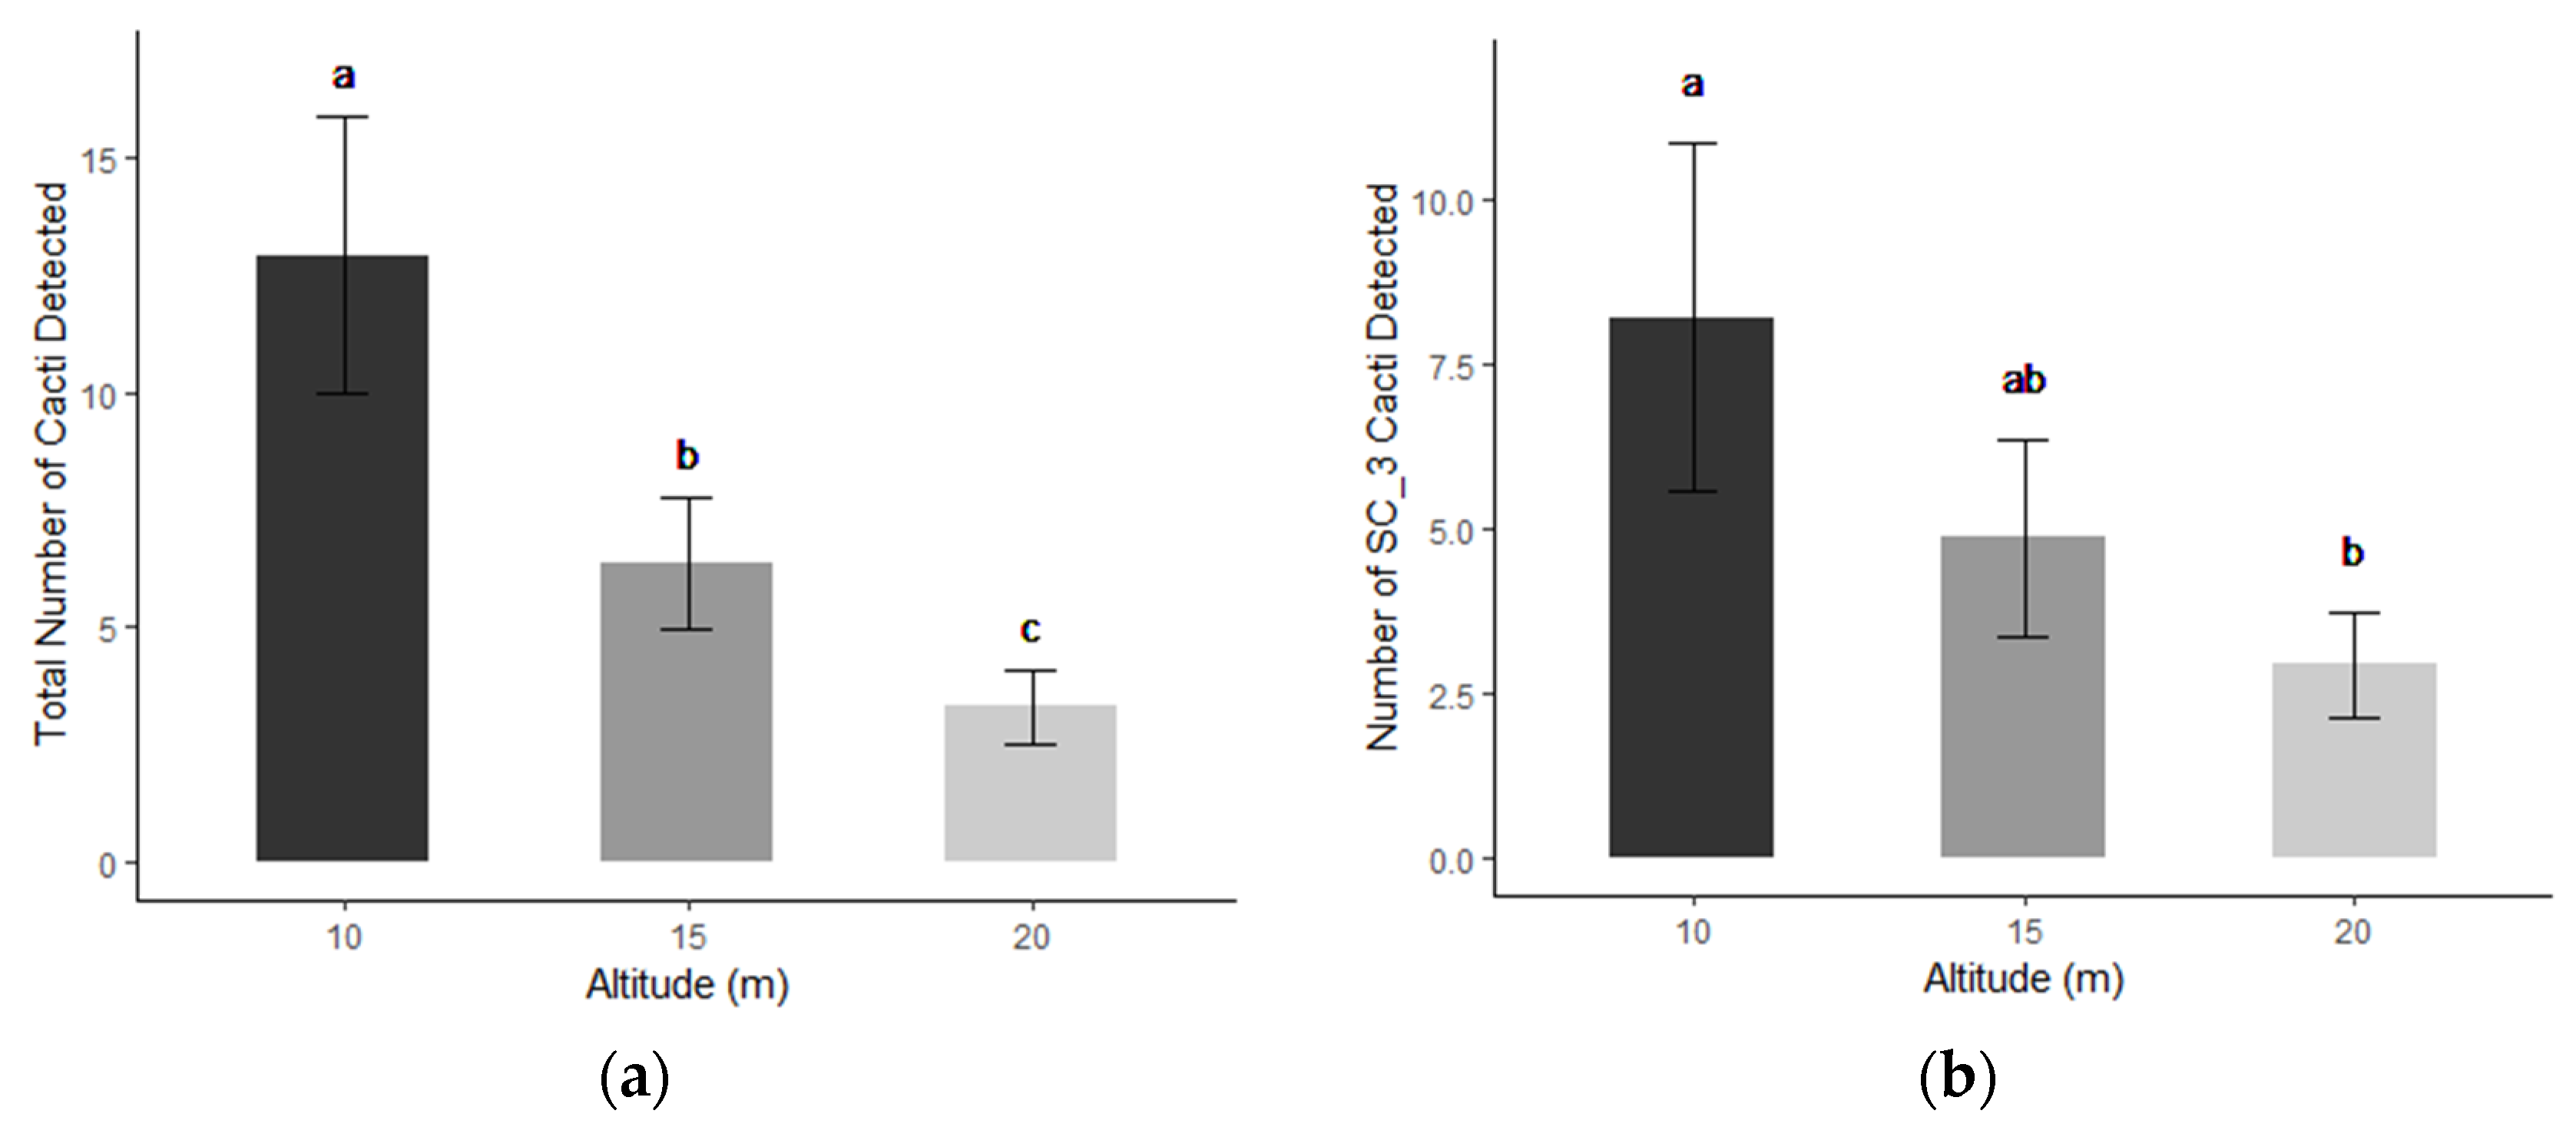
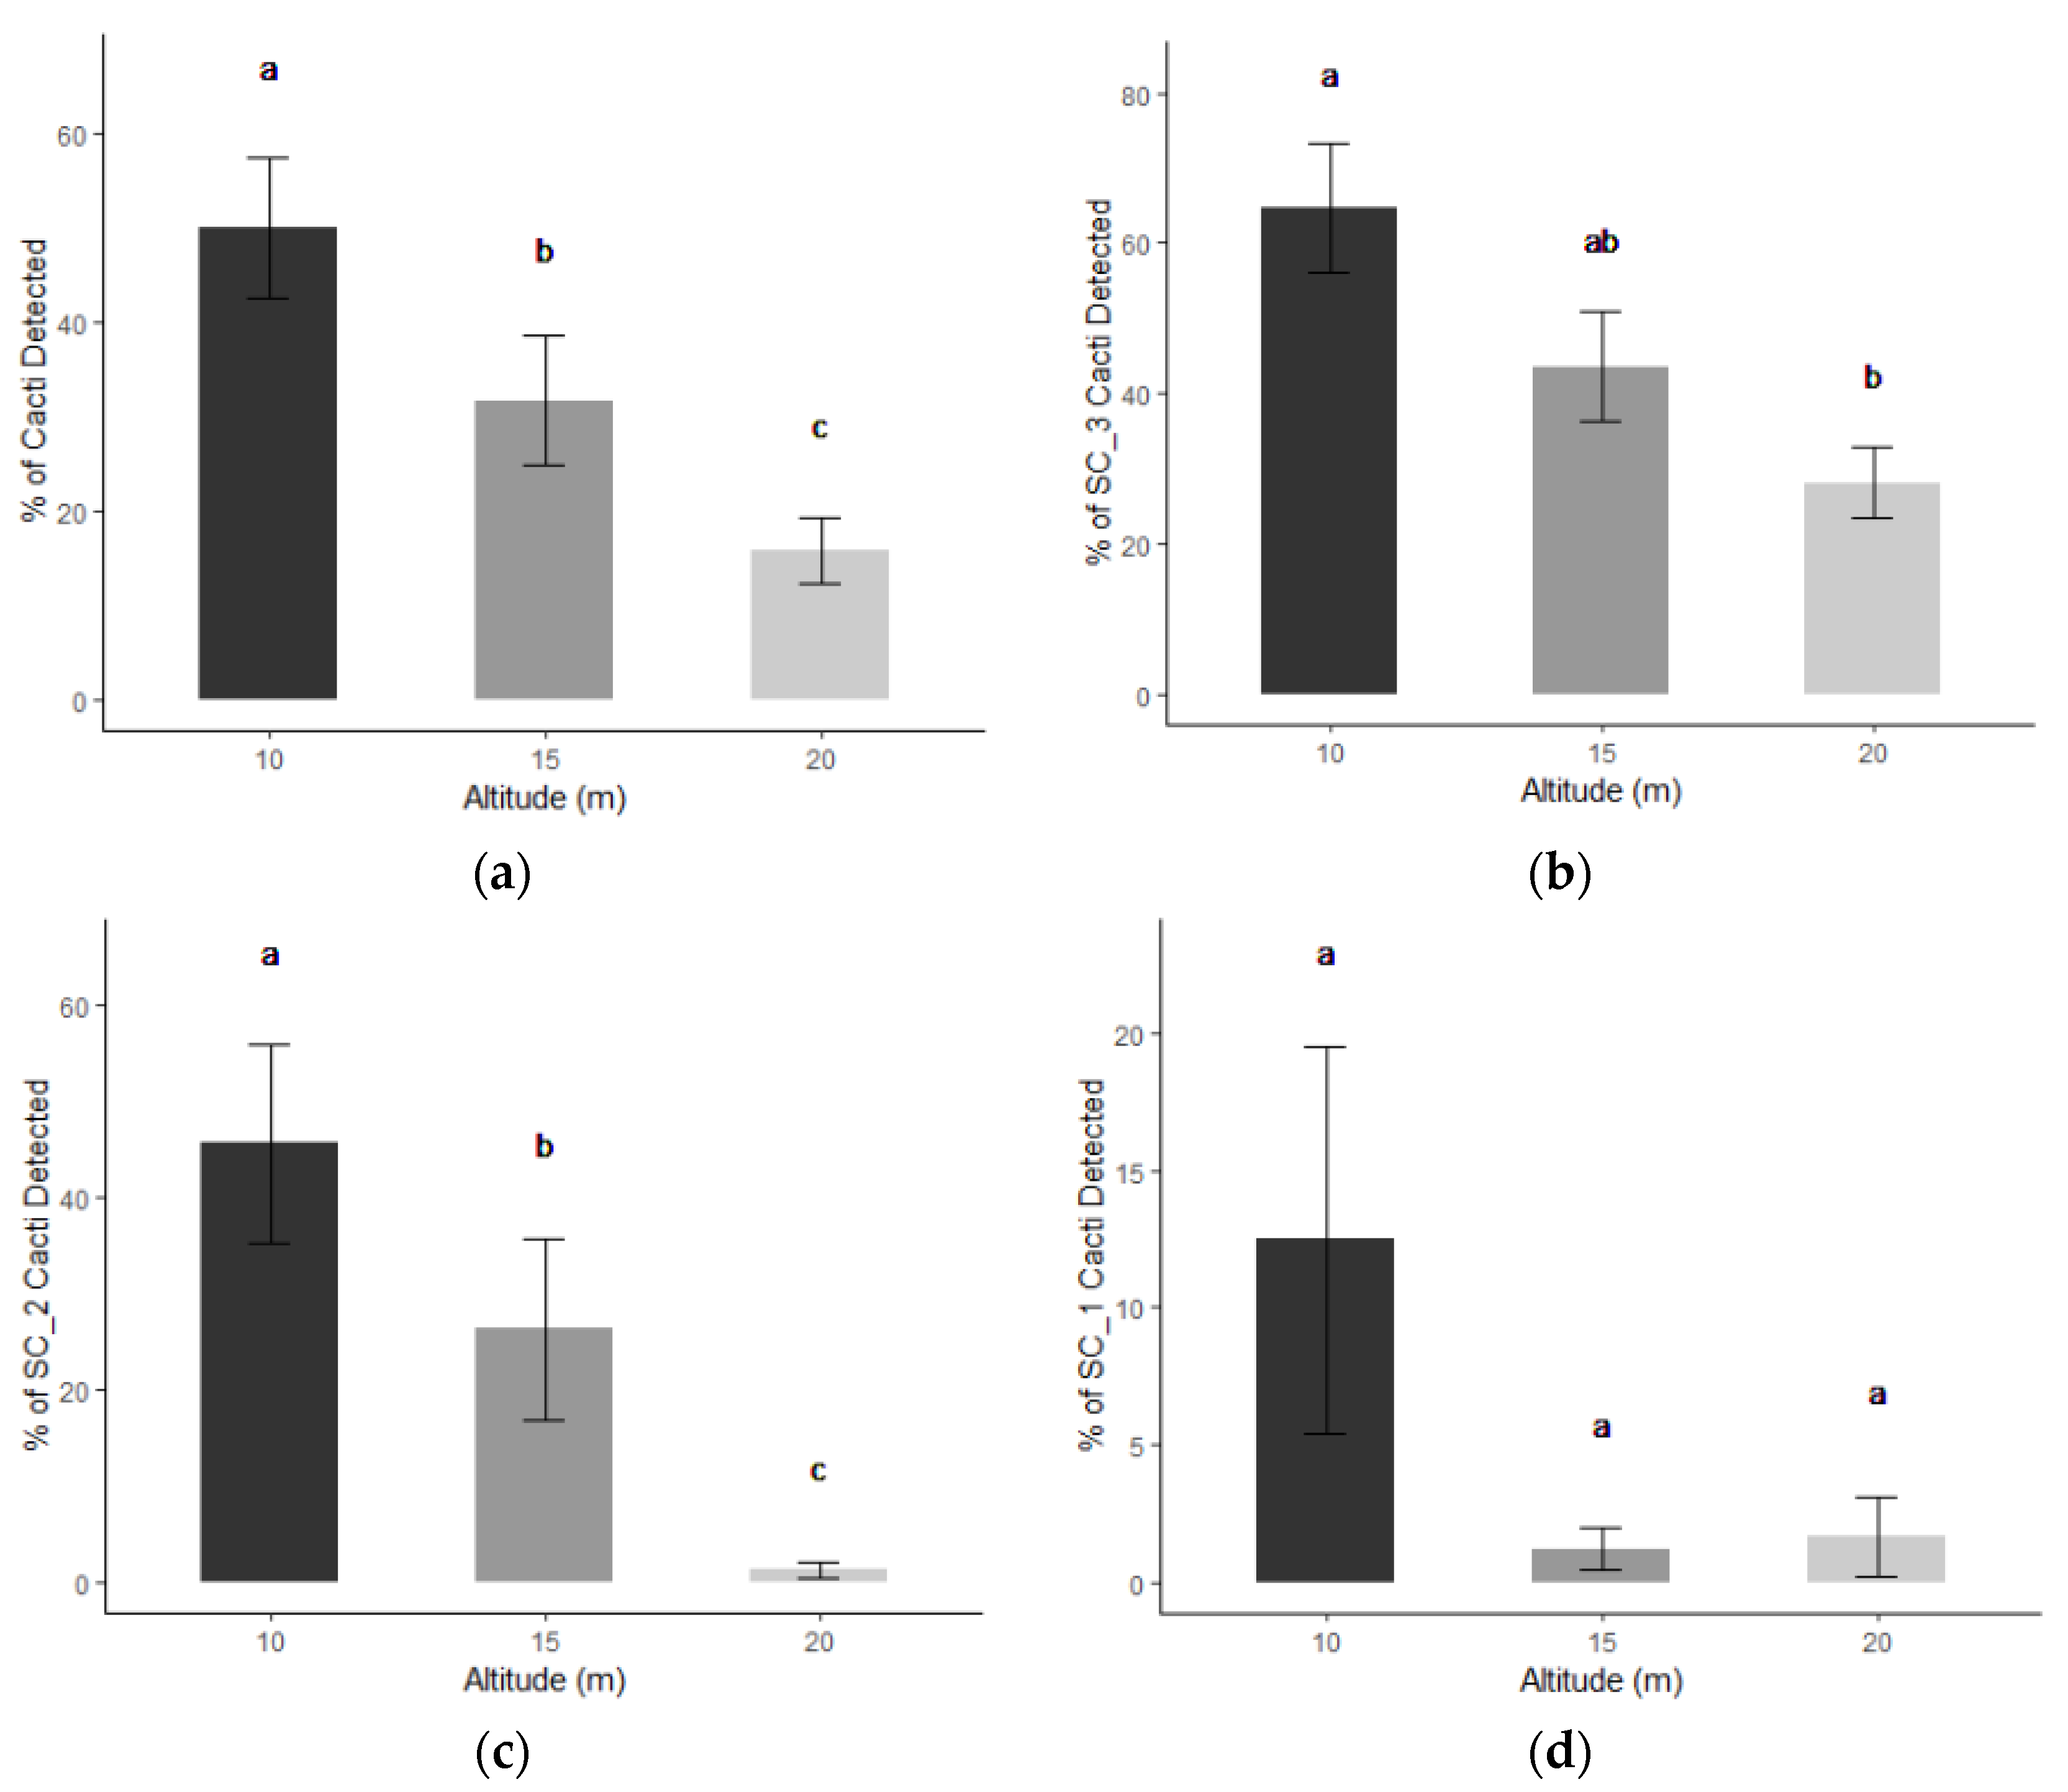
The first objective of our study was to evaluate the effectiveness of sUASs in detecting and counting cacti relative to ground censuses. From the fourteen macro-plot locations where flights were conducted, a total of 480 cacti were detected during the ground censuses (Table 2). From the 10 m flight imagery, a total of 284 objects were marked as cacti, of which 183 were confirmed to be cacti. From the 15 m flight imagery 234 objects were marked as cacti, of which only 89 were confirmed to be cacti. And from the 20 m flight imagery, 185 objects were marked, of which 46 were cacti.
The 10 m sUAS flights consistently produced the best results with the least amount of error. However, even at 10 m, 61.9% of all cacti were missed. At 15 m, 81.5% of cacti were missed, and at 20 m, 90.4% of cacti were missed. As anticipated, the commission error increased as flight altitude increased (Table 3).

3.2. Mixed Models

In support of our original hypothesis, our mixed model analysis of cactus counts and cactus detection rate (%) found that the 10 m sUAS imagery provided the best survey results (Figure 5 and Figure 6). Considering the total number of cacti detected (Figure 5a), an average of six more cacti per macro-plot were counted in the 10 m imagery than in the 15 m imagery (p < 0.001), and ten more than in the 20 m imagery (p < 0.001). For size class 3, three more cacti were counted in the 10 m imagery than in the 15 m imagery (p < 0.08), and five more than in the 20 m imagery (p < 0.002; Figure 5b). For size class 2, two more cacti were counted in the 10 m imagery than in the 15 m imagery (p < 0.02), and three more cacti were counted in the 10 m imagery than in the 20 m imagery (p < 0.001; Figure 5c). For size class 1, there were no differences in cactus detection between all three altitudes (p < 0.17; Figure 5d).
Our analysis of total cactus detection rate (%) found that, on average, 17% more cacti were detected in the 10 m imagery than in the 15 m (p < 0.001) and 31% more than in the 20 m (p < 0.001; Figure 6a). For size class 3, 21% (p < 0.05) more cacti were detected in the 10 m imagery than in the 15 m imagery, and 37% (p < 0.001) more than in the 20 m imagery (Figure 6b). For size class 2, 19% more cacti (p < 0.03) were detected in the 10 m imagery than in the 15 m imagery, and 44% more cacti (p < 0.001) were detected in the 10 m imagery than in the 20 m imagery (Figure 6c). For size class 1, there was no significant difference between detection rates at the different flight altitudes (p < 0.10; Figure 6d).
When we used logistic regression to analyze the probability of detection as a function of diameter, all factors were found to be significant. When the flight altitude increased from 10 m to 15 m, the log odds probability of detection decreased by 2.66 log units (p < 0.001). When flight altitude increased from 10 m to 20 m, the log odds probability of detection decreased by 4.46 log units (p < 0.001). For every 1 cm increase in diameter, the log odds probability of detection increased by 1.27 log units (p < 0.001; Figure 7).

4. Discussion

The application of sUAS technology in our study has demonstrated that small, low-growing, and relatively obscure Wright fishhook cactus plants can be detected using very high resolution sUAS imagery. Similar studies have found similar capabilities, suggesting that sUAS can be used to identify and classify small plants using sUAS technology [15,17,25]. Although we were unable to locate all of the individual plants in our study area using remotely sensed imagery, we found that we could detect a large number of individual Wright fishhook cactus plants, improving the efficacy of monitoring and managing these plant populations along with ground-based surveys in both undisturbed and disturbed grazingland areas. While our study found that ground-based measurements can be highly effective in locating Wright fishhook cactus plants, remote sensing technology may be a useful first assessment approach for locating plants, particularly in areas where cacti may be suspected but have not yet been identified. Additionally, we used standard and relatively inexpensive sUAS and camera technology (DJI Phantom 4 Pro with 20 MP camera) to obtain images used for locating plants and classifying images. This suggests that this readily available technology and sUAS platforms can provide imagery that effectively facilitates the identification and mapping of individual cactus plants, potentially facilitating population-level monitoring.
In our study, lower elevation flights (10 m) produced images that had higher detection potential than higher elevation flights (15 m, 20 m), likely due to the higher resolution and improved image clarity. While accuracy in detection was increased, the amount of time required to cover the study area was also greater. To cover the flight areas of 1250 m2, sUAS surveys at 10 m took an average of 13 min to complete, while flights at 15 m took only 6 min, and flights at 20 m took only 4 min. The average battery life for the DJI Phantom 4 Pro is typically approximately 20 min. The short battery life of many quad motor sUAS types can make large-scale mapping and inventory challenging. Determining the true optimal flight altitude would largely depend on the size of area to be surveyed, time constraints, and the acceptable level of error. For an area of 1250 m2, 10 m was clearly the optimal altitude for conducting sUAS surveys. As this technology and battery capabilities improve, the efficacy of sUAS should similarly improve.
The reliability of our sUAS collected data were less reliable than our ground surveys; however, we identified numerous benefits and applications for their use to improve detection and monitoring, especially over large extents. The counts obtained from the imagery can be multiplied by the net error term (Table 2) to obtain population estimates. Thus, if high accuracy count data is not requisite, sUASs could be used to obtain numerous images during the relatively short flowering period and then analyzed during the non-flowering period (increasing sampling efficiency). Cacti were also discernable in all flight altitudes indicating sUASs may be of use in finding new populations; however, these images were taken in areas where Wright fishhook cactus was known to occur. In areas where plants may or may not be known, detection rates could be lower. For rare and endangered plant species, this technology can reduce human disturbance in these often fragile environments by removing the need to walk among plants [17]. Improvement in image classification software toward high resolution imagery would likely significantly reduce processing time and would increase the practicality of using sUAS in rare plant surveys. While we created the error terms for the images we acquired for this study, the accuracy can be further tested with other images for cross validation.
While sUASs have been successfully used to measure vegetation structure, it is important to acknowledge that these technologies still have limitations, such as the height at which a sUAS is flown to collect data which has a direct influence on image resolution. The results of our study found that cactus plants were more difficult to identify from higher altitude drone flights (where GSD > 0.25 cm) indicating the importance of obtaining very high resolution images for quantifying Wright fishhook cactus populations. While the process of using sUASs to locate plants (flights, image preparation, processing) can be time consuming, with experience and improvements in software and computer processing, these techniques have the potential of efficiently locating fishhook cactus on desert grazinglands. This approach can improve initial site investigation for locating plants across desert landscapes and provide a valuable tool for monitoring cactus populations over time. Additionally, the correct identification of Wright fishhook cactus from its overlapping congener, small-flower fishhook cactus, is essential in correctly monitoring population densities of each species. We recommend accounting for this differentiation by obtaining images during each species’ specific flowering period, classifying images that account for flower color, and including field verification to ensure species are identified correctly.

5. Conclusions

We found that sUASs can be used to improve the detection and capacity for monitoring the endangered Wright fishhook cactus. Although our detection rates varied based on cactus size and image resolution, we believe that sUAS-based imagery can provide land managers with an additional or alternative resource for finding new cactus populations, preventing potential disturbance while conducting ground-based surveys, tracking cactus populations over time, and obtaining rough population estimates. As sUAS and remote sensing technologies improve, we suggest that advancements will continue to be made that enhance livestock management and grazinglands conservation. While sUASs certainly has potential to improve the quality and accuracy of vegetative surveys, we also recognize that these tools should optimally be used in conjunction with ground-based surveys used to ensure reliability, accuracy, and consistency of land management activities and grazing improvements.

Supplementary Materials

The following are available online at https://www.mdpi.com/article/10.3390/land11050655/s1. These include File S1: Validation Data; File S2: Raw data for detection rates and counts; File S3: Raw data for probability of detection.

Author Contributions

Conceptualization, T.H.B., V.J.A. and S.L.P.; methodology, T.H.B., V.J.A., R.L.J., L.A. and S.L.P.; software, T.H.B. and S.L.P.; validation, T.H.B., V.J.A. and D.R.; formal analysis, T.H.B., V.J.A., L.A. and S.L.P.; investigation, T.H.B. and D.R.; resources, V.J.A. and D.R.; data curation, T.H.B., V.J.A. and D.R.; writing—original draft preparation, T.H.B. and V.J.A.; writing T.H.B., review and editing, V.J.A., R.L.J., L.A. and S.L.P.; visualization, T.H.B. and V.J.A.; supervision, V.J.A. and D.R.; project administration, V.J.A.; funding acquisition, V.J.A. and D.R. All authors have read and agreed to the published version of the manuscript.

Funding

This research was funded by The Bureau of Land Management, grant number L18AC00042 and Brigham Young University. The APC was funded by Brigham Young University.

Institutional Review Board Statement

Not applicable.

Informed Consent Statement

Not applicable.

Data Availability Statement

Not applicable.

Acknowledgments

We would like to thank the anonymous reviewers and the editor for providing valuable suggestions and comments, which have greatly improved this manuscript. We would also like to thank our field technician Scott Duncan for his invaluable assistance.

Conflicts of Interest

The authors declare no conflict of interest.

References

  1. Hagen, A.N.; Hodges, K.E. Resolving Critical Habitat Designation Failures: Reconciling Law, Policy. Soc. Cons. Bio. 2006, 20, 399–407. [Google Scholar] [CrossRef] [PubMed]
  2. USFWS (U.S. Fish and Wildlife Service). Endangered and Threatened Wildlife and Plants: Notice of Intent to Clarify the Role of Habitat in Endangered Species Conservation. Department of the Interior Fish and Wildlife Service. Fed. Regist. 1999, 64, 31871–31874. [Google Scholar]
  3. USESA. Endangered Species Act of 1973, as Amended through the 100th Congress; United States Fish and Wildlife Service, United States Department of the Interior: Washington, DC, USA, 1973.
  4. USFWS. Endangered and Threatened Wildlife and Plants: Determination That the Purple-Spined Hedgehog Cactus and Wright Fishhook Cactus Are Endangered Species. Rules and Regulations Department of the Interior Fish and Wildlife Service 50 CPFI Part 17. Fed. Regist. 1979, 44, 58866–58868. [Google Scholar]
  5. BLM (Bureau of Land Management). Three-Year Summary Report 2011–2013 Initial and Repeat Inventory for Wright Fishhook Cactus (Sclerocactus wrightiae); Unpublished Agency Report; Field Office: Richfield, UT, USA, 2013.
  6. Benson, L.D. Cactaceae Emery Co., San Rafael Ridge (A Revision of Sclerocactus). Cactus Succulence J. 1966, 38, 55–57. [Google Scholar]
  7. Welsh, S.L.; Atwood, N.D.; Goodrich, S.; Higgins, L.C. A Utah Flora, 3rd ed.; Brigham Young University: Provo, UT, USA, 2003; pp. 77–79. ISBN 978-08-4252-701-9. [Google Scholar]
  8. BLM. Monitoring Plan for Wright Fishhook Cactus (Sclerocactus wrightiae) on BLM Lands in Emery, Sevier and Wayne Counties, Utah; Unpublished Agency Report; Field Office: Richfield, UT, USA, 2015. [Google Scholar]
  9. Spector, T. Impacts to Federally Listed Cacti Species from Livestock on the Colorado Plateau in Utah: A Review and Summary; Unpublished Agency Report; Utah Field Office, Ecological Services, U.S. Fish and Wildlife Service: West Valley, UT, USA, 2013.
  10. Neese, E. Final Report Habitat Inventory of Sclerocactus wrightiae and Other Associated Sensitive Species; Unpublished Agency Report; Bureau of Land Management, Richfield Field Office: Richfield, UT, USA, 1987.
  11. Kass, R.J. Final Report of Habitat Inventory of Threatened, Endangered and Candidate Plant Species in the San Rafael Swell, Utah; Unpublished Agency Report; Bureau of Land Management, Utah State Office: Logan, UT, USA, 1990.
  12. USFWS. Endangered and Threatened Wildlife and Plants: 90-Day Finding on a Petition to Delist Sclerocactus wrightiae (Wright Fishhook Cactus) and initiation of a 5-Year Status Review. Department of the Interior Fish and Wildlife Service 50 CFR Part 17. Fed. Regist. 2005, 70, 44544–44546. [Google Scholar]
  13. Clark, D.J. Survey Results for Wright Fishhook Cactus (Sclerocactus wrightiae); Unpublished Agency Report; National Park Service, Capitol Reef National Park; Bureau of Land Management, Richfield Field Office: Richfield, UT, USA, 2001.
  14. Hulet, A.; Roundy, B.A.; Petersen, S.L.; Jensen, R.R.; Bunting, S.C. Assessing the Relationship between Ground Measurements and Object-Based Image Analysis of Land Cover Classes in Pinyon and Juniper Woodlands. Photogramm. Eng. Remote Sens. 2013, 79, 799–808. [Google Scholar] [CrossRef]
  15. Tay, J.Y.L.; Erfmeier, A.; Kalwij, J.M. Reaching new heights: Can drones replace current methods to study plant population dynamics? Plant Ecol. 2018, 219, 1139–1150. [Google Scholar] [CrossRef]
  16. Martin, J.; Edwards, H.H.; Burgess, M.A.; Percival, H.F.; Fagan, D.E.; Gardner, B.E.; Ortega-Ortiz, J.G.; Ifju, P.G.; Evers, B.S.; Rambo, T.J. Estimating Distribution of Hidden Objects with Drones: From Tennis Balls to Manatees. PLoS ONE 2012, 7, e38882. [Google Scholar] [CrossRef] [PubMed]
  17. Rominger, K.; Meyer, S.E. Application of UAV-Based Methodology for Census of an Endangered Plant Species in a Fragile Habitat. Remote Sens. 2019, 11, 719. [Google Scholar] [CrossRef] [Green Version]
  18. Atitallah, S.B.; Driss, M.; Boulila, W.; Koubaa, A.; Atitallah, N.; Ghezala, H.B. An enhanced randomly initialized convolutional neural network for columnar cactus recognition in unmanned aerial vehi-cle imagery. Computer Science–Computer Vision and Pattern Recognition. arXiv 2021, arXiv:2015.04430. [Google Scholar]
  19. Cerrejón, C.; Valeria, O.; Marchand, P.; Caners, R.T.; Fenton, N.J. No place to hide: Rare plant detection through remote sensing. Divers. Distrib. 2021, 27, 948–961. [Google Scholar] [CrossRef]
  20. R Core Team. A Language and Environment for Statistical Computing; R Core Team: Vienna, Austria, 2018. [Google Scholar]
  21. Bates, D.; Maechler, M.; Bolker, B.; Walker, S. Fitting linear mixed-effects models using lme4. arXiv 2014, arXiv:1406.5823. [Google Scholar]
  22. Kuznetsova, A.; Brockhoff, P.B.; Christensen, R.H.B. lmerTest Package: Tests in linear mixed effects models. J. Stat. Softw. 2017, 82, 1–26. [Google Scholar] [CrossRef] [Green Version]
  23. Barton, K. MuMIn: Multi-Model Inference, R Package Version 0.12.0. Available online: http://r-forge.r-project.org/projects/mumin/ (accessed on 1 January 2020).
  24. Kass, R.J. Mortality of the endangered Wright fishhook cactus (Sclerocatus wrightiae) by an Opuntia-borer beetle (Cerambycidae: Moneilema semipunctatum). West N. Am. Nat. 2001, 61, 495–497. [Google Scholar]
  25. Cruzan, M.B.; Weinstein, B.G.; Grasty, M.R.; Kohrn, B.F.; Hendrickson, E.C.; Arredondo, T.M.; Thompson, P.G. Small Unmanned Aerial Vehicles (Micro-Uavs, Drones) in Plant Ecology. App. Plant Sci. 2016, 4, 1600041. [Google Scholar] [CrossRef] [PubMed]
Figure 1. (a) Example of habitat type where Wright fishhook (Sclerocactus wrightiae) cacti occur; (b) a mature Wright fishhook cactus in flower.
Land 11 00655 g001
Figure 2. (a) Flight locations; (b) enlarged map of a flight area (macro-plot) within a single flight location. Plots are all located in southcentral Utah, USA (see inset map).
Land 11 00655 g002
Figure 3. Example of 1 m2 search scale at each sUAS flight altitude. Two size class 3 (>4.1 cm) individuals in flower are contained in each image: (a) 10 m (0.25 cm GSD); (b) 15 m (0.40 cm GSD); (c) 20 m (0.55 GSD).
Land 11 00655 g003
Figure 4. Workflow for identifying the occurrence of Wright fishhook cactus using sUAS-based remote sensing imagery.
Land 11 00655 g004
Figure 5. Mean number of counted Wright fishhook cacti per flight area (macro-plot) ± standard error of the mean by flight altitude (m). Means with common letters do not differ (p > 0.05): (a) Total (b) Size Class 3 cacti; (c) Size Class 2 cacti; (d) Size Class 1 cacti (See Supplemental File S2 for full dataset).
Land 11 00655 g005aLand 11 00655 g005b
Figure 6. Mean percent of detected Wright fishhook cacti (total and by size class) ± standard error of the mean by flight altitude (m). Means with common letters do not differ (p > 0.05): (a) Total (b) Size Class 3 cacti; (c) Size Class 2 cacti; (d) Size Class 1 cacti (See Supplemental File S2 for full dataset).
Land 11 00655 g006
Figure 7. Probability of detection of Wright fishhook cacti ± standard error of the mean as a function of flight altitude (m) (See Supplemental File S3 for full dataset).
Land 11 00655 g007
Table 1. Specifications of the instruments, imagery, and flight parameters of sUAS equipment used to identify and classify Wright fishhook cactus in this study.
AttributeSpecification
AircraftDJI Phantom 4 Pro
SensorDJI 20MP RGB camera
Camera TypeFrame
FOV (degree)84
Aperture (F-stop)f/2.8–f/11
Flight Height10 m, 15 m, 20 m
Image Resolution (GMD)0.25 cm, 0.40 cm, 0.55 cm
Image side-lap80%
Table 2. Validation data matrix for sUAS imagery designed using a structure similar to Rominger and Meyer [17]. sUAS imagery was obtained from flights (n = 14) conducted at 10 m, 15 m, and 20 m AGL. Potential cacti were marked at each of these altitudes and then verified in the field. Results were then compared against ground census surveys. Correction terms are expressed as mean values ± the standard error of the mean (See Supplemental File S1 for full dataset).
sUAS ImageryTotal Cactus Counts
HeightMarkedConfirmedMissedActual
10 m 284183297480
15 m23489391480
20 m18546434480
Table 3. Validation data matrix for sUAS imagery adapted from Rominger and Meyer [17]. sUAS imagery was obtained from flights (n = 14) conducted at 10 m, 15 m, and 20 m AGL. Commission error can be considered as false positives, 1 Confirmed = (Confirmed/Marked) × 100 (calculated as the mean of plot values); 2 Missed = (Missed/Actual) × 100 (calculated as mean of plot values); 3 EOC = Error of commission correction term = Percent confirmed/100; 4 EOO = Error of omission correction term = Actual/Confirmed; 5 Net Error Correction Term = EOC × EOO = Actual/Marked (calculated as mean of plot values).
sUASCommissionConfirmed 1Missed 2Correction Terms
ImageryError (%)(%)(%)EOC 3EOO 4Net Error 5
10 m35.364.761.90.647 ± 0.0492.81 ± 0.581.62 ± 0.202
15 m58.441.681.50.416 ± 0.0596.18 ± 1.432.14 ± 0.486
20 m73.426.690.40.266 ± 0.04713.71 ± 3.782.52 ± 0.433
Publisher’s Note: MDPI stays neutral with regard to jurisdictional claims in published maps and institutional affiliations.

