Article

Use of Geographically Weighted Regression (GWR) to Reveal Spatially Varying Relationships between Cd Accumulation and Soil Properties at Field Scale

1
College of Geography and Environmental Science, Henan University, Kaifeng 475004, China
2
Henan Engineering Research Center for Control & Remediation of Soil Heavy Metal Pollution, Henan University, Kaifeng 475004, China
3
Henan Key Laboratory of Earth System Observation and Modeling, Henan University, Kaifeng 475004, China
4
School of Economics, Henan University, Jinming District, Kaifeng 475004, China
*
Author to whom correspondence should be addressed.
Land 2022, 11(5), 635; https://doi.org/10.3390/land11050635
Submission received: 24 March 2022 / Revised: 22 April 2022 / Accepted: 24 April 2022 / Published: 26 April 2022

Abstract

:
The spatial variation of correlation between Cd accumulation and its impact factors plays an important role in precise management of Cd contaminated farmland. Samples of topsoils (n = 247) were collected from suburban farmland located at the junction of the Yellow River Basin and the Huaihe River Basin in China using a 200 m × 200 m grid system. The total and available contents of Cd (T-Cd and A-Cd) in topsoils were analyzed by ICP-MS, and their spatial distribution was analyzed using kriging interpolation with the GIS technique. Geographically weighted regression (GWR) models were applied to explore the spatial variation and their influencing mechanisms of relationships between major environmental factors (pH, organic matter, available phosphorus (A-P)) and Cd accumulation. Spatial distribution showed that T-Cd, A-Cd and their influencing factors had obvious spatial variability, and high value areas primarily cluster near industrial agglomeration areas and irrigation canals. GWR analysis revealed that relationships between T-Cd, A-Cd and their environmental factors presented obvious spatial heterogeneity. Notably, there was a significant negative correlation between soil pH and T-Cd, A-Cd, but with the increase of pH in soil the correlation decreased. A novel finding of a positive correlation between OM and T-Cd, A-Cd was observed, but significant positive correlation only occurred in the high anthropogenic input area due to the complex effects of organic matter on Cd activity. The influence intensity of pH and OM on T-Cd and A-Cd increases under the strong influence of anthropogenic sources. Additionally, T-Cd and A-Cd were totally positively related to soil A-P, but mostly not significantly, which was attributed to the complexity of the available phosphorus source and the differences in Cd contents in chemical fertilizer. Furthermore, clay content might be an important factor affecting the correlation between Cd and soil properties, considering that the correlation between Cd and pH, SOM, A-P was significantly lower in areas with lower clay particles. This study suggested that GWR was an effective tool to reveal spatially varying relationships at field scale, which provided a new idea to further explore the related influencing factors on spatial distribution of contaminants and to realize precise management of a farmland environment.

1. Introduction

Farmland quality and soil health are important issues of concern to the international community, while contamination of soils with cadmium (Cd) is a serious problem worldwide [1]. Human industrial and agricultural activities, such as mining, smelting, transport activities, fertilization and sewage irrigation, have resulted in varying degrees of Cd contamination in farmland soils in many parts of the world [2,3,4,5]. Cadmium (Cd) contamination is the most extensive source of pollution in Chinese farmland [6]. According to the Ministry of Land and Resources and the Ministry of Environmental Protection in 2014, the over -standard rate of Cd for farmland soil in China exceeded 7%, the highest of the eight super-standard metal elements. Cd contamination in farmland soils leads to Cd accumulation in the edible part of crops, and thus might affect human health by entering the food chain [7]. Therefore, it is necessary to take measures to effectively control Cd contamination and its harm to human health. Cd bioavailability is strongly influenced by soil properties, which further affects the absorption and accumulation of heavy metals by crops and humans [8,9,10]. However, Cd accumulation and soil properties, as well as their relationship, usually show great spatial variability, which brings problems for effective farm management at field scale. The study of Oliveira et al. (2019) showed that uniform management of agricultural soil, without considering the local soil and the spatial variability of its properties, may accelerate the soil degradation process, while dividing the field into homogeneous management zones according to spatial variation can result in more adequate and sustainable soil management [11]. Therefore, it is of great significance to make clear the spatial variability of Cd accumulation in soils and its relationship with influencing factors in order to promote quantitative research into the soil environment and the implementation of precision agriculture.
Cd accumulation and bioavailability are not only influenced by pollution sources, but also closely correlated to soil properties such as pH and OM [8,9,12,13]; thus the spatial pattern of Cd contents is also related to the heterogeneity of soil properties. However, previous research on spatial distribution of heavy metals and soil properties in soils of a specific region were mainly based on traditional statistical analysis (such as correlation analysis, regression analysis, et al.) [14,15]. Thus, the obtained results only presented a global trend for the data structure or spatial distribution, which lacks in-depth interpretation of spatial information from the data itself and the heterogeneity of the relationships between heavy metal accumulation and its influencing factors. Actually, the relationships between heavy metal accumulation and environmental factors often showed an obvious spatial heterogeneity [16]. With the development of the geographical information system (GIS), mapping based on GIS in conjunction with statistical methods has become a powerful approach to describe the spatial distribution of contaminants in soils [17,18,19,20]. Geographically Weighted Regression (GWR) proposed by Fotheringham et al. (1998) is an important method to solve the spatial heterogeneity of data, which embedded spatial location of data into a linear regression model and made regression coefficients vary with spatial location [21]. Brunsdon and Fotheringham (1996) first applied the GWR model to study the spatial distribution of disease in 1996, which showed that the GWR model had a better fitting effect than that of the general linear regression model [22]. Then, the GWR model was used in the ecological and economic fields [23,24,25]. More research confirmed that the GWR model was superior to traditional methods such as the least squares linear (OLS) regression model and multiple linear regression (MLR), in terms of exploring the spatial variation relationship between various factors [26,27,28]. With the improvement of the GWR model, it has been gradually applied to study the spatial variability of the relationships between environmental pollutants and their influencing factors. For instance, Chen et al. (2016) and Xiao et al. (2018) studied the spatial and temporal distribution of air quality and its impact factors using GWR [29,30]. Li et al. (2017) used the GWR model to study the correlation between soil pollution and landscape variables at different scales in the Pearl River Delta [31]. Yuan et al. (2020) explored spatially varying relationships between Pb and Al in the urban soils of London at the regional scale using the GWR model [32]. Xu and Zhang (2021) applied the GWR model to investigate spatially varying relationships between total organic carbon contents and pH values in European agricultural soil [33]. However, most GWR analysis was still conducted at a larger scale, such as for cities [34] and provinces [35,36], and lacking in fine-grained analysis oat a field scale. Especially, research on spatial variability of the relationship between Cd accumulation and soil properties is still scarce. Previous studies have shown that a general linear model cannot effectively describe the local spatial differences, while the local GWR can better reflect the spatial variability of the correlation between each influencing factor and the contents of available heavy metal in soil, which can provide powerful information for precise management and sustainable development of agricultural land.
Our study selected a peri-suburban farmland area located at the junction of the Yellow River Basin and the Huaihe River Basin in China as a study case, which was a typical complex polluted area affected by sewage irrigation, industrial and agricultural activities. The objective of this study was to analyze the spatial heterogeneity of Cd accumulation and soil properties in the study area by Kriging interpolation method with the GIS technique, and to apply the GWR model to explore the spatial variability of the relationships between Cd accumulation and major soil factors. This study can provide a theoretical basis for the precise control of farmland non-point source pollution and the accurate remediation of Cd pollution in farmland soil.

2. Materials and Methods

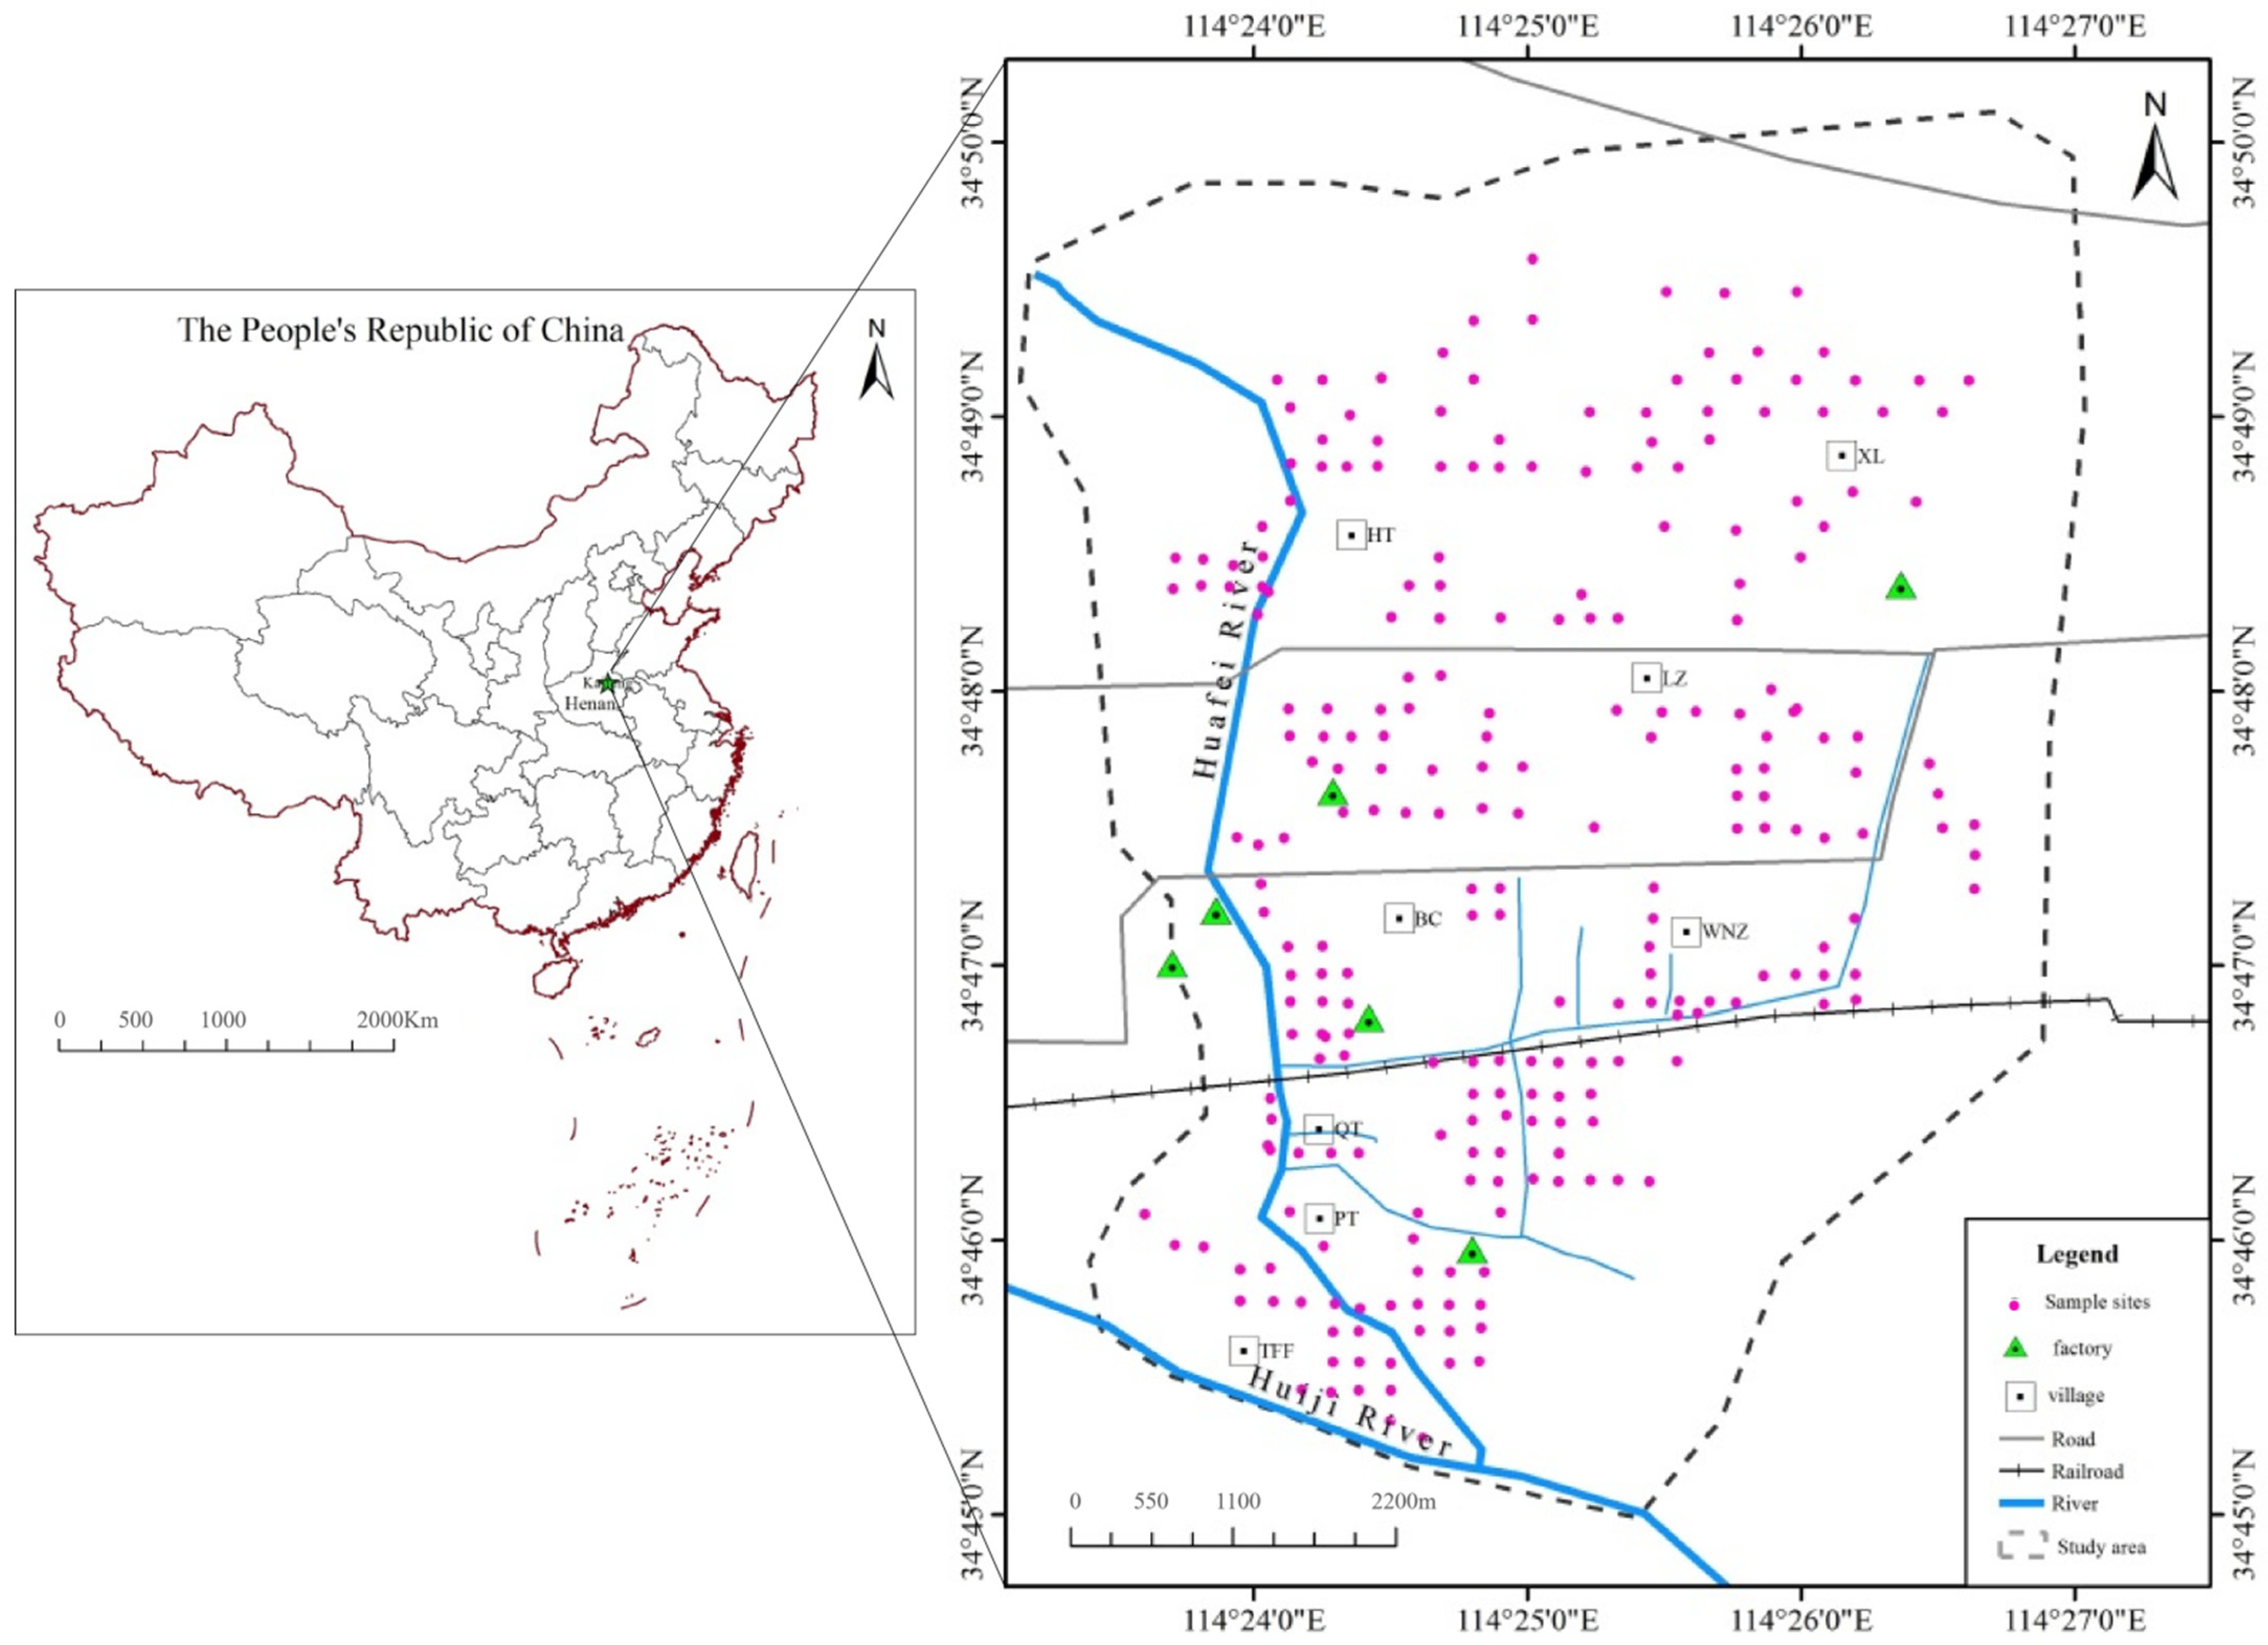
2.1. Description of Study Area

The study area is approximately 20 km2 in size and is located in the Huanghuai junction of the Yellow River Basin and the Huaihe River Basin, which is an important agricultural production zone 8n China (Figure 1). This area has a continental monsoon climate, characterized by a wide seasonal variation in rainfall (annual 627.5 mm). Eutyic Cambisols is the predominant soil type in this area (United Nations soil classifications), which was developed from the Yellow River alluvial deposits. Wheat and corn are important crops grown in the area. Some industrial and mining enterprises including chemical fertilizer plants, zinc smelting plants, a carbon factory, pharmaceutical companies, a thermal power plant, etc., are clustered in the study area. The Huafei River, running from north to south through the study area, receives plenty of wastewater from these industrial sources. The Huafei River has been used for agricultural irrigation in the area since 1962. Thus, the study area presented a state of coexistence for sewage irrigation and industrial and agricultural pollution.

2.2. Sampling and Experimental Analysis

2.2.1. Sampling and Sample Preparation

Topsoil samples from 247 sampling sites were collected from the study area using a 200 m × 200 m grid method. At each sample site, five topsoil (depth, 0–20 cm) subsamples were gathered in a 10 × 10 m2 area, and were mixed into a composite sample. Sample sites are shown in Figure 1. The coordinate of each sampling site was obtained by GPS (WGS-84 coordinate system). Soil samples were air-dried, then grounded with a porcelain mortar and passed through a 0.149-mm pore-size nylon sieve.

2.2.2. Sample Treatment and Elemental Analysis

Soil Properties Analyses

Soil properties were measured using routine methods [37]. Soil pH was measured in a 2.5:1 water/soil suspension using a pH meter; soil organic matter (SOM) content was measured with the K2Cr2O7-H2SO4 oil-bath-heating digestion method; the available phosphorus (A-P) contents were analyzed by Molybdenum-antimony Anti-colorimetric method, and measured by ultraviolet-visible spectrophotometer (UV-3600, Shimadzu, Kyoto, Japan). The particle size of soil samples was analyzed using a Mastersizer 2000 laser particle size analyzer (Malvern, England) after pretreatment with 10% H2O2, 10% HCl and 0.05 mol L−1 (NaPO3)6 dispersant (Lu, 2000).

Determinations of Total Cd and A-Cd Contents in Soils

A weight of 0.1000 g of each dried soil sample was digested with a 5 mL HNO3-HClO4-HF (3:1:1, v/v/v) mixture using the full automatic graphite digestion instrument (ST-60, Polytech Instrument Ltd., Beijing, China) for the determination of total Cd (T-Cd) [38]. The available contents of Cd (A-Cd) were extracted by DTPA (0.005 mol L−1 Diethylene-triamine-penta-acetic acid (DTPA), 0.01 mol L−1 CaCl2 and 0.1 mol L−1 Triethanolamine (TEA)) methods and can be regarded as the metal bioavailability in soils [39]. Finally, the Cd concentrations in the solution were determined by inductively coupled plasma mass spectrometry (ICP-MS, Thermo Fisher X-Series II).

Instrumentation and Reagents

During the experiment, all the reagents used were guaranteed as pure, and the experimental water was prepared by an ultrapure water treatment system (>18.2 MΩ, milli-Q, America). DTPA is the extracting agent of diethylene-triamine penta-acetic acid, which is made of the following materials and steps: 1.967 g DTPA, 14.92 g (13.3 mL) TEA and 1.11 g CaCl2 in 950 mL were dissolved in ultrapure water, and adjusted the pH to 7.30 with 6 mol L−1 HCl (pH = 3.5), then fixed the volume to 1 L with ultrapure water, stored in a plastic bottle (GB/T 23739-2009). 5 mL HNO3-HClO4-HF (3:1:1, v/v/v) (3 mL HNO3 at 120 °C 1 h, 1 mL HF at 140 °C 1 h and 1 mL HClO4 at 160 °C, respectively) were added into polytetrafluoroethylene beakers in a digestion instrument. After digestion, samples were transferred to a volumetric flask of 50 mL. We calibrated ICP-MS according to Calibration Specification for Quadrupole Inductively Coupled Plasma Mass Spectrometers (JJF 1159-2006). The multi-element standard solution (GSB 04-1767-2004, 100 mg L−1, Guobiao (Beijing) Testing &Certification Co., Ltd., Beijing, China) is used to build the calibration curve.

Quality Assurance and Quality Control (QA/QC)

Replicates (three parallel), blanks, and reference materials GSS-2 (soil from National Research Center for Standard Materials, China, concentration of Cd at 0.071 ± 0.014 mg kg−1) were included for quality control. Mean recoveries for Cd in soil were within 100 ± 5%, of the standard material recoveries. Method blanks in each batch of samples were negligible.

2.3. Spatial Analysis

2.3.1. Data Integration and Selection of Influencing Factors

Based on previous research [16,40,41,42], major environmental factors, including pH, SOM, A-P and soil particle compositions, were selected, as shown in Table 1. In ArcGIS 10.4, the data ID is used as the unique attribute to connect with the spatial coordinates to obtain the vector data used for mapping analysis.

2.3.2. Kriging Spatial Interpolation

Kriging spatial interpolation is an important part of geo-statistics, first proposed by Krige, a South African mineral engineer [43]. The principle of Kriging interpolation is to estimate the unknown sample points linearly and in an unbiased fashion, using the original data of regionalized variables and the structural characteristics of variation functions. Its formula is
Z ( x 0 ) = i = 1 n λ i Z ( x i )  
In the formula, Z ( x 0 ) denotes the predicted value of the unknown point, n is the number of sample points, and λ i , Z ( x i ) is the weight and attribute value at sample site i, respectively. In this study, Kriging interpolation was carried out by geo-statistical analysis in ArcMap 10.4, and a regular kriging method was selected to generate spatial interpolation maps of Cd, A-Cd contents and their influencing factors.

2.3.3. Spatial Autocorrelation Analysis

Spatial autocorrelation analysis is used to test spatial agglomeration, which is the basis of establishing geographic weighted regression [44]. Global autocorrelation is used to test whether there is autocorrelation between observed values of the same variable in adjacent areas. This paper uses Moran’s I [45], the formula as follows:
I = N i j W i j ( X i X ¯ ) ( X j X ¯ ) ( i j W i j ) i ( X i X ¯ ) 2
where N is the total number of sampling points; Wij is the spatial weight; Xi and Xj are the realizations (or observed values) of the attribute variable located in regions i and j, respectively; and X bar is the mean of the observed values. At a given significance level, Moran’s I is between (−1, 1). The closer the I value is to 1, the more significant the positive correlation of the research unit; the closer the I value is to −1, the stronger the negative correlation; when Moran’s I approaches 0, it is randomly distributed.

2.3.4. Geographic Weighted Regression

As an optimized spatial analysis method, Geographic Weighted Regression (GWR) is a powerful tool for exploring the spatial relationship between variables by establishing the local regression equation for each spatial location. In a sense, GWR is a refined moving windows approach where observations within the windows are weighted based on distance from the regression point, rather than evaluated equally as in moving windows regression. The GWR method embeds spatial location in the regression parameters and considers local parameter estimates [46]. Instead of estimating global parameter values, by estimating the parameters at each location GWR generates a continuous surface of spatially varying parameter values. Mathematically, the GWR is a linear regression model expressed as
y i = β 0 ( u i , υ i ) + k = 1 p β k ( u i , υ i ) x i k + ε i                 i = 1 , 2 , 3 , , n
where ( u i , υ i ) are the spatial coordinates of each sample point i, β 0 ( u i , υ i ) is the intercept of sample i, β k ( u i , υ i ) is the regression coefficient of sample point i, x i k is an observation of the kth environmental variable of sample i, y i is the fitting value of Cd content at sample point i and ε i is the random error. If β1 = β2 = … = βn, the GWR method reduces to the earlier OLS model [21]. In this study, the p value of 1 was selected, i.e., the spatial correlation between T-Cd, A-Cd and a single impact factor was analyzed from pH, SOM and A-P, respectively.

2.4. Statistical Analysis

Statistical analysis was performed using PASW Statistics 18 for Windows. Statistical significance of grouped means differences was computed using one-way ANOVA and data with p < 0.05 were considered significant. The estimated values of the parameters including local regression coefficient (C), local R2 and significant levels (P), were obtained through establishing the model with GWR4 soft. All maps were produced using GIS software ArcMap (version 10.4, ESRI, Redlands, CA, USA). The range of Local R2 values is between 0.0 and 1.0, indicating how well the local regression model fits the observed y values. Local regression coefficient (C) represents the speed of y changing with x (slope), which indicates the influence intensity of x change on y value. A local correlation coefficient (r) was calculated to reveal the correlation between the dependent variable and independent variable [32]. The formula can be expressed as:
Local   r   =   Sqrt ( R 2 ) × C / Abs ( C )
The local correlation coefficient (r) is equivalent to the Geographically Weighted Pearson Correlation (GWPC), which is based on the concept of local statistics [47].

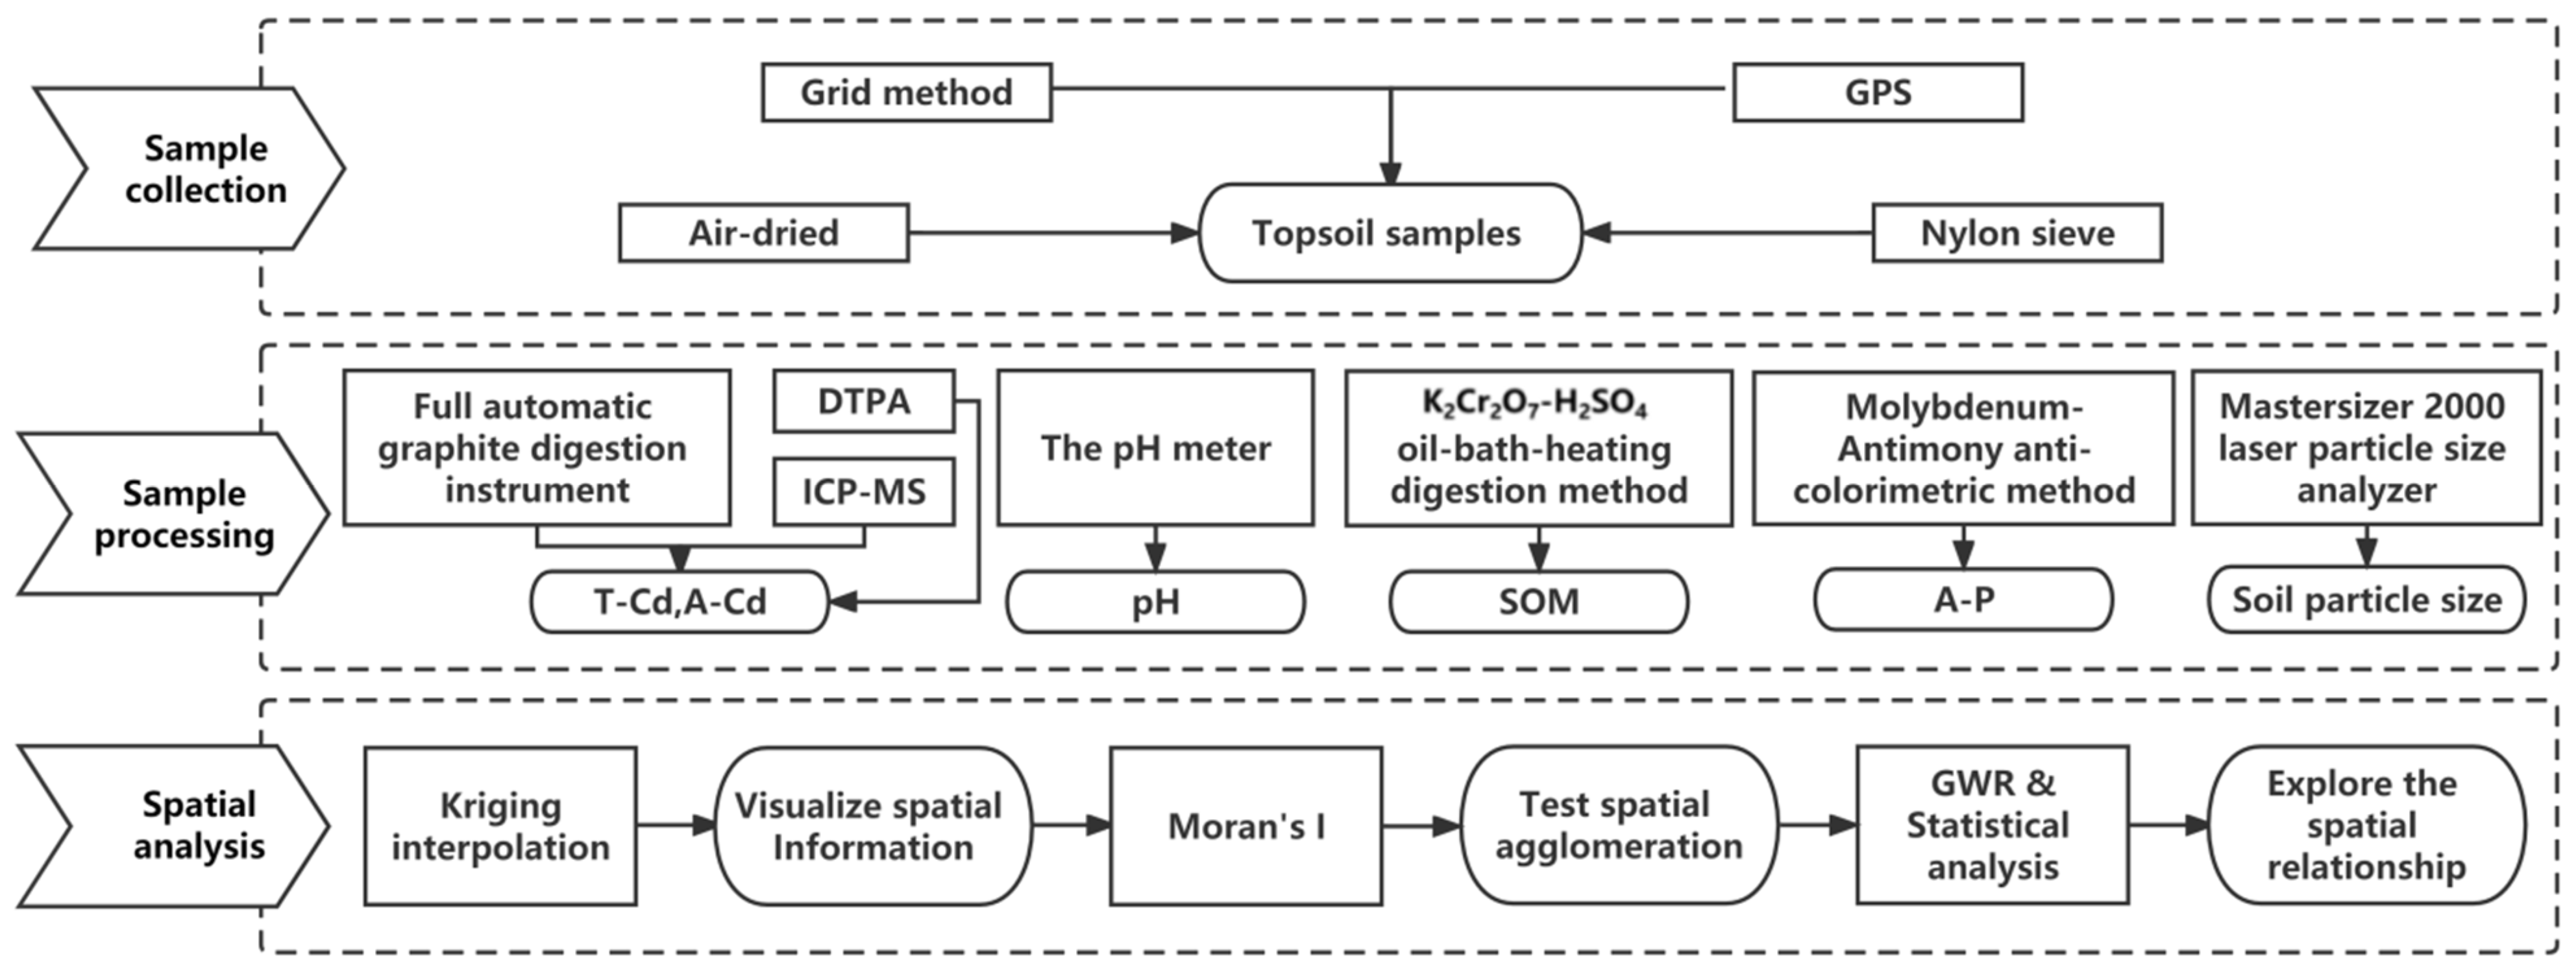
2.5. Technical Route

This paper took the farmland sewage irrigation area in the eastern suburbs of Kaifeng city as the research area, collected soil samples, and analyzed the physical and chemical properties, total and available Cd contents in soils through national standard analytical methods. Kriging interpolation, Moran’s I and GWR models were respectively and sequentially applied to analyze spatial distribution and local autocorrelation of T-Cd, A-Cd contents and soil properties, as well as spatial variation of the correlation and the influencing intensity between T-Cd, A-Cd and major soil properties. Then, an in-depth discussion and explanation was conducted. The technical route is shown in Figure 2.

3. Results and Discussion

3.1. Descriptive Statistics

The geometric range, mean, standard deviation, skewness, kurtosis and coefficient of variance for all variables for the studied soils are presented in Table 2. Mean concentration of total Cd in the studied soils was 1.22 mg kg−1. The number of soil samples exceeding the soil background values for Eutyic Cambisols, China (0, 10 mg kg−1, National Environmental Monitoring Station of China, 1990) were 100% for Cd. Compared with the soil environmental quality risk control standard for soil contamination of agricultural land in China (GB15618-2018), soil samples exceeded the maximum allowable concentration of Cd in agricultural soils (0.6 mg kg−1) by 67.4%. Based on coefficient of variation (CV), the contents of total Cd (T-Cd) and available Cd (A-Cd) showed great variability. This result indicated that high Cd accumulation in soils may be derived from anthropogenic sources such as industrial emissions, fertilizer application and sewage irrigation.
The studied soils were developed from the Yellow River alluvial deposits. Soil pH ranged from 6.82~8.96, showing a neutral to mild alkaline feature. The mean value of SOM was 25.9 g kg−1. Mean concentration of available P (A-P) was 45.06 mg kg−1, and A-P contents presented high variability with coefficients of variation of 71%, with the further implication that there were potential anthropogenic sources, such as excessive application of fertilizers. The general correlation analysis showed that the contents of T-Cd and A-Cd in the soil were negatively significantly correlated with pH and the contents of clay, silt and sand particle in soil, and positively significantly correlated with the contents of soil A-P and OM (p < 0.05), as shown in Table 3.

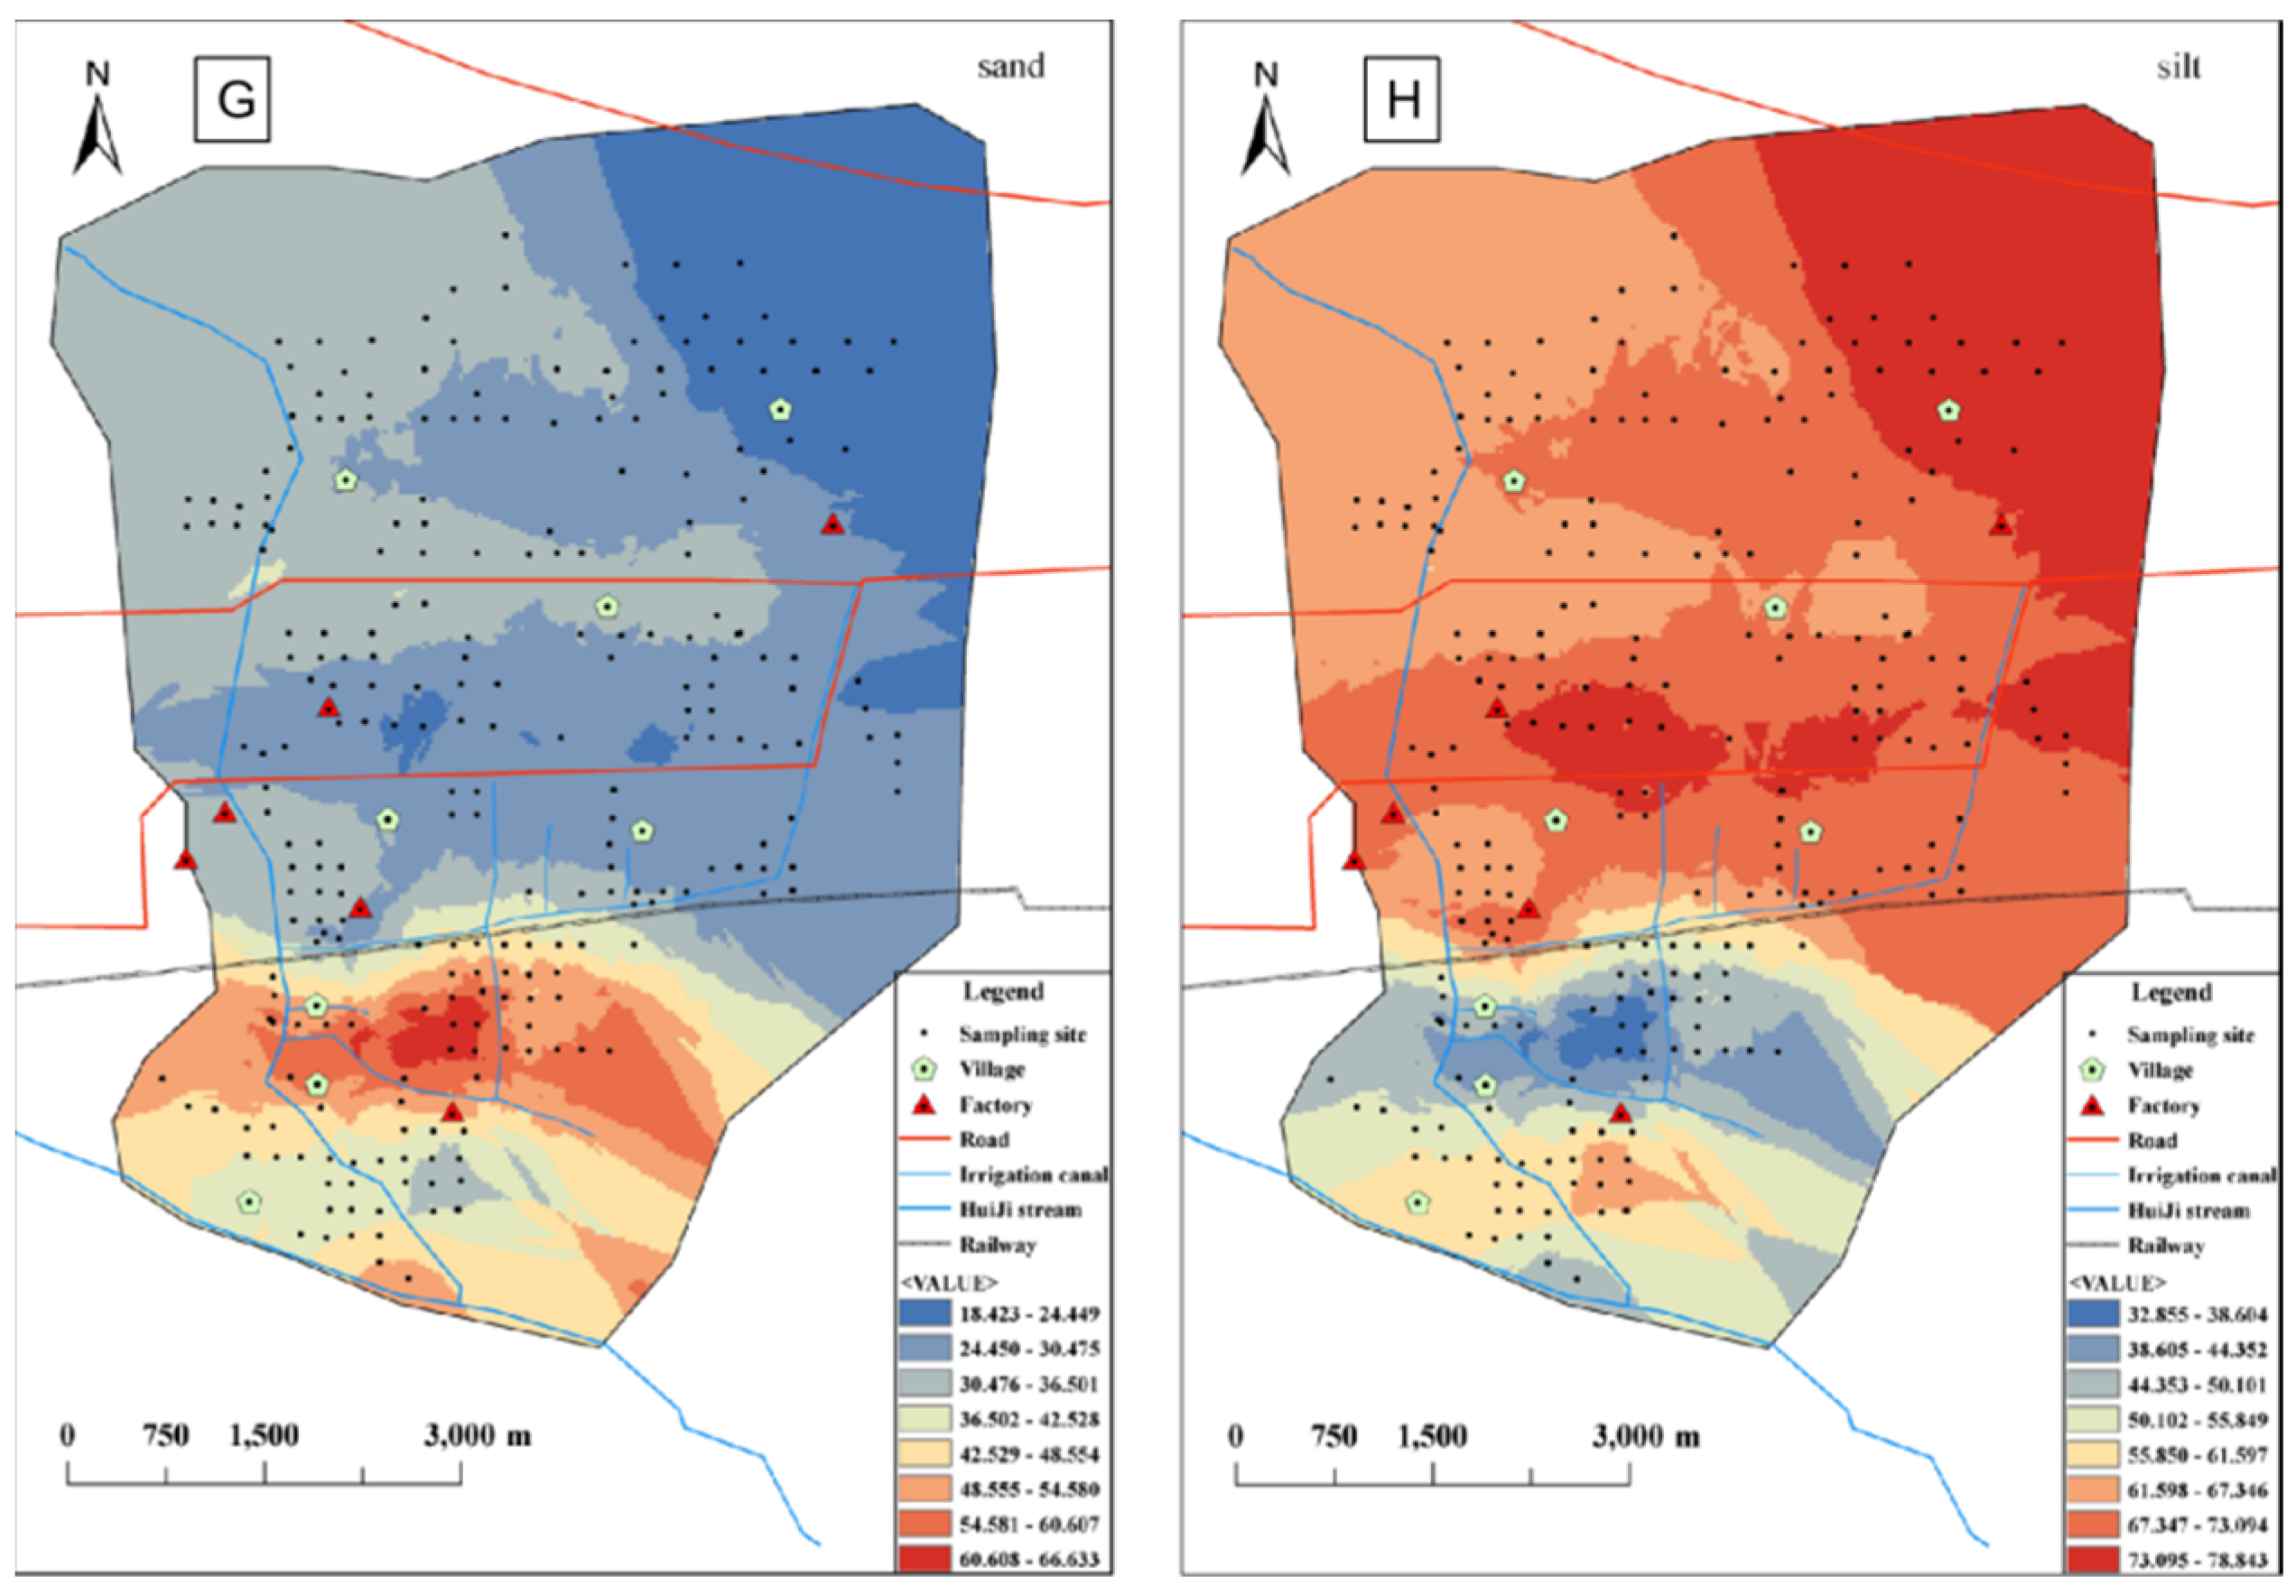
3.2. Spatial Distributions of Cd and Main Soil Properties

In this study, we first use ordinary kriging interpolation methods to obtain the spatial distribution of T-Cd and A-Cd contents in soil with soil pH, SOM, and A-P contents, as shown in Figure 3A–E. The spatial distribution of T-Cd and A-Cd contents in the study area has similar variability, and shows a general higher trend in the northeast and lower in the southwest. Their high concentrations mainly cluster in the industrial agglomeration area including fertilizer plants and zinc smelters. Notably, the T-Cd content is high in the south of the study area where rivers and irrigation canals are dense. The main reason for this may be long-term historical sewage irrigation and side infiltration of the river receiving industrial wastewater with a large amount of Cd [48]. According to spatial distribution, lower T-Cd and A-Cd existed in the northwest of the study area, which are weakly affected by human activities, and mainly from natural sources [38].
After kriging interpolation, soil pH in this study area ranges from 7.67 to 8.36, and generally shows a high trend in the northeast and low in the southwest, as shown in Figure 3C. High pH value is distributed in the middle and northeast (8.13~8.96), and low pH value is distributed in the industrial agglomeration area in central and western parts (7.67~7.90). The reason may be that the wastewater discharged from the factory contains a large amount of sulfides and fluorides, which cause pH decrease [49]. Totally, OM in studied soil shows a higher trend in the southeast and a lower in the northwest. Especially, high OM contents occurred in the industrial agglomeration area located in the central and western area. This may be related to the high content of organic waste in industrial wastewater. The soil A-P in the study area shows a low trend in the west and a high in the east, while high values mainly clustered in the industrial agglomeration area and near the irrigation canals. This might be related to the intensive application of phosphate fertilizer. In addition, clay content in soil in the study area is low (less than 6%), and presents a banded distribution, with the southern river and main channel as the low value center and gradually increasing from south to north. The silt contents in most area are relatively high (the average value is 63.61%), its distribution similar to that for clay particles, which is low in the south and high in the north. Yet sand contents show an opposite high trend in the south and low in the north.
At the same time, global spatial autocorrelation analysis of T-Cd, A-Cd and main soil properties was conducted to detect their spatial aggregation. As shown in Table 4, their global Moran’s I values were in the order: T-Cd > A-Cd > sand > silt > A-P > clay > pH > SOM > 0. The p-values for all influencing factors are less than 0.01, which means that they are significant at the 0.01 significance level.

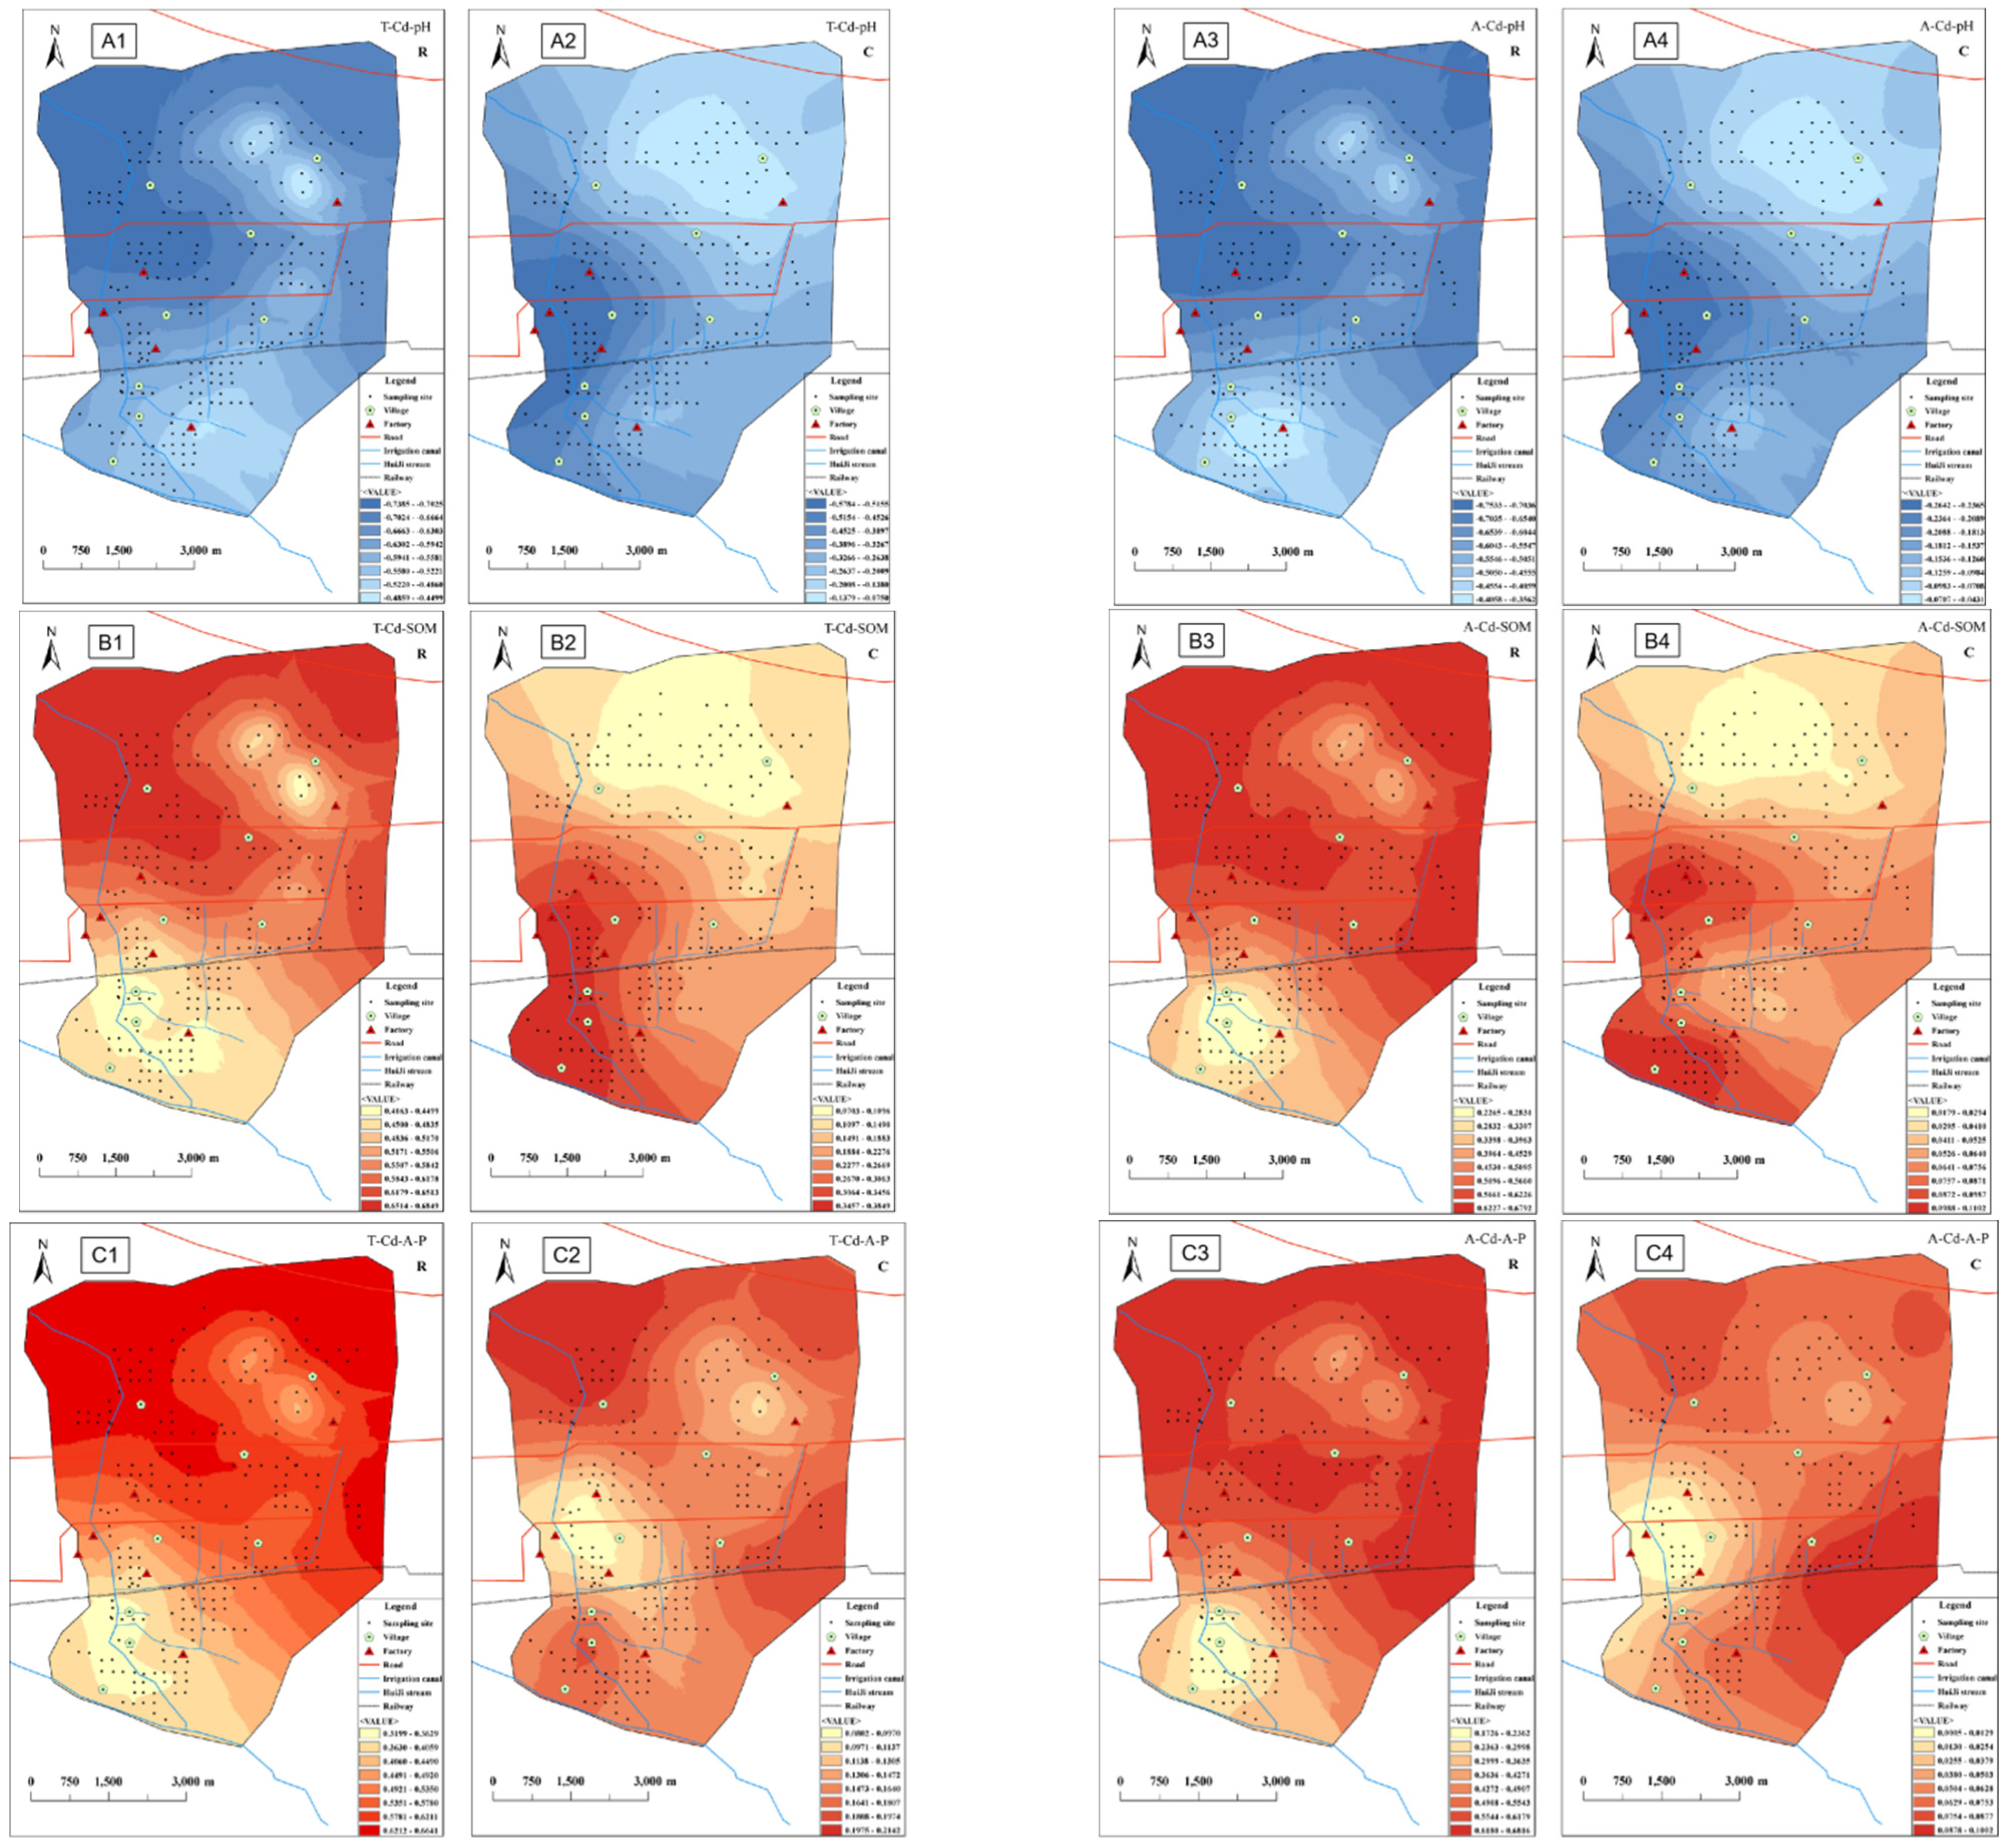
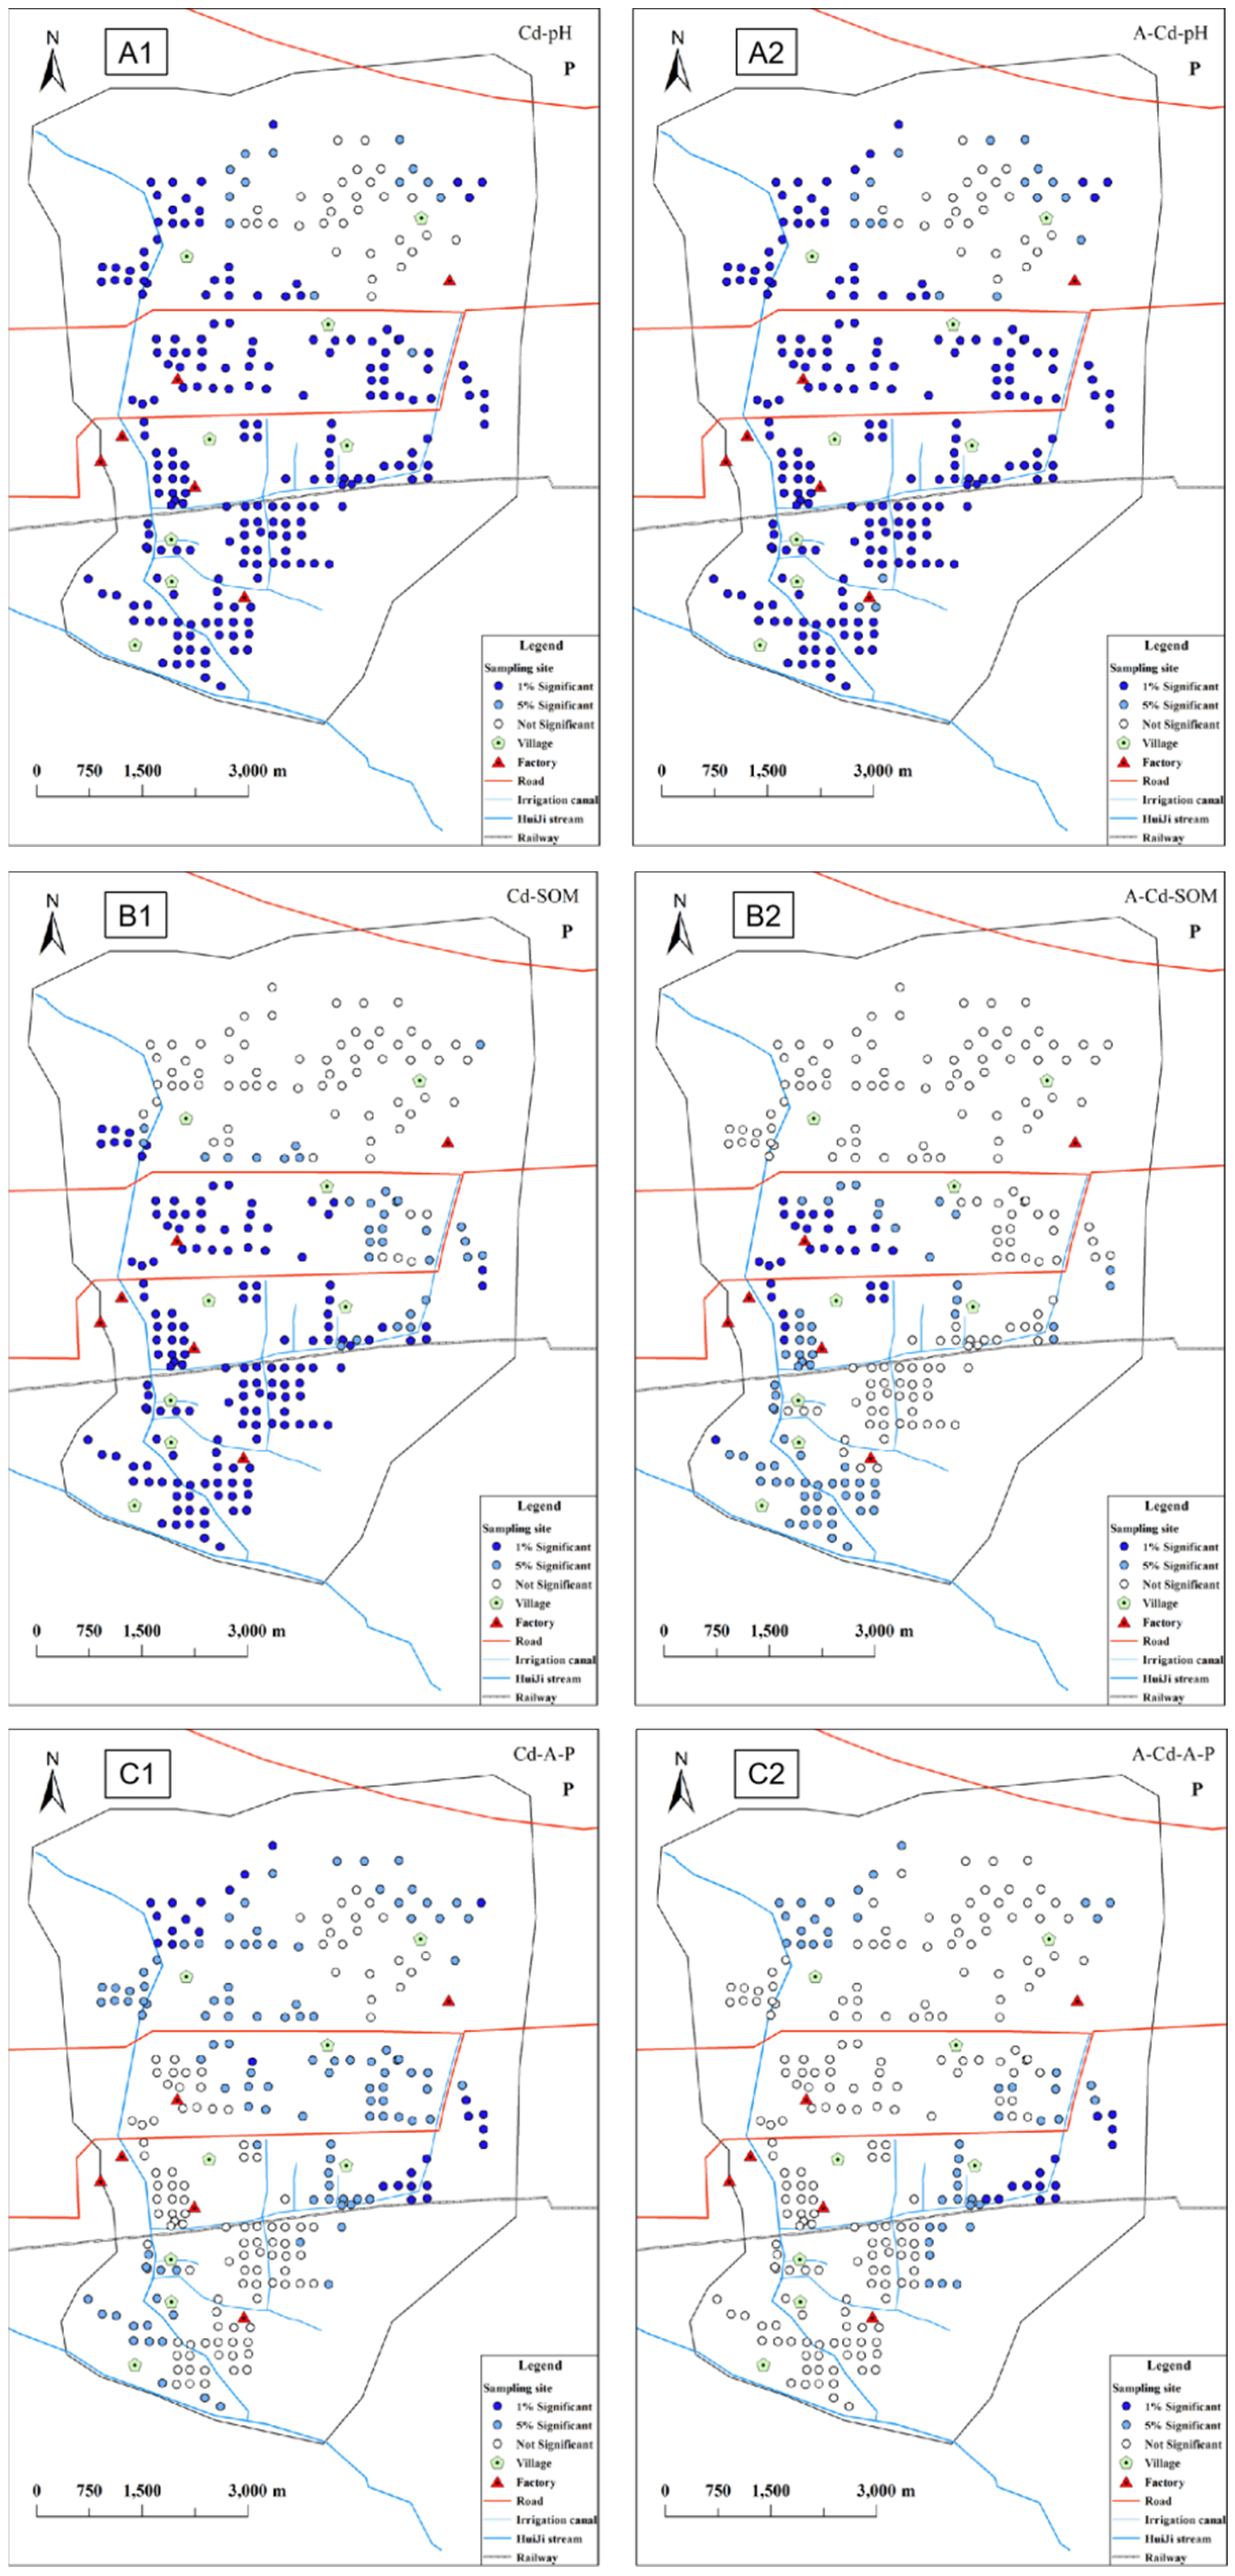
3.3. Spatially Varying Relationships between Cd and Main Soil Properties

In order to explore and clearly reveal the spatial variation relationship between Cd accumulation and major soil properties, the spatial distribution of local regression coefficient, local correlation coefficient and their significance levels are analyzed, and shown in Figure 4 and Figure 5.

3.3.1. Spatially Varying Relationships between Cd and pH

Soil pH is one of the important factors affecting Cd bioavailability in soil. The pH affects the availability of heavy metals in soil by affecting their activity [50]. Usually, with a decrease of soil pH, the available Cd content increases [51]. Throughout our study, it was found that there was a significant negative correlation between soil pH and T-Cd, A-Cd content (p < 0.01, as shown in Table 3), which is in good agreement with previous studies [8,9]. However, spatial distributions of their correlation (r) and regression coefficient (c) present great variability, which indicates that at different locations, the correlation and influence intensity of pH on availability of Cd are different, as shown in Figure 4A1–A4.
Generally, the correlation between T-Cd and pH, and between A-Cd and pH show a high trend in the northwest and low in the southeast (Figure 4A1–A4), which is different from (or even contrary to) the distribution trend of T-Cd and A-Cd contents. This indicates that the correlation between pH and T-Cd, A-Cd is weak in the high Cd area caused by anthropogenic source, while the correlation between pH and T-Cd, A-Cd is relatively strong via natural source. Notably and importantly, in the low pH (7.67~7.93) region, it is observed that there is a significantly positive correlation (p < 0.01) between T-Cd, A-Cd and pH, while their correlation is mostly not significant (p > 0.05) in the high pH (7.93~8.36) region, as shown in Figure 4A1–A4 and Figure 5A1,A2. This result indicates that with an increase in soil pH, the correlation between pH and T-Cd, A-Cd decreases. Furthermore, it is found that high values of the absolute value of the regression coefficient are concentrated around chemical plants in the middle of the west (the high T-Cd and A-Cd area), while low values are mostly distributed in the low content area of T-Cd and A-Cd. This result confirms that under the influence of natural sources, the change of soil pH has a weak influence on the contents of T-Cd and A-Cd, which is consistent with the research of Wang et al. (2006) on influencing effects of pH change on Cd availability under natural conditions [52]. However, under the strong influence of anthropogenic sources, the correlation between pH and T-Cd and A-Cd happen to decrease, while the influence intensity of pH on T-Cd and A-Cd content in soil increase, which is similar to the findings of Singh et al. (1998) [53]. With the decrease of soil pH, the contents of T-Cd and A-Cd increase significantly. This result indicates that the high T-Cd and A-Cd contents in soil are greatly influenced by anthropogenic factors, which may be mainly caused by the discharge of acid wastewater containing Cd [38].

3.3.2. Spatially Varying Relationships between Cd and SOM

Soil organic matter (SOM) is another important factor affecting soil Cd availability [10,54]. In this study, there is significant positive correlation between SOM and Cd accumulation, as shown in Figure 4B1–B4. The correlations between T-Cd, A-Cd and SOM show a total high trend in the north and low in the south. However, their significant correlation (p < 0.01) mainly exists in the high Cd and high OM (2.89~3.46) area, while their correlation is not significant (p > 0.05) in the low Cd and relatively low OM (1.94~2.88) area, as shown in Figure 5B1,B2. This suggests that the T-Cd and A-Cd accumulation are significantly related to the SOM contents in the high Cd area caused by anthropogenic source. Notably, the obvious positive correlation between A-Cd and SOM is only primarily concentrated in the farmlands near the chemical plant and both sides of the river.
Furthermore, the high values of regression coefficient between T-Cd, A-Cd and SOM are primarily concentrated near the chemical plant in the southwest (the high T-Cd and A-Cd area), while low values are mostly distributed in the low T-Cd and A-Cd content area. This result shows that under natural sources the change of soil OM only causes a weak alteration of the T-Cd and A-Cd content, yet under the strong influence of anthropogenic source in the southwest of the study area, influence intensity of SOM on T-Cd and A-Cd contents is higher. This result indicated that high SOM resulting from human factors has a significant effect on the accumulation of T-Cd and A-Cd in soil.

3.3.3. Spatially Varying Relationships between Cd and A-P

Available phosphorus, as an important indicator of soil properties, also affects Cd sorption capacity [55]. In our study, it is found there is a significant positive correlation between soil A-P and Cd contents, as shown in Figure 4C1–C4. The high correlation between soil A-P and Cd contents is prominently distributed in the northeast, while the low correlation coefficient is locally distributed in the concentrated distribution area of rivers in the southwest. It is noteworthy that their significant correlation (p < 0.01and p < 0.05) between Cd and A-P is mainly distributed in frequent farming areas far away from villages and enterprises (Figure 5C1,C2), which might have resulted from the large application of phosphorus fertilizer containing a large amount of Cd transformed from raw phosphate rock (the average Cd content is 0.60 mg kg−1) [56]. However, in high Cd area, no significant correlation exists between Cd and A-P, which means that the high Cd content is mainly caused by the emission of industrial pollution sources. It was found that the obvious correlation between A-Cd and A-P exists only in a few areas, while the correlation is not significant in most areas.
Furthermore, the high values of the regression coefficient are mainly concentrated near the irrigation canals in the southeast and the northern area, which is usually high intensity farming area with frequent application of phosphate fertilizer, but not high Cd contents. The low values of the regression coefficient are mostly distributed around the chemical plants in the southwest, where was high Cd content resulted from strong anthropogenic sources, such as sewage irrigation.

3.4. Explanation and Potential Influencing Factors of Spatially Varying Relationships

The spatial distribution of T-Cd and A-Cd contents in the study area presents a general higher trend in the northeast and lower in the southwest. The high T-Cd and A-Cd concentrations are mainly concentrated in the industrial agglomeration area including fertilizer plants and zinc smelters, together with farmlands in the south of the study area where rivers and irrigation canals are dense. Long-term historical sewage irrigation and side infiltration of the river receiving industrial wastewater with a large amount of heavy metals Cd is likely to be the primary cause of high Cd content in the area [48]. The results obtained by GWR showed that the content of T-Cd and A-Cd had complex spatial relationships with pH, SOM, A-P and soil particle size.

3.4.1. Interpretation and Potential Reasons for Spatially Varying Relationship between Cd and pH

The wastewater discharged from the factory contains a large amount of sulfides and fluorides. This causes a drop in pH in farmlands located in industrial agglomeration area and in the south of the study area where rivers and irrigation canals are dense. GWR analysis shows that the correlation (r) and regression coefficient (C) between pH and Cd present great spatial variability. The results showed that a significantly positive correlation (p < 0.01) between T-Cd, A-Cd and pH exists in a low pH region (7.67~7.93), while the correlation is not significant in a high pH region (7.93~8.36). Our result confirms that under the influence of natural sources, the change of soil pH has a weak influence on T-Cd and A-Cd contents, while under the strong influence of an anthropogenic source, the influence intensity of pH on T-Cd and A-Cd contents in soil increase. Thus, it is suggested that, for high cadmium areas, some measures should be taken to appropriately improve soil pH, effectively decrease the bioavailability of anthropogenic Cd, restrain the absorption of Cd by crops, and thus reduce the risk to human health.

3.4.2. Interpretation and Potential Reasons for Spatially Varying Relationship between Cd and SOM

The wastewater with high organic matter content discharged from anthropogenic sources also led to a high content of soil organic matter near the industrial agglomeration area located in central and western parts of the area. The correlation between SOM and T-Cd, A-Cd presented obvious spatial variability as a result of the complex effects of soil organic matter on the behavior of heavy metals [12,13,57]. On the one hand, organic matter has strong adsorption of heavy metals, especially macromolecular organic matter which can promote the formation of complex sediments [58]; on the other hand, dissolved organic matter (especially low molecular weight organic matter) is easy to form soluble substances with heavy metals, which can promote the migration of heavy metals [13]. The significant correlation (p < 0.01) between Cd and SOM mainly existed in the high Cd and high OM (2.89~3.46) area, from anthropogenic source. Here, the increase of SOM could cause the high elevation of the total amount and the availability of Cd in soil. The possible reason is that exogenous organic matter could adsorb more Cd into the soil, resulting in the increase of total Cd. At the same time, the existence of soluble organic matter increases the extraction rate of Cd from the soil, activates soil Cd [39,59] and promotes the availability of heavy metal [13]. So, it can be seen that the increase of organic matter helps to improve soil fertility, but it may also activate toxic heavy metal in soil and increase health risk. Therefore, it is suggested that organic matter containing components conducive to the formation of Cd complex precipitation should be appropriately applied in farmlands with high Cd content.

3.4.3. Interpretation and Potential Reasons for Spatially Varying Relationship between Cd and A-P

Usually, the increase of available P in soil can cause substantial precipitation of P-Cd complexes (such as Cd3(PO4)2 and CdHPO4) and decrease the bioavailability of Cd [54,55]. That is to say, available phosphorus should be negatively related to available Cd, which is not consistent with our research. In our study, soil A-P is totally positively correlated to soil T-Cd and A-Cd (Figure 4C1–C4), yet the correlation is not significant for Cd and A-P in a high Cd area. In most areas, the correlation between A-Cd and A-P is not significant. The reason might be that the sources of phosphorus and Cd are different for the whole study area. It further confirmed that the high Cd content in the industrial agglomeration area including fertilizer plants and zinc smelters, together with farmlands in the south of the study area where rivers and irrigation canals are dense, were mainly caused by the emission of industrial pollution sources. For most farmlands of the study area, a large amount of phosphate fertilizer application is the main factor leading to Cd enrichment in corresponding soil. However, in this study, no significant correlation between phosphorus and Cd is attributed to the complex effects of phosphorus fertilizer application. On the one hand, as a result of the phosphate fertilizer raw materials containing Cd, applying phosphate fertilizer will increase the amount of Cd in soil. On the other hand, phosphate (or hydrogen phosphate) ions in phosphate fertilizer could form complex precipitation with Cd in soil, so as to reduce the bioavailability of Cd in soil and inhibit the absorption of crops [60,61]. In addition, available Cd contents in phosphorus fertilizer are also different (from 4.62% to 53.79%) [56], which might be another reason leading to no significant correlation between A-Cd and A-P. In view of this, it is suggested to apply bio-char compounded with phosphorus, etc., in the farmlands with high Cd content, which not only helps to immobilize Cd in soil and reduce Cd absorption by crops, but also helps to improve soil fertility and crop growth.

3.4.4. Interpretation and Potential Reasons for Spatially Varying Relationship between Cd and Soil Particle Size

Soil particle size is also one of the important factors affecting the content, distribution, migration and transformation of heavy metals. Most heavy metals in the soil are concentrated on the particle surface, and the particles are used as the carrier for migration and transformation [62]. The content and availability of heavy metals are closely related to particle size. The different occurrence of clay minerals, hydrated oxides and organic matter in different particle sizes will affect the enrichment and migration of heavy metals [63,64]. Generally speaking, clay minerals, hydrated oxides, CEC and organic matter are easy to be enriched by fine particles, so the finer the particles, the higher the content of heavy metals [57,59]. The research of Zhang and Feng (2014) showed that the adsorption capacity for Cd by soil clay, silt and sand was from strong to weak [65]. In this study, there are relatively low clay content (less than 6%) in most areas, especially the southern river and main channel with a low value center (Figure 3F). The silt contents are relatively high (the average value is 63.61%), but are also present low in the south and high in the north (Figure 3H). Contrary to clay and silt particles, sand particle contents show a high trend in the south and low in the north (Figure 3G). GWR analysis shows that the correlations between Cd and pH, SOM, A-P are obviously low in farmlands near the southern river and main channels with low clay particles and high sand particles (Figure 3). The result indicated that soil particle size not only affects the adsorption of heavy metals and organic matter, but also has an influence on the relationship between heavy metals, organic matter and pH. Properly increasing the content of soil clay is conducive to promoting the improvement of soil organic matter and CEC, and reducing the bioavailability and health risk from heavy metals.

4. Conclusions

Identifying the spatial heterogeneity of heavy metals, influencing factors and their relationship in agricultural land is of great significance for realizing farmland fine management and sustainable development. In our study, based on the spatial distribution of Cd and main soil properties, the spatial heterogeneity of the relationship between Cd and soil properties (pH, organic matter and available phosphorus) were analyzed by GWR, and their influencing factors were explored. T-Cd and A-Cd contents in the study area presented a general trend of higher in the northeast and lower in the southwest. GWR analysis suggested that in the low pH region, soil pH was positively related to available Cd, and had a great impact on the availability of Cd. Significant correlation between Cd and OM mainly existed in the high Cd and high OM area, a possible reason being that the existence of soluble organic matter promote the activation of Cd from the soil. Due to the difference and complication of phosphorus and Cd sources in soil, there was no significant correlation between A-P and Cd contents. In addition, the correlations between Cd and pH, SOM, A-P were obviously low in farmlands near the southern river and main channels with low clay particles and high sand particles. GWR analysis effectively revealed spatially varying relationships between Cd and soil properties at the field scale, which provide a new idea for precise control and management of farmland environment. Here, for areas with high Cd content, it is suggested to properly apply alkaline materials containing phosphorus, high molecular organic matter and high clay to regulate soil pH, organic matter and particle size, enhance cadmium immobilization and reduce soil Cd activity and health risk, while strictly controlling the emission of pollution sources.

Author Contributions

Conceptualization, Z.C.; methodology, Z.C., W.G. and S.Z.; software, W.G. and S.Z.; validation, Z.C., S.Z. and W.G.; formal analysis, Z.C., S.Z. and X.J.; investigation, Z.C., Y.D. and W.G.; resources, Z.C. and W.G.; data curation, Z.C. and S.Z.; writing—original draft preparation, Z.C., S.Z., W.G. and Y.D.; writing—review and editing, Z.C., S.Z. and Y.D.; visualization, Z.C., S.Z. and W.G.; supervision, Z.C. and W.G.; project administration, Z.C.; funding acquisition, Z.C. All authors have read and agreed to the published version of the manuscript.

Funding

This research was funded by a grant from the National Natural Science Foundation of China (41301336) and Science and Key Research & Development and Promotion Project in Henan Province (212102110110).

Institutional Review Board Statement

Not applicable.

Informed Consent Statement

Not applicable.

Data Availability Statement

Not applicable.

Acknowledgments

The authors are grateful to the editor and reviewers for their valuable comments and suggestions.

Conflicts of Interest

The authors declare no conflict of interest.

References

  1. Zhang, C.L.; Chen, Y.Q.; Xu, W.H.; Chi, S.L.; Li, T.; Li, Y.H.; He, Z.M.; Yang, M.; Feng, D.Y. Resistance of alfalfa and Indian mustard to Cd and the correlation of plant Cd uptake and soil Cd form. Environ. Sci. Pollut. Res. 2019, 26, 13804–13811. [Google Scholar] [CrossRef] [PubMed]
  2. Fulda, B.; Voegelin, A.; Kretzschmar, R. Redox-Controlled Changes in Cadmium Solubility and Solid-Phase Speciation in a Paddy Soil as affected by reducible sulfate and copper. Environ. Sci. Technol. 2013, 47, 12775–12783. [Google Scholar] [CrossRef] [PubMed]
  3. Gray, C.W.; Chrystal, J.M.; Monaghan, R.M.; Cavanagh, J. Subsurface cadmium loss from a stony soil-effect of cow urine application. Environ. Sci. Pollut. Res. 2017, 24, 12494–12500. [Google Scholar] [CrossRef]
  4. Karak, T.; Abollino, O.; Paul, R.K.; Dutta, A.K.; Boruah, R.K.; Giacomino, A.; Khare, P. Achievability of Municipal Solid Waste Compost for Tea Cultivation with Special Reference to Cadmium. Clean-Soil Air Water 2018, 46, 1800093. [Google Scholar] [CrossRef]
  5. Hong, M.F.; Zhang, L.M.; Tan, Z.X.; Huang, Q.Y. Effect mechanism of biochar’s zeta potential on farmland soil’s cadmium immobilization. Environ. Sci. Pollut. Res. 2019, 26, 19738–19748. [Google Scholar] [CrossRef]
  6. Zhang, X.Y.; Zhang, Y.M.; Liu, X.Y.; Zhang, C.Y.; Dong, S.D.; Liu, Q.; Deng, M. Cd uptake by Phytolacca americana L. promoted by cornstalk biochar amendments in Cd-contaminated soil. Int. J. Plast. 2019, 22, 251–258. [Google Scholar] [CrossRef]
  7. Tudoreanu, L.; Phillips, C.J.C. Modeling Cadmium Uptake and Accumulation in Plants. Adv. Agron. 2019, 84, 121–157. [Google Scholar]
  8. Li, Z.Y.; Zhang, C.L.; Deng, C.B.; Gu, M.H.; Li, L.; Liu, M. Analysis on spatial distribution of soil available heavy metals and its influential factors in a lead-zinc mining area of Guangxi, China. Ecol. Environ. Sci. 2009, 18, 1772–1776. (In Chinese) [Google Scholar]
  9. Khoshgoftarmanesh, A.H.; Afyuni, M.; Norouzi, M.; Ghiasi, S.; Schulin, R. Fractionation and bioavailability of zinc (Zn) in the rhizosphere of two wheat cultivars with different Zn deficiency tolerance. Geoderma 2018, 309, 1–6. [Google Scholar] [CrossRef]
  10. Wang, S.R.; Wu, Z.H.; Luo, J. Transfer mechanism, uptake kinetic process, and bioavailability of P, Cu, Cd, Pb, and Zn in macrophyte rhizosphere using diffusive gradients in Thin Films. Environ. Sci. Technol. 2018, 52, 1096–1108. [Google Scholar] [CrossRef]
  11. Oliveira, J.F.; Mayi, M.; Marchao, R.L.; Corazza, E.J.; Hurtado, S.C.; Malaquias, J.V.; Filho, J.T.; Brossard, M.; Guimaraes, M.D.F. Spatial variability of the physical quality of soil from management zones. Precis. Agric. 2019, 20, 1251–1273. [Google Scholar] [CrossRef]
  12. Temminghoff, E.; Zee, V.; Sjoerd, E.A.T.M.; Haan, F.D. Copper mobility in a copper-contaminated sandy soil as affected by pH and solid and dissolved organic matter. Environ. Sci. Technol. 1997, 31, 1109–1115. [Google Scholar] [CrossRef]
  13. Li, X.M.; Meng, Q.J.; Gao, B.; Feng, Q.Y.; Zhang, Y.J. Effects of dissolved organic matter on adsorption and migration of heavy metals in soil. Sci. Technol. Eng. 2016, 16, 314–319. (In Chinese) [Google Scholar]
  14. Ungureanu, T.; Iancu, G.O.; Pintilei, M.; Chicos, M.M. Spatial distribution and geochemistry of heavy metals in soils: A case study from the NE area of Vaslui county, Romania. J. Geochem. Explor. 2016, 176, 20–32. [Google Scholar] [CrossRef]
  15. Li, B.; Xiao, R.; Wang, C.Q.; Zhang, Y.; Zheng, S.Q.; Yang, L.; Guo, Y. Spatial distribution of soil cadmium and its influencing factors in peri-urban farmland: A case study in the Jingyang District, Sichuan, China. Environ. Monit. Assess. 2017, 189, 21. [Google Scholar] [CrossRef]
  16. Boerkhold, A.E.; Van Der Zee, S.; De Haan, F. Spatial patterns of cadmium contents related to soil heterogeneity. Water Air Soil Pollut. 1991, 58, 479–488. [Google Scholar] [CrossRef]
  17. Wu, Z.X.; Zhou, Y.; Liu, J.Y.; Xu, T. Spatial variability of soil organic matter and its influencing factors in the mountainous area of northwest Hubei. Resour. Environ. Yangtze Basin. 2021, 5, 1141–1152. (In Chinese) [Google Scholar]
  18. Zhao, Z.B.; Wang, H.C.; Du, J.; Bai, X.; Geng, S.G.; Wan, F.X. Spatial distribution of forest carbon based on GIS and geostatistical theory in a small earth-rocky mountainous area of North China. J. Biobased Mater. Bioenergy 2016, 10, 90–99. [Google Scholar] [CrossRef]
  19. Fernandez, P.; Delgado, E.; Lopez-Alonso, M.; Poyatos, J.M. GIS environmental information analysis of the Darro River basin as the key for the management and hydrological forest restoration. Sci. Total Environ. 2017, 613–614, 1154–1164. [Google Scholar] [CrossRef]
  20. Patowary, S.; Sarma, A.K. GIS-Based Estimation of Soil Loss from Hilly Urban Area Incorporating Hill Cut Factor into RUSLE. Water Resour. Manag. 2018, 32, 3535–3547. [Google Scholar] [CrossRef]
  21. Fotheringham, A.S.; Brunsdon, C.F.; Charlton, M.E. Geographically Weighted Regression: The Analysis of Spatially Varying Relationships. Am. J. Agric. Econ. 2002, 86, 554–556. [Google Scholar]
  22. Brunsdon, C.; Fotheringham, A.S.; Charlton, M.E. Geographically Weighted Regression: A Method for Exploring Spatial Nonstationarity. Geogr. Anal. 1996, 28, 281–298. [Google Scholar] [CrossRef]
  23. Cellmer, R. Spatial analysis of the effect of noise on the prices and value of residential real estates. ITEA Inf. Tec. Econ. Agrar. 2011, 110, 400–413. [Google Scholar]
  24. Thissen, M.; Graaff, T.; Oort, F. Competitive network positions in trade and structural economic growth: A geographically weighted regression analysis for European regions. Pap. Reg. Sci. 2016, 95, 159–180. [Google Scholar] [CrossRef]
  25. Georganos, S.; Abdi, A.M.; Tenenbaum, D.E.; Kalogirou, S. Examining the NDVI-rainfall relationship in the semi-arid Sahel using geographically weighted regression. J. Arid Environ. 2017, 146, 64–74. [Google Scholar] [CrossRef]
  26. Mishra, U.; Lal, R.; Liu, D. Predicting the spatial variation of the soil organic carbon pool at a regional scale. Soil Sci. Soc. Am. J. 2010, 3, 906–914. [Google Scholar] [CrossRef]
  27. Guo, L.; Zhang, H.T.; Chen, J.H. Kriging interpolation and geographically weighted regression model. Acta Pedol. Sin. 2012, 49, 1037–1042. [Google Scholar]
  28. Nie, P.X.; Fang, S.H.; Gong, Y. Spatial differentiation of soil water in Hebei Province based on GWR model. Res. Soil Water Conserv. 2019, 26, 98–105. [Google Scholar]
  29. Chen, H.; Li, Q.; Zhang, Y.H.; Zhou, C.Y.; Wang, Z.T. Estimations of PM2.5 concentrations based on the method of geographically weighted regression. J. Environ. Sci. 2016, 36, 2142–2151. [Google Scholar]
  30. Xiao, L.; Lang, Y.; Christakos, G. High-resolution spatiotemporal mapping of PM2.5 concentrations at Mainland China using a combined BME-GWR technique. Atmos. Environ. 2018, 173, 295–305. [Google Scholar] [CrossRef]
  31. Li, C.; Li, F.; Wu, Z.; Chen, J. Exploring spatially varying and scale-dependent relationships between soil contamination and landscape patterns using geographically weighted regression. Appl. Geogr. 2017, 82, 101–114. [Google Scholar] [CrossRef]
  32. Yuan, Y.M.; Cave, M.; Xu, H.F.; Zhang, C.S. Exploration of spatially varying relationships between Pb and Al in urban soils of London at the regional scale using geographically weighted regression (GWR). J. Hazard. Mater. 2020, 393, 122377. [Google Scholar] [CrossRef] [PubMed]
  33. Xu, H.F.; Zhang, C.S. Investigating spatially varying relationships between total organic carbon contents and pH values in European agricultural soil using geographically weighted regression. Sci. Total Environ. 2021, 752, 141977. [Google Scholar] [CrossRef]
  34. Wang, Q.; Feng, H.X.; Feng, H.Y. The impacts of road traffic on urban air quality in Jinan based GWR and remote sensing. Sci. Rep. 2021, 11, 15512. [Google Scholar] [CrossRef]
  35. Pang, R.Q.; Teng, F.; Wei, Z. Dynamic mechanism analysis of population urbanization in Jilin Province based on geographical weighted regression. Sci. Geogr. Sin. 2014, 34, 1210–1217. [Google Scholar]
  36. Shan, S.W.; Hao, Y.; Fei, G. Spatial patterns and origins of heavy metals in Sheyang River catchment in Jiangsu, China based on geographically weighted regression. Sci. Total Environ. 2017, 580, 1518–1529. [Google Scholar]
  37. Lu, R.K. Soil and Agro-Chemistry Analysis; China Agriculture Press: Beijing, China, 2000. (In Chinese) [Google Scholar]
  38. Chen, Z.F.; Fan, L.D.; Chen, Y.Z.; Xing, L.T.; Yang, Y.J.; Xiang, Z.T.; Wang, X.L. Spatial distribution and source analysis of heavy metals in agricultural soils in a Peri-urban area based on IDW interpolation and chemical fractions: A case study in Henan Province. J. Environ. Sci. 2016, 36, 1317–1327. [Google Scholar]
  39. Norvell, W.A.; Wu, J.; Hopkins, D.G.; Welch, R.M. Association of cadmium in durum wheat grain with soil chloride and chelate-extractable soil cadmium. Soil Sci. Soc. Am. J. 2000, 64, 2162–2168. [Google Scholar] [CrossRef]
  40. Shao, Y.X.; Yang, Z.F.; Wang, L.; Zhuo, X.X.; Zhang, Q.Z. Bioavailability and influencing factors of Cd in soil-rice system in Nanliujiang River Basin, Guangxi. Geoscience 2021, 35, 625–636. (In Chinese) [Google Scholar]
  41. Zhang, X.Q.; Wu, H.X.; Chen, S.B.; Meng, Y.; Luo, Y.J.; Ren, D.J.; Zhang, S.Q. Influencing factors and fitting models of available cadmium in soil of woodland in China. China Environ. Sci. 2021, 41, 2761–2772. [Google Scholar]
  42. Zhang, H.; Ma, X.P.; Shi, X.L.; Sui, H.T.; Su, H.; Yang, H. Study on influencing factors of spatial distribution of Cd and Cr in regional soil. Soils 2018, 5, 989–998. [Google Scholar]
  43. Tang, G.A.; Yang, X. Experimental Tutorials of ArcGIS Spatial Analysis; Science Press: Beijing, China, 2006. [Google Scholar]
  44. Yang, X.T.; Qiu, X.P.; Fang, Y.P.; Yun, X.U.; Zhu, F.B. Spatial variation of the relationship between transport accessibility and the level of economic development in Qinghai-Tibet Plateau, China. J. Mt. Sci. 2019, 8, 1883–1990. [Google Scholar] [CrossRef]
  45. Moran, P. A Test for the Serial Independence of Residuals. Biometrika 1950, 37, 178–181. [Google Scholar] [CrossRef] [PubMed]
  46. Lin, G.; Fu, J.; Jiang, D.; Wang, J.; Wang, Q.; Dong, D. Spatial variation of the relationship between PM2.5 concentrations and meteorological parameters in China. BioMed Res. Int. 2015, 2015, 259–265. [Google Scholar] [CrossRef] [PubMed]
  47. Kalogirou, S. A spatially varying relationship between the proportion of foreign citizens and income at local authorities in Greece. In Proceedings of the 10th International Congress of the Hellenic Geographical Society, Thessaloniki, Greece, 22–24 October 2014; pp. 1458–1466. [Google Scholar]
  48. Luo, Z.B.; Fu, C.; Zhang, W.Y.; Feng, Q.Y.; Zhang, S.L.; Ma, J. Heavy metal contamination and health risk assessment in the soil surrounding a secondary lead plant. Environ. Sci. Technol. 2018, 41, 197–204. (In Chinese) [Google Scholar]
  49. Babu, D.S.; Singh, T.S.A.; Nidheesh, P.V.; Kumar, M.S. Industrial wastewater treatment by electrocoagulation process. Sep. Sci. Technol. 2019, 4, 1–33. [Google Scholar]
  50. Naidu, R.; Bolan, N.S.; Kookana, R.S.; Tiller, K.G. Ionic-strength and pH effects on the sorption of cadmium and the surface charge of soils. Eur. J. Soil Sci. 1994, 45, 419–429. [Google Scholar] [CrossRef]
  51. Wang, Y.; Liu, J.S.; Wang, J.D.; Wang, G.P. Effects of pH on the Fraction Transformations of Cd in Phaiozem Soil at the Condition of Freeze/Thaw Cycles. J. Agro-Environ. Sci. 2008, 27, 574–578. [Google Scholar]
  52. Wang, A.S.; Angle, J.S.; Chaney, R.L. Soil pH effects on uptake of Cd and Zn by Thlaspi caerulescens. Plant Soil 2006, 281, 325–337. [Google Scholar] [CrossRef]
  53. Singh, B.R.; Myhr, K. Cadmium uptake by barley as affected by Cd sources and pH levels. Geoderma 1998, 84, 185–194. [Google Scholar] [CrossRef]
  54. Kirkham, M.B. Cadmium in plants on polluted soils: Effects of soil factors, hyperaccumulation, and amendments. Geoderma 2006, 137, 19–32. [Google Scholar] [CrossRef]
  55. Lee, J.H.; Doolittle, J.J. Phosphate application impacts on cadmium sorption in acidic and calcareous soils. Soil Sci. 2002, 167, 390–400. [Google Scholar] [CrossRef]
  56. Huang, Q.Q.; Liu, X.; Zhang, Q.; Liu, X.X.; Qiao, Y.H.; Su, D.C.; Chen, J.S.; Li, H.F. Evaluating the environmental risk and the bioavailability of Cd in phosphorus fertilizers. Environ. Sci. Technol. 2016, 39, 156–161. [Google Scholar]
  57. Elliott, H.A.; Dennen, Y. Soil adsorption of cadmium from solution containing organic ligands. J. Environ. Qual. 1982, 11, 658–662. [Google Scholar] [CrossRef]
  58. Senesi, N.; Sposito, G.; Martin, J.P. Copper(II) and iron(II) complexation by soil humic acids: An IR and ESR study. Sci. Total Environ. 1986, 55, 351–362. [Google Scholar] [CrossRef]
  59. Naidu, R.; Harter, R.D. Effect of different organic ligands on cadmium sorption by and extractability from soils. Soil Sci. Soc. Am. J. 1998, 62, 644–650. [Google Scholar] [CrossRef]
  60. Yin, A.; Yang, Z.Y.; Ebbs, S.; Yuan, J.G.; Wang, J.B.; Yang, J.Z. Effects of phosphorus on chemical forms of Cd in plants of four spinach (Spinacia oleracea L.) cultivars differing in Cd accumulation. Environ. Sci. Pollut. Res. 2016, 23, 5753–5762. [Google Scholar] [CrossRef] [Green Version]
  61. Jiang, H.M.; Yang, J.C.; Zhang, J.F. Effects of external phosphorus on the cell ultrastructure and the chlorophyll content of maize under cadmium and zinc stress. Environ Pollut. 2007, 147, 750–756. [Google Scholar] [CrossRef]
  62. Chen, P.; Zhang, X.Y.; Song, Y.J.; Wei, N.Y.; Lin, S.C.; Wu, Q. Evaluation of soil heavy metal pollution by matter element analysis based on particle size. Environ. Sci. Technol. 2017, 40, 319–323. [Google Scholar]
  63. Chefetz, B.; Tarchitzky, J.; Deshmukh, A.P.; Hatcher, P.G.; Chen, Y. Structural characterization of soil organic matter and humic acids in particle-size fractions of an agricultural soil. Soil Sci. Soc. Am. J. 2002, 66, 129–141. [Google Scholar] [CrossRef]
  64. Quenea, K.; Lamy, I.; Winterton, P.; Bermond, A.; Dumat, C. Interactions between metals and soil organic matter in various particle size fractions of soil contaminated with waste water. Geoderma 2009, 149, 217–223. [Google Scholar] [CrossRef] [Green Version]
  65. Zhang, L.D.; Feng, S.Y. Simulation of soil particle size composition on adsorption capacity of heavy metal Cd. China Rur. Water Hydrop. 2014, 7, 81–84. (In Chinese) [Google Scholar]
Figure 1. Location of study area and the sampling sites.
Land 11 00635 g001
Figure 2. Technical flow chart.
Land 11 00635 g002
Figure 3. Spatial distribution of total, available Cd contents and soil properties in the topsoils of study area. (A) presents the spatial distribution of T-Cd contents in topsoils, (B) for A-Cd, (C) for pH, (D) for SOM, (E) for A-P, (F) for clay, (G) for sand and (H) for silt, respectively.
Land 11 00635 g003aLand 11 00635 g003b
Figure 4. Spatial variation of correlation between T-Cd, A-Cd and major soil properties, as well as their influencing intensity. (A1) shows spatial variation of the correlation between T-Cd and pH; (A2) for spatial variation of influence intensity of pH on T-Cd; (A3) for the correlation between A-Cd and pH; (A4) for influence intensity of pH on A-Cd; (B1) for the correlation between T-Cd and SOM; (B2) for influence intensity of SOM on T-Cd; (B3) for the correlation between A-Cd and SOM; (B4) for influence intensity of SOM on A-Cd; (C1) for the correlation between T-Cd and A-P; (C2) for influence intensity of A-P on T-Cd. (C3) for the correlation between A-Cd and A-P; (C4) for influence intensity of A-P on A-Cd.
Land 11 00635 g004
Figure 5. Spatial distribution of local significance values of correlation between Cd and soil properties. (A1) shows the spatial distribution for the significant levels of the correlation between T-Cd and pH; (A2) for the significance between A-Cd and pH; (B1) for T-Cd and SOM; (B2) for A-Cd and SOM; (C1) for T-Cd and A-P; (C2) for A-Cd and A-P.
Land 11 00635 g005
Table 1. T-Cd, A-Cd and their influencing factors in soils.
No.VariablesUnitExplanation
1T-Cdmg kg−1The content of total Cd in soil
2A-Cdmg kg−1The content of available-Cd in soil
3pH-Soil pH
4SOMmg kg−1Soil organic matter content
5A-Pmg kg−1Available P content in soil
6Clay%Clay content in soil
7Silt%Silt content in soil
8Sand%Sand content in soil
Table 2. Descriptive statistics of soil properties and the contents of total and available Cd in soils.
UnitMinMaxMeanSDSkewnessKurtosisCV
T-Cdmg kg−10.254.971.221.071.933.4788.16%
A-Cdmg kg−10.022.230.540.551.461.33101.97%
pH-6.828.968.050.27−0.412.803.38%
SOMg kg−11.075.462.590.610.601.4723.65%
A-Pmg kg−10.44190.5045.0631.871.864.5970.72%
Clay%0.2012.031.320.868.0896.6265.75%
Silt%1.0191.4363.6114.01−1.412.2622.02%
Sand%4.0698.7935.0814.351.392.2440.92%
Soil environmental quality standards of PR China, 2018 (pH > 7.5).
Table 3. General correlation between soil properties and the contents of total and available Cd in soils.
T-CdA-CdpHSOMA-PClaySiltSand
T-Cdcorrelation1.0000.902−0.3880.2210.191−0.175−0.2030.208
significant 0.000 *0.000 *0.000 *0.0030.0060.0010.001
A-Cdcorrelation0.9021.000−0.3770.1260.136−0.0224−0.3650.370
significant0.000 * 0.000 *0.0480.0330.000 *0.000 *0.000 *
* indicates a significant correlation at the level of 0.01 (p < 0.01).
Table 4. Global autocorrelation degree of soil influencing factors.
Moran’s IZ Scorep Value
T-Cd0.61541518.880.000 **
A-Cd0.54743216.730.000 **
SOM0.1230323.860.000114
A-P0.2015836.280.000 **
CaCO30.66984520.550.000 **
pH0.1526574.770.000002
Clay0.1570786.230.000 **
Silt0.52955816.220.000 **
Sand0.53060316.250.000 **
Note: ** indicates a significant correlation at the level of 0.01 (p < 0.01).
Publisher’s Note: MDPI stays neutral with regard to jurisdictional claims in published maps and institutional affiliations.

