Abstract
Agricultural land drainage is an instrument for growing production and a tool for the conservation of land resources. The performance of land drainage systems is thus critical for achieving sustainable agricultural production Recently, many types of software have been developed in this field for modeling and simulating the performance of these systems. SISDRENA is a simulation model of the performance of underground drainage systems. The main objectives of this paper are to simulate different combination of depths and spaces between drains and to analyze their impact on potential sugarcane productivity in the western plains of Venezuela using a land drainage system model. Therefore, three climatic scenarios were defined by annual precipitation: dry years (25% below average), normal (mean) and humid (75% above average). The scenarios were implemented in three different soil types: sandy loam, loam and silt loam, with a hydraulic conductivity of 0.19, 0.26 and 0.04 m day−1, respectively. The simulation of the yield related to soil deficit (YRD) and water stress (YRW) indicated that the highest yields were reached for the larger spacing between drains and the high conductivity hydraulic of soils. In relation to the average relative productivity (YT), it was shown that in soils with a greater water retention capacity there is an inversely proportional relationship between the spacing between drains and the productivity. We concluded that in order to reach the maximum sugarcane yield, the effect of hydraulic conductivity is more important than the changes in the precipitation pattern.
1. Introduction
Climate change impacts and their associated extreme events mean that soil fertility in areas affected by excess moisture needs to be maintained and improved. This major concern of many countries, which affects their efforts to ensure basic needs such as food and habitable land for a population [1,2,3] which is continuously growing and which presents a high interest for developing their economic activities [4], emphasizes the importance of increasing the productivity of areas currently under cultivation [5,6]. Agricultural land drainage is an instrument for growing productivity, a safeguard for sustainable investment in irrigation and a tool for the conservation of land resources [7,8,9]. In this aspect, the drain depth of installed underground drainage is one of the important factors which affects its efficiency [10,11,12].
Grown in tropical climates, sugarcane in many regions of the world is often exposed to heavy rains and periodic flooding which are significant production constraints in low-lying areas of sugarcane [13,14]. The flooding induces changes in the growth physiology and root structure of sugarcane and also favors the accumulation of sodium in sugarcane juice at the stem’s bottom, with a particularly high accumulation following prolonged flooding. These processes can have negative effects even after the soil water has been drained and re-irrigated as photosynthesis is negatively influenced by flooding [15,16,17].
Waterlogging may even occur with a high-water table just 10–15 cm below the soil surface for extended periods. This is a widespread phenomenon that drastically reduces the growth and survival of sugarcane, leading to a 15–45% reduction in cane yield [14,18]. Constantly shallow water-table depths near 20 cm are more damaging than periodic flood durations up to 14 days [13]. However, periodic flooding for 14 days at −40 cm in relation to the constant water table significantly abates the dry biomass and the leaf area index in the plant cane [19].
The response of sugarcane changes according to the soil’s structure and porosity. Thus, Pitts et al. [20] reported the positive effect on the yield when the water table is lower than 35–50 cm during plant-cane and first ratoon in sandy soils. For organic soils (Histosols), the losses in sugarcane production caused by surface depths of the water table of 16 to 37 cm are not exacerbated by periodic short-term flooding [21,22]. These researchers recommended that the fields should be drained for depths of 50 cm after flooding in 1 week so as not to affect sugarcane yields. In contrast, Ray et al. [23] demonstrated for sandy loam soil that flooding for long durations could severely reduce cane yields but that a continuous high-water table (15 cm water-table depth), can inhibit rooting depth and promote sugarcane tolerance to high water tables and flood durations greater than 11 days. In an Oxisol, Tavares et al. [24] observed that the sugarcane maturation index was not adequate when the plants were flooded and submitted to the lowering speed of a water table slower than 30 cm in 12 days.
The mathematical modeling of water table dynamics is an important tool that can improve and optimize the performance of agricultural drainage systems, as long as it is used in the design and management of drainage systems. Therefore, several computer models such as DRAINMOD, SWAP or SISDRENA are especially suitable for such water table simulations [25].
DRAINMOD [26,27,28] is a field-scale, process-based, distributed simulation model originally developed to provide a means of quantifying, on a continuous basis, the performance of multi-component drainage and related water management systems. This drainage model is commonly used in the United State and in many other countries as it is capable of simulating a number of different water management scenarios [29,30,31,32,33,34,35,36,37,38,39,40,41,42,43,44,45,46,47,48,49,50,51,52,53].
SWAP [54,55,56], is another important model that was designed to simulate the flow and transport of water, solutes and thermal energy (heat flow) in unsaturated–saturated soils during growing seasons and also for long term time series. This model describes a domain from the top of the canopy to the groundwater which may be in interaction with a surface water system. SWAP is often used to analyze the processes in agro-hydrological field experiments and to simulate different groundwater table and irrigation scenarios [33,56,57,58,59,60,61,62,63].
The SISDRENA model [64] is a one-dimensional model that accounts for the main components that affect the water balance in a volume of homogeneous soil and of a unitary surface located equidistant between two parallel drains and extending from the barrier layer to the soil surface. Its performance in drainage systems design is similar to the DRAINMOD model. This model has been used by researchers to find the answers to several scientific questions related to land drainage [65,66,67,68,69] and simulates the performance of the drainage system in sugarcane [24,70,71,72,73,74].
The western plains of Venezuela is the region with the highest production of sugarcane [75,76].
The main objectives of this paper are to simulate different combinations of depths and spaces between drains and to analyze their impact on potential sugarcane productivity in the western plains of Venezuela using the SISDRENA model.
2. Materials and Methods
2.1. Study Area
The region analyzed in this study is situated between the Barinas and Portuguese states in the western part of Venezuela, covering around 20,000 km2 (Figure 1). Soils from the western plains of Venezuela have been used for the intensive production of cereals such as maize, sorghum, sesame corn, sunflower maize, cotton maize, rice and sugarcane. The most common types of soil are loam and sandy loam [77,78,79,80].
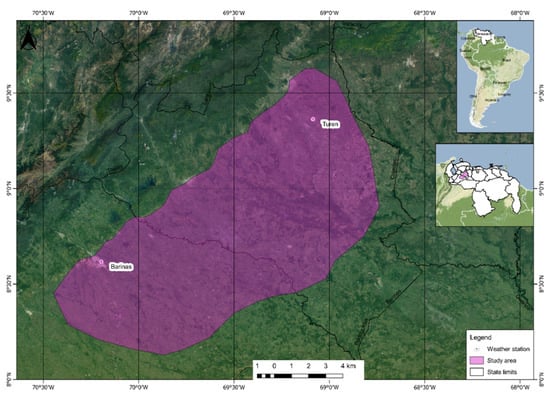
Figure 1.
Weather station locations: Barinas and Turen in the western plain region of Venezuela.
For this study, we used climate information such as precipitation, global radiation and maximum and minimum temperature from 2 locations: Barinas Airport (serial number 3147 according to the National Institute of Meteorology and Hydrology (INAMEH), located within 70° 13′ 16″ W, 8° 37′ 12″ N, 203 MAMSL) and Turen (serial number 2277 according to INAMEH, located within, 69° 06′ 14″ W, 9° 15′ 49″ N, 275 MAMSL) weather stations (Figure 1). The Barinas and Turen meteorological stations belong to the Awi climate zones according to the Köppen classification.
The daily records for a 40 year period (1972–2012) were provided by the National Institute of Meteorology and Hydrology of Venezuela (INAMEH, available online at http://estaciones.inameh.gob.ve/descargaDatos/vistas/bajarArchivo.php, accessed on 12 November 2021) and the Global Historical Climatology Network (GHCN, https://www.ncdc.noaa.gov/cdo-web/search?datasetid=GHCND, accessed on 12 November 2021). In order to cover the gaps from these time series, we used the DSSAT WGEN data generator [81,82,83,84].
2.2. Drainage Systems Model
SISDRENA was coded in Visual Basic 6.0 at the Department of Biosystems Engineering (LEB), “Luiz de Queiroz” College of Agriculture (ESALQ/USP), Piracicaba, São Paulo, Brazil. It is a one-dimensional model that accounts for the major components that affect the water balance such as: precipitation, runoff, infiltration, percolation to groundwater, upstream from the groundwater level to the root zone, evapotranspiration, drainage and vertical “seepage” (Figure 2).
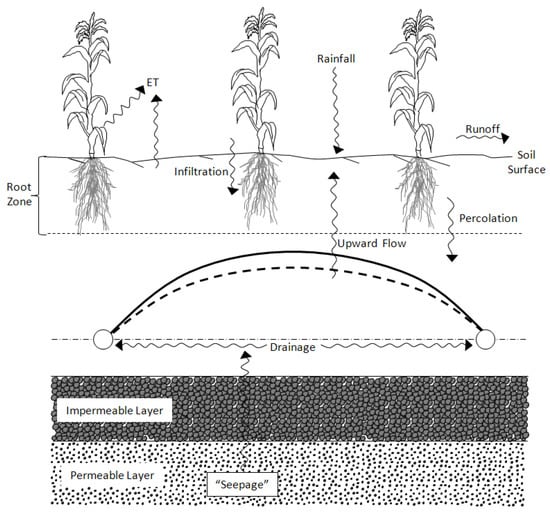
Figure 2.
Scheme of the main flow components considered by the model [64].
The required input parameter, and output parameters provided by SISDRENA are given in Table 1 and Table 2, respectively.

Table 1.
SISDRENA input parameters.

Table 2.
SISDRENA output parameters.
Initially, the model separates the precipitation that reaches the soil surface in runoff and infiltration. The runoff is estimated by using a modification of the Curve Number method [85], and infiltration is the difference between the total precipitation and the runoff. According to this method, the runoff is calculated by Equation (1):
where E is the runoff [mm], P is the total precipitation [mm] and S represents the potential retention [mm].
The potential retention is a function of the Curve Number (CN). CN values are dependent on land cover, hydrological condition, soil type and initial soil moisture. The CN value is divided into three classes; CN Class II is used by the model. CN Class I and CN Class III values are used to determine the maximum and minimum potential retention as shown in Equations (2) and (3), respectively.
where Smax is the maximum potential retention (mm) and CN1 is the curve number Class I, dimensionless.
where Smin is the minimum potential retention (mm) and CN3 is the curve number Class III, dimensionless.
The SISDRENA model uses a modification of the Curve Number method, in which the potential retention is calculated by the expression:
where μ is drainable porosity (dimensionless), Dd is the drain depth (m) and h is the groundwater level above the horizontal plane passing through the center of the drains (m).
If the value of S is greater than or equal to Smax then S is set equal to Smax. Thus, the potential retention is influenced by WT depth and drainable porosity. In soils with a shallow WT, the runoff is better correlated with the water table depth than with surface soil moisture.
In the second step, the model generates a table correlating the maximum upward flow from the saturated zone to the root zone with the position of the WT, using a finite differences solution of the Darcy equation, with the van Genuchten representation of the soil water retention curve [86]. The equation used to determine flow upward through any level below the root zone is:
where v is the upward water flow in soil (cm/h), K (Ψ) = hydraulic conductivity in the unsaturated soil (cm/h), Ψ = matric head (cm of water) and z = vertical coordinate, positive downward (cm).
After the determination of flows, the model interpolates the flow corresponding to the position of water table at the current day for each daily water table depth. Then, a comparison is made between the maximum upflow obtained from the depth of groundwater and the potential evapotranspiration. The objective of this step is to separate the fraction of the daily potential evapotranspiration which comes from the WT (PETwt) and the water that comes from the root zone (PETrz). If the flow obtained is greater than the potential evapotranspiration (PET), it means that the PET is entirely supplied by PETwt and the PETrz is equal to zero. Otherwise PETwt will be the actual maximum upflow and PETrz will be the difference between the PET and maximum upflow, i.e., a part is supplied by the root zone.
In the next step, based on the previous day’s soil moisture and WT depth, the model performs a daily water balance in the root zone and calculates the soil water storage and the actual evapotranspiration and determines the amount of precipitation that reaches the WT. The model then calculates WT levels using the de Zeeuw and Hellinga equation [87]:
where h = water table level calculated daily (m), hi−1 = water table level from the day before (m), rec = effective water table recharge (m/day), J = storage coefficient (days) and μ = drainable porosity (dimensionless).
The WT depth from Equation (6) is then corrected by subtraction of the evapotranspiration faction that comes from the WT, i.e.,
The root zone water storage is recalculated if the WT rises into the root zone, under the assumption that the soil is saturated below the WT and at field capacity above it. The entire profile is assumed to be saturated if the WT level rises to the soil surface.
The daily drain flow is evaluated using the equation:
where qo = daily drain flow (m/day), Ko = hydraulic conductivity of saturated soil (m/day), deq = Hooghoudt, equivalent depth (m) and L = drain spacing (m).
Several annual indices that reflect the performance of the drainage system, such as SEW30, number of dry days and probable and average yields are determined for each specified drain spacing. The yield data are then used to perform an economic analysis to determine the most profitable drain spacing. A flowchart for the model is given in Figure 3.
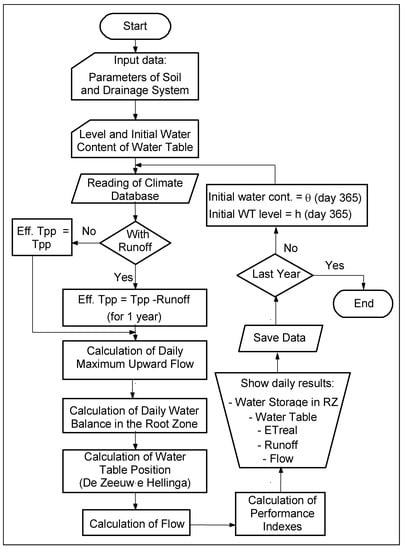
Figure 3.
Flowchart of the proposed model.
The comparisons between the performance of the SISDRENA and DRAINMOD models were conducted by estimating the standard errors between the simulated daily values of total yield and runoff, as well as the data obtained under field conditions (tile flow (cm day−1) and cumulative tile flow (cm)), taking the DRAINMOD model as standard. The results were satisfactory [66].
To estimate the relative yield of sugarcane in relation to the stresses caused by excessive soil water condition (YRW), the model uses the modified function of Carter et al. (1985) and Gayle et al. (1987) relating YRW to the SEW30 index [88,89].
Therefore, Duarte et al. (2002) suggests the following equations [70]:
In order to determine the relation between sugarcane yield and stresses due to drought stresses (YRD), SISDRENA uses the following equation:
where Y (decimal) represents the yield loss, estimated using the production function proposed by [90], which is dependent on the evapotranspiration deficit.
Finally, the total relative yield (YT, decimal) is determined according to the methodology provided by the authors of [91], considering together the effects of water excess and water deficit, calculated by multiplying YRW (decimal) and YRD (decimal) More information is given in [64,65,66,70,72].
Therefore, using the methodology proposed by various authors [65,70,72,73] the water balance in the root zone of sugarcane was determined using the available water data in each proposed scenario (Soil 1, Soil 2 and Soil 3, see Section 2.3). The geometric parameters of the drainage system used in the simulations were: spacing between drains ranging from 10 to 100 m, with intervals of 10 m; installation depths of 1.2, 1.4 and 1.6 m; initial depth of the water table at 50% of the installation depth; the depth of the impermeable layer at 5 m; and the effective radius of the drains at 0.05 m. For the simulations, the cultivation of sugarcane, with a one-year cycle, was assumed to be planted in January, with three stages of development. These development stages were defined by [90] as follows: vegetative establishment (125 days), training of the production (120 days) and maturation (120 days).
2.3. Environmental Data
The rainfall data series were classified according to the annual rainfall, adapted to [92] in dry, normal and wet years, with percentiles of 0.25, 0.5 and 0.75, respectively. The runoff was calculated by a modification of the Soil Conservation Service–curve number (SCS–CN) method [85]. The water table movement (LF) was estimated using the equation proposed in [87] and the moisture in the root zone of the crop was calculated using the water balance method [64]. For our study, PET was calculated according to [93,94] using the FAO-24 Blaney–Criddle method, with the Reference Evapotranspiration Calculation Software (REF-ET v 2.0) [95].
For the Barinas weather station, a wet year is characterized by annual precipitations of 1511 mm, a dry year by 1271 mm/year, while in a normal year, 1393 mm can be recorded. In Turen these results were approximately 2715 mm, 1613 mm and 2452 mm, for wet, dry and normal years, respectively. In relation to temperature, for Barinas we considered the maximum value of 29.5 °C and the minimum of 27.5, with an average annual value of 28.4 °C; in Turen the values were 28.7 °C, 26.2 °C and 27.4 °C, respectively. The average annual PET was 1733.9 mm and 1614.4 mm for Barinas and Turen, respectively (Figure 4).
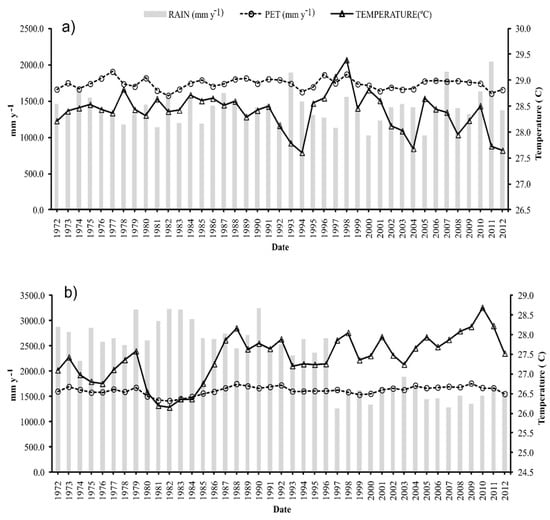
Figure 4.
Annual precipitation (mm year−1), PET (mm year−1) and temperature (°C) in the period of 1972–2012 for the Barinas (a) and Turen (b) weather stations.
The soils were defined in the model according to their hydraulic conductivity and the parameters of the retention curve, with different textures of sandy loam (Soil 1), loam (Soil 2) and silt loam (Soil 3). The values assumed by simulation in terms of the soil characteristics shown in Table 3.

Table 3.
Soil physical–water parameters used for simulations, texture, soil water retention equation adjustment parameters (n and m), soil volumetric moisture corresponding to saturation, residual, field capacity and wilt point (θsat, θr, θfc e θwp), the inverse of the air entry suction (α) and saturated hydraulic conductivity (Ksat).
3. Results
3.1. Impact on Simulated Sugarcane Yield to Soil 1
Figure 5 shows the average values of YRW, YRD and the total average relative yield (YT) for soil 1 and their respective spacing, revealing the effects related to water excess, lack of water and the combined effect of these two factors on the relative yield of sugarcane. For the same spacing, as the drain depth increased, higher yield values were obtained relative to the excess water. In relation to yield loss in soil 1, the YRW was the most important factor for both locations. This result is related to the differences between the Barinas and Turen weather stations and is also related to the difference in precipitation as the Turen station has a higher rainfall than Barinas.
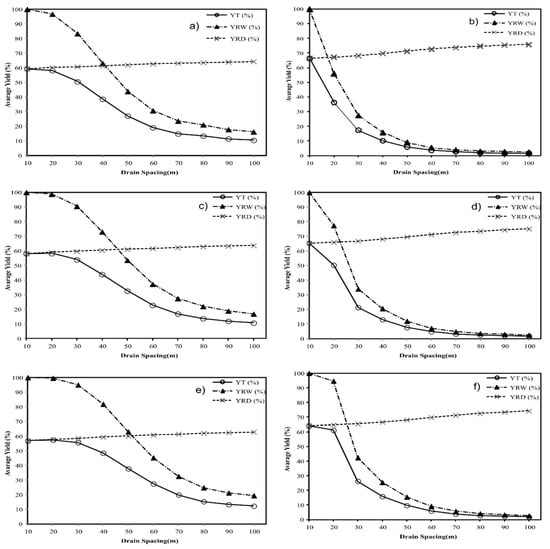
Figure 5.
Yield due to excess water (YRW), deficit (YRD) and total (YT) for sugarcane in the period of 1972–2012, for soil 1 for drain spaces varying from10 to 100 m and drain depths of 1.2 (a,b), 1.4 (c,d) and 1.6 (e,f) m for the Barinas (a,c,e) and Turen (b,d,f) weather stations.
Therefore, for the space of 100 m, the yield breakage was greater for drain depths of 1.2 m. It was also observed that, to reduce the stress due to excess water, the space adopted should be less than 20 and 10 m for the Barinas and Turen stations, respectively, for a drain depth of 1.6 m. This can be explained by the relationship between the drainage depths and spacings. In fact the optimal spacing distance between the drainage lines is given as the depth of the drain increases.
Figure 6 reveals the effects of rainfall variation (i.e., normal, wet and dry years) on the yield. For the years considered to have normal rainfall, the spaces that provided the highest average yields were approximately 30 and 40 m for Barinas and 10 and 20 m for Turen (because Barinas has a lower mean rainfall than Turen). In the wet years, the YT values maintained for Turen were approximately similar to normal conditions, but for Barinas, they decreased to 30 m. For the dry conditions, it was observed that Turen suffered a greater effect under an increasing yield to reduce the stress due to excess water compared to Barinas. This indicates that if there is a change in the precipitation conditions (i.e., normal, wet and dry years) there are differences in the average yield (YT) of sugarcane and the differences also occurred between the locals and were higher for Turen.
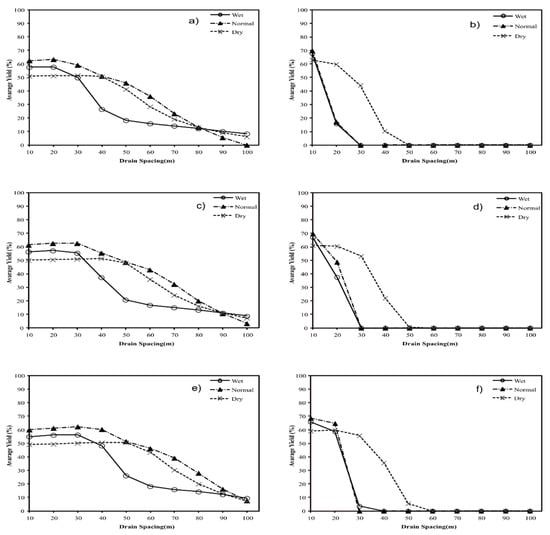
Figure 6.
Yield of sugarcane (YT), for normal rainfall and dry and wet years, for drain spaces varying from 10 to 100 m for soil 1 anddrain depths of 1.2 (a,b), 1.4 (c,d) and 1.6 (e,f) m for the Barinas (a,c,e) and Turen (b,d,f) weather stations.
3.2. Impact on Simulated Sugarcane Yield to Soil 2
For soil 2, the values of YRW, YRD and YT were lower than the case of soil 1. This result is related to the hydraulic conductivity effect. The YRW was the important factor for both locations. The spaces that better reduced the stress due to excess water were 30 m and 20 m for the Barinas and Turen stations, respectively (Figure 7). For both sites, the effect of rainfall variation was higher in Turen than in Barinas (Figure 8); in the normal years it could reach up to 40 m in Barinas while it was less than 20 m in Turen.
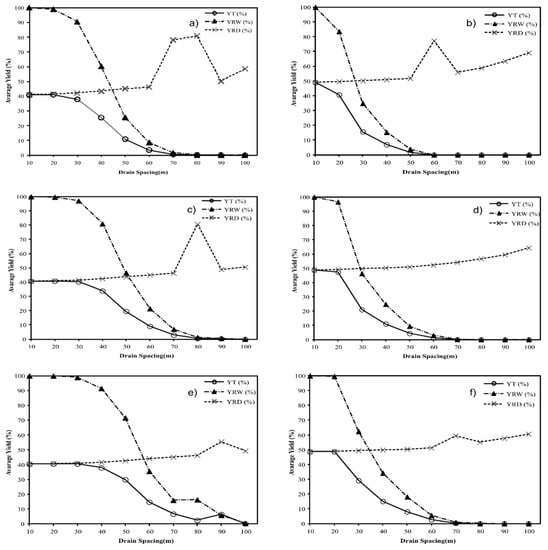
Figure 7.
Yield due to excess of water (YRW), deficit (YRD) and total (YT) for sugarcane in the period of 1972–2012, for soil 2 for drain spaces varying from 10 to 100 m and drain depths of 1.2 (a,b), 1.4 (c,d) and 1.6 (e,f) m in the Barinas (a,c,e) and Turen (b,d,f) weather stations.
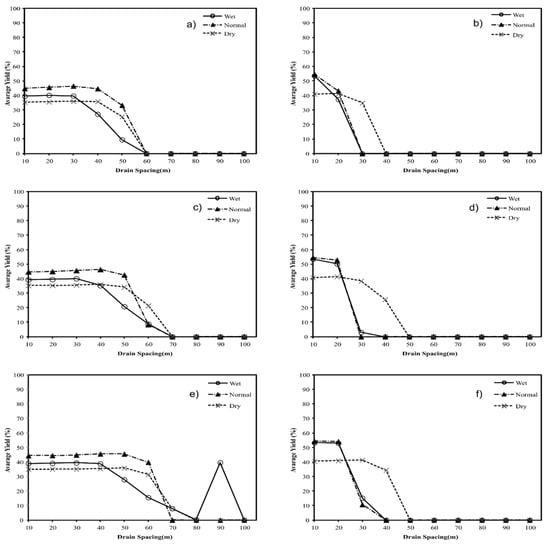
Figure 8.
Yield of sugarcane (YT), for normal rainfall and dry and wet years and for drain spaces varying from 10 to 100 m for soil 2 and drain depths of 1.2 (a,b), 1.4 (c,d) and 1.6 (e,f) m for the Barinas (a,c,e) and Turen (b,d,f) weather stations.
3.3. Impact on Simulated Sugarcane Yield to Soil 3
For soil 3, YRW decreased quickly as the spaces became greater. It can be noted that the productivity loss due to the excess of water was higher for the two stations in soil 3 with respect to the effect of the YRD, showing that water excess was the most important factor for both locations. This result is related to the effect of hydraulic conductivity. The differences between the Barinas and Turen stations are also related to the difference in precipitation, because the Turen station has a higher rainfall than Barinas (Figure 9). Thus, the drain spaces of 20 m and 10 m for Barinas and Turen stations, respectively, for a drain depth of 1.6 m were the spaces that generated the lowest yield loss.
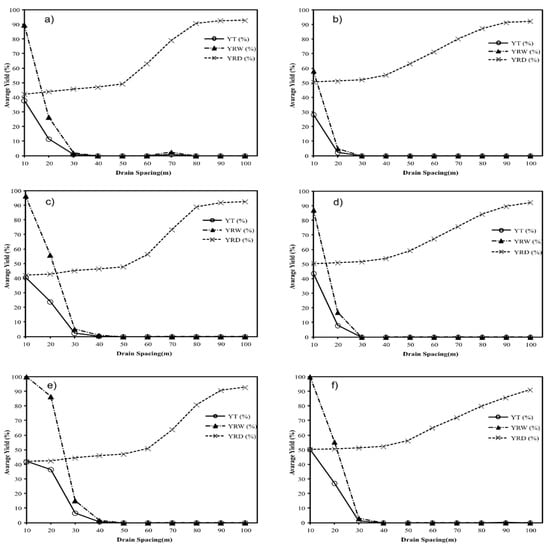
Figure 9.
Yield due to excess water (YRW), deficit (YRD) and total (YT) for sugarcane in the period of 1972–2012 for soil 3 for drain spaces varying from 10 to 100 m and drain depths of 1.2 (a,b), 1.4 (c,d) and 1.6 (e,f) m in the Barinas (a,c,e) and Turen (b,d,f) weather stations.
For soil 3, in all rainfall year conditions (Figure 10), the results were similar to the ones obtained previously with approximately 10 m spaces between the drains. We can notice that for this soil, the effect of low hydraulic conductivity is more important than the changes in the rainfall pattern.
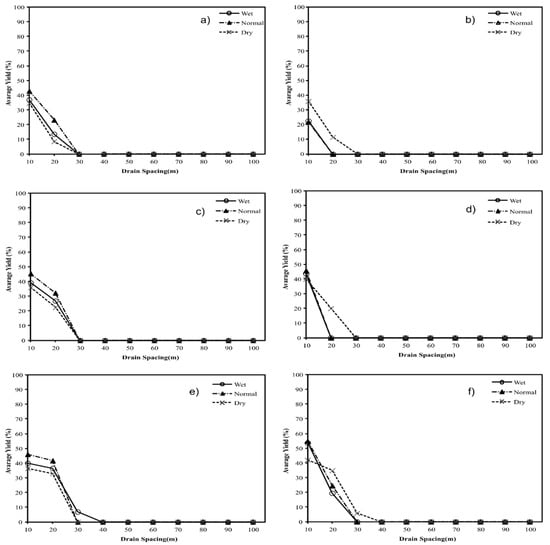
Figure 10.
Yield of sugarcane (YT), for normal and dry and wet years for drain spaces varying from 10 to 100 m and drain depths of the 1.2 (a,b), 1.4 (c,d) and 1.6 (e,f) m in the Barinas (a,c,e) and Turen (b,d,f) weather stations.
4. Discussion
The differences between the Barinas and Turen weather stations can be identified in precipitation volumes, with Turen having a higher rainfall than Barinas.
The average values of YRW, YRD and YT for soils 1, 2 and 3 and their respective spaces reveal the effects related to water excess, lack of water and the combined effect of these two factors on the relative yield of sugarcane. With respect to the effect of YRD, as the model does not predict irrigations, even with a space of 100 m there was a decrease in yield. In relation to the yield relative to YRW, it can be noted that the productivity loss due to excess water was higher for the two stations in Soil 3.
The relative yield of sugarcane relative to the stresses caused by the excessive soil water condition (YRW) simulation indicates that the highest yields were achieved using the data from Barinas with greater spaces for soil 1 (80 m and a drain depth of 1.6 m) compared to soil 2 (40 m with a drain depth of 1.6 m). The lowest values (10 m and drain depth of 1.6 m) were found for soil 3 for both locations. e The effect of the fluctuation of the water table on the yield of the sugar cane is therefore evident. The simulation of the yield related to the soil water deficit (YRD) shows that the highest values were obtained using data from the Barinas station with larger spacing in soil 3 (100 m) compared to soil 2 (80 m), due to fact that soil 3 had a higher water retention capacity.
It was also observed that to reduce the stress due to excess water, the spaces between the drains should be less than 20 and 10 m for soils1. Youssef et al. [30] mentioned that the largest differences in water table depth predictions between models occurs after major rainfall events.
For sugarcane grown in clay soil, Askar et al. [45] suggested drain depths of 1.4 to 1.8 m and spaces between drains ranging from 25 to 40 m. In clay-loam soil the drain pipes should be installed at spaces of between 55 and 70 m, with a corresponding drain depth between of 1.4 and 1.8 m. On the other hand,, various authors [65,70,72,73] have determined that the best spaces of drains that presented the highest relative yield of sugarcane for clay loam, clay, silt clay loam soils were 60 m, 40 m and 30 m, respectively.
Accordingly, considering only the effect of the water deficit for Barinas on soils 1 and 2, the most favorable spaces would be greater than 80 m and for soil 3 more than 60 m. In the case of Turen, soils 1 and 2 require spaces greater than 60 m and for soil 3 the most favorable space would be over 50 m. Similar to this, Lisenbee et al. [46] suggested that in low land the yield losses due to water excess were more frequent than losses due to droughts. In soil 3, the effect of wastewater excess was very severe, so that the space that allowed a higher yield remained around 10 m.
Contrariwise for corn yield, Resende et al. [68] observed with SISDRENA that the best drain space for clay and clay loam soil is 20 m and that clay loam soils tended to have a higher productivity and economic return than clay soil. Even Lisenbee et al. [46], using DRAINMOD, found that 40 m was a threshold distance for drain spacing in sandy loam soil, beyond which yields start to decrease due to under-drainage.
The YT considers the effects of normal rainfall and dry and wet years on variation yield. For the years considered normal, the spaces that provided the highest average yields for soils 1 and 2 were higher for Barinas because there the mean rainfall is lower than in Turen; therefore, smaller spacings were obtained in all cases in this area. Under these conditions, the YT of the sugarcane is strongly influenced by the upward flow of water. In terms of climatic conditions, Turen was rainier than Barinas when compared to normal, dry and humid years, so the highest average yields for soils 1 and 2 were higher for Barinas (30 and 40 m, respectively). For the dry rain years and in normal conditions, the highest results were obtained at Barinas with approximately 50 m for soils 1 and 2.
For soil 3, in all simulated conditions, the result was similar at approximately 10 m. It can be s concluded that in order to reach the maximum sugarcane yield, the effect of soil hydraulic conductivity is more important. In this case, for a more detailed assessment an economic analysis must be carried out to verify if drainage is indicated in these soils.
Moreover, the results showed that the higher the hydraulic conductivity of the soil, the greater the space that optimizes the productivity. Some improvements in water table depth simulations were obtained by increasing the accuracy of soil hydraulic property inputs, especially with respect to time pattern behavior [32]. For instance, Miranda et al. [71] found out that in the estimation of the YT the model is very sensitive to the values of saturated hydraulic conductivity of soil (Ko), so an increase in the values of Ko increases the error in the model estimation. Therefore, it is expected that the model does not present good estimations in alluvial soils with high values of Ko.
Due to a lack of field information related to the impact of controlled drainage on sugarcane yield in the western plains of Venezuela, field experiments are recommended to further characterize performance, specifically explaining sugarcane yield and the total water balance, including the movement of water in the soil.
5. Conclusions
The results obtained by the SISDRENA model in the western plains of Venezuela allowed us to conclude that for the total relative yield of sugarcane, it is verified that the lower the drain depth and the greater the spaces between the drains, the greater the decrease in the yield of the sugarcane and these effects are more evident in soils with a greater water retention capacity. In order to reach the maximum sugarcane yield, the effect of soil hydraulic conductivity is more important. In this case, for a more detailed assessment, an economic analysis must be carried out to verify if drainage is indicated in these soils. In view of the results obtained in the simulations, it can be concluded that the SISDRENA model represents a tool for modeling drainage and can be applied to different climate and soil conditions.
Author Contributions
Conceptualization, A.J.F.-R. and J.H.d.M.; methodology, M.A.M.-P., S.N.D. and F.J.P.-T.; software, J.H.d.M., S.N.D. and R.H.-C.-Z.; validation, A.J.F.-R., M.A.M.-P. and F.J.P.-T.; formal analysis, J.H.d.M., R.H.-C.-Z., S.N.D. and A.J.F.-R.; investigation, M.A.M.-P., F.J.P.-T. and C.H.-C.-Z.; resources, A.J.F.-R., M.A.M.-P., F.J.P.-T. and L.S.; data curation, J.H.d.M., L.S. and R.H.-C.-Z.; writing—original draft preparation, A.J.F.-R., J.H.d.M. and R.H.-C.-Z.; writing—review and editing, R.H.-C.-Z., L.S. and C.H.-C.-Z.; visualization, R.H.-C.-Z., L.S. and C.H.-C.-Z.; supervision, R.H.-C.-Z. and J.H.d.M.; project administration, A.J.F.-R. and J.H.d.M.; funding acquisition, R.H.-C.-Z. All authors have read and agreed to the published version of the manuscript.
Funding
This research received no external funding.
Institutional Review Board Statement
Not applicable.
Informed Consent Statement
Not applicable.
Data Availability Statement
Not applicable.
Acknowledgments
The authors acknowledge support from the Coordination for the Improvement of Higher Education Personnel (CAPES) and the National Council for Scientific and Technological Development (CNPq) for the scholarships to train researchers in universities, and the Council of Scientific and Humanistic Development) of the Universidad Central de Venezuela (CDCH-UCV).
Conflicts of Interest
The authors declare no conflict of interest.
References
- Salvati, L.; Venezian-Scarascia, M.E.; Zitti, M. Monitoring drought severity in agriculture through a synthetic index based on dry periods: A case study in the Mediterranean basin. Irrig. Drain. J. Int. Comm. Irrig. Drain. 2009, 58, 596–606. [Google Scholar] [CrossRef]
- Bajocco, S.; Ceccarelli, T.; Smiraglia, D.; Salvati, L.; Ricotta, C. Modeling the ecological niche of long-term land use changes: The role of biophysical factors. Ecol. Indic. 2016, 60, 231–236. [Google Scholar] [CrossRef]
- Smiraglia, D.; Ceccarelli, T.; Bajocco, S.; Salvati, L.; Perini, L. Linking trajectories of land change, land degradation processes and ecosystem services. Environ. Res. 2016, 147, 590–600. [Google Scholar] [CrossRef]
- Serra, P.; Salvati, L.; Queralt, E.; Pin, C.; Gonzalez, O.; Pons, X. Estimating water consumption and irrigation requirements in a long-established mediterranean rural community by remote sensing and field data. Irrig. Drain. 2016, 65, 578–588. [Google Scholar] [CrossRef]
- Ritzema, H.P.; Stuyt, L.C.P.M. Land drainage strategies to cope with climate change in the Netherlands. Acta Agric. Scand. Sect. B Soil Plant Sci. 2015, 65 (Suppl. S1), 80–92. [Google Scholar] [CrossRef]
- Meyer, K.; Keiser, D.A. Adapting to Climate Change through Tile Drainage: A Structural Ricardian Analysis; Iowa State University: Ames, IA, USA, 2016. [Google Scholar]
- Scarascia, M.V.; Battista, F.D.; Salvati, L. Water resources in Italy: Availability and agricultural uses. Irrig. Drain. J. Int. Comm. Irrig. Drain. 2006, 55, 115–127. [Google Scholar] [CrossRef]
- Salvati, L.; Petitta, M.; Ceccarelli, T.; Perini, L.; Di Battista, F.; Scarascia, M.E.V. Italy’s renewable water resources as estimated on the basis of the monthly water balance. Irrig. Drain. J. Int. Comm. Irrig. Drain. 2008, 57, 507–515. [Google Scholar] [CrossRef]
- Bajocco, S.; De Angelis, A.; Salvati, L. A satellite-based green index as a proxy for vegetation cover quality in a Mediterranean region. Ecol. Indic. 2012, 23, 578–587. [Google Scholar] [CrossRef]
- Nijland, B.H.J.; Croon, F.W.; Ritzema, H.P. Subsurface Drainage Practices: Guidelines for the Implementation, Operation and Maintenance of Subsurface Pipe Drainage Systems; ILRI: Wageningen, The Netherlands, 2005. [Google Scholar]
- King, K.W.; Williams, M.R.; Macrae, M.L.; Fausey, N.R.; Frankenberger, J.; Smith, D.R.; Kleinman, P.J.A.; Brown, L.C. Phosphorus transport in agricultural subsurface drainage: A review. J. Environ. Qual. 2015, 44, 467. [Google Scholar] [CrossRef]
- Dezful, M.A.; Mahmoudi, S.; Masih Abadi, M.H.; Naseri, A.A. Soil morphology as an indicator for assessment of drainage system efficiency in sugarcane cultivated lands, South Khuzestan, Iran. Eurasian J. Soil Sci. 2015, 4, 234. [Google Scholar] [CrossRef]
- Glaz, B.; Morris, D.R. Sugarcane responses to water-table depth and periodic flood. Agron. J. 2010, 102, 372–380. [Google Scholar] [CrossRef]
- Gomathi, R.; Gururaja Rao, P.N.; Chandran, K.; Selvi, A. Adaptive responses of sugarcane to waterlogging stress: An over view. Sugar Tech. 2015, 17, 325–338. [Google Scholar] [CrossRef]
- Hidaka, T.; Karim, M.A. Flooding tolerance of sugarcane in relation to growth, physiology and root structure. South Pac. Stud. 2007, 28, 9–22. [Google Scholar]
- Jaiphong, T.; Tominaga, J.; Watanabe, K.; Nakabaru, M.; Takaragawa, H.; Suwa, R.; Ueno, M.; Kawamitsu, Y. Effects of duration and combination of drought and flood conditions on leaf photosynthesis, growth and sugar content in sugarcane. Plant Prod. Sci. 2016, 1008, 427–437. [Google Scholar] [CrossRef]
- Jaiphong, T.; Tominaga, J.; Watanabe, K.; Suwa, R.; Ueno, M.; Kawamitsu, Y. Changes in photosynthesis, growth, and sugar content of commercial sugarcane cultivars and Erianthus under flood conditions. Plant Prod. Sci. 2017, 20, 126–135. [Google Scholar] [CrossRef]
- Lakshmanan, P.; Robinson, N. Stress physiology: Abiotic stresses. In Sugarcane: Physiology, Biochemistry, and Functional Biology; Moore, P.H., Botha, F.C., Eds.; John Wiley and Sons Ltd.: Chichester, UK, 2013. [Google Scholar] [CrossRef]
- Jennewein, S.P.; Gilbert, R.A.; Rowland, D.L.; Wright, A.L.; Glaz, B.; Bennett, J.M. Four biofuel species’ responses to periodic flooding and high water tables on a Florida Histosol. BioEnergy Res. 2017, 10, 688–699. [Google Scholar] [CrossRef]
- Pitts, D.J.; Myhre, D.L.; Tsai, Y.J.; Shih, S.F. Effects of water-table depth on water relations and yield for sugarcane grown in sand. J. Am. Soc. Sugar Cane Technol. 1991, 11, 29–37. [Google Scholar]
- Glaz, B.; Gilbert, R.A. Sugarcane response to water table, periodic flood, and foliar nitrogen on organic soil. Agron. J. 2006, 98, 616–621. [Google Scholar] [CrossRef]
- Glaz, B.; Morris, D.R.; Daroub, S.H. Periodic flooding and water table effects on two sugarcane genotypes. Agron. J. 2004, 96, 832–838. [Google Scholar] [CrossRef]
- Ray, J.D.; Sinclair, T.R.; Glaz, B. Sugarcane response to high water tables and intermittent flooding. J. Crop. Improv. 2010, 24, 12–27. [Google Scholar] [CrossRef]
- Tavares, A.C.S.; Duarte, S.N.; Dias, N.S.; Sá, F.V.D.S.; de Miranda, J.H.; Fernandes, C.S. Produção e maturação de cana-de-açúcar submetida a encharcamento em diferentes estádios de desenvolvimento. IRRIGA 2017, 22, 154–166. [Google Scholar] [CrossRef]
- Halbac-Cotoara-Zamfir, R.; Miranda, J.H. A comparasion regarding models used in agricultural drainage systems design in Brazil and Romania. Proc. Actual Tasks Agric. Eng. 2012, 40, 98–116. [Google Scholar]
- Skaggs, R.W. A Water Management Model for Shallow Water Table Soils; Water Resources Research Institute of the University of North Carolina: Raleigh, NC, USA, 1978. [Google Scholar]
- Skaggs, R.W. Field evaluation of a water management simulation model. Trans. ASAE 1982, 25, 666–674. [Google Scholar] [CrossRef]
- Skaggs, R.W. DRAINMOD: A simulation model for shallow water table soils. In Proceedings of the 2008 South Carolina Water Resources Conference, Charleston, SC, USA, 14–15 October 2008. [Google Scholar]
- Hassan Askar, M.H.S. DRAINMOD-P: A Model for Simulating Phosphorus Dynamics and Transport in Artificially Drained Agricultural Lands. Master’s Thesis, North Carolina State University, Raleigh, NC, USA, 4 January 2019; p. 254. [Google Scholar]
- Youssef, M.A.; Abdelbaki, A.M.; Negm, L.M.; Skaggs, R.W.; Thorp, K.R.; Jaynes, D.B. DRAINMOD-simulated performance of controlled drainage across the U.S. Midwest. Agric. Water Manag. 2018, 197, 54–66. [Google Scholar] [CrossRef]
- Poole, C.A.; Skaggs, R.W.; Youssef, M.A.; Chescheir, G.M.; Crozier, C.R. Effect of drainage water management on nitrate nitrogen loss to tile drains in North Carolina. Trans. ASABE 2018, 61, 233–244. [Google Scholar] [CrossRef]
- Negm, L.M.; Youssef, M.A.; Jaynes, D.B. Evaluation of DRAINMOD-DSSAT simulated effects of controlled drainage on crop yield, water balance, and water quality for a corn-soybean cropping system in central Iowa. Agric. Water Manag. 2017, 187, 57–68. [Google Scholar] [CrossRef]
- Liu, R.; Hayden, H.L.; Suter, H.; Hu, H.W.; Lam, S.K.; He, J.Z.; Mele, P.M.; Chen, D.L. The effect of temperature and moisture on the source of N2O and contributions from ammonia oxidizers in an agricultural soil. Biol. Fertil. Soils 2017, 53, 141–152. [Google Scholar] [CrossRef]
- Liu, Y.; Youssef, M.A.; Chescheir, G.M.; Appelboom, T.W.; Poole, C.A.; Arellano, C.; Skaggs, R.W. Effect of controlled drainage on nitrogen fate and transport for a subsurface drained grass field receiving liquid swine lagoon effluent. Agric. Water Manag. 2019, 217, 440–451. [Google Scholar] [CrossRef]
- Youssef, M.A.; Liu, Y.; Chescheir, G.M.; Skaggs, W.R.; Negm, L.M. DRAINMOD modeling framework for simulating controlled drainage effect on lateral seepage from artificially drained fields. Agric. Water Manag. 2021, 254, 106944. [Google Scholar] [CrossRef]
- Awad, A.; El-Rawy, M.; Abdalhi, M.; Al-Ansari, N. Evaluation of the DRAINMOD Model’s Performance Using Different Time Steps in Evapotranspiration Computations. Hydrology 2022, 9, 40. [Google Scholar] [CrossRef]
- Askar, M.H.; Youssef, M.A.; Vadas, P.A.; Hesterberg, D.L.; Amoozegar, A.; Chescheir, G.M.; Skaggs, R.W. Drainmod-P: A Model for Simulating Phosphorus Dynamics and Transport in Drained Agricultural Lands. I. Model Development. Trans. ASABE 2021, 64, 1835–1848. [Google Scholar] [CrossRef]
- Awad, A.; Wan, L.; El-Rawy, M.; Eltarabily, M.G. Proper predictions of the water fate in agricultural lands: Indispensable condition for better crop water requirements estimates. Ain Shams Eng. J. 2021, 12, 2435–2442. [Google Scholar] [CrossRef]
- Hashemi, S.Z.; Darzi-Naftchali, A.; Qi, Z. Assessing water and nitrate-N losses from subsurface-drained paddy lands by DRAINMOD-N II. Irrig. Drain. 2020, 69, 776–787. [Google Scholar] [CrossRef]
- Ndulue, E.; Sri Ranjan, R. DRAINMOD simulation of drain spacing impact on canola yield in heavy clay soils in the Canadian prairies. Irrig. Drain. 2022, 1–17. [Google Scholar] [CrossRef]
- Du, X.; Feng, H.; Helmers, M.J.; Qi, Z. Comparing Simulated Nitrate-Nitrogen Concentration In Subsurface Drainage Using Drainmod-N II and RZWQM2. Irrig. Drain. 2017, 66, 238–251. [Google Scholar] [CrossRef]
- Li, X.; Zhang, C.; Huo, Z. Optimizing irrigation and drainage by considering agricultural hydrological process in arid farmland with shallow groundwater. J. Hydrol. 2020, 585, 124785. [Google Scholar] [CrossRef]
- Liang, H.; Qi, Z.; Hu, K.; Li, B.; Prasher, S.O. Modelling subsurface drainage and nitrogen losses from artificially drained cropland using coupled DRAINMOD and WHCNS models. Agric. Water Manag. 2018, 195, 201–210. [Google Scholar] [CrossRef]
- Moursi, H.; Youssef, M.A.; Chescheir, G.M. Development and application of DRAINMOD model for simulating crop yield and water conservation benefits of drainage water recycling. Agric. Water Manag. 2022, 266, 107592. [Google Scholar] [CrossRef]
- Askar, M.H.; Youssef, M.A.; Chescheir, G.M.; Negm, L.M.; King, K.W.; Hesterberg, D.L.; Amoozegar, A.; Skaggs, R.W. DRAINMOD simulation of macropore flow at subsurface drained agricultural fields: Model modification and field testing. Agric. Water Manag. 2020, 242, 106401. [Google Scholar] [CrossRef]
- Lisenbee, W.; Hathaway, J.; Negm, L.; Youssef, M.; Winston, R. Enhanced bioretention cell modeling with DRAINMOD-Urban: Moving from water balances to hydrograph production. J. Hydrol. 2020, 582, 124491. [Google Scholar] [CrossRef]
- Rathod, S.; Dahiwalkar, S.; Gorantiwar, S.; Shinde, M. Calibration of DRAINMOD for prediction of water table depths and drain discharges under waterlogged Vertisols of Maharashtra, India. J. Appl. Nat. Sci. 2019, 11, 724–731. [Google Scholar] [CrossRef]
- Shedekar, V.S.; King, K.W.; Fausey, N.R.; Islam, K.R.; Soboyejo, A.B.; Kalcic, M.M.; Brown, L.C. Exploring the effectiveness of drainage water management on water budgets and nitrate loss using three evaluation approaches. Agric. Water Manag. 2021, 243, 106501. [Google Scholar] [CrossRef]
- Adhikari, N.; Davidson, P.C.; Cooke, R.A.; Book, R.S. Drainmod-linked interface for evaluating drainage system response to climate scenarios. Appl. Eng. Agric. 2020, 36, 36–303. [Google Scholar] [CrossRef]
- Lenhart, C.; Gordon, B.; Gamble, J.; Current, D.; Ross, N.; Herring, L.; Nieber, J.; Peterson, H. Design and hydrologic performance of a tile drainage treatment wetland in Minnesota, USA. Water 2016, 8, 549. [Google Scholar] [CrossRef]
- Shedekar, V.; King, K.W.; Fausey, N.R.; Islam, R.R.; Soboyejo, A.B.O.; Brown, L.C. Modeling effects of drainage water management in fields with rolling topography. In Proceedings of the ASABE Annual International Meeting, Spokane, Washington, DC, USA, 16–19 July 2017; American Society of Agricultural and Biological Engineers (ASABE): Saint Joseph, MI, USA, 2017. [Google Scholar] [CrossRef]
- Muma, M.; Rousseau, A.N.; Gumiere, S.J. Modeling of subsurface agricultural drainage using two hydrological models with different conceptual approaches as well as dimensions and spatial scales. Can. Water Resour. J. Rev. Can. Res. Hydr. 2017, 42, 38–53. [Google Scholar] [CrossRef]
- Pease, L.A.; Fausey, N.R.; Martin, J.F.; Brown, L.C. Projected climate change effects on subsurface drainage and the performance of controlled drainage in the Western Lake Erie Basin. J. Soil Water Conserv. 2017, 72, 240–250. [Google Scholar] [CrossRef]
- Van Dam, J.C.; Huygen, J.; Wesseling, J.; Feddes, R.; Kabat, P.; Van Walsum, P.; Groenendijk, P.; Van Diepen, C. Theory of SWAP Version 2.0. Simulation of Water Flow, Solute Transport and Plant Growth in the Soil-Water-Atmosphere-Plant Environment; Technical Document 45; Wageningen Agricultural University and DLO Winand Staring Centre: Wageningen, The Netherlands, 1997; p. 168. [Google Scholar]
- Kroes, J.G.; Van Dam, J.C.; Bartholomeus, R.P.; Groenendijk, P.; Heinen, M.; Hendriks, R.F.A.; Mulder, H.M.; Supit, I.; van Walsum, P.E.V. SWAP Version 4; Wageningen Agricultural University and DLO Winand Staring Centre: Wageningen, The Netherlands, 2017. [Google Scholar] [CrossRef]
- Pinto, V.M.; van Dam, J.C.; de Jong van Lier, Q.; Reichardt, K. Intercropping Simulation Using the SWAP Model: Development of a 2 × 1D Algorithm. Agriculture 2019, 9, 126. [Google Scholar] [CrossRef]
- Hamada, K.; Inoue, H.; Mochizuki, H.; Asakura, M.; Shimizu, Y.; Takemura, T. Evaluating Maize Drought and Wet Stress in a Converted Japanese Paddy Field Using a SWAP Model. Water 2020, 12, 1363. [Google Scholar] [CrossRef]
- Wang, X.; Cai, H.; Li, L.; Wang, X. Estimating Soil Water Content and Evapotranspiration of Winter Wheat under Deficit Irrigation Based on SWAP Model. Sustainability 2020, 12, 9451. [Google Scholar] [CrossRef]
- Zhao, Y.; Mao, X.; Shukla, M.K.; Li, S. Modeling Soil Water–Heat Dynamic Changes in Seed-Maize Fields under Film Mulching and Deficit Irrigation Conditions. Water 2020, 12, 1330. [Google Scholar] [CrossRef]
- Yuan, C.; Feng, S.; Huo, Z.; Ji, Q. Simulation of Saline Water Irrigation for Seed Maize in Arid Northwest China Based on SWAP Model. Sustainability 2019, 11, 4264. [Google Scholar] [CrossRef]
- Jamal, A.; Linker, R.; Housh, M. Optimal Irrigation with Perfect Weekly Forecasts versus Imperfect Seasonal Forecasts. J. Water Resour. Plan. Manag. 2019, 145, 06019003. [Google Scholar] [CrossRef]
- Lei, G.; Zeng, W.; Jiang, Y.; Ao, C.; Wu, J.; Huang, J. Sensitivity analysis of the SWAP (Soil-Water-Atmosphere-Plant) model under different nitrogen applications and root distributions in saline soils. Pedosphere 2021, 31, 807–821. [Google Scholar] [CrossRef]
- Mayer, A.; Rienzner, M.; Cesari de Maria, S.; Romani, M.; Lasagna, A.; Facchi, A. A Comprehensive Modelling Approach to Assess Water Use Efficiencies of Different Irrigation Management Options in Rice Irrigation Districts of Northern Italy. Water 2019, 11, 1833. [Google Scholar] [CrossRef]
- Miranda, J.H.; Duarte, S.N.; Folegatti, M.V. Modelo para simulação da dinâmica da água em sistemas de drenagem subterrânea. Rev. Eng. Rural Piracicaba 1998, 9, 1–19. [Google Scholar]
- Mingoti, R.; Flecha, P.A.N.; Duarte, S.N.; Cruciani, D.E. Efeito de velocidades de rebaixamento do nível freático em diferentes períodos de desenvolvimento da cultura da alface. Rev. Bras. Eng. Agric. Ambient. 2006, 10, 10–16. [Google Scholar] [CrossRef][Green Version]
- Miranda, J.H.; Cooke, R.A.C.; Duarte, S.N. Simulations of subsurface drainage systems with the SISDRENA model. In Proceedings of the ASABE Annual International Meeting, Louisville, KY, USA, 7–10 August 2011; pp. 1–15. [Google Scholar]
- Bajocco, S.; Dragoz, E.; Gitas, I.; Smiraglia, D.; Salvati, L.; Ricotta, C. Mapping forest fuels through vegetation phenology: The role of coarse-resolution satellite time-series. PLoS ONE 2015, 10, e0119811. [Google Scholar] [CrossRef] [PubMed]
- Resende, N.C.; Miranda, J.H.; Chou, S.C.; Cooke, R.A. Regional climate change and drainage systems: Effects on corn productivity and profitability in Campinas, Brazil. Trans. ASABE 2016, 59, 1783–1790. [Google Scholar] [CrossRef][Green Version]
- Sampaio, P.R.F.; Junior, E.D.F.; de Almeida Silva, J.L.; Miranda, J.H.; Duarte, S.N. Estimativa de fluxo de drenagem e altura de lençol freático em solos de texturas distintas. IRRIGA 2016, 1, 70–80. [Google Scholar] [CrossRef]
- Duarte, S.N.; Miranda, J.H.; Folegatti, M.V. Dimensionamento econômico de sistemas de drenagem para a produção de cana-de-açúcar usando o modelo SISDRENA. Rev. Bras. Eng. Agríc. Ambient 2002, 6, 1–6. [Google Scholar] [CrossRef][Green Version]
- Miranda, J.H.; Duarte, S.N.; Sabadin, J.F.G.; Ruiter, S. Análise de sensibilidade do modelo sisdrena na simulação da produtividade de cana-de-açúcar. Irrig. Tecnol. Mod. 2005, 67, 78–81. [Google Scholar]
- Mingoti, R.; Duarte, S.N.; Miranda, J.H.; Cruciani, D.E. Dimensionamento econômico de profundidades e espaçamentos de drenos para a produção de cana-de-açúcar. R. Bras. Eng. Agríc. Ambient 2006, 10, 535–540. [Google Scholar] [CrossRef]
- Silva, K.O.; Miranda, J.H.; Duarte, S.N.; Brunini, O.; Gonçalves, A.D.M. Otimização do espaçamento e da profundidade de drenos para a produção de cana-de-açúcar. Eng. Rural 2006, 17, 11–19. [Google Scholar]
- Tavares, A.C.S.; Duarte, S.N.; Miranda, J.H.; da Silva Dias, N.; de Souza, K.T.S.; Arraes, F.D.D. Velocidade de rebaixamento do nível freático na qualidade do caldo da cana-de-açúcar. IRRIGA 2015, 20, 458–472. [Google Scholar] [CrossRef]
- Ramírez, V.; Lozada, G.; Arellano, J.; Calderón, M.; Calderón, M. Un modelo de producción y consumo de azúcar en Venezuela. Cienc. Ing. 2011, 61–72. [Google Scholar]
- Rea, R.; Sousa-Vieira, D.; Ramón, M.; Alejos, G.; Díaz, A.; George, J.; Niño, M.; Briceño, R. Selección simultánea para rendimiento y estabilidad en genotipos de caña de azúcar en la región centro-occidental de Venezuela. Bioagro 2014, 26, 153–158. [Google Scholar]
- Pla-Sentís, I.; Campero, G. Algunas propiedades estructurales de suelos de los llanos altos occidentales de Venezuela y su relación con ciertas caracteristicas. Agron. Trop. 1971, 21, 432–447. [Google Scholar]
- Lobo, D.; Lozano, Z.; Pla, I. Limitaciones físicas para la penetración de raíces de maíz (Zea mays L.) y sorgo (Sorghum bicolor L.) en cuatro suelos de venezuela. Venesuelos 1996, 4, 19–24. [Google Scholar]
- Lozano, Z.; Lobo, D.; Pla, I. Diagnóstico de limitaciones físicas en Inceptisoles de los llanos occidentales venezolanos. Bioagro 2000, 12, 15–24. [Google Scholar]
- Pérez, M.Y.; Florentino, A. Intervalo de agua menos limitante en función de propiedades del suelo. Venesuelos 2013, 21, 43–60. [Google Scholar]
- Pickering, N.B.; Hansen, J.W.; Jones, J.W.; Wells, C.M.; Chan, V.K.; Godwin, D.C. WeatherMan: A utility for managing and generating daily weather data. Agron. J. 1994, 86, 332. [Google Scholar] [CrossRef]
- Soltani, A.; Hoogenboom, G. Minimum data requirements for parameter estimation of stochastic weather generators. Clim. Res. 2003, 25, 109–119. [Google Scholar] [CrossRef]
- Soltani, A.; Latifi, N.; Nasiri, M. Evaluation of WGEN for generating long term weather data for crop simulations. Agric. Meteorol. 2000, 102, 1–12. [Google Scholar] [CrossRef]
- Taulis, M.E.; Milke, M.W. Estimation of WGEN weather generation parameters in arid climates. Ecol. Model. 2005, 184, 177–191. [Google Scholar] [CrossRef]
- Soil Conservation Service (SCS). National engineering handbook, section 4. In National Engineering Handbook; Mockus, V., Ed.; U.S. Department of Agriculture: Washington, DC, USA, 1972; pp. 10.1–10.24. [Google Scholar]
- Van Genuchten, M.T. A Closed-form Equation for Predicting the Hydraulic Conductivity of Unsaturated Soils1. Soil Sci. Soc. Am. J. 1980, 44, 892. [Google Scholar] [CrossRef]
- De Zeeuw, J.W.; Hellinga, F. Neerslag en afvoer. Landbouwkd Tijdschr. 1958, 70, 405–422. [Google Scholar]
- Carter, C.E.; Irvine, J.E.; McDaniel, V.; Dunckelman, J. Yield response of sugarcane to stalk density and subsurface drainage treatments. Trans. ASAE 1985, 28, 0172–0178. [Google Scholar] [CrossRef]
- Gayle, G.A.; Skaggs, R.W.; Carter, C.E. Effects of excessive soil water conditions on sugarcane yields. Trans. ASAE 1987, 30, 993–997. [Google Scholar] [CrossRef]
- Scardua, R. O Clima e a Irrigação na Produção Agroindustrial da cana-de-Açúcar (Saccharum spp.). Ph.D. Thesis, Escola Superior de Agricultura “Luiz de Queiroz”, Universidade de São Paulo, Piracicaba, Brazil, 1985; 122p. [Google Scholar]
- Skaggs, R.W.; Hardjoamidjojo, S.; Wiser, E.H.; Hiler, E.A. Simulation of crop response to surface and subsurface drainage systems. Trans. ASAE 1982, 25, 1673–1678. [Google Scholar] [CrossRef]
- Ramos, M.C. Rainfall distribution patterns and their change over time in a Mediterranean area. Theor. Appl. Climatol. 2001, 69, 163–170. [Google Scholar] [CrossRef]
- Trezza, R. Estimacion de evapotranspiracion de referencia a nivel mensual en Venezuela. Cual metodo utilizar. Bioagro 2008, 20, 89–95. [Google Scholar]
- Liu, X.; Xu, C.; Zhong, X.; Li, Y.; Yuan, X.; Cao, J. Comparison of 16 models for reference crop evapotranspiration against weighing lysimeter measurement. Agric. Water Manag. 2017, 184, 145–155. [Google Scholar] [CrossRef]
- Allen, R.G. REF-ET Reference Evapotranspiration Software, Version 2.0. For FAO and ASCE Standardized Equations; University of Idaho: Kimberly, IH, USA, 2001. [Google Scholar]
Publisher’s Note: MDPI stays neutral with regard to jurisdictional claims in published maps and institutional affiliations. |
© 2022 by the authors. Licensee MDPI, Basel, Switzerland. This article is an open access article distributed under the terms and conditions of the Creative Commons Attribution (CC BY) license (https://creativecommons.org/licenses/by/4.0/).