
Exploring Adaptive UHI Mitigation Solutions by Spatial Heterogeneity of Land Surface Temperature and Its Relationship to Urban Morphology in Historical Downtown Blocks, Beijing


Abstract
:1. Introduction
1.1. Studies on the Impact of Urban Spatial Morphology on LST
1.2. Studies on the Impact of Green and Blue Infrastructure’s Spatial Pattern on LST
1.3. Planning Orientation of Urban Thermal Environment Improvement Studies
2. Materials and Methods
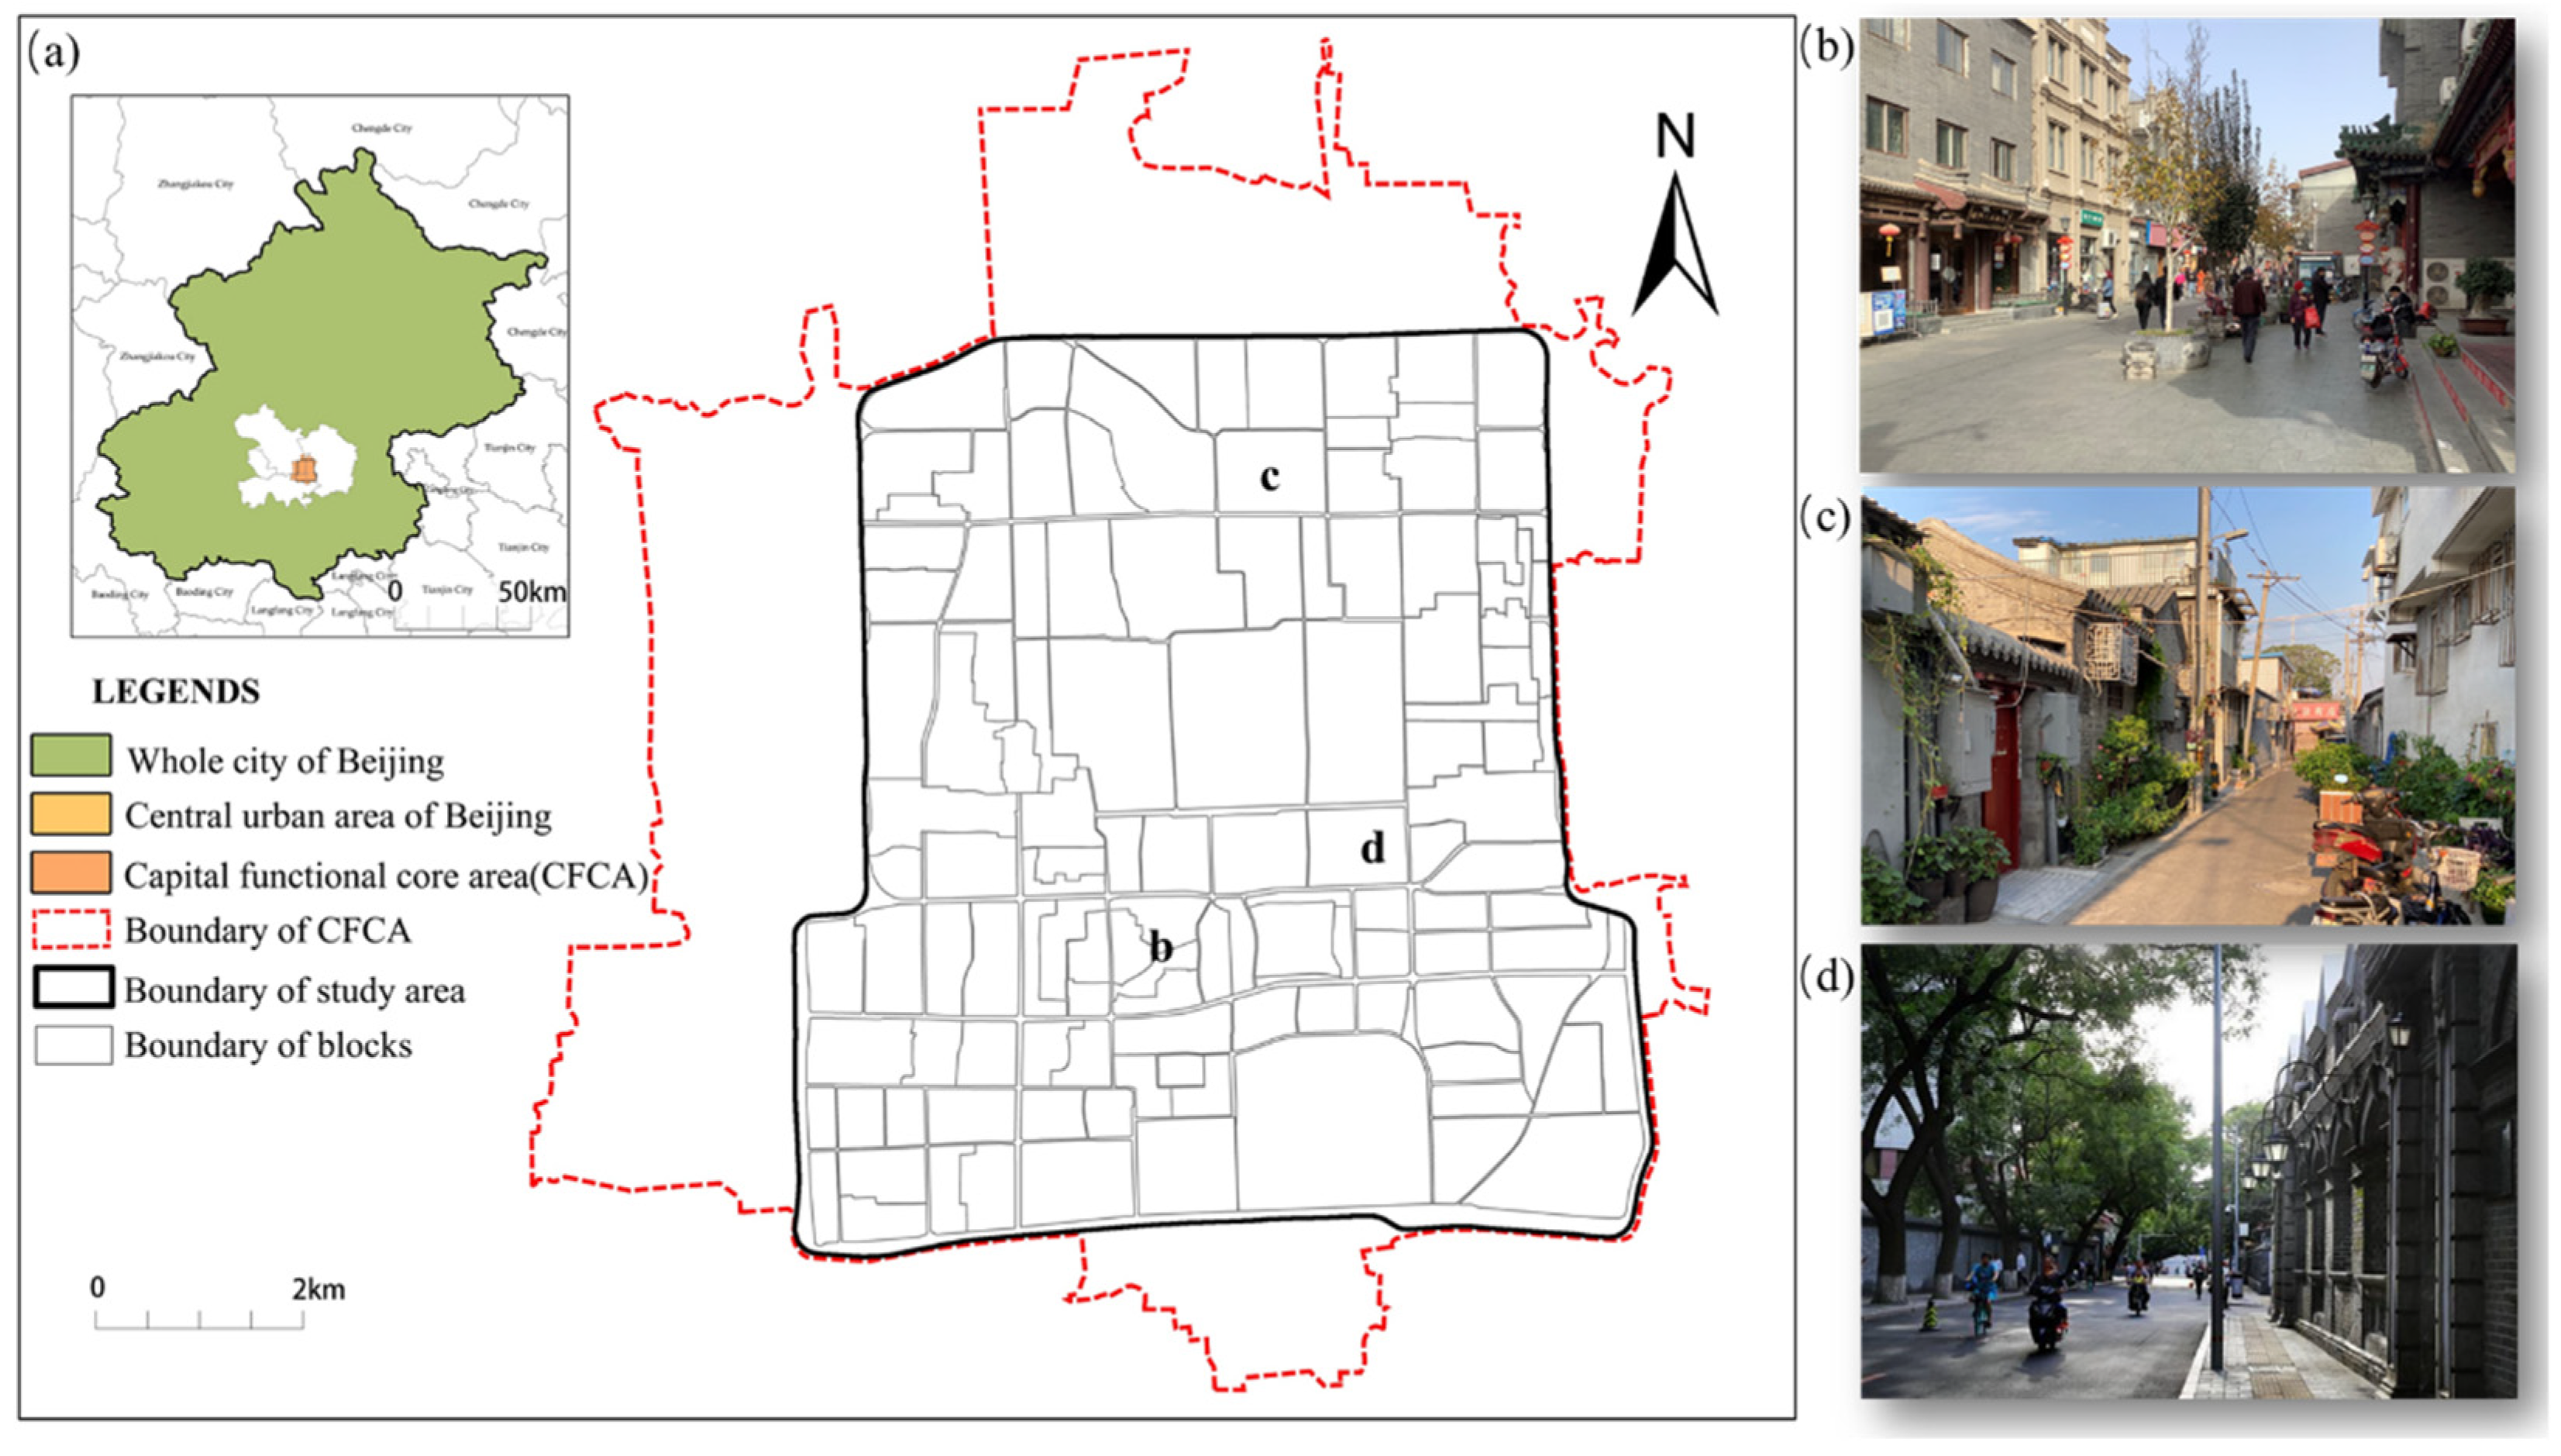
2.1. Study Area and Block Units
2.2. Data Source and Processing
2.3. Characteristic Indicators of UHI Based on LST
2.4. Spatial Morphological Indicators of Urban Blocks
2.5. Relationship Analysis Methods
3. Results
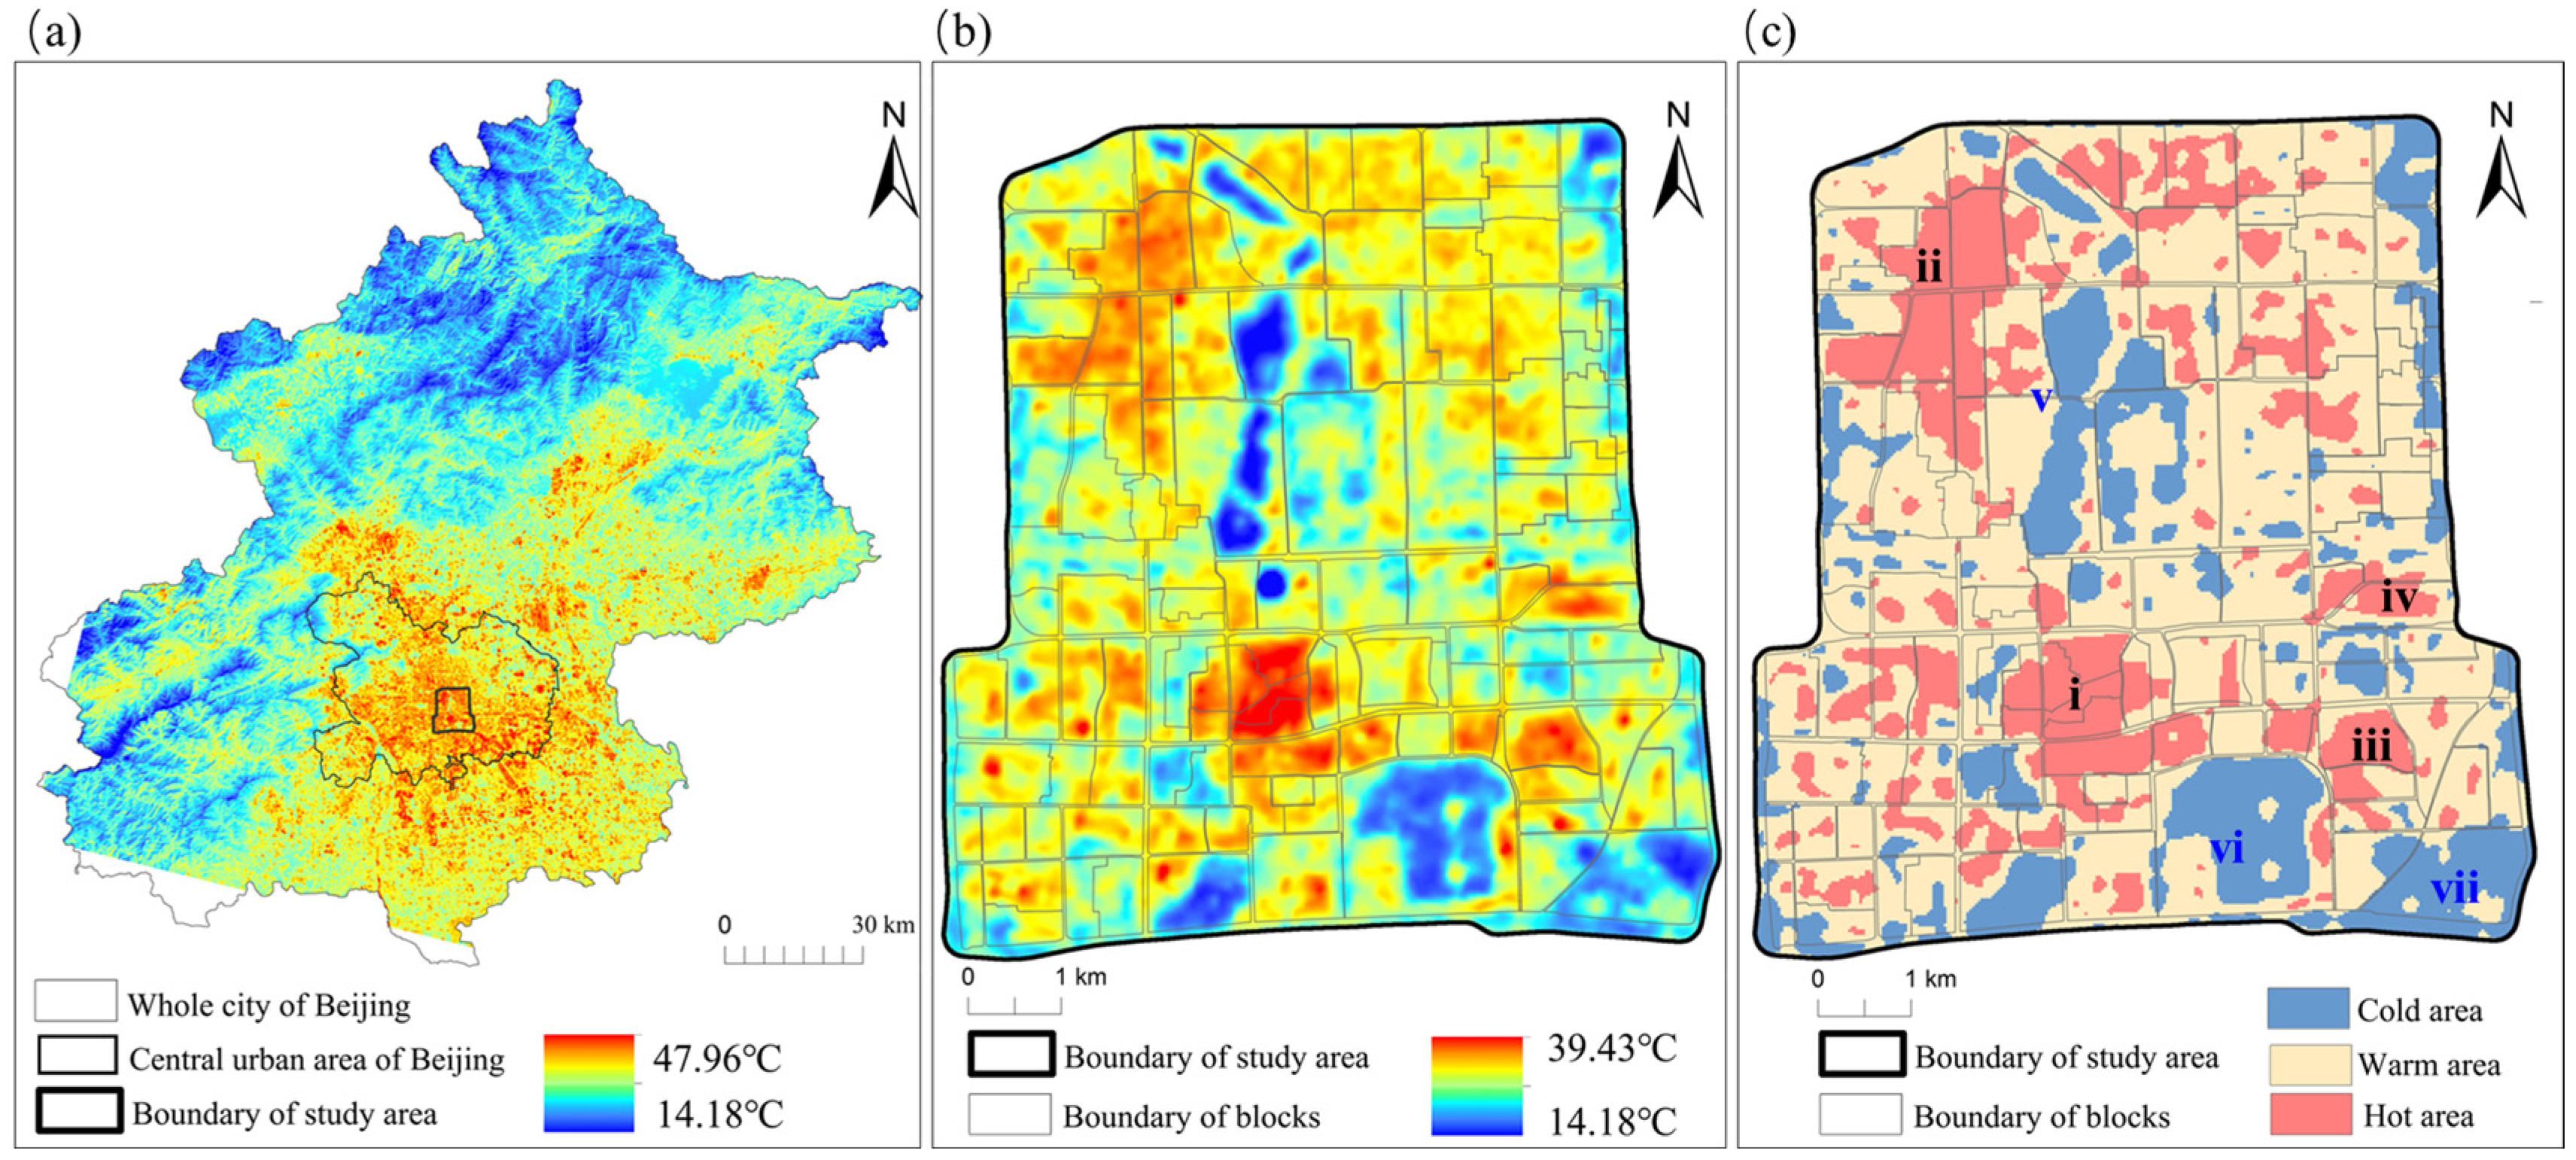
3.1. Spatial Heterogeneity of UHI in Historical Downtown Blocks
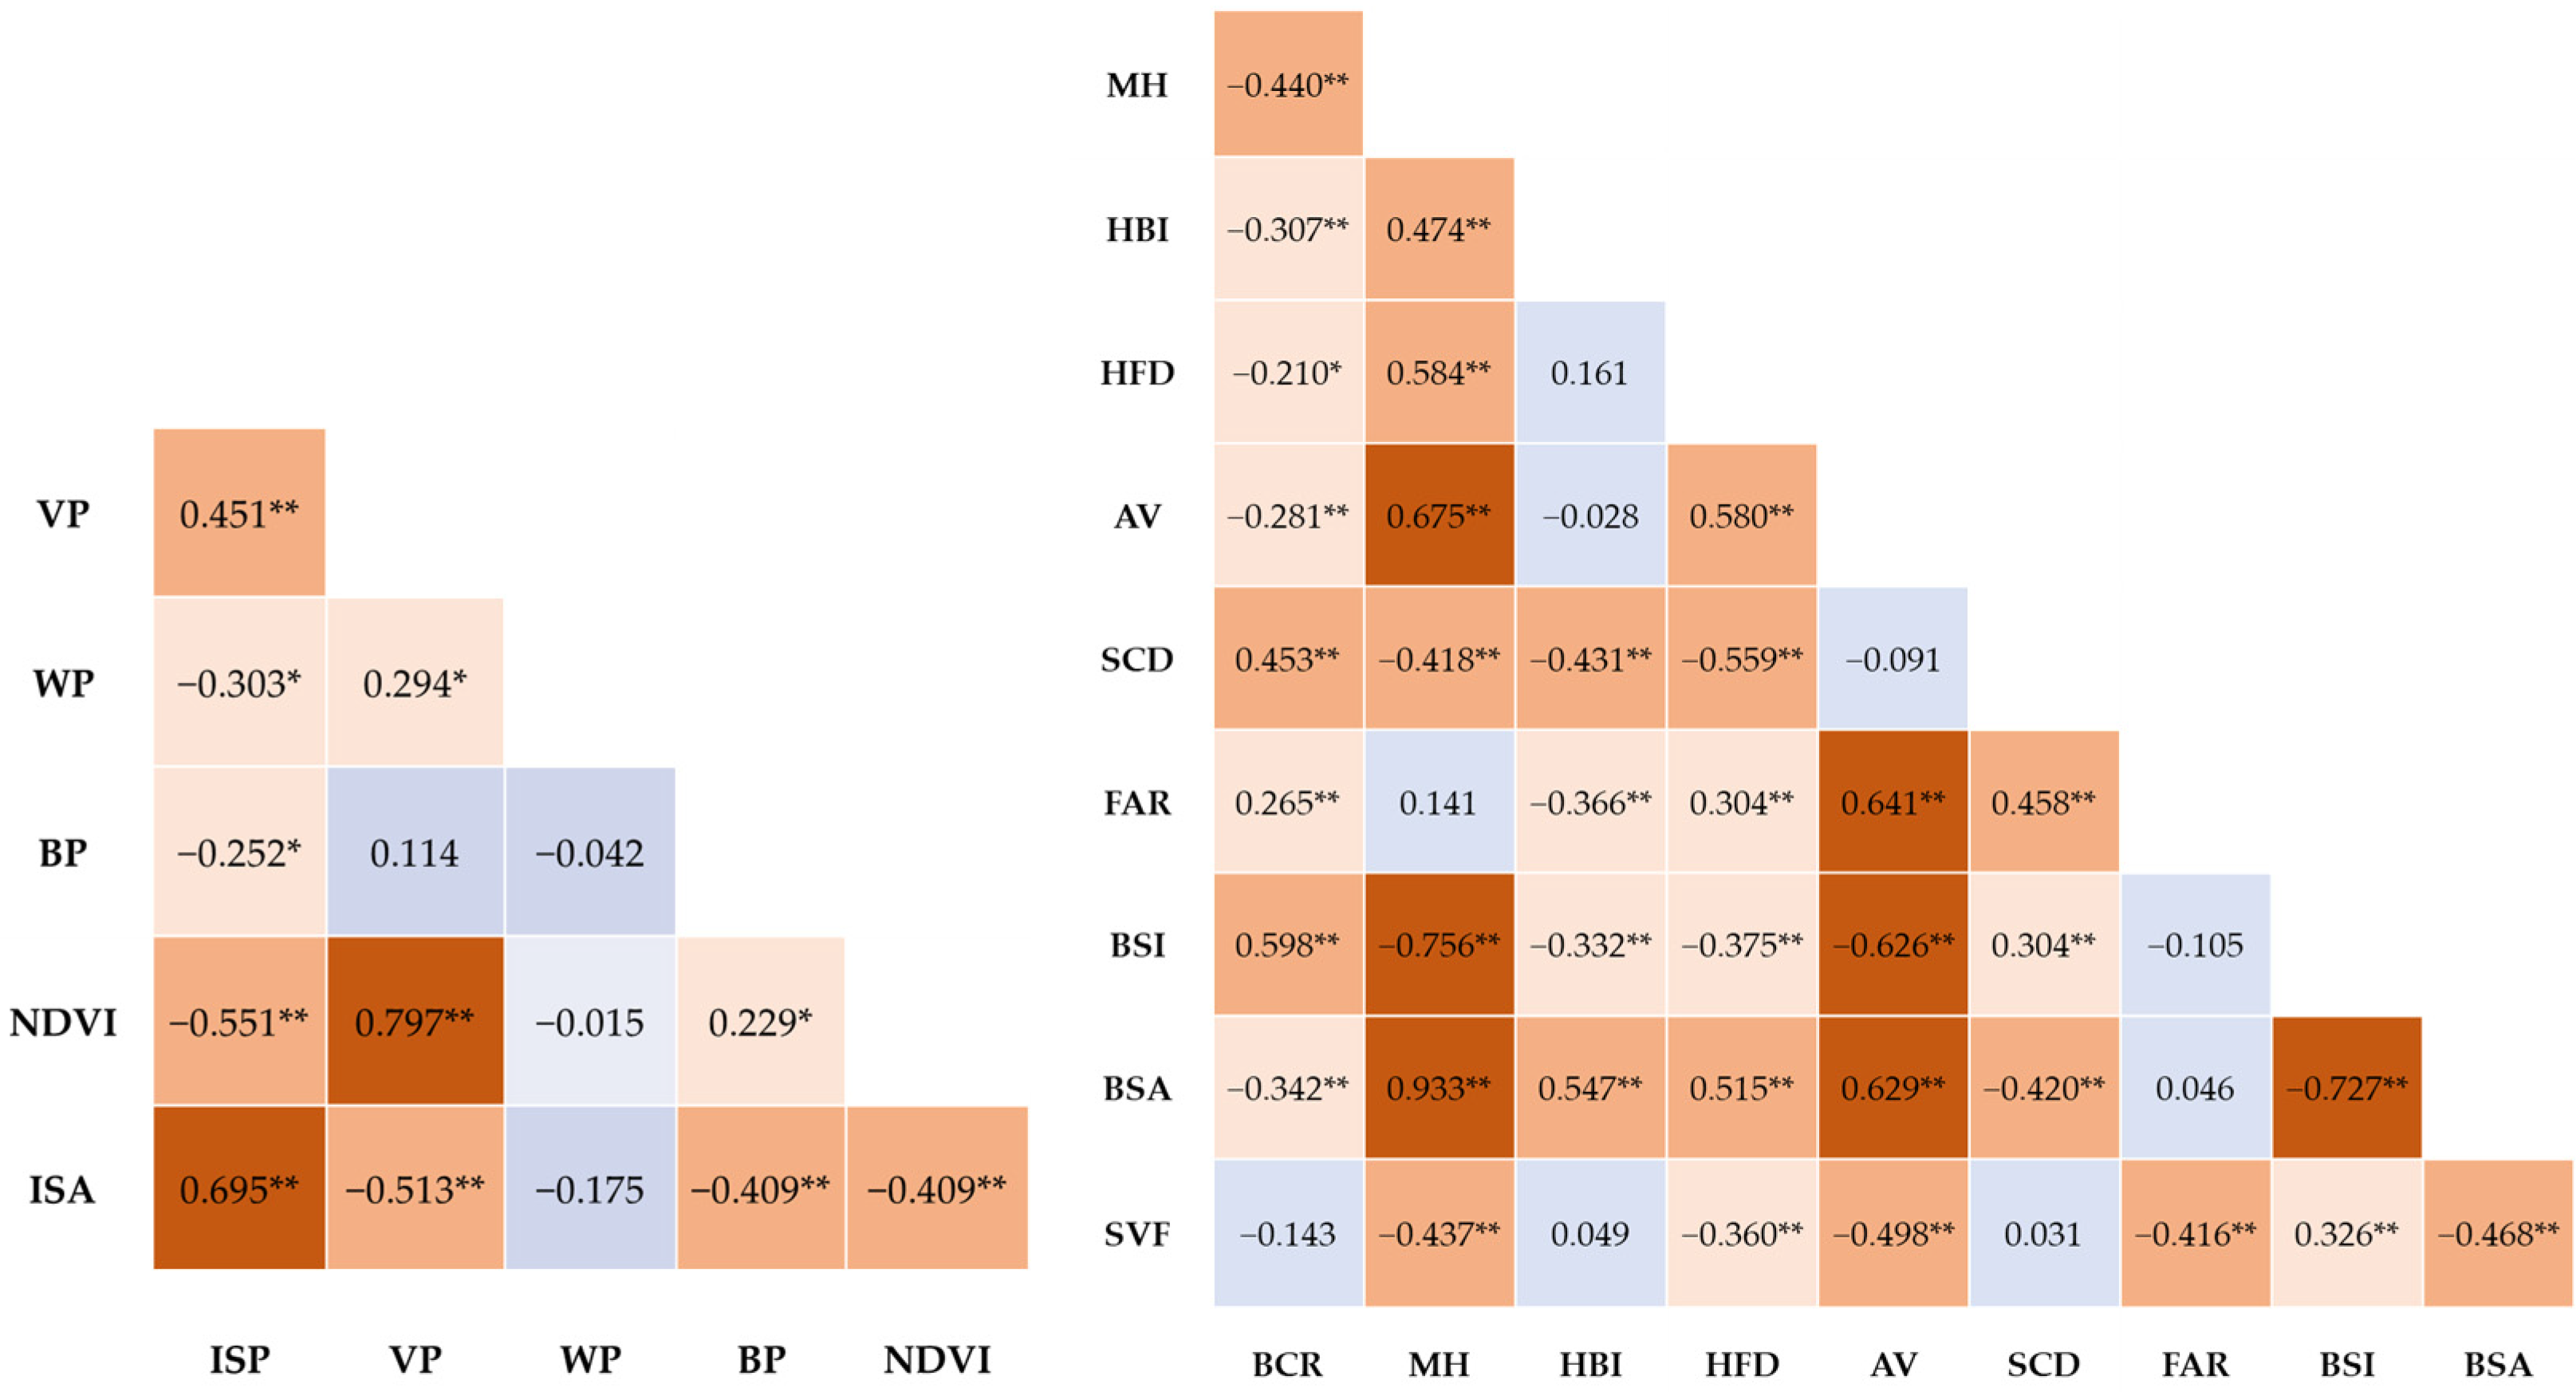
3.2. Relationship between UHI and Block Morphology
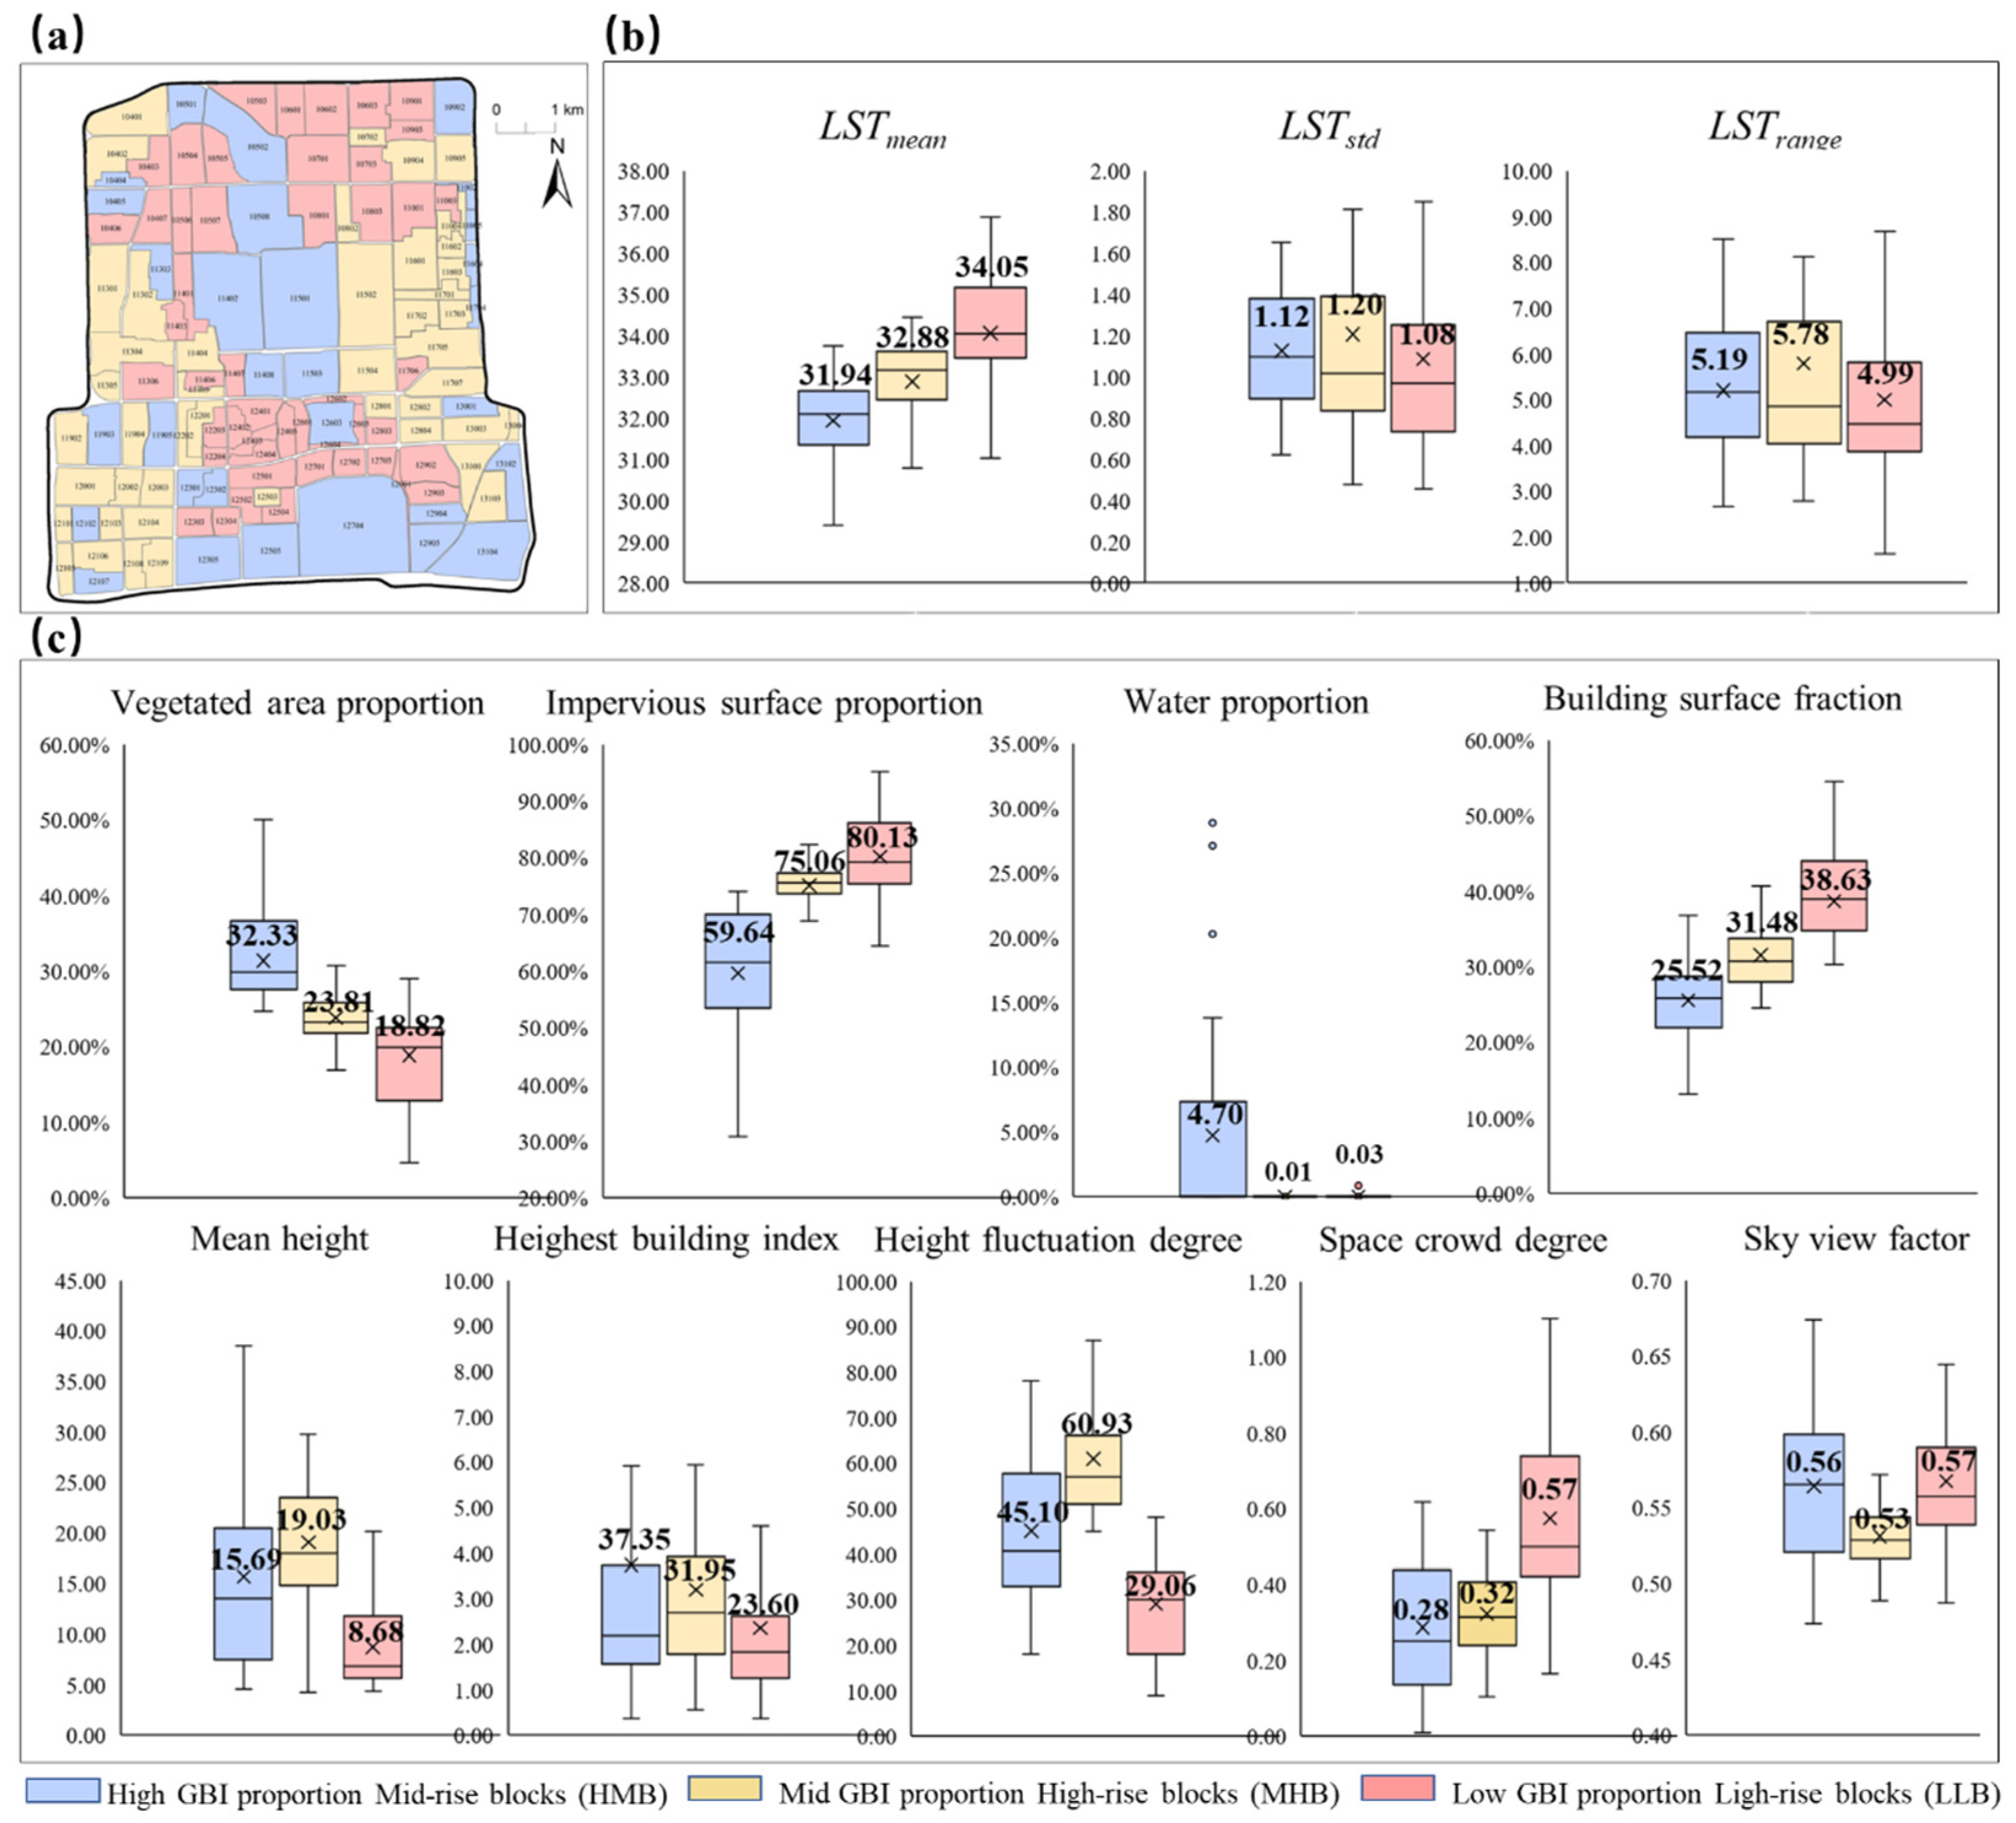
3.3. Relationships between UHI and GBI in Different Spatial Morphological Blocks
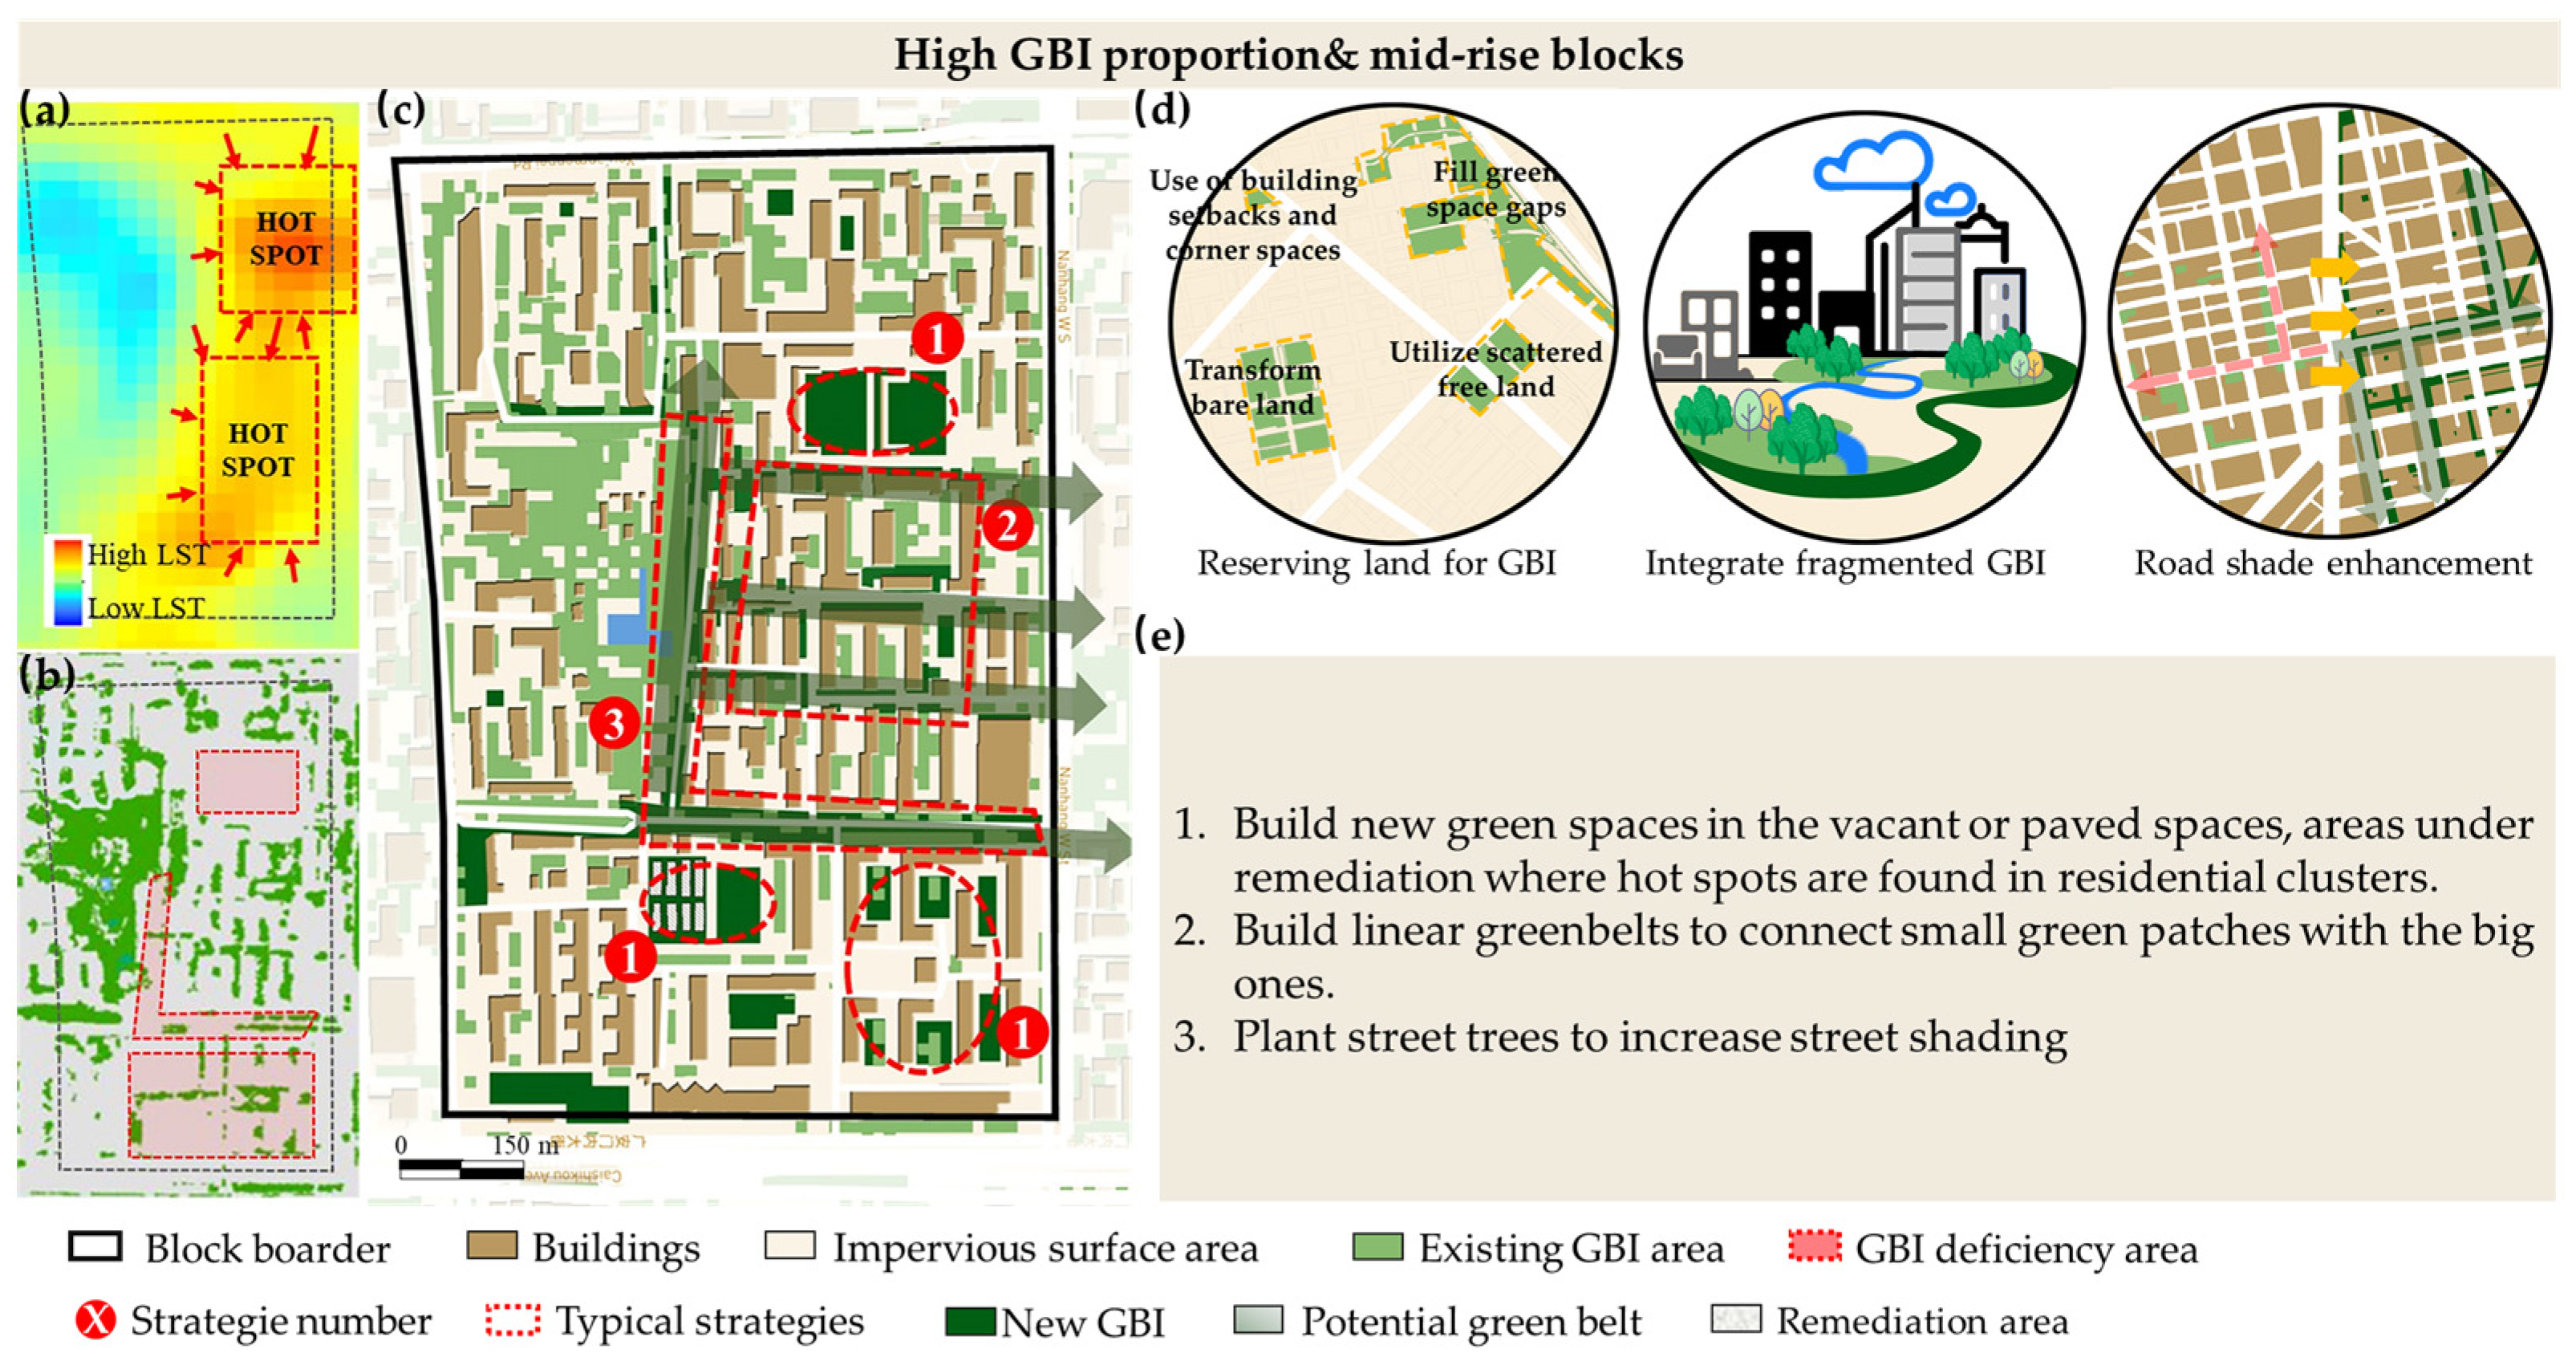
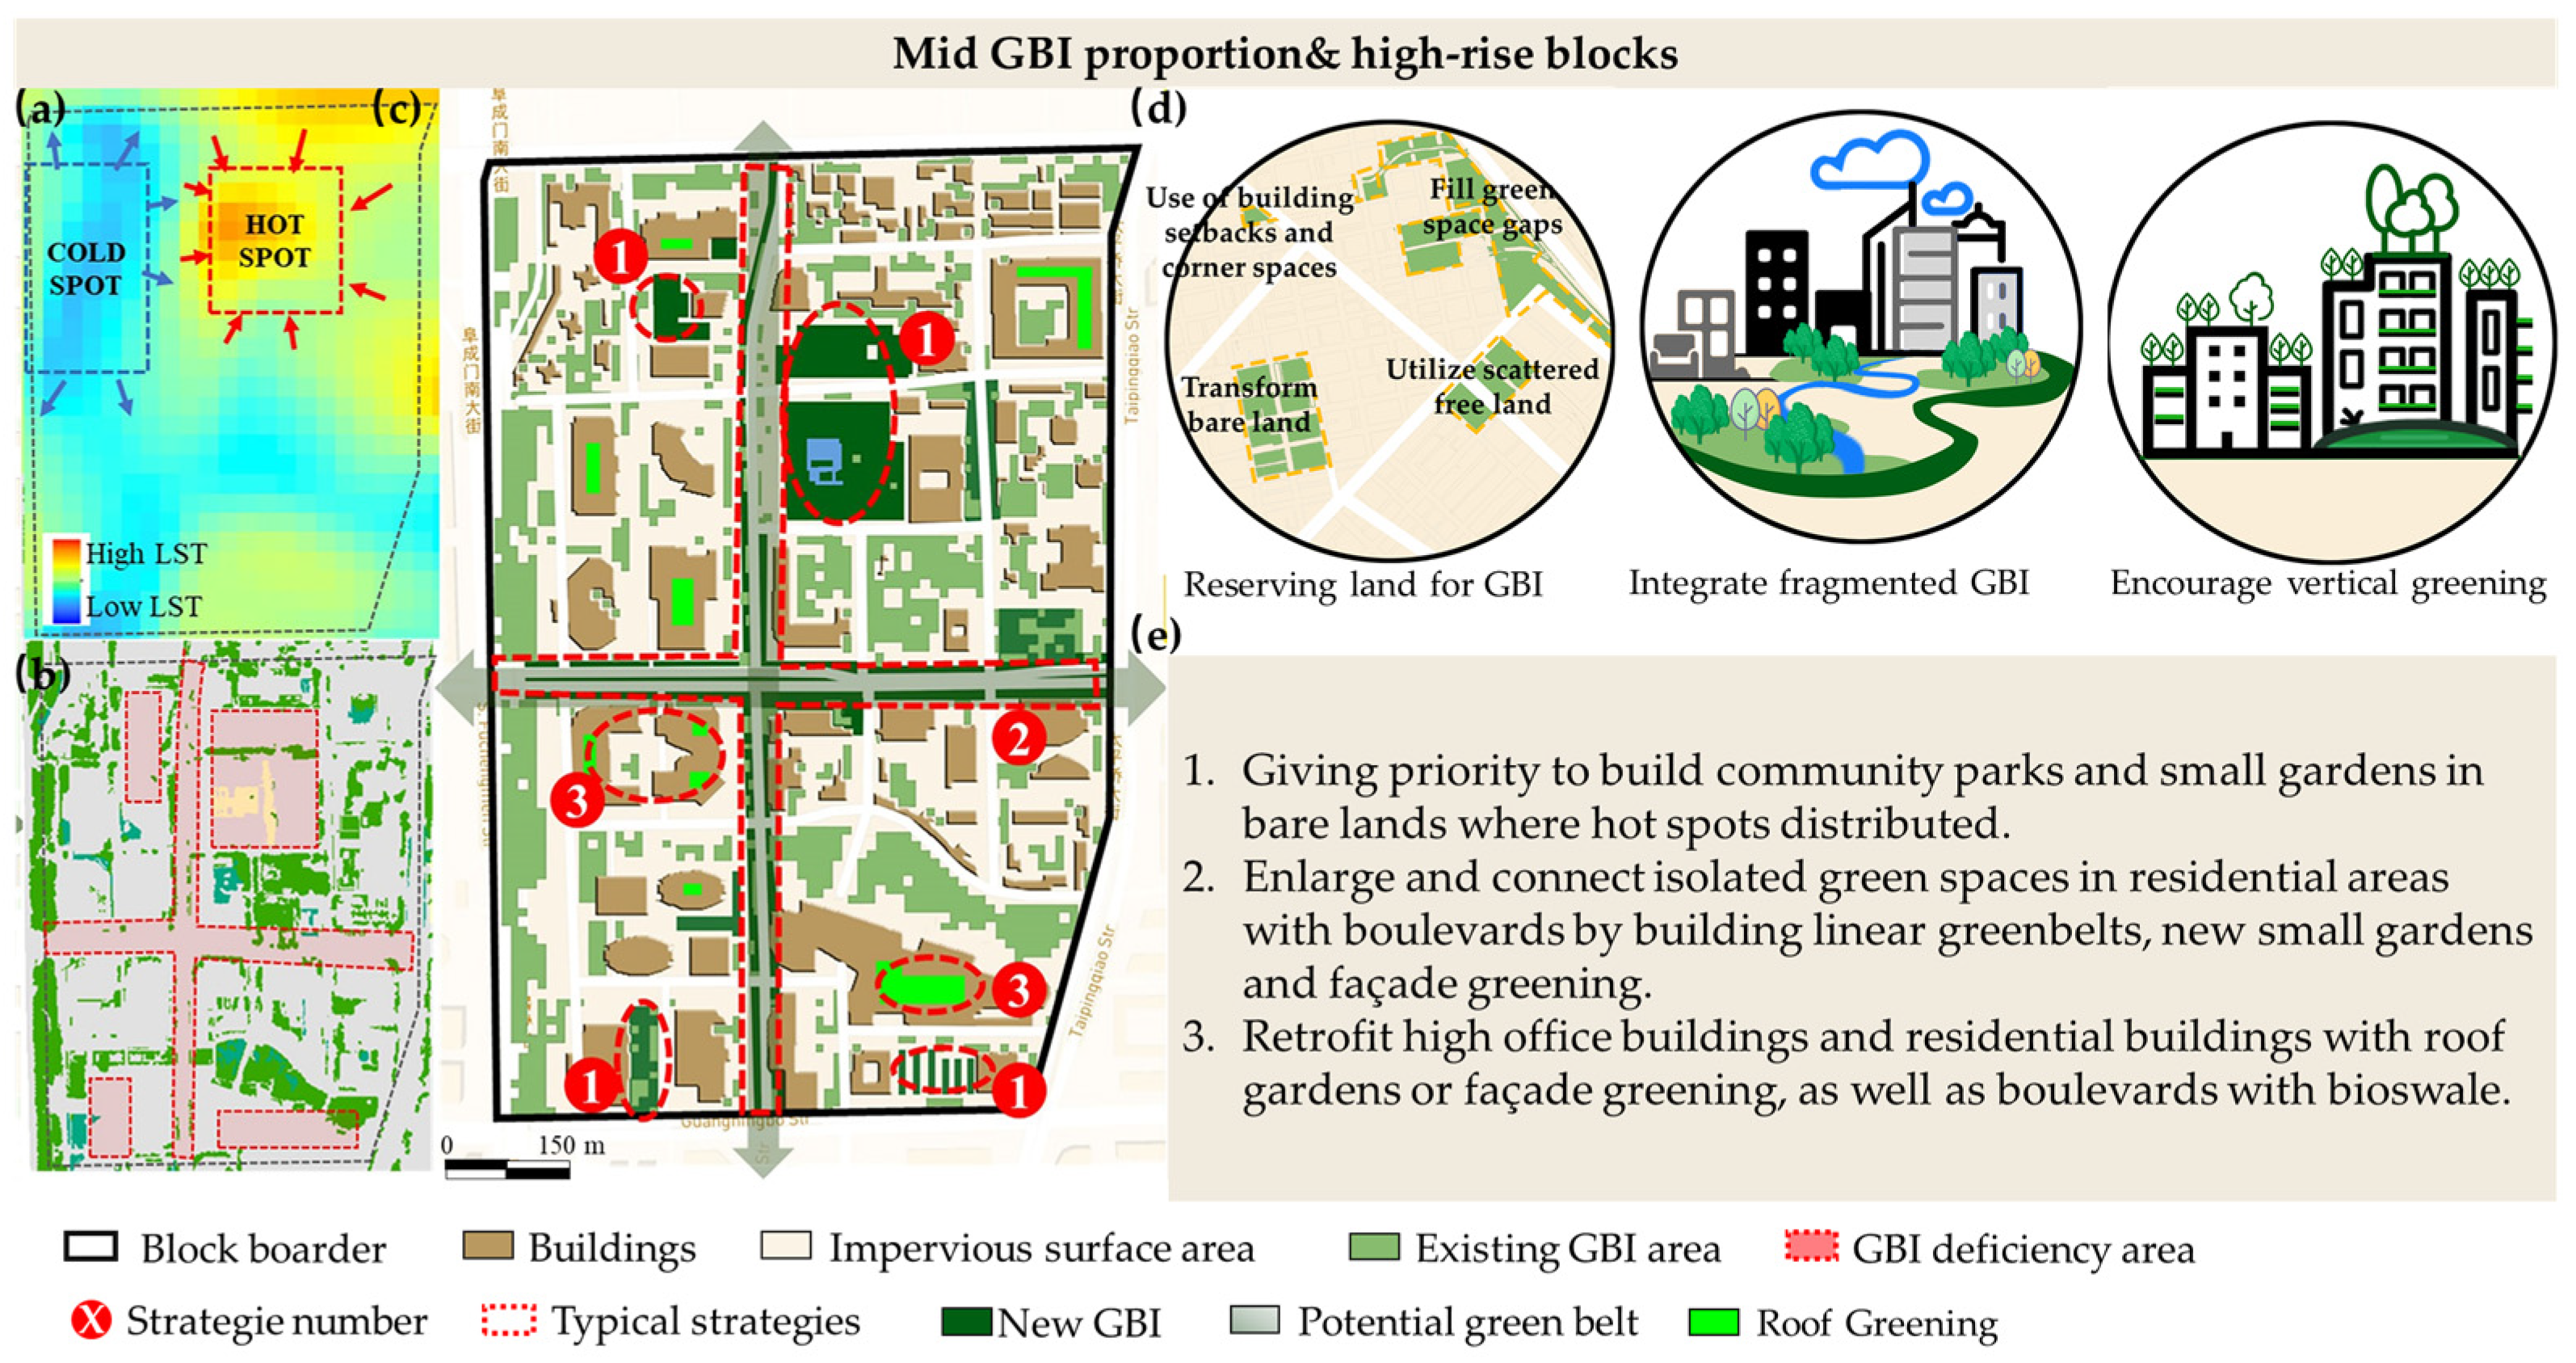
3.4. Potential Adaptive UHI Mitigation Solutions for Historical Downtown Blocks with Different Spatial Morphology
- High GBI proportion and mid-rise blocks (HMB)
- Mid GBI proportion and high-rise blocks (MHB)
- Low GBI proportion and low-rise blocks (LLB)
4. Discussion
5. Conclusions
Author Contributions
Funding
Institutional Review Board Statement
Informed Consent Statement
Data Availability Statement
Acknowledgments
Conflicts of Interest
Appendix A

| Category | Indicators | Formula | Note |
|---|---|---|---|
| Land cover characteristics | Impervious surface proportion (ISP) | % | , represents the area of impervious surface, vegetated area, water bodies, bare soil, respectively, A is block area. |
| Vegetated area proportion (VP) | % | ||
| Water proportion (WP) | % | ||
| Soil proportion (SP) | % | ||
| Normalized difference vegetation index (NDVI) | represents the reflection value in the NIR band, represents the reflection value in the red band [72]. | ||
| Impervious surface area (ISA) | In this paper, ISA of urban area was extracted by linear spectral hybrid image element decomposition model. It mainly includes the minimum noise separation, pure image element processing, end element collection, linear spectral separation, result checking and correction of the pre-processed images [73,74] | ||
| Urban spatial structure characteristics | Building coverage ratio (BCR) | % | refer to the height, volume, footprint and perimeter of the building No.i respectively, n is the number of buildings, A is the area of the block, C = 3.0 m is a constant, is the maximum height of the buildings in the block, is the minimum height of the buildings in the block [71]. |
| Mean height (MH) | |||
| Highest building index (HBI) | % | ||
| Height fluctuation degree (HFD) | |||
| Average Volume (AV) | |||
| Space crowd degree (SCD) | |||
| Floor area ratio (FAR) | |||
| Building structural index (BSI) | |||
| Building surface area (BSA) | |||
| Sky view factor (SVF) | is the sky view stereo angle, is the effect of terrain height angle on azimuth; n is the number of calculated azimuths (n = 36), and the spatial resolution is 5 m [75,76]. | ||
Appendix B
| Category | Indicators | Formula | Note |
|---|---|---|---|
| Patch Size | Mean patch size (AREA_MN) | is the number of GBI patches in a block. | |
| Largest patch index (LPI) | is block area. | ||
| Patch shape | Area-weighted fractal dimension index (FRAC_AM) | refers to the area of the GBI patch number i, n is the number of GBI patches in a block, is boundary length of GBI patch No.i. | |
| Landscape shape index (LSI) | is total length of the boundary of GBI patches in a block, is coverage area of GBI in a block | ||
| Fragmentation | Number of patches (NP) | is the number of GBI patches in a block. | |
| Area-weighted Euclidean nearest neighbor distance (ENN_AM) | is the nearest distance between GBI patch No.i and No.j, n is the number of GBI patches in a block. | ||
| Aggregation index (AI) | is the number of similar neighboring patches of GBI in a block. |
References
- Grimmond, S. Urbanization and global environmental change: Local effects of urban warming. Geogr. J. 2007, 173, 83–88. [Google Scholar] [CrossRef]
- Memon, R.A.; Leung, D.Y.; Chunho, L. A review on the generation, determination and mitigation of urban heat island. J. Environ. Sci. 2008, 20, 120–128. [Google Scholar] [CrossRef]
- Santamouris, M.; Cartalis, C.; Synnefa, A.; Kolokotsa, D. On the impact of urban heat island and global warming on the power demand and electricity consumption of buildings—A review. Energy Build. 2015, 98, 119–124. [Google Scholar] [CrossRef]
- Liding, C.; Ranhao, S.; Hailian, L. Progress in the study of ecological effects on the evolution of urban landscape patterns. J. Ecol. 2013, 33, 1042–1050. [Google Scholar] [CrossRef] [Green Version]
- Taha, H. Cool surfaces and shade trees to reduce energy use and improve air quality in urban areas. Sol. Energy 2001, 70, 295–310. [Google Scholar] [CrossRef]
- Chen, B.; Xie, M.M.; Feng, Q.Q.; Li, Z.Y.; Chu, L.X.; Liu, Q. Heat risk of residents in different types of communities from urban heat-exposed areas. Sci. Total Environ. 2021, 768, 145052. [Google Scholar] [CrossRef]
- Patz, J.A.; Campbell-Lendrum, D.; Holloway, T.; Foley, J.A. Impact of regional climate change on human health. Nature 2005, 438, 310–317. [Google Scholar] [CrossRef] [PubMed]
- Poumadère, M.; Mays, C.; Mer, S.L.; Blong, R. The 2003 heat wave in France: Dangerous climate change here and now. Risk Anal. Int. J. 2005, 25, 1483–1494. [Google Scholar] [CrossRef] [PubMed]
- Luber, G.; Mcgeehin, M. Climate change and extreme heat events. Am. J. Prev. Med. 2008, 35, 429–435. [Google Scholar] [CrossRef]
- Harlan, S.L.; Ruddell, D.M. Climate change and health in cities: Impacts of heat and air pollution and potential co-benefits from mitigation and adaptation. Curr. Opin. Environ. Sustain. 2011, 3, 126–134. [Google Scholar] [CrossRef]
- Kong, F.; Yin, H.; James, P.; Hutyra, L.R.; He, H.S. Effects of spatial pattern of greenspace on urban cooling in a large metropolitan area of eastern China. Landsc. Urban Plan. 2014, 128, 35–47. [Google Scholar] [CrossRef]
- Zhou, W.; Wang, J.; Cadenasso, M.L. Effects of the spatial configuration of trees on urban heat mitigation: A comparative study. Remote Sens. Environ. 2017, 195, 998. [Google Scholar] [CrossRef]
- Masoudi, M.; Tan, P.Y. Multi-year comparison of the effects of spatial pattern of urban green spaces on urban land surface temperature. Landsc. Urban Plan. 2019, 184, 44–58. [Google Scholar] [CrossRef]
- Hartigan, M.; Fitzsimons, J.; Grenfell, M.; Kent, T. Developing a Metropolitan-Wide Urban Forest Strategy for a Large, Expanding and Densifying Capital City: Lessons from Melbourne, Australia. Land 2021, 10, 809. [Google Scholar] [CrossRef]
- Li, X.; Zhou, W.; Ouyang, Z. Relationship between land surface temperature and spatial pattern of greenspace: What are the effects of spatial resolution? Landsc. Urban Plan. 2013, 114, 1–8. [Google Scholar] [CrossRef]
- Zhou, X.; Hong, C. Impact of urbanization-related land use land cover changes and urban morphology changes on the urban heat island phenomenon. Sci. Total Environ. 2018, 635, 1467–1476. [Google Scholar] [CrossRef] [PubMed]
- Steeneveld, G.J.; Koopmans, S.; Heusinkveld, B.G.; Van Hove, L.W.A.; Holtslag, A.A.M. Quantifying urban heat island effects and human comfort for cities of variable size and urban morphology in the Netherlands. J. Geophys. Res. 2011, 116, D20. [Google Scholar] [CrossRef]
- Zhi, C.; Yan, T.; Chang, L.; Demizel, M. The Evolution of Three-Dimensional Urban Spatial Morphology and its Planning Response to Surface Heat Island Effect: The Case of Beijing City. Int. Urban Plan. 2021, 36, 8. [Google Scholar] [CrossRef]
- Lai, D.; Liu, W.; Gan, T.; Liu, K.; Chen, Q. A review of mitigating strategies to improve the thermal environment and thermal comfort in urban outdoor spaces. Sci. Total Environ. 2019, 661, 337–353. [Google Scholar] [CrossRef]
- Zhao, Q.; Sailor, D.J.; Wentz, E.A. Impact of Tree Locations and Arrangements on Outdoor Microclimates and Human Thermal Comfort in an Urban Residential Environment. Urban For. Urban Green. 2018, 32, 91. [Google Scholar] [CrossRef] [Green Version]
- Gunawardena, K.R.; Wells, M.J.; Kershaw, T.J. Utilising green and bluespace to mitigate urban heat island intensity. Sci. Total Environ. 2017, 584, 1040–1055. [Google Scholar] [CrossRef] [PubMed]
- Gao, Y.; Zhao, J.; Han, L. Exploring the spatial heterogeneity of urban heat island effect and its relationship to block morphology with the geographically weighted regression model. Sustain. Cities Soc. 2022, 76, 103431. [Google Scholar] [CrossRef]
- Berger, C.; Rosentreter, J.; Voltersen, M.; Baumgart, C.; Schmullius, C.; Hese, S. Spatio-temporal analysis of the relationship between 2D/3D urban site characteristics and land surface temperature. Remote Sens. Environ. 2017, 193, 225–243. [Google Scholar] [CrossRef]
- Yin, C.; Man, Y.; Lu, Y.; Huang, Y.; Liu, Y. Effects of urban form on the urban heat island effect based on spatial regression model. Sci. Total Environ. 2018, 634, 696–704. [Google Scholar] [CrossRef] [PubMed]
- Zhang, M.; Zhang, C.; Kafy, A.; Tan, S. Simulating the Relationship between Land Use/Cover Change and Urban Thermal Environment Using Machine Learning Algorithms in Wuhan City, China. Land 2022, 11, 14. [Google Scholar] [CrossRef]
- Elena, M.; Ali, T.; Beatrice, C.; Federico, R.; Franco, C. The Impact of Albedo Increase to Mitigate the Urban Heat Island in Terni (Italy) Using the WRF Model. Sustainability 2016, 8, 999. [Google Scholar] [CrossRef] [Green Version]
- Imhoff, M.L.; Zhang, P.; Wolfe, R.E.; Bounoua, L. Remote sensing of the urban heat island effect across biomes in the continental USA—ScienceDirect. Remote Sens. Environ. 2010, 114, 504–513. [Google Scholar] [CrossRef] [Green Version]
- Zhou, W.; Tian, S. Research progress on the thermal environment effect of urban three-dimensional spatial morphology. J. Ecol. 2020, 40, 416–427. [Google Scholar] [CrossRef]
- Qunfang, H. Progress of research on the multi-scale influence of urban spatial morphology on urban heat island effect. Geosciences 2021, 41, 1832–1842. [Google Scholar] [CrossRef]
- Guo, G.; Zhou, X.; Wu, Z.; Xiao, R.; Chen, Y. Characterizing the impact of urban morphology heterogeneity on land surface temperature in Guangzhou, China. Environ. Model. Softw. 2016, 84, 427–439. [Google Scholar] [CrossRef]
- Duan, S.; Luo, Z.; Yang, X.; Li, Y. The impact of building operations on urban heat/cool islands under urban densification: A comparison between naturally-ventilated and air-conditioned buildings. Appl. Energy 2019, 235, 129–138. [Google Scholar] [CrossRef]
- Zhou, Y.; Zhuang, Z.; Yang, F.; Yu, Y.; Xie, X. Urban morphology on heat island and building energy consumption. In Proceedings of the 10th International Symposium on Heating, Ventilation and Air Conditioning, Jinan, China, 19–22 October 2017; ISHVAC2017. Cui, P., Liu, J., Zhang, W., Eds.; Elsevier Science Bvsara Burgerhartstraat: Amsterdam, The Netherlands, 2017; Volume 205, pp. 2401–2406. [Google Scholar] [CrossRef]
- Liu, Y.; Li, Q.; Yang, L.; Mu, K.; Zhang, M.; Liu, J. Urban heat island effects of various urban morphologies under regional climate conditions. Sci. Total Environ. 2020, 743, 140589. [Google Scholar] [CrossRef]
- Rafieian, M.; Rad, H.R.; Sharifi, A. IEEE The Necessity of using Sky View Factor in Urban Planning: A Case Study of Narmak Neighborhood, Tehran. In Proceedings of the 2014 International Conference & Utility Exhibition on Green Energy for Sustainable Development (ICUE), International Conference and Utility Exhibition on Green Energy for Sustainable Development (ICUE), Pattaya, Thailand, 19–21 March 2014. [Google Scholar]
- Cheung, H.; Coles, D.; Levermore, G.J. Urban heat island analysis of Greater Manchester, UK using sky view factor analysis. Build. Serv. Eng. 2015, 37, 5–17. [Google Scholar] [CrossRef]
- Stone, B.; Rodgers, M.O. Urban Form and Thermal Efficiency: How the Design of Cities Influences the Urban Heat Island Effect. J. Am. Plann. Assoc. 2001, 67, 186–198. [Google Scholar] [CrossRef]
- Li, J.; Song, C.; Cao, L.; Zhu, F.; Meng, X.; Wu, J. Impacts of landscape structure on surface urban heat islands: A case study of Shanghai, China. Remote Sens. Environ. 2011, 115, 3249–3263. [Google Scholar] [CrossRef]
- Chun, B.; Guldmann, J.M. Spatial statistical analysis and simulation of the urban heat island in high-density central cities. Landsc. Urban Plan. 2014, 125, 76–88. [Google Scholar] [CrossRef]
- Che, L.S.; Miaomiao, X.; Rongrong, W.; Yanan, W.; Xinyu, L. The influence of geographic unit division on the response pattern of urban thermal environment—A case study of Beijing. Adv. Geosci. 2021, 40, 1037–1047. [Google Scholar] [CrossRef]
- Du, S.; Xiong, Z.; Wang, Y.C.; Guo, L. Quantifying the multilevel effects of landscape composition and configuration on land surface temperature. Remote Sens. Environ. 2016, 178, 84–92. [Google Scholar] [CrossRef]
- Schwarz, N.; Schlink, U.; Franck, U. KatrinGroβmann Relationship of land surface and air temperatures and its implications for quantifying urban heat island indicators—An application for the city of Leipzig (Germany). Ecol. Indic. 2012, 18, 693–704. [Google Scholar] [CrossRef]
- Sadroddin, A.; Wegmann, M.; Qureshi, S.; Weng, Q.; Koellner, T. The Role of Vegetation in Mitigating Urban Land Surface Temperatures: A Case Study of Munich, Germany during the Warm Season. Sustainability 2015, 7, 4689–4706. [Google Scholar] [CrossRef] [Green Version]
- Wangxin, S.; Qing, C.; Shiao, L.; Kuan, Z.L. A review of research on the cooling effect of urban blue-green infrastructure. J. Ecol. 2021, 41, 16. [Google Scholar] [CrossRef]
- Feyisa, G.L.; Dons, K.; Meilby, H. Efficiency of parks in mitigating urban heat island effect: An example from Addis Ababa. Landsc. Urban Plan. 2014, 123, 87–95. [Google Scholar] [CrossRef]
- Du, H.; Cai, W.; Xu, Y.; Wang, Z.; Wang, Y.; Cai, Y. Quantifying the cool island effects of urban green spaces using remote sensing Data—ScienceDirect. Urban For. Urban Green. 2017, 27, 24–31. [Google Scholar] [CrossRef]
- Peng, J.; Xie, P.; Liu, Y.; Jing, M. Urban thermal environment dynamics and associated landscape pattern factors: A case study in the Beijing metropolitan region. Remote Sens. Environ. 2016, 173, 145–155. [Google Scholar] [CrossRef]
- Bao, T.; Li, X.; Zhang, J.; Zhang, Y.; Tian, S. Assessing the Distribution of Urban Green Spaces and its Anisotropic Cooling Distance on Urban Heat Island Pattern in Baotou, China. Int. J. Geo-Inf. 2016, 5, 12. [Google Scholar] [CrossRef]
- Maimaitiyiming, M.; Ghulam, A.; Tiyip, T.; Pla, F.; Latorre-Carmona, P.; Halik, Ü.; Sawut, M.; Caetano, M. Effects of green space spatial pattern on land surface temperature: Implications for sustainable urban planning and climate change adaptation. Isprs. J. Photogramm. 2014, 89, 59–66. [Google Scholar] [CrossRef] [Green Version]
- Asgarian, A.; Amiri, B.J.; Sakieh, Y. Assessing the effect of green cover spatial patterns on urban land surface temperature using landscape metrics approach. Urban Ecosyst. 2015, 18, 209–222. [Google Scholar] [CrossRef]
- Zhibin, R.; Haifeng, Z.; Xingyuan, H.; Dan, Z.; Xingyang, Y. Estimation of the Relationship Between Urban Vegetation Configuration and Land Surface Temperature with Remote Sensing. J. Indian Soc. Remote 2015, 43, 89–100. [Google Scholar] [CrossRef]
- Lobell, A.J.E.A. Quantifying Vegetation Change in Semiarid Environments: Precision and Accuracy of Spectral Mixture Analysis and the Normalized Difference Vegetation Index. Remote Sens. Environ. 2000, 73, 87–102. [Google Scholar] [CrossRef]
- Xie, M.; Wang, Y.; Chang, Q.; Fu, M.; Ye, M. Assessment of landscape patterns affecting land surface temperature in different biophysical gradients in Shenzhen, China. Urban Ecosyst. 2013, 16, 871–886. [Google Scholar] [CrossRef]
- Lou, X.; Hou, Q. China—The Research on Aggregate Analysis of the Regulatory Detailed Planning by considering the Traffic Capacity. Int. J. Cogn. Inform. Nat. Intell. 2015, 9, 15. [Google Scholar] [CrossRef]
- Wenze, Y.; Xue, L. Evaluation of heat island effect based on urban regulatory planning. J. Appl. Ecol. 2016, 27, 3631–3640. [Google Scholar] [CrossRef]
- Srivanit, M.; Kazunori, H. The Influence of Urban Morphology Indicators on Summer Diurnal Range of Urban Climate in Bangkok Metropolitan Area, Thailand. Int. J. Civ. Environ. Eng. 2011, 11, 34–46. [Google Scholar]
- Urban Master Plan of Beijing (2016–2035). Beijing Municipal Commission of Planning And Natural Resources. 2017. Available online: http://ghzrzyw.beijing.gov.cn/zhengwuxinxi/zxzt/bjcsztgh20162035/202001/t20200102_1554612.html (accessed on 10 March 2022).
- Yonghong, L.; Yongming, X.; Fangmin, Z.; Wenjun, S. Study on the influence of urban spatial form on heat island distribution in Beijing. J. Geogr. 2021, 76, 1662–1679. [Google Scholar] [CrossRef]
- Detail Regulatory Plan in the Functional Core Area of Beijing (Block Level). Beijing Municipal Commission of Planning and Natural Resources. 2020. Available online: http://www.beijing.gov.cn/zhengce/zhengcefagui/202008/t20200828_1992592.html (accessed on 10 March 2022).
- Huang, H.A.; Yang, H.A.; Deng, X.A.; Hao, C.B.; Liu, Z.C.; Liu, W.A.; Zeng, P.D. Analyzing the Influencing Factors of Urban Thermal Field Intensity Using Big-Data-Based GIS. Sustain. Cities Soc. 2020, 55, 102024. [Google Scholar] [CrossRef]
- Sobrino, J.A.; Jiménez-Muoz, J.C.; Paolini, L. Land surface temperature retrieval from LANDSAT TM 5. Remote Sens. Environ. 2004, 90, 434–440. [Google Scholar] [CrossRef]
- Lin, W. A Comparative Analysis of Retrieval Algorithms of Land Surface Temperature from Landsat-8 Data: A Case Study of Shanghai, China. Int. J. Environ. Res. Public Health 2021, 18, 5659. [Google Scholar] [CrossRef]
- Mumtaz, F.; Tao, Y.; Leeuw, G.D.; Zhao, L.; Wang, D. Modeling Spatio-Temporal Land Transformation and Its Associated Impacts on land Surface Temperature (LST). Remote Sens. 2020, 12, 2987. [Google Scholar] [CrossRef]
- Deilami, K.; Kamruzzaman, M. Modelling the urban heat island effect of smart growth policy scenarios in Brisbane. Land Use Policy 2017, 64, 38–55. [Google Scholar] [CrossRef]
- Wangxin, S.; Liukuan, Z.; Qing, C. Coupling analysis of urban thermal environment and landscape features based on optimal granularity. China Environ. Sci. 2022, 42, 954–961. [Google Scholar] [CrossRef]
- Mullerova, D.; Williams, M. Satellite Monitoring of Thermal Performance in Smart Urban Designs. Remote Sens. 2019, 11, 2244. [Google Scholar] [CrossRef] [Green Version]
- Carmona, P.L.; Tran, D.X.; Pla, F.; Myint, S.W.; Kieu, H.V. Characterizing the relationship between land use land cover change and land surface temperature. Isprs J. Photogramm. 2017, 124, 119–132. [Google Scholar] [CrossRef] [Green Version]
- McGarigal, K.; Marks, B.J. Spatial Pattern Analysis Program for Quantifying Landscape Structure. Gen. Tech. Rep. PNW-GTR-351. Portland. 1995. Available online: http://www.umass.edu/landeco/pubs/mcgarigal.marks.1995.pdf (accessed on 20 February 2022).
- Xiaoying, D. Application of eCognition in land use projects. Mapp. Spat. Geogr. Inf. 2005, 28, 3. [Google Scholar] [CrossRef]
- Zhi, P.; Liu, P.; Liao, Y.; Tingjin, G. Application of object-oriented technology in urban green space information extraction. Fujian For. Sci. Technol. 2006, 33, 5. [Google Scholar] [CrossRef]
- Wangxin, S.; Liukuan, Z.; Qing, C. MSPA-based blue-green infrastructure patterns and their thermal mitigation characteristics in urban blocks. J. Ecol. 2022, 1–10. [Google Scholar] [CrossRef]
- Peifeng, Z.; Yuanman, H. Changes of three-dimensional architectural morphology at different spatial scales. J. Ecol 2013, 32, 1319–1325. [Google Scholar]
- Peijun, D.U.; Xingli, L.I.; Wen, C.A.O.; Yan, L.U.O.; Zhang, H. Monitoring urban land cover and vegetation change by multi-temporal remote sensing information. Min. Sci. Technol. 2010, 20, 922–932. [Google Scholar] [CrossRef]
- Radziszewska-Zielina, E.; Kania, E.; Śladowski, G. Problems of the Selection of Construction Technology for Structures in the Centres of Urban Agglomerations. Arch. Civ. Eng. 2018, 64, 55–71. [Google Scholar] [CrossRef]
- El, B.R.; Grzegorz, L.; Ewelin, K. Structural analysis of conditions determining the selection of construction technology for structures in the centres of urban agglomerations. Open Eng. 2018, 8, 463–469. [Google Scholar] [CrossRef]
- Gal, T.; Lindberg, F.; Unger, J. Computing continuous sky view factors using 3D urban raster and vector databases: Comparison and application to urban climate. Theor. Appl. Climatol. 2009, 95, 111–123. [Google Scholar] [CrossRef]
- Kastendeuch, P.P. A method to estimate sky view factors from digital elevation models. Int. J. Climatol. 2013, 33, 1574–1578. [Google Scholar] [CrossRef]
- Wheeler, D.; Tiefelsdorf, M. Multicollinearity and correlation among local regression coefficients in geographically weighted regression. J. Geogr. Syst. 2005, 7, 161–187. [Google Scholar] [CrossRef]
- Deilami, K.; Kamruzzaman, M.; Liu, Y. Urban heat island effect: A systematic review of spatio-temporal factors, data, methods, and mitigation measures. Int. J. Appl. Earth Obs. 2018, 67, 30–42. [Google Scholar] [CrossRef]
- Litardo, J.; Palme, M.; Borbor-Cordova, M.; Caiza, R.; Macias, J.; Hidalgo-Leon, R.; Soriano, G. Urban Heat Island intensity and buildings’ energy needs in Duran, Ecuador: Simulation studies and proposal of mitigation strategies. Sustain. Cities Soc. 2020, 62, 102387. [Google Scholar] [CrossRef]
- Design Guidelines for the Protection and Renewal of Beijing’s Historical and Cultural Districts. Beijing Municipal Commission of Planning and Natural Resources. 2019. Available online: http://ghzrzyw.beijing.gov.cn/biaozhunguanli/bz/cxgh/202002/t20200220_1662949.html (accessed on 10 March 2022).
- Xu, Y.; Ren, C.; Ma, P.; Ho, J.; Wang, W.; Lau, K.K.; Lin, H.; Ng, E. Urban morphology detection and computation for urban climate research. Landsc. Urban Plan 2017, 167, 212–224. [Google Scholar] [CrossRef]
- Zhang, Y.; Murray, A.T.; Turner, B.L.I. Optimizing green space locations to reduce daytime and nighttime urban heat island effects in Phoenix, Arizona. Landsc. Urban Plan 2017, 165, 162–171. [Google Scholar] [CrossRef]
- Chen, W.; Zhang, Y.; Pengwang, C.; Gao, W. Evaluation of Urbanization Dynamics and its Impacts on Surface Heat Islands: A Case Study of Beijing, China. Remote Sens. 2017, 9, 453. [Google Scholar] [CrossRef] [Green Version]
- Allegrini, J.; Carmeliet, J. Coupled CFD and building energy simulations for studying the impacts of building height topology and buoyancy on local urban microclimates. Urban Clim. 2017, 21, 248–305. [Google Scholar] [CrossRef]
- Fe Ng, X.; Myint, S.W. Exploring the effect of neighboring land cover pattern on land surface temperature of central building objects. Build. Environ. 2016, 95, 346–354. [Google Scholar] [CrossRef]
- Wong, M.S.; Nichol, J.E. Spatial variability of frontal area index and its relationship with urban heat island intensity. Int. J. Remote Sens. 2013, 34, 885–896. [Google Scholar] [CrossRef]
- Ng, E. Towards planning and practical understanding of the need for meteorological and climatic information in the design of high-density cities: A case-based study of Hong Kong. Int. J. Climatol. 2011, 32, 582–598. [Google Scholar] [CrossRef]
- Buyantuyev, A.; Wu, J. Urban heat islands and landscape heterogeneity: Linking spatiotemporal variations in surface temperatures to land-cover and socioeconomic patterns. Landsc. Ecol. 2009, 25, 17–33. [Google Scholar] [CrossRef]
- Chao, R.; Chao, Y.; Zhengjun, H.; Enrong, W. Research on urban ventilation corridors and their planning applications. J. Urban Plan. 2014, 3, 52–60. [Google Scholar] [CrossRef]


| Category | Indicators | Definition | Unit |
|---|---|---|---|
| Land cover characteristics | Impervious land proportion (IP) | The ratio of impervious area to block area. | % |
| Vegetated land proportion (VP) | The ratio of vegetated area to block area. | % | |
| Water proportion (WP) | The ratio of water area to block area. | % | |
| Bare soil proportion (SP) | The ratio of bare soil area to block area. | % | |
| Normalized Difference Vegetation Index (NDVI) | The vegetation index calculated by the near-infrared band and red band value of Landsat-8 OLI. [72] | - | |
| Impervious Surface Area (ISA) | The impervious degree calculated by a linear spectral mixture decomposition model [73,74] | - | |
| Urban spatial structure characteristics | Building coverage ratio (BCR) | The ratio of building coverage to block area. | % |
| Mean height (MH) | The average height of buildings in the block. | m | |
| Highest building index (HBI) | The ratio of the tallest building’s height to the sum of all buildings’ heights in the block. [71] | - | |
| Height fluctuation degree (HFD) | The difference between the height of the tallest and shortest building in the block [71] | - | |
| Average Volume (AV) | The average volume of buildings in the block. | m3 | |
| Space crowd degree (SCD) | The ratio of the sum of all buildings’ volumes to the potential largest building volume in the block [71] | - | |
| Floor area ratio (FAR) | The ratio of total above-ground floor area to block area. | - | |
| Building structural index (BSI) | The average ratio of each building’s covered area to its height in the block [71] | - | |
| Building surface area (BSA) | The surface area of buildings in the block. | m2 | |
| Sky view factor (SVF) | The average sky openness among buildings in the block [75,76] | - |
| Category | Indicators | Definition | Unit | |
|---|---|---|---|---|
| Composition | Trees and shrubs proportion (TP) | The ratio of tree and shrub covered area to block area. | % | |
| Grass proportion (GP) | The ratio of grass covered area to block area. | % | ||
| Water proportion (WP) | The ratio of water area to block area. | % | ||
| Configuration | Patch Size | Mean patch size (AREA_MN) | Average area of all GBI patches within the block | Ha |
| Largest patch index (LPI) | Ratio of the area of the largest GBI patch to the total area of GBI within the block | % | ||
| Patch shape | Area-weighted fractal dimension index (FRAC_AM) | The fractal dimension weighted by its area of individual GBI patches in the block | - | |
| Landscape shape index (LSI) | Modified perimeter-area ratio of GBI patches in the block | - | ||
| Fragmentation Connectivity Aggregation | Number of patches (NP) | The number of GBI patches in the block | - | |
| Area-weighted Euclidean nearest neighbor distance (ENN_AM) | The ENN-MN weighted by the area of GBI patches in the block | % | ||
| Aggregation index (AI) | A measure of aggregation between GBI patches within blocks, obtained by dividing number of joins by the maximum possible umber of joins among GBI patches in the block | m | ||
| Region | The LST Indicator/°C | The Spatial Characteristic Indicator | |||||
|---|---|---|---|---|---|---|---|
| LSTmean | LSTstd | LSTrange | Area/km2 | Proportion/ % | Cohesion | Aggregation | |
| Whole City of Beijing | 27.09 | 3.22 | 32.07 | / | / | / | / |
| Central urban area of Beijing | 31.15 | 2.74 | 27.66 | / | / | / | / |
| Beijing Old Town (BOT) | 33.06 | 2.09 | 25.25 | 62.28 | 100 | / | / |
| Cold area | 29.92 | 1.37 | 17.47 | 12.42 | 19.95 | 82.27 | 88.56 |
| Warm area | 33.19 | 0.86 | 3.88 | 36.27 | 58.23 | 94.17 | 91.10 |
| Hot area | 35.61 | 0.86 | 4.95 | 13.59 | 21.82 | 82.80 | 89.57 |
| Indicators | Mean Value | LSTmean | LSTstd | LSTrange | |||
|---|---|---|---|---|---|---|---|
| C | S | C | S | C | S | ||
| Impervious surface proportion (ISP) | 67.86% | 0.717 ** | 0.000 | −0.529 ** | 0.000 | −0.446 ** | 0.000 |
| Vegetation proportion (VP) | 27.74% | −0.675 ** | 0.000 | 0.390 ** | 0.000 | 0.358 ** | 0.000 |
| Water proportion (WP) | 3.20% | −0.466 ** | 0.000 | 0.583 ** | 0.000 | 0.451 ** | 0.000 |
| Bare soil proportion (BP) | 1.19% | −0.114 | 0.208 | 0.026 | 0.778 | −0.001 | 0.993 |
| Indicators | LSTmean | LSTstd | LSTrange | |||
|---|---|---|---|---|---|---|
| C | S | C | S | C | S | |
| Building coverage ratio (BCR) | 0.543 ** | 0.000 | −0.203 * | 0.026 | −0.145 | 0.113 |
| Mean height (MH) | −0.785 ** | 0.000 | 0.100 | 0.280 | 0.042 | 0.653 |
| Highest building index (HBI) | −0.361 ** | 0.000 | −0.161 | 0.080 | −0.236 ** | 0.009 |
| Height fluctuation degree (HFD) | −0.411 ** | 0.000 | 0.144 | 0.117 | 0.139 | 0.129 |
| Space crowd degree (SCD) | 0.464 ** | 0.000 | −0.080 | 0.387 | −0.129 | 0.160 |
| Floor area ratio (FAR) | 0.020 | 0.829 | 0.078 | 0.396 | 0.023 | 0.800 |
| Sky view factor (SVF) | 0.237 ** | 0.009 | 0.033 | 0.721 | 0.028 | 0.764 |
| Category | Indicators | HMB | MHB | LLB | |||
|---|---|---|---|---|---|---|---|
| LSTmean | LSTstd | LSTmean | LSTstd | LSTmean | LSTstd | ||
| Composition | TP | −0.531 ** | 0.111 | −0.033 | −0.067 | −0.353 * | −0.109 |
| GP | −0.050 | 0.021 | −0.313 * | 0.234 | −0.274 | −0.032 | |
| WP | −0.520 ** | 0.565 ** | −0.314 * | 0.112 | −0.145 | −0.031 | |
| Patch Size | LPI | −0.702 ** | 0.403 * | −0.182 | 0.110 | −0.401 ** | −0.047 |
| AREA_MN | −0.729 ** | 0.303 | −0.323 * | 0.312 * | −0.600 ** | −0.117 | |
| Shape Complexity | LSI | 0.153 | 0.191 | 0.339 * | 0.060 | 0.060 | 0.037 |
| FRAC_AM | −0.693 ** | 0.219 | −0.168 | 0.046 | −0.616 ** | −0.077 | |
| Fragmentation Connectivity Aggregation | NP | −0.035 | 0.265 | 0.312 * | 0.061 | 0.131 | 0.047 |
| ENN_AM | 0.456 * | −0.295 | 0.011 | 0.285 | 0.483 ** | 0.082 | |
| AI | −0.764 ** | 0.480 ** | −0.267 | 0.442 ** | −0.570 ** | 0.028 | |
| Direction 1: Improvement for Construction of Urban Green and Blue Space System | ||
| Key Points | Requirements | Sources |
| Promoting street shading | Improve the construction of boulevard system, promote the transformation of street shading facilities. | Regulatory plan, 2020. |
| Optimize plant communities and improve the quality of street shade. | Regulatory plan, 2020. | |
| Increasing the area and accessibility of green space | Promote greening coverage, green space per capita, etc. | Regulatory plan, 2020. |
| Constructing both community parks and small pocket green spaces on marginal land, unused land and etc. | Regulatory plan, 2020; Design guideline, 2019. | |
| Enhancing the quality of green space | Improve the level of green vision ratio in various urban spaces. | Regulatory plan, 2020. |
| Improve the three-dimensional greening scenery by reasonably vertical and roof greening. | Regulatory plan, 2020; Design guideline, 2019. | |
| Improve greening construction mechanism | Promote public participation in greening construction and education. | Regulatory plan, 2020 |
| Carry out public participation in greening construction activities of hutongs and courtyard. | Regulatory plan, 2020; Design guideline, 2019. | |
| Optimize plant species selection | Select native plants such as acacia, mulberry, willow, pomegranate, begonia, etc. | Design guideline, 2019. |
| Direction 2: Preservation of urban spatial matrix and historical features | ||
| Key Points | Requirements | Sources |
| Promoting the tree protection | Integrate trees preservation with street greening or public space design programs, strictly implement the protection of famous trees, large trees, old and historic trees. | Regulatory plan, 2020; Design guideline, 2019. |
| Carry out the “one tree for one courtyard” replanting program. | Regulatory plan, 2020. | |
| Promoting shading transformation of checkerboard-shaped street network | Enhance the proportion of boulevards, improve greening rate of street network by increasing the green space on both sides of streets. | Regulatory plan, 2020. |
| Strengthening preservation and maintenance of traditional buildings and alleys | Strictly implement the requirements of historical buildings or buildings with traditional features can no longer be demolished. | Master plan, 2017; Regulatory plan, 2020. |
| Promote housing decrement renewal, carry out retreatment and renovation of illegal or makeshift buildings. | Regulatory plan, 2020 | |
| Regulating population density | Control resident density integrated with economic and social planning. | Regulatory plan, 2020. |
| Reinforce street characteristics and features | Select the materials (e.g., greenery, wall, and pavement and etc.) consistent with historical features in design and management works. | Regulatory plan, 2020; Design guideline, 2019. |
Publisher’s Note: MDPI stays neutral with regard to jurisdictional claims in published maps and institutional affiliations. |
© 2022 by the authors. Licensee MDPI, Basel, Switzerland. This article is an open access article distributed under the terms and conditions of the Creative Commons Attribution (CC BY) license (https://creativecommons.org/licenses/by/4.0/).
Share and Cite
Zhang, L.; Shi, X.; Chang, Q. Exploring Adaptive UHI Mitigation Solutions by Spatial Heterogeneity of Land Surface Temperature and Its Relationship to Urban Morphology in Historical Downtown Blocks, Beijing. Land 2022, 11, 544. https://doi.org/10.3390/land11040544
Zhang L, Shi X, Chang Q. Exploring Adaptive UHI Mitigation Solutions by Spatial Heterogeneity of Land Surface Temperature and Its Relationship to Urban Morphology in Historical Downtown Blocks, Beijing. Land. 2022; 11(4):544. https://doi.org/10.3390/land11040544
Chicago/Turabian StyleZhang, Liukuan, Xiaoxiao Shi, and Qing Chang. 2022. "Exploring Adaptive UHI Mitigation Solutions by Spatial Heterogeneity of Land Surface Temperature and Its Relationship to Urban Morphology in Historical Downtown Blocks, Beijing" Land 11, no. 4: 544. https://doi.org/10.3390/land11040544
APA StyleZhang, L., Shi, X., & Chang, Q. (2022). Exploring Adaptive UHI Mitigation Solutions by Spatial Heterogeneity of Land Surface Temperature and Its Relationship to Urban Morphology in Historical Downtown Blocks, Beijing. Land, 11(4), 544. https://doi.org/10.3390/land11040544