Article

Urban Land-Use Type Influences Summertime Water Quality in Small- and Medium-Sized Urban Rivers: A Case Study in Shanghai, China

1
Key Laboratory of National Forestry and Grassland Administration on Ecological Landscaping of Challenging Urban Sites, Shanghai Academy of Landscape Architecture Science and Planning, Shanghai 200232, China
2
Laboratory of Urban Design and Science, New York University Shanghai, Shanghai 200122, China
3
Harvard China Project, Harvard University, Cambridge, MA 02138, USA
4
Coastal Ecosystems Research Station of the Yangtze River Estuary, Ministry of Education, Key Laboratory for Biodiversity Science and Ecological Engineering, Institute of Biodiversity Science, School of Life Sciences, Fudan University, Shanghai 200438, China
*
Author to whom correspondence should be addressed.
These authors contributed equally to this work.
Land 2022, 11(4), 511; https://doi.org/10.3390/land11040511
Submission received: 24 February 2022 / Revised: 24 March 2022 / Accepted: 29 March 2022 / Published: 1 April 2022
(This article belongs to the Special Issue Dynamic of Natural Ecosystems under Anthropogenic Disturbances)

Abstract

:
(1) Background: Small- and medium-sized rivers in urban areas are unique environments that serve as blue-green corridors for urban residents. The relationship between land-use types and water quality in these rivers provides important information for effectively addressing urban river restoration and pollution management. However, not much attention has been paid on these small- and medium-sized rivers, especially in large urban agglomerations with dense river networks. (2) Methods: This study undertook a field investigation on 130 sampling small- and medium-sized rivers during the late summer and applied data-driven water quality index and landscape analysis techniques to evaluate the direct impacts of riparian land-use types on the summertime water quality in Shanghai’s small- and medium-sized rivers. Riparian land-use types were derived from OpenStreetMap (OSM) datasets, including industrial, commercial, residential, and green spaces. (3) Results: Residential and green space are located closer to these sampled rivers than industrial and commercial land types, suggesting a tentative link between anthropogenic activities and water quality. Further analysis concluded that urban resident settlements, characterized by specific land-use types, DMSP-OLS nighttime lights, OSM road density, and OSM river density, strongly affected the water quality at the sub-catchment scale. We further determined the critical radii for impacts of land use types on urban rivers. Industrial types may influence water quality within a maximum radius of 5 km, followed by green space (4 km), residential areas (3 km), and commercial developments (2 km). These mathematically and statistically computed radii provide updated visions for river health assessment. For a specific land-use type, the assessed water quality index will be biased by using an assessment area with a radius higher or lower than the above-estimated radii. The study also quantified the spatial extent and transmission efficiency of non-point source pollution in a super built-up area of central Shanghai. We observed that contaminants transported by river pathways can reach a larger area than those transported by roads. (4) Conclusions: The high-quality environments in small- and medium-sized rivers are tightly linked to riparian landscape patterns. It is therefore urgent to control domestic pollutions as part of the restoration of megacity’s urban rivers and grapple with the complex challenges of risks to water supply. This study elaborates the importance of integrating land-use planning and water-quality management to maintain the functions and services of small- and medium-sized urban rivers.

1. Introduction

Adequate amounts of suitable quality water resources are a precondition for ecological integrity as well as economic development. Numerous stresses influence water quality, such as natural processes (e.g., weathering, precipitation, and soil erosion), anthropogenic factors (agricultural, urban, and industrial activities), and the increased utilization of water resources [1]. Urban water quality is a fundamental variable for ecosystem services [2], while its quality is mainly controlled by anthropogenic factors [3]. The effects of human settlements on hydrochemistry can either be diffused (e.g., runoff from urban land surfaces) or directly discharged (e.g., direct industrial effluents).
Urban watershed characteristics, including land use, can strongly influence the surface water quality [4,5]. Many rivers in cities have been replaced by built-up areas through urban construction and other human activities. This reduces the water surface area and river density, resulting in degradation of the structure and storage capacity [6,7]. In recent years, there has been a rapid decline in the quality and quantity of fresh water due to unsustainable urban land use [8,9]. Some previous studies reported that continuous land use changes without proper development plans and law enforcement may critically threaten the sustainability of river networks [10,11,12].
In the highland of Malaysia, sensitive highlands areas are prone to landslides and soil erosion, which then contribute to the main water pollution issues in the network of river system, sedimentation, and siltation [10]. In the Songkhram River Basin of Thailand, the land use change plays a positive role in increasing the regional river streamflow, which may affect the strategy of river management [11]. In Brazil, water quality variables respond differently to land use changes at different spatial scales, and thus the spatial extent is an important aspect to be considered in studies and management [12]. These studies all focused on the impacts of land use change on river health in the larger catchment scales. Additional efforts are needed from urban perspectives since urban land use changes and landscape patterns are usually dramatic.
Hydro-morphologically, small- and medium-sized urban rivers are increasingly affected by urban river restoration to improve the blue-green elements in urbanized areas [13]. These minor streams are then unique environments that serve as ecological corridors for humans, birds, benthic invertebrates, etc. The riparian zones adjacent to these rivers serve as buffers for urban pollutants. However, among the current studies on urban water quality, little attention has been paid to the ecological and environmental functions of small- and medium-sized rivers [14], especially in large urban agglomerations with dense river networks [15,16].
Shanghai, which is one of the most developed cities in China, has received considerable attention due to its economic importance as well as its severely polluted conditions resulting from agricultural, urban, and industrial activities in this region [17]. Shanghai is confronted with water quality challenges. River networks in Shanghai are made up of two main stems (i.e., Huangpu River and Suzhou River), and tens of thousands of human-modified small- and medium-sized rivers [18].
The most fundamental characteristics of Shanghai’s urban river network are that the pollutants penetrate and diffuse into those micro-canals [15,16]. Thus, it is ineffective to improve the urban water quality by only managing the main river environments. However, Shanghai is not alone among other megacities in the developing world, which are also grappling with the complex challenge of balancing rapid urbanization with the preservation and maintenance of a high-quality water supply.
The industrial development of Shanghai has introduced heavy metals and chemicals into the urban environment. The residues of these chemicals flow into the river during rainfall events, causing eutrophication, among other impacts. The city’s low sewage treatment capacity has resulted in industrial and residential waste being discharged directly into the watershed. The pollution sources have gradually changed from point sources to non-point sources [19,20].
The sources of this non-point wastewater are mainly industrial and residential land use. In recent years, the Shanghai municipal government has highlighted the provision of clean water to both enhance the standard of living of its residents and to protect the natural environment. According to the Shanghai River & Lake Report (version 2019), 10% of the monitored urban rivers are at the lowest level [Grade V; Environmental Quality Standards for Surface Water (GB 3838-2002)], and nitrogen and phosphorus eutrophication is still a severe problem for Shanghai’s water environments.
With respect to the abovementioned challenges, some studies have examined the variation in water pollution across Shanghai over time, and how the urban to suburban gradient and land uses influence water quality in this city [3,5,6,7,15,16,17,18,21]. However, there are no studies exploring the influence of landscape patterns of different land-use types on the water quality of small- and medium-sized rivers in Shanghai [19], and no studies considering how these scientific findings would help stakeholders and decision-makers in improving urban river management.
To fill knowledge gaps in urban river restorations, the study aims at exploring the mechanism of how the water quality of small- and medium-sized rivers is linked to superimposed impacts from Shanghai’s human settlements and determining the underlying relationships between the summertime water quality of small- and medium-sized rivers and diverse landscape compositions (industrial, commercial, and residential, and green spaces) in Shanghai.

2. Materials and Methods
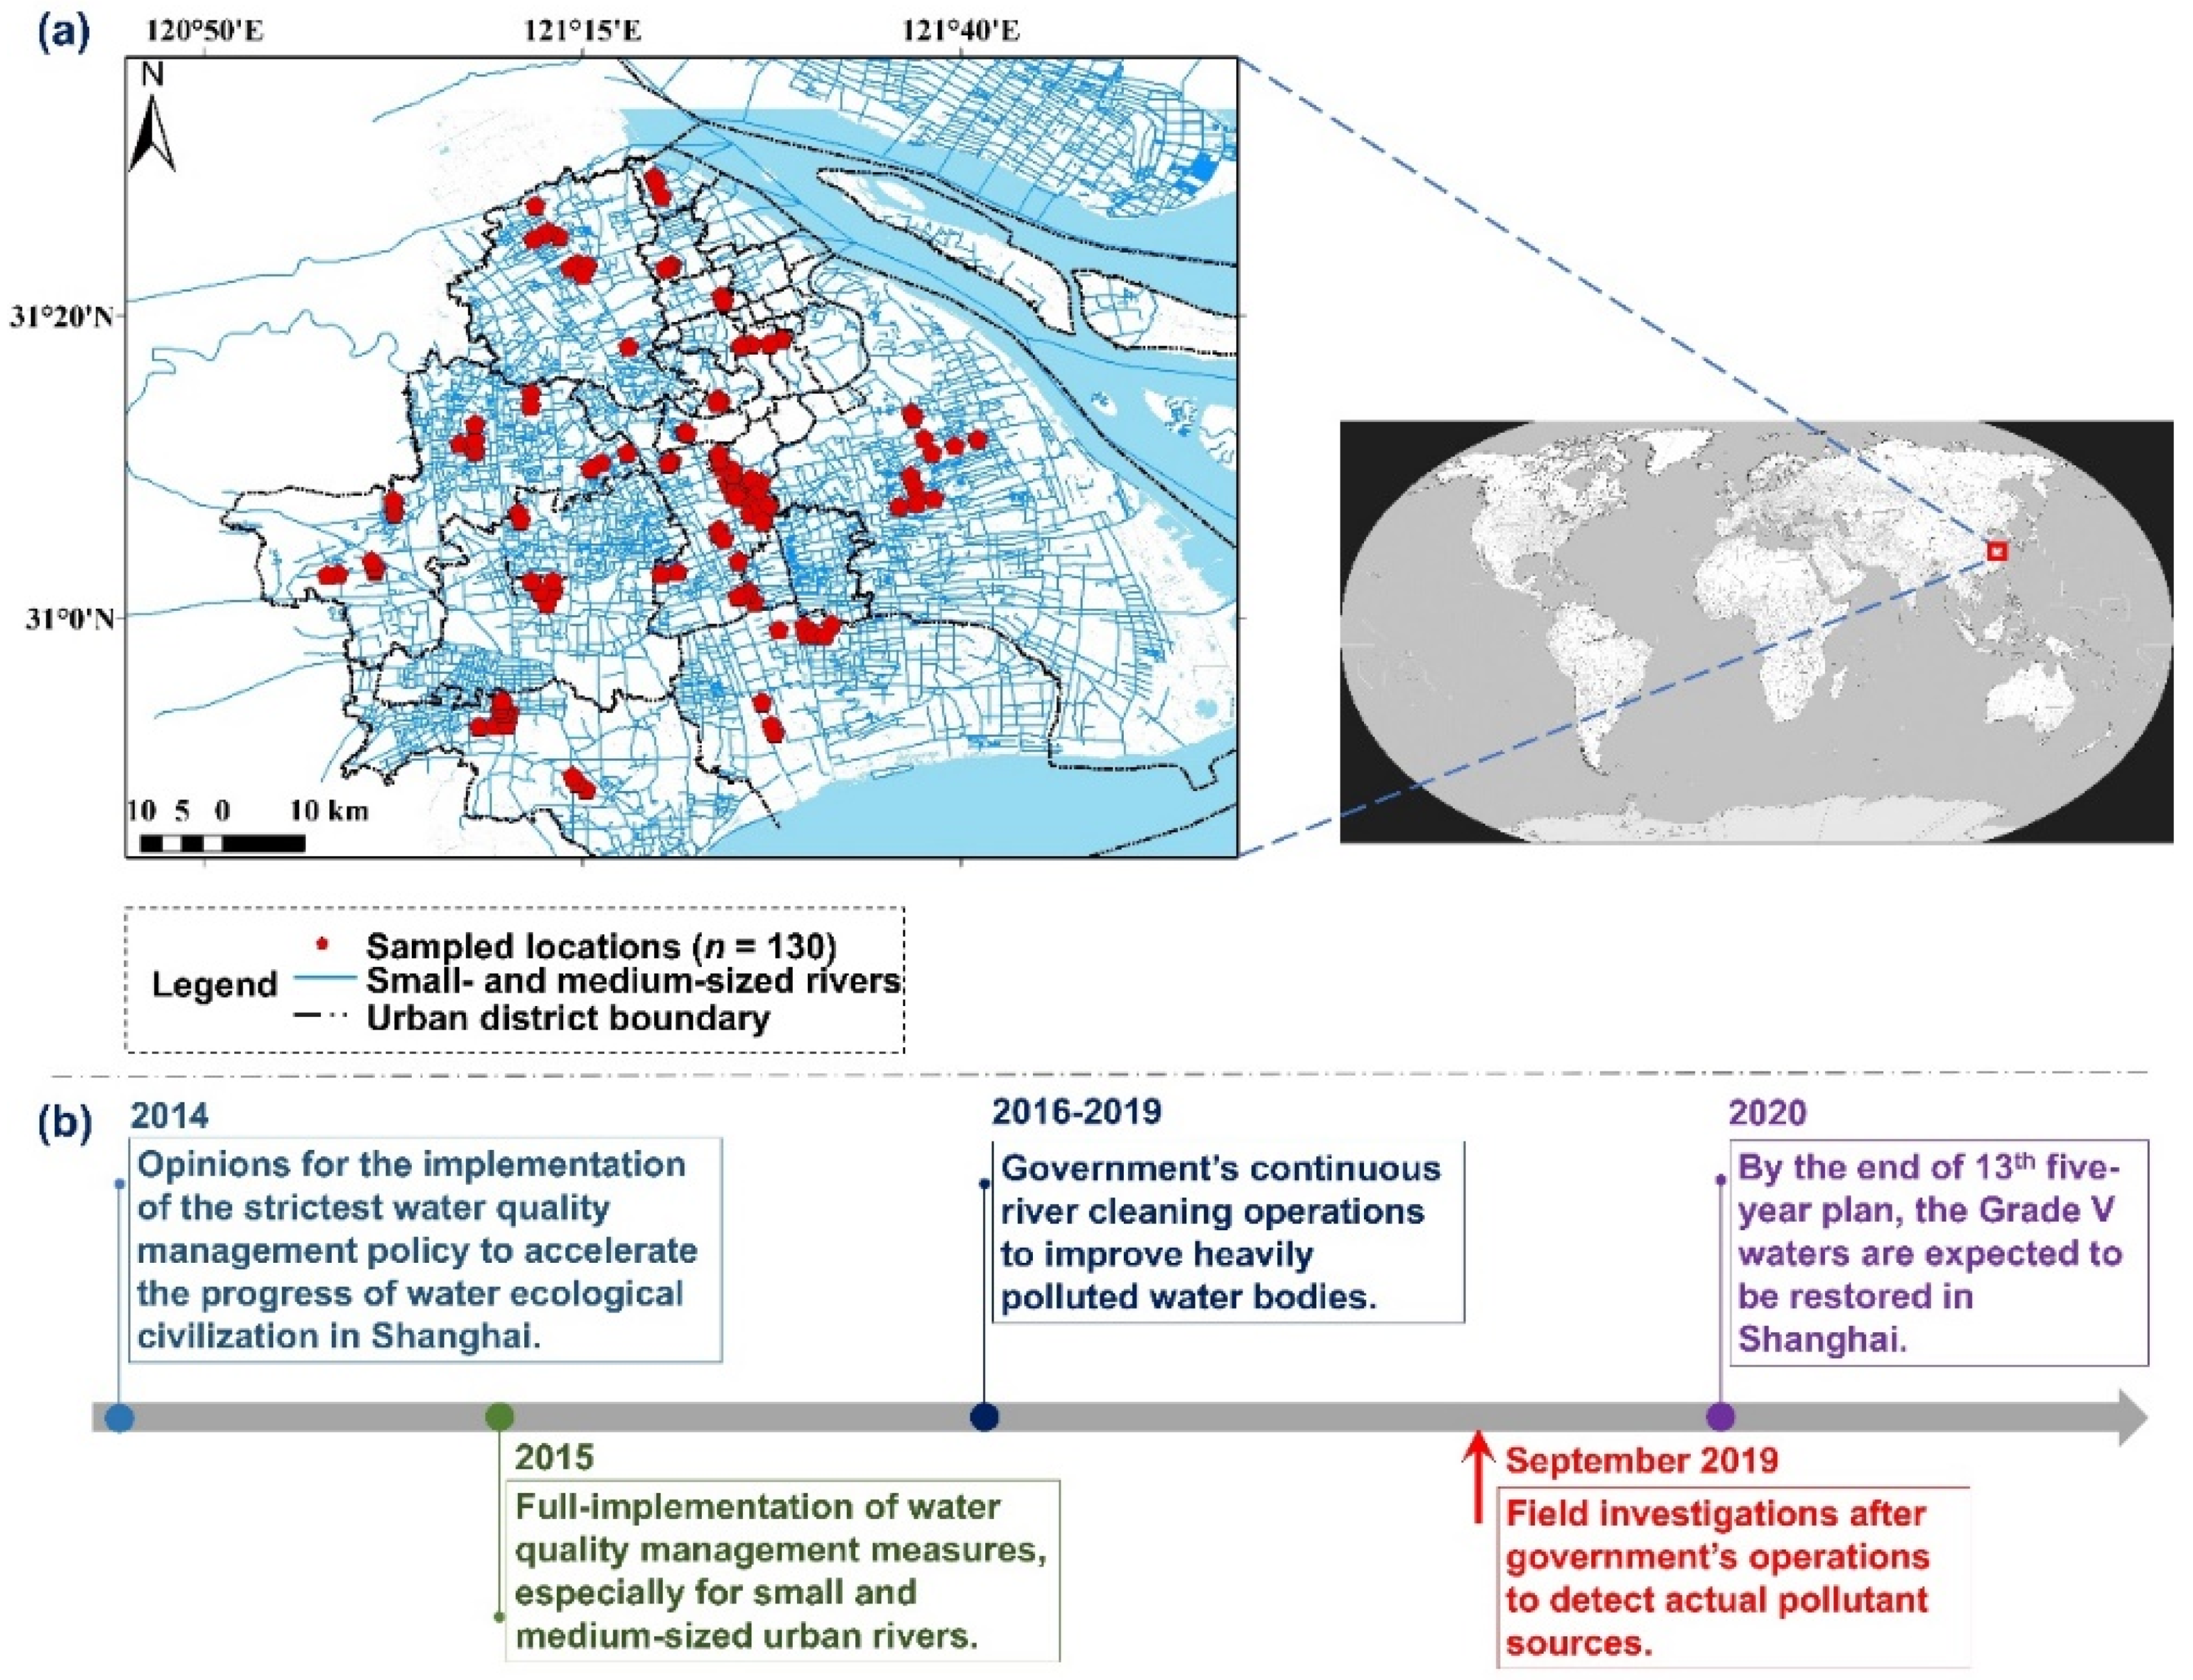
2.1. Study Area

Shanghai is located on the coast of the East China Sea and at the estuary of the Yangtze River (Figure 1). Shanghai is a global center for finance, business and economics, research, education, science and technology, manufacturing, tourism, culture and transportation, and the Shanghai Port is the world’s busiest container port. With a population of 24.9 million as of 2020, Shanghai is the most populous urban area in China. Shanghai’s mean annual temperature is 15.8 °C, and its annual precipitation is 1149 mm. Approximately 60% of the precipitation occurs during the typical wet season from May through September.
The total number of rivers in the greater Shanghai area (6341 km2) is around 46,392, with a total length of 29,862 km and total surface area of 529 km2. Small- and medium-sized rivers, which are administratively managed by village-level divisions, are 39,045 in total, accounting for 61.8% of the total length and 36.7% of the total surface area of Shanghai’s urban rivers. In 2019, the medium- to heavy-polluted urban rivers (Grade IV and V) accounted for 47.5% of the total length and 3.1% of the total surface area. The Shanghai Municipal Government has announced a series of policies on managing river pollution (Figure 1b). One phase of this goal was to manage and purify the Grade V rivers by the end of 2020.
Shanghai Municipal Government carried out a city-level river cleaning action at the early August of 2019. The action mainly included dredging to remove sentiment contaminants and harvesting overgrown aquatic plants (e.g., black algae, watermilfoil, houttuynia, etc.) to stabilize the water quality for urban rivers. The dramatic action was believed to greatly improve the water quality to the normal situations, according to Shanghai River and Lake Report (version 2019). By definition, small- and medium-sized rivers in Shanghai are unnavigable urban rivers (i.e., 15–30 m width, 2–5 m depth, and 1–3 km length) that located mainly in suburban areas and can be easily affected by human activities (examples via Figure S1).

2.2. Field Investigations in Urban Rivers

Our field investigations were conducted between 16 August and 15 September (local summer) in 2019. The period was several weeks after the government’s large-scale river cleaning operations. We adopted this summertime water quality to represent the averaged situations of Shanghai’s river health to be the same as previous studies [6,7,16,18]. As in other seasons, submerged plants and micro-organisms may minimize their positive influences on the water quality. Water quality or water quality indices in this study only concentrate on the summertime throughout the paper, unless specifically mentioned.
We adopted the randomly stratified method by selecting 31 small- and medium-sized rivers from 15 administrative districts of Shanghai (Figure 1a). Shanghai’s small- and medium-sized rivers are often 2–3 km length with high landscape fragmentation. Each of the selected rivers were sampled by every 500 m footstep, and a total of 130 sampled river sections were determined. Water samples (replicated for three times) were then taken on 10 cm depth below surface of those sections using a 500-milliliter glass bottle. It is worth noting that these sampled rivers had very limited water exchange with the Huangpu River and Suzhou Creek, due to the pump stations the government built to limit water exchange between polluted streams and downstream reaches.

2.3. Measurements of Urban Water Quality Indicators

(i)
Physical indicators. On-site properties of sampled urban rivers were measured using a Hydrolab DS5 multiparameter water quality probe (OTT Hydromet GmbH, Kempten, Germany) at a constant depth of 0.5 m. These directly measured parameters included the temperature (Temp; °C), turbidity (NTU; nephelometric turbidity unit), dissolved oxygen (DO; milligram per liter), Blue-green Algae (BGA; cells per liter), pH (dimensionless), and conductivity (Cond; millisecond per centimeter). We also used a Li-1500 quantum sensor (Li-COR Inc., Lincoln, NE, USA) to measure the radiation absorbency (RA; percentage) for the top 0.5 m water. The RA is estimated as the ratio of above water surface radiation at 0.1 m height to the in-water radiation at a 0.5 m depth.
(ii)
Chemical indicators. We conducted laboratory experiments to analyze the biochemical pollutants in the collected water samples, including the total nitrogen (TN; milligram per liter), total phosphorus (TP; milligram per liter), ammonium nitrogen (NH + 4; milligram per liter), and permanganate Index (CODMN; milligram per liter), chlorophyll a (Chla; microgram per liter), total suspended solids (TSS; milligram per liter), and five-day biological oxygen demand (BOD5; milligram per liter). Determinations of abovementioned variables followed the recommended methods of ISO 4313:1976, ISO 5815:1989, ISO 10260:1992, ISO 8467:1993, ISO 11923:1997, ISO 11732:2005, and ISO 29441:2010 (International Organization for Standardization; https://www.iso.org/, accessed on 20 November 2020). The raw data are displayed in Figure S2.

2.4. Field Investigations in Urban Rivers

We adopted an ecosystem-specific (data-driven) water quality index (WQId) to comprehensively evaluate the physical, chemical, and microbiological pollutants in sampled urban rivers in Shanghai. There are over 30 water quality indices existing in the current research field [22]. The evaluations of water quality are highly methodology-dependent, e.g., different approaches and indices output different water quality classifications [20]. The adopted data driven WQId is useful for revealing mathematical trends in the collected data rather than introducing new statistical variables and theoretical parameters into the datasets [16,22,23].
We first applied principal component analysis to assess the parameter redundancy and selected parameters that reflected the most variability (Figure S3). Among the 14 tested parameters, Temp and pH were excluded due to their low sensitivity to the overall dataset. Secondly, we determined the weight of the 12 selected parameters using their proportions of eigenvalues (Table S1). Thirdly, we used the additive aggregation method in terms of the weighted sub-index values to calculate the overall WQId for each sampled river. Lastly, the output WQId was normalized to the range of 0–1 and assigned to one of five classes ranging from the poor to the good (Table S2).

2.5. Remotely Sensed Data Sources

The main remotely sensed data sources of the study were from GlobeLand30 land cover datasets at a 30-m resolution, OpenStreetMap (OSM) datasets, and DMSP-OLS nighttime light datasets at a 1 km resolution. GlobeLand30 land cover datasets are freely available and comprise ten types of land cover, including forests, artificial surfaces and wetlands etc. The Defense Meteorological Program (DMSP) Operational Line-Scan System (OLS) has a unique capability to detect visible and near-infrared (VNIR) emission from land surfaces, especially urban agglomerations.
We then extracted land-use types for the Shanghai area from the OSM database. OSM land-use types can be tentatively categorized into industrial, commercial, residential, and green spaces. Spatial densities of four land-use types were adjusted by multiplying the normalized nighttime light as a weight (see Figure S4 for the pre- and post-comparisons). We also extracted featured road and river data for Shanghai from the OSM and made gridded density maps.

2.6. Remotely Sensed Data Validation

The OSM offers a user-defined land-use and land-cover dataset [24], and this is helpful for distinguishing how different human activities would affect water quality at higher spatial scales [17]. The reliability of OSM data was validated by previous studies worldwide, and related results indicated that OSM data were completed with high spatial accuracy in the urban area [25,26]. Previous studies demonstrated that OSM tends to have better quality data than the provided by the government and/or commercial agents, especially in densely populated cities. We added a verification table by randomly selecting 10 out of 20 places/points in Shanghai, and the results revealed that OSM served as a robust data source for extracting urban land-use types here at Shanghai (at high accuracy).

2.7. Spatial and Statistical Analysis

Spatial analysis of various imagery and gridded data was conducted at a 1 km resolution using QGIS software. Landscape Euclidean distances analysis were applied to assess the locations of different land-use types to studied rivers. Gaussian process regression (Kriging) was used to generate a spatial map of WQId for Shanghai. The minimal cumulative resistance method was borrowed to analyze the transportation efficiency of contaminants in Shanghai’s urban rivers.
The DMSP-OLS nighttime light, OSM river density, and OSM road density are continuous spatial variables. Some analytic techniques (e.g., ANOVA) require clustered data, and thus the Davies–Bouldin index and k-means clustering were used to determine the optimal number of clusters for abovementioned variables (Figure S5) and their group numbers, respectively. Other statistical analysis includes Tukey’s Honestly Significant Difference test, Binning linear regression, and Pearson correlation coefficient were introduced and completed by using R language and related packages.

3. Results

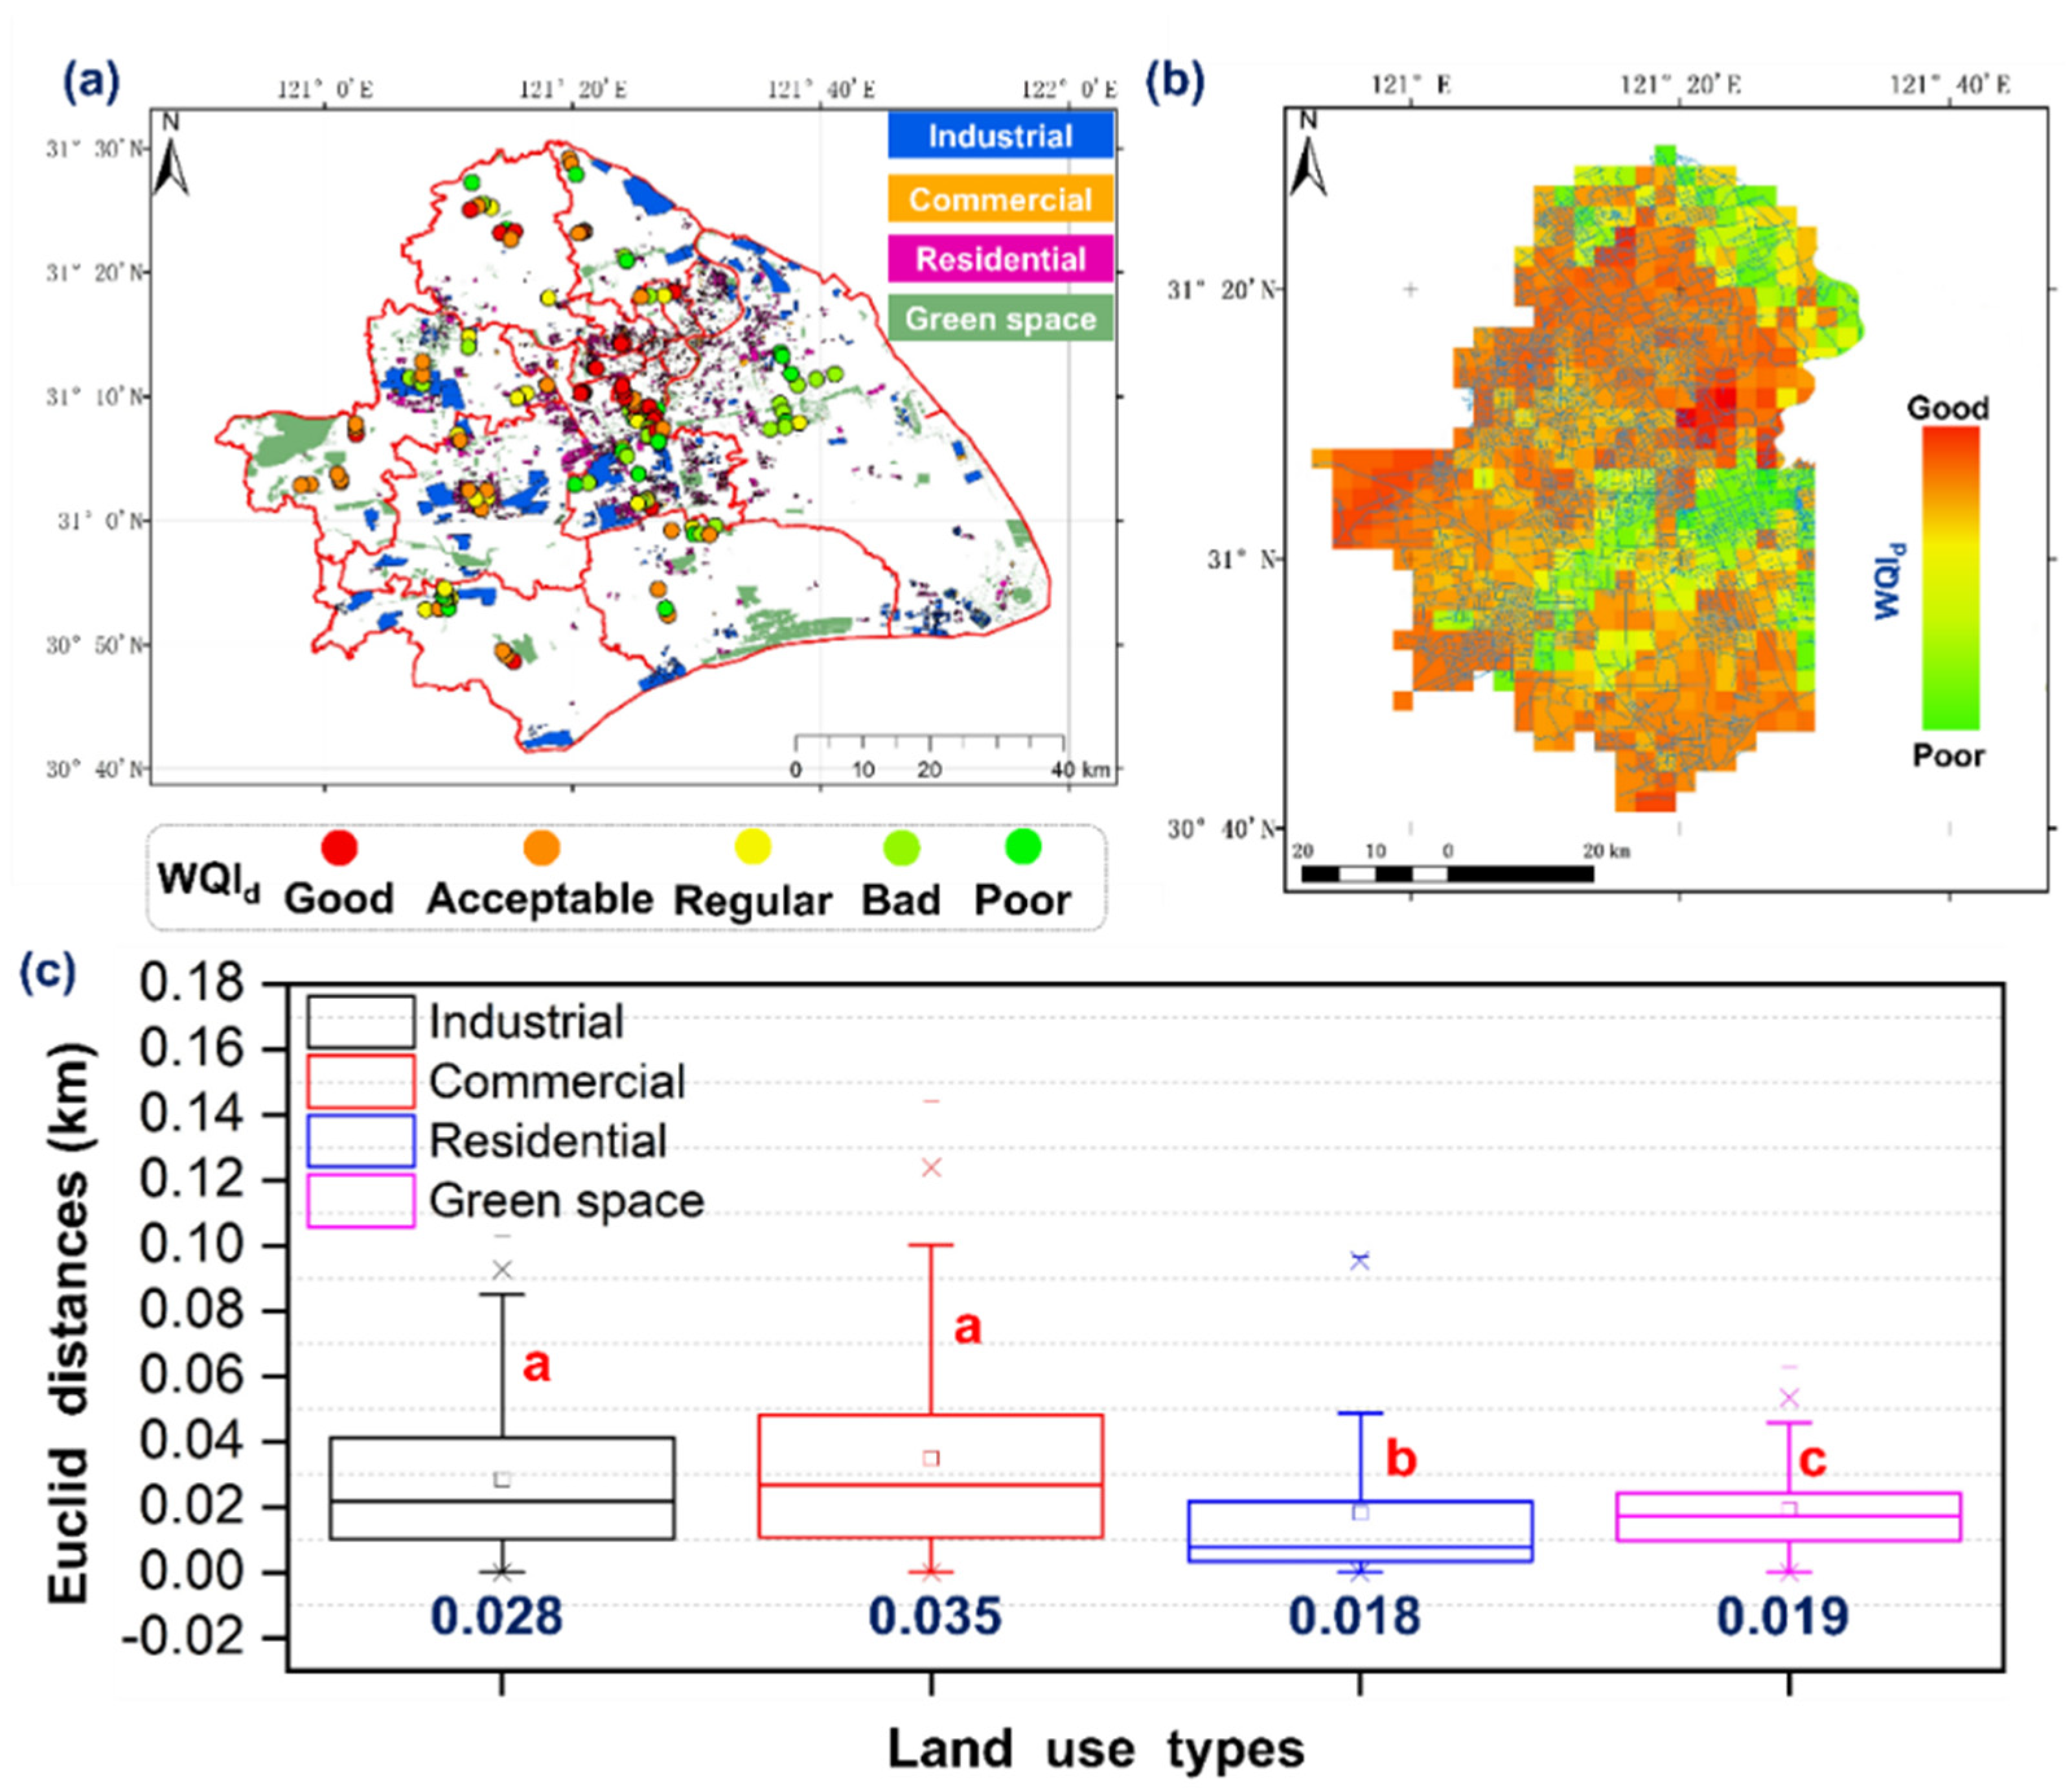
3.1. Demonstrations of Urban Land Use Types and Summertime Water Quality

OSM-extracted land-use types for Shanghai (Figure 2a) were mainly dominated by the human settlements (industrial: 10.1%; commercial: 9.7%, and residential: 37.3%) rather than green spaces (42.6%). Referencing to derived WQId, most of Shanghai’s small- and medium-sized rivers were classified as “average” or “better”. In very limited locations (e.g., Pudong new district), the WQId classification was tagged as “bad” or “worse”. We omitted spatially extrapolated WQId in this administrative district of Figure 2b map to avoid biased presentations. Further, the Euclidean distances analysis (Figure 2c) showed that our sampled river sections were closest to residential areas (0.18 km), followed by green spaces (0.19 km), industrial land (0.28 km), and slightly farther away from commercial developments (0.35 km).

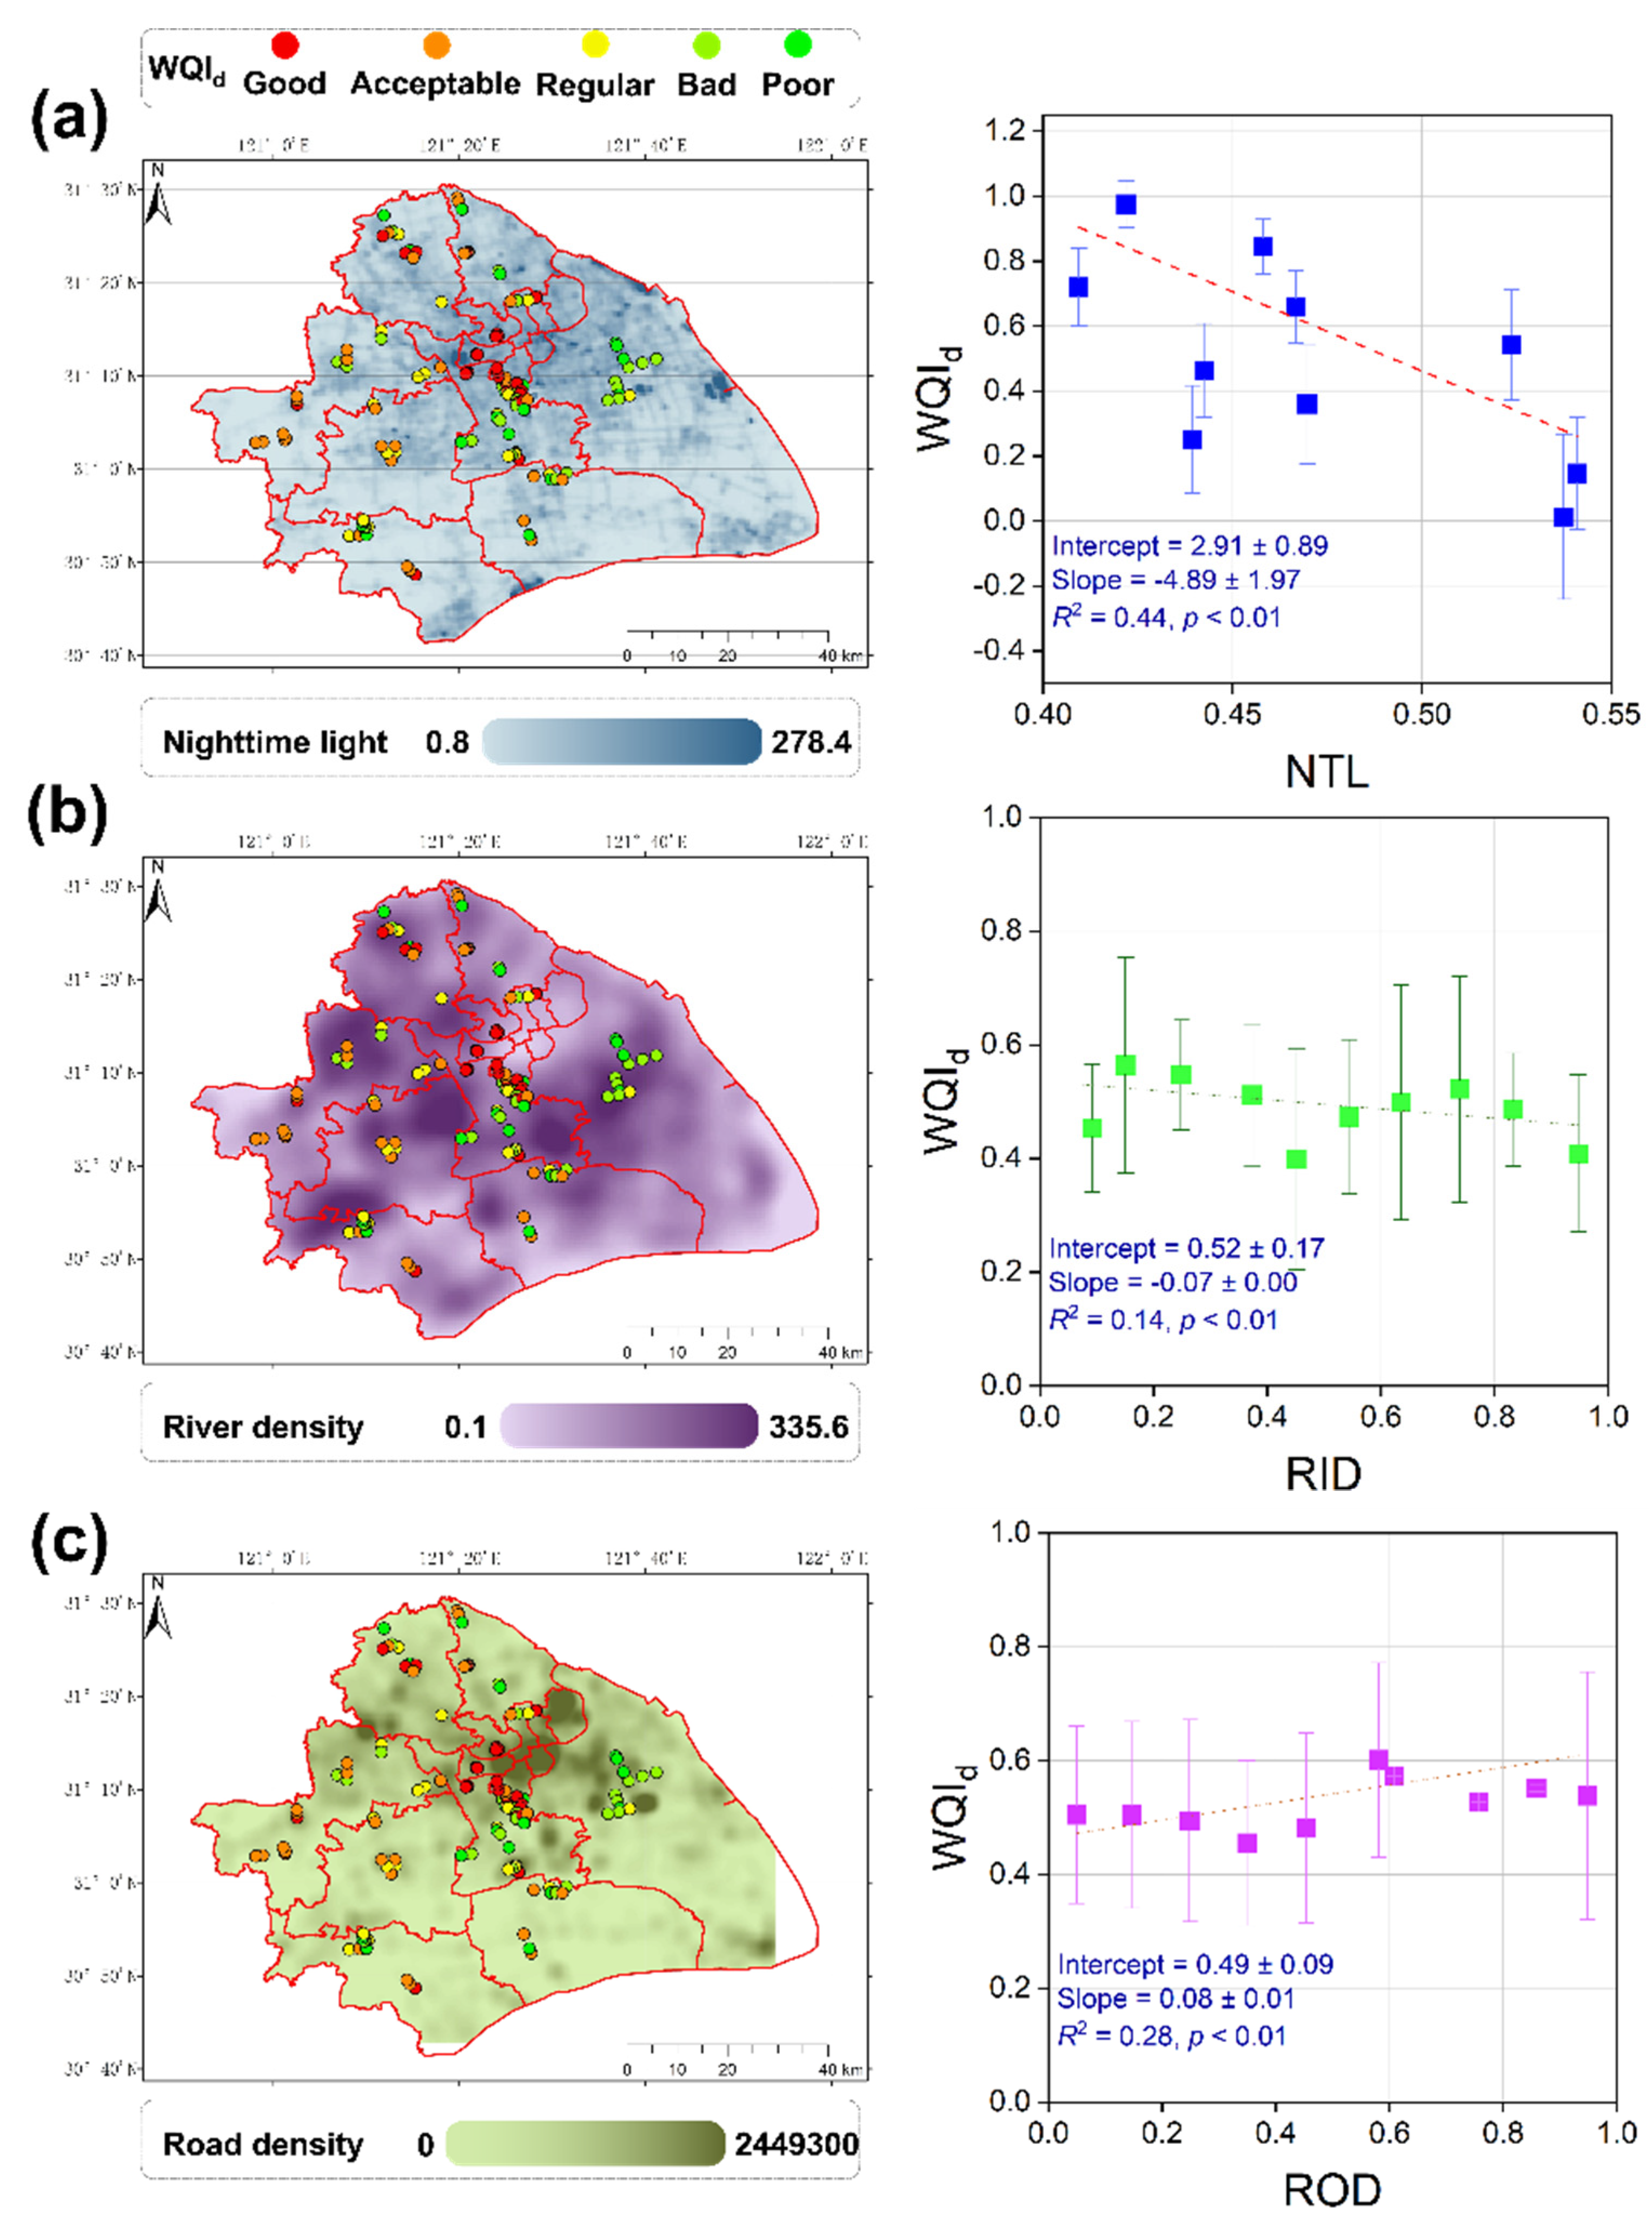
3.2. Human Settlements Determine the Summertime Water Quality

Land-use types, nighttime light, river density, and road density were selected to represent various form of human settlements of the greater Shanghai. The ANOVA analysis demonstrated that land-use types, nighttime light, river density, and road density greatly affected the WQId in Shanghai’s small- and medium-sized rivers (Table 1). We normalized the original scales of nighttime light, river density, and road density to a range of 0–1 and applied the general linear model to analyze the WQId variations in relation to these quantified human settlement indicators (Figure 3).
The results showed that WQId responded negatively to nighttime light (R2 = 0.44) and river density (R2 = 0.14) and responded positively to road density (R2 = 0.28). These decreasing or increasing trends seen with river or road densities are moderate; however, with nighttime light, the trend is significant. We also observed that, in 2019 in Shanghai, the WQId of sampled rivers varied between 0.4 and 0.6 for nighttime light, and between 0 and 1 for river density and road density. This is likely because the sampled sections are mostly located in urban rivers with an average level of population density. River sections well represented Shanghai’s small- and medium-sized rivers with respect to the river density (e.g., low to circa 15 km2 and high to ca. 310 km2).

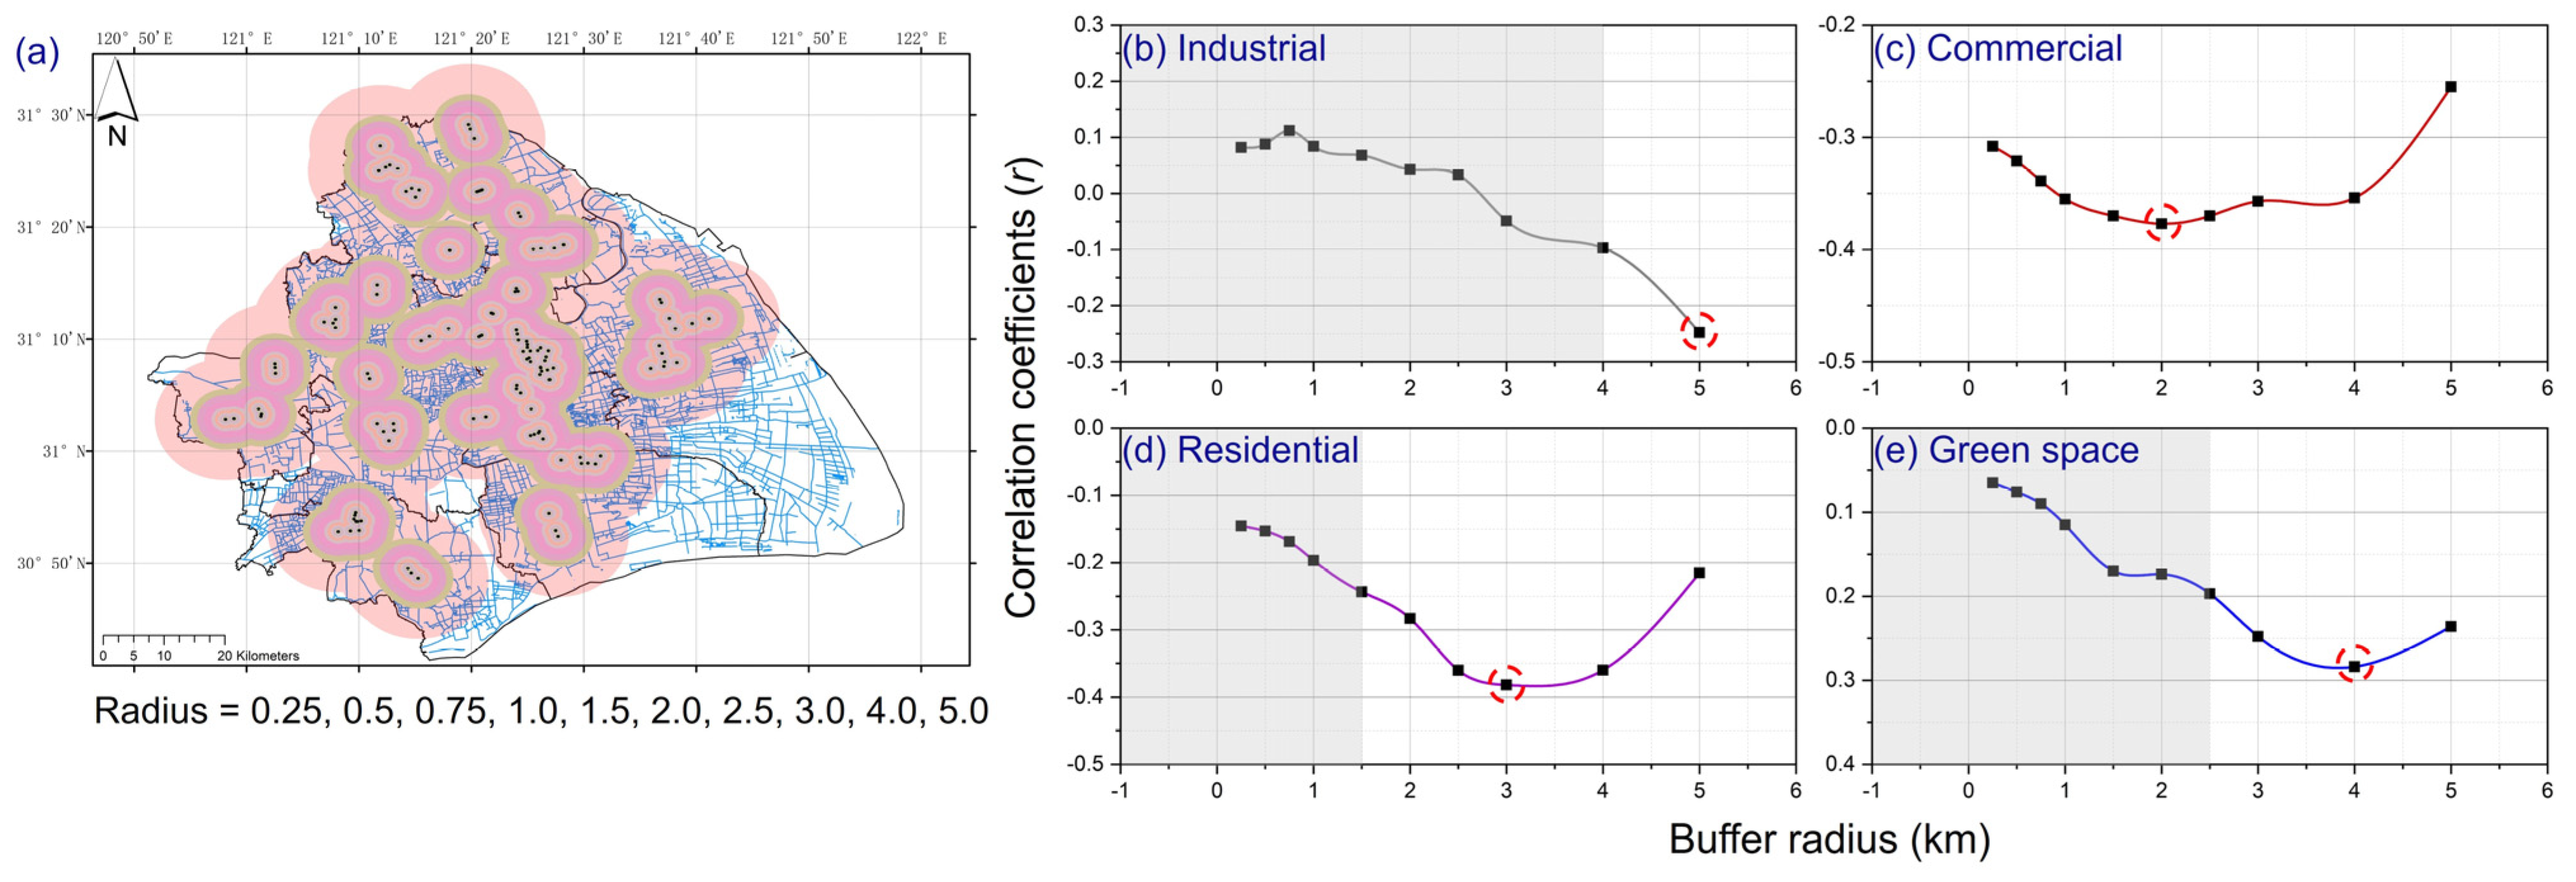
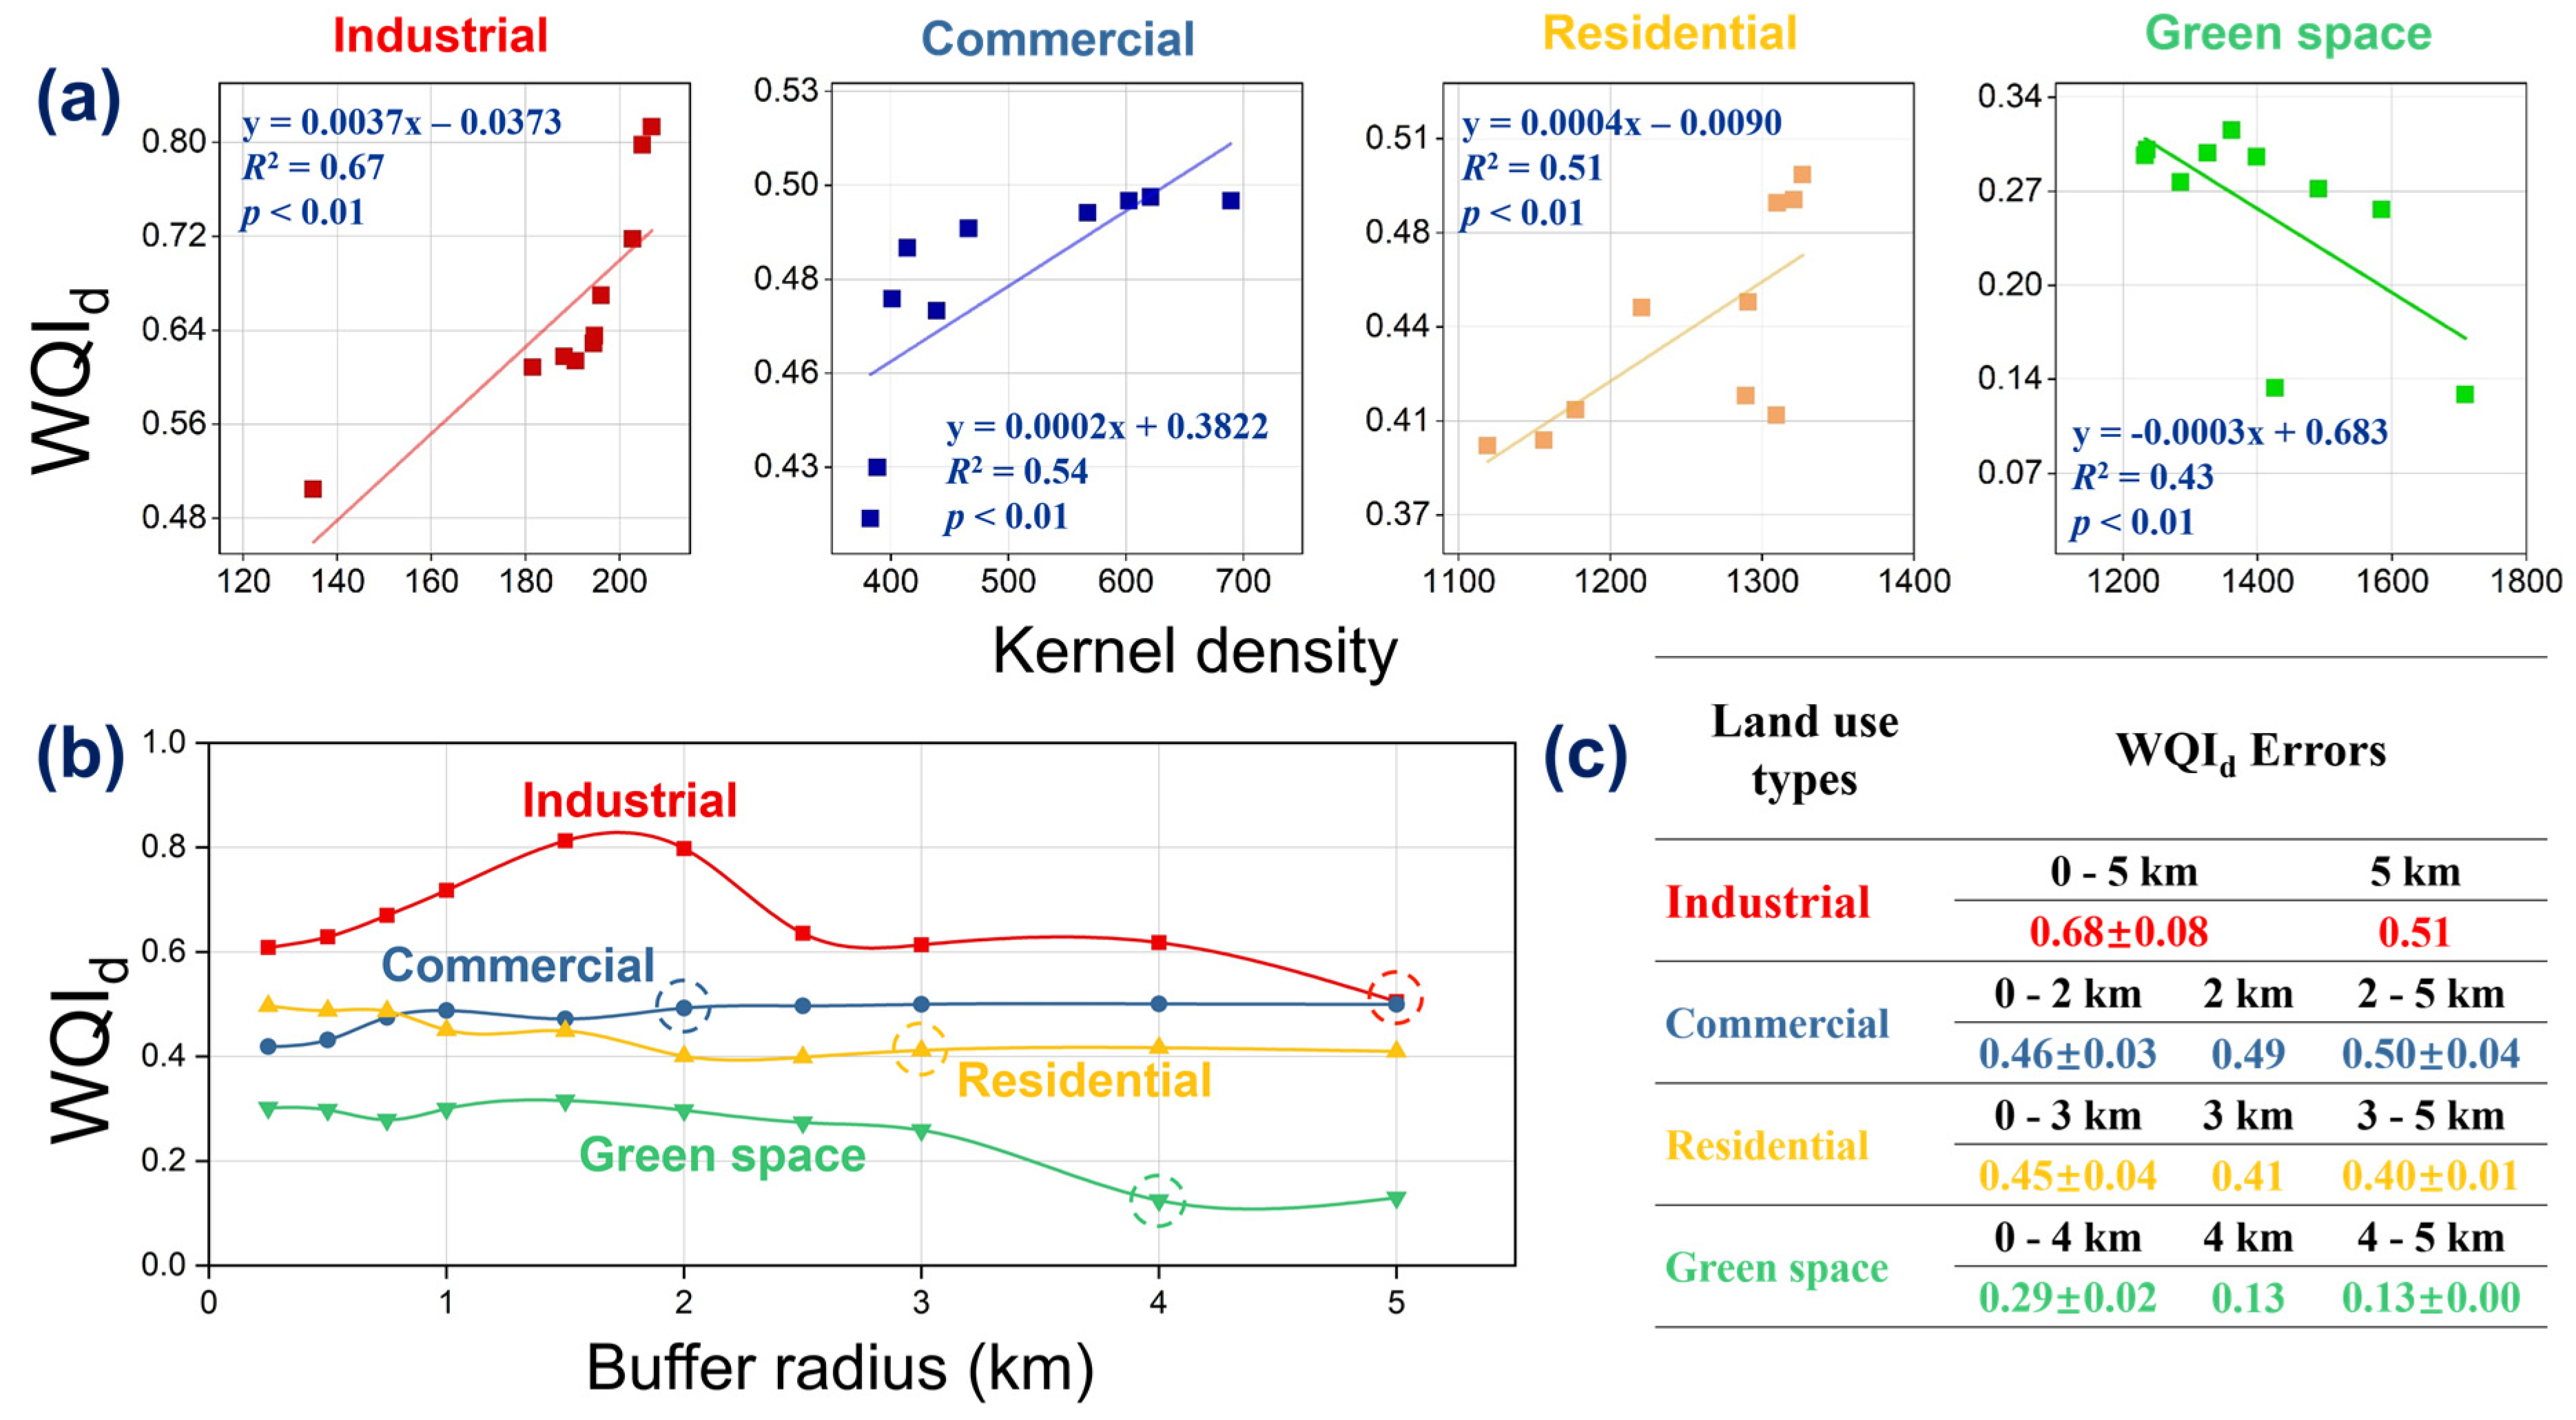
3.3. Spatial Extent Regulating Influences of Land-Use on Summertime Water Quality

Zooming to the entire Shanghai administration area, we discovered that spatial extent is a fundamental factor affecting the relationship between land-use types and WQId (Figure 4). We created ten circular buffers centered on each sampling location to quantify the function of distance on the spatial distribution of WQId (Figure 4a). Their radii were 0.25, 0.5, 0.75, 1.0, 1.5, 2, 2.5, 3, 4, and 5 km. For industrial lands (Figure 4b), correlations (e.g., kernel density vs WQId) increased continuously from the 0.25 km buffer to the 5 km buffer.
For commercial lands (Figure 4c), the strongest correlation was with the 2 km radius; for residential lands (Figure 4d), the strongest correlation was with the 3 km radius; and for green space (Figure 4e), the strongest correlation was with the 4 km radius. These results indicate that industrial areas influence water quality over a large spatial area. Green space has a smaller influence, followed by residential and commercial areas. Note that all the above-mentioned correlations are in negative values except green space. Normally, the higher the spatial densities in industrial, commercial, and residential areas, the larger the WQId. Green space plays purification roles, which means that the greater the spatial densities, the smaller the WQId.

4. Discussion

4.1. Influences of Urban Land-Use on the Water Quality

We illustrated OSM land-use types and derived water quality in Shanghai through Figure 2 to propose data-oriented and localized suggestions for urban eco-environment restorations. Previous research provided a comprehensive examination of the spatial variation in water quality across an entire watershed and attributed the degradation of water quality to urban development [9]. This study selected four human settlements indicators (Figure 3), for instance, land-use types indicate the intensity of pollutant sources [4]; nighttime light corresponds to population distribution; river density exhibits anthropogenic development and natural growth of urban river networks; and road density is a measure of impervious surfaces and development.
Shanghai’s municipal government has identified key government objectives, such as the provision of clean water (Figure 1b) to enhance the standard of living of its residents and protect the natural environment [7,16]. The water quality in the Huangpu River and its main tributary, Suzhou Creek, has improved greatly since 2000. However, Shanghai’s significant economic expansion and corresponding high rates of urbanization after 2000 have brought rapid changes to this megacity’s urban spatial structure and greatly increased the intensity of stressors [27]. As both population and impervious surfaces growth significantly in Shanghai, it is challenging to manage surface water successfully if landscape-level links between land use and water quality are yet clear [1,5,6,28,29].
Land use and land cover change is responsible for urban water quality degradation in many regions [10,11,12]. Other studies have focused on their relationships with water quality variables such as dissolved salts, suspended solid, and nutrients [1,4]. The linkages vary as the ecological landscape varies with urban expansion and population explosion [28]. Thus, it is concluded that human settlement as represented by urban land use has a significant influence on water nutrient concentrations.
Next, the relationships between landscape composition and water quality provide an important basis for effectively addressing urban planning and non-point sourced management problems [19]. Landscape composition indicates different land use types surrounding the sample locations. For instance, this study and others have shown that green landscape compositions may improve water quality [8,19] and contribute greatly to the stability of urban ecosystems [30,31]. As highlighted by previous studies, landscape composition is useful in predicting stream water quality in watersheds [19]. Therefore, we concluded these representative landscape patterns might have a substantial effect on pollution management in urban ecosystems (i.e., Figure 4).

4.2. Evaluations on the Spatial Extent’s Regulations on Land-Use/Water Quality Relations

In the result (e.g., Figure 4), we found that each land-use type controls WQId within a tight statistically fixed radius. Via Figure 5a, we observed that the densities of industrial, commercial, and residential areas were positively correlated with increases in WQId (the R2 were 0.67, 0.54, and 0.51). The density of green space was negatively correlated with increases in WQId (R2 of 0.41). We assessed the estimation errors (underestimate or overestimate of the WQId) associated with not selecting the fixed spatial radius indicated in Figure 5b,c. For industrial areas, if the studied radius is less than 5 km, this leads to an overestimation of WQId (from 0.51 “average” to 0.68 “bad”). For commercial land, a study radius less than 2 km would decrease WQId from 0.49 “average” to 0.46 “average”, and a study radius greater than 2 km would lead to an overestimate of WQId from 0.49 “average” to 0.50 “average”.
For residential areas, a study radius less than 3 km would increase WQId from 0.41 “average” to 0.45 “average”, and a study radius greater than 3 km would decrease WQId from 0.41 “average” to 0.40 “average”. For green space, a study radius less than 4 km would greatly increase WQId from 0.13 “good” to 0.29 “acceptable”, but no change would be seen for a study radius more than 4 km. In these cases, numeric values would be modified for commercial and residential lands; however, the actual water quality classifications would not change. However, both numeric values and actual classification would change for industrial and green spaces.

4.3. Pollution Control in Urban Rivers

Point source pollutants and non-point source pollutants are two broad categories of pollution in urban areas. Non-point source pollutants are characterized by diffusivity, spatial heterogeneity, uncertainty of sources, and regional variation of the transmission process. These characteristics make it difficult to accurately quantify these pollutants and their impact at the regional scale [32]. Shanghai is now experiencing severe ecological threats from non-point source pollution associated with complex land-use types [20]. We proposed a simplified spatial analysis, which quantified the spatial extent of the influence and transmission efficiency of non-point sources in a delineated experimental zone in center Shanghai. In this area, we tentatively tested three scenarios regarding the transmission efficiency of potential pollutants (e.g., domestic, and industrial sewage, surface runoff, and atmospheric depositions) by the pathways of rivers, roads, and a combination of rivers and roads.
Consequently, our analysis revealed a higher transmission efficiency and larger spatial extent associated with rivers than with roads (Figure 6a,b). With combined pathways scenario (road weighted as the half as the rivers), the transmission efficiency of pollutants in the experimental area increased significantly (Figure 6c). Urban development obviously affects the types of contaminants that are transported in surface runoff. Small- and medium-sized rivers cannot rapidly dilute and decompose pollutants. Therefore, these rivers will carry high-concentration contaminants for a longer time and spread to a larger area. Thus, urban land use characteristics are critical for the implementation of targeted control measures as part of any water quality remediation strategy, especially for small and medium-sized rivers [33].

4.4. Implications for Small- and Medium-Sized River Managements in Megacities

The high-quality environment in small- and medium-sized rivers are essential for urbans to grapple with complex challenge of risks to water supply [18]. Since these rivers flow over different administrations, towns, and villages with significantly different regulations for riparian land use, land development, and pollution control, a uniformed framework including ecological restoration theories, monitoring networks, and environmental management techniques is needed to manage these rivers affected by intensive human activities.
Accurately and quickly identifying the point and non-point sources of pollution to these rivers is critical. A network for monitoring ecosystem function in these rivers should be established, especially in high-risk areas within the central urban, to provide locality-specific evaluation and recommendations for stakeholders and decision-makers. Using local data may avoid exaggeration of the ecological impacts of river pollution when developing related policies. More importantly, the goal of small- and medium-sized river management is not to restore each of these rivers to the natural status but to maintain their maximal ecosystem functions and services with minimal human resources, social investments, and government managerial costs.

5. Conclusions

The rapid urbanization process in Shanghai since the 1980s exhibited strong influences on land use patterns, which introduced huge uncertainties to a continuous policy of ecological restorations on urban water environments. This study addressed the effects of specific land-use types on summertime water quality by using in situ data collection from 130 river sections of 31 representative small- and medium-sized rivers in Shanghai. Using geographical techniques, landscape ecological approaches, and statistical analysis, we analyzed and quantified the direct impacts of urban land-use types on water quality and the spatial influence of non-point source pollution in these small- and medium-sized rivers.
Landscape composition associated with urbanization is the main factor affecting the stabilities of water environment. Impervious surfaces represented by industrial commercial, and residential lands play negative roles in water quality, while green spaces offset the negative effects. We calculated and evaluated the impact radii of different land use types on water quality. The radii of various riparian land use types determine the intensity and frequency of water quality management and urban river restorations. By proposing a simplified scenario analysis, the non-point pollution in urban rivers is complex due to pollutant transportation efficiency in the waterbody.
This study provided sub-watershed scale assessments to inform maintaining a good water environment as the goal of Shanghai’s sustainable development. This study also provided data and practice supports for urban river management, and we urge immediate attention regarding the restorations of small- and medium-sized rivers in megacities with dense river networks. We finally suggest an urgent necessity for comprehensive land use planning as a solution for protecting valuable water resources.

Supplementary Materials

The following supporting information can be downloaded at: https://www.mdpi.com/article/10.3390/land11040511/s1. Figure S1. Box charts field collected samples with <40 turbidity. Figure S2. Eigen-analysis of the correlation matrix. Five-day biochemical oxygen demand (BOD5; milligram per liter), Total nitrogen (TN; milligram per liter), and Permanganate Index (CODMN; milligram per liter) are essential biological indicators for water quality assessment. Their “low correlations with PC1 and PC2 are also captured by the ecosystem-specific water quality index, and further revealed the situations of each the investigated river section. Figure S3. Figures show kernel densities of four land-use types adjusted by the normalized nighttime light (NTL) data. Bar plots are displayed with mean pixel values plus/minus standard deviations. Figure S4. The clustering of the raw nighttime light data, road density data, and river density data using the Davies-Bouldin index. Determined clusters of nighttime light, road density, and river density are 8, 9, and 4, respectively. Figure S5. Experimental area for the determinations of mechanisms between land-use types and water quality in Shanghai. Rivers and roads are from OSM datasets. Kernel densities of industrial, commercial, residential, and green space are adjusted by NTL and normalized to 0–1. Table S1. Determined weights of 12 selected parameters in the calculation of WQId. Table S2. Correspondence of the qualitative results of water quality indicators according to the numerical result of index calculation.

Author Contributions

Conceptualization, X.C. and Y.Z.; methodology, J.L.; software, F.C.; validation, F.C., J.L. and Y.Z.; formal analysis, J.L.; investigation, F.C.; resources, Q.Z.; data curation, J.L.; writing—original draft preparation, J.L.; writing—review and editing, F.C.; visualization, Q.S.; supervision, X.C.; project administration, X.C.; funding acquisition, Y.Z. All authors have read and agreed to the published version of the manuscript.

Funding

The study is funded by Shanghai Committee of Science and Technology (No. 19DZ1204505), National Natural Science Foundation of China for Young Scholar (No.32101326), Key Projects in Soft Science Research Field of the “Science and Technology Innovation Action Plan” of Shanghai in 2020 (No. 20692114600), Shanghai Landscaping and City Appearance Administrative Bureau’s Science and Technology Project (No. G190201), and Initiation Research Program for Young Scholars of Shanghai Academy of Landscape Architecture Science and Planning (KT00257).

Institutional Review Board Statement

Not applicable.

Informed Consent Statement

Not applicable.

Data Availability Statement

Data is available from the corresponding author on request.

Acknowledgments

We appreciate Johannes Kollmann for his careful reading of our manuscript and many insightful comments and suggestions.

Conflicts of Interest

The authors declare no conflict of interest.

References

  1. Ahearn, D.S.; Sheibley, R.W.; Dahlgren, R.A.; Anderson, M.; Johnson, J.; Tate, K.W. Land Use and Land Cover Influence on Water Quality in the Last Free-Flowing River Draining the Western Sierra Nevada, California. J. Hydrol. 2005, 313, 234–247. [Google Scholar] [CrossRef]
  2. Dobbs, C.; Escobedo, F.J.; Clerici, N.; de la Barrera, F.; Eleuterio, A.A.; MacGregor-Fors, I.; Reyes-Paecke, S.; Vasquez, A.; Camano, J.D.Z.; Hernandez, H.J. Urban Ecosystem Services in Latin America: Mismatch between Global Concepts and Regional Realities? Urban Ecosyst. 2019, 22, 173–187. [Google Scholar] [CrossRef]
  3. Liu, S.; Lin, M.; Li, C. Analysis of the Effects of the River Network Structure and Urbanization on Waterlogging in High-Density Urban Areas—A Case Study of the Pudong New Area in Shanghai. Int. J. Environ. Res. Public Health 2019, 16, 3306. [Google Scholar] [CrossRef] [PubMed] [Green Version]
  4. Li, S.; Gu, S.; Liu, W.; Han, H.; Zhang, Q. Water Quality in Relation to Land Use and Land Cover in the Upper Han River Basin, China. Catena 2008, 75, 216–222. [Google Scholar] [CrossRef]
  5. Zhao, J.; Lin, L.; Yang, K.; Liu, Q.; Qian, G. Influences of Land Use on Water Quality in a Reticular River Network Area: A Case Study in Shanghai, China. Landsc. Urban Plan. 2015, 137, 20–29. [Google Scholar] [CrossRef]
  6. Ren, W.; Zhong, Y.; Meligrana, J.; Anderson, B.; Watt, W.E.; Chen, J.; Leung, H.-L. Urbanization, Land Use, and Water Quality in Shanghai 1947–1996. Environ. Int. 2003, 29, 649–659. [Google Scholar] [CrossRef]
  7. Yuan, W.; James, P. Evolution of the Shanghai City Region 1978–1998: An Analysis of Indicators. J. Environ. Manag. 2002, 64, 299–309. [Google Scholar] [CrossRef]
  8. Tong, S.T.Y.; Chen, W. Modeling the Relationship between Land Use and Surface Water Quality. J. Environ. Manag. 2002, 66, 377–393. [Google Scholar] [CrossRef]
  9. Wang, X. Integrating Water-Quality Management and Land-Use Planning in a Watershed Context. J. Environ. Manag. 2001, 61, 25–36. [Google Scholar] [CrossRef]
  10. Razali, A.; Ismail, S.N.S.; Awang, S.; Praveena, S.M.; Abidin, E.Z. Land Use Change in Highland Area and Its Impact on River Water Quality: A Review of Case Studies in Malaysia. Ecol. Processes 2018, 7, 19. [Google Scholar] [CrossRef] [Green Version]
  11. Shrestha, S.; Bhatta, B.; Shrestha, M.; Shrestha, P.K. Integrated Assessment of the Climate and Landuse Change Impact on Hydrology and Water Quality in the Songkhram River Basin, Thailand. Sci. Total Environ. 2018, 643, 1610–1622. [Google Scholar] [CrossRef] [PubMed]
  12. De Mello, K.; Taniwaki, R.H.; de Paula, F.R.; Valente, R.A.; Randhir, T.O.; Macedo, D.R.; Leal, C.G.; Rodrigues, C.B.; Hughes, R.M. Multiscale Land Use Impacts on Water Quality: Assessment, Planning, and Future Perspectives in Brazil. J. Environ. Manag. 2020, 270, 110879. [Google Scholar] [CrossRef]
  13. Zerega, A.; Simões, N.E.; Feio, M.J. How to Improve the Biological Quality of Urban Streams? Reviewing the Effect of Hydromorphological Alterations and Rehabilitation Measures on Benthic Invertebrates. Water 2021, 13, 2087. [Google Scholar] [CrossRef]
  14. Su, Y.; Li, W.; Liu, L.; Hu, W.; Li, J.; Sun, X.; Li, Y. Health Assessment of Small-to-Medium Sized Rivers: Comparison between Comprehensive Indicator Method and Biological Monitoring Method. Ecol. Indic. 2021, 126, 107686. [Google Scholar] [CrossRef]
  15. Peng, G.; Xu, P.; Zhu, B.; Bai, M.; Li, D. Microplastics in Freshwater River Sediments in Shanghai, China: A Case Study of Risk Assessment in Mega-Cities. Environ. Pollut. 2018, 234, 448–456. [Google Scholar] [CrossRef] [PubMed]
  16. Wu, Z.; Wang, X.; Chen, Y.; Cai, Y.; Deng, J. Assessing River Water Quality Using Water Quality Index in Lake Taihu Basin, China. Sci. Total Environ. 2018, 612, 914–922. [Google Scholar] [CrossRef]
  17. Chen, Y.; Guo, F.; Wang, J.; Cai, W.; Wang, C.; Wang, K. Provincial and Gridded Population Projection for China under Shared Socioeconomic Pathways from 2010 to 2100. Sci. Data 2020, 7, 83. [Google Scholar] [CrossRef] [Green Version]
  18. Zhang, H. The Orientation of Water Quality Variation from the Metropolis River–Huangpu River, Shanghai. Environ. Monit. Assess. 2007, 127, 429–434. [Google Scholar] [CrossRef]
  19. Shen, Z.; Hou, X.; Li, W.; Aini, G. Relating Landscape Characteristics to Non-Point Source Pollution in a Typical Urbanized Watershed in the Municipality of Beijing. Landsc. Urban Plan. 2014, 123, 96–107. [Google Scholar] [CrossRef]
  20. Wu, S.; Yin, P.; Wang, M.; Zhou, L.; Geng, R. A New Watershed Eco-Zoning Scheme for Evaluate Agricultural Nonpoint Source Pollution at National Scale. J. Clean. Prod. 2020, 273, 123033. [Google Scholar] [CrossRef]
  21. Yin, S.; Tian, L.; Ma, Y.; Tan, H.; Xu, L.; Sun, N.; Meng, H.; Liu, C. Sources and Sinks Evaluation of PAHs in Leaves of Cinnamomum Camphora in Megacity: From the Perspective of Land-Use Types. J. Clean. Prod. 2020, 279, 123444. [Google Scholar] [CrossRef]
  22. Sutadian, A.D.; Muttil, N.; Yilmaz, A.G.; Perera, B.J.C. Development of River Water Quality Indices—A Review. Environ. Monit. Assess. 2015, 188, 58. [Google Scholar] [CrossRef] [PubMed] [Green Version]
  23. Gradilla-Hernández, M.S.; de Anda, J.; Garcia-Gonzalez, A.; Montes, C.Y.; Barrios-Piña, H.; Ruiz-Palomino, P.; Díaz-Vázquez, D. Assessment of the Water Quality of a Subtropical Lake Using the NSF-WQI and a Newly Proposed Ecosystem Specific Water Quality Index. Environ. Monit. Assess. 2020, 192, 296. [Google Scholar] [CrossRef]
  24. Johnson, B.A.; Iizuka, K. Integrating OpenStreetMap Crowdsourced Data and Landsat Time-Series Imagery for Rapid Land Use/Land Cover (LULC) Mapping: Case Study of the Laguna de Bay Area of the Philippines. Appl. Geogr. 2016, 67, 140–149. [Google Scholar] [CrossRef]
  25. Zheng, S.; Zheng, J. Assessing the Completeness and Positional Accuracy of OpenStreetMap in China. In Thematic Cartography for the Society; Springer: Berlin/Heidelberg, Germany, 2014; pp. 171–189. [Google Scholar] [CrossRef]
  26. Hu, T.; Yang, J.; Li, X.; Gong, P. Mapping Urban Land Use by Using Landsat Images and Open Social Data. Remote Sens. 2016, 8, 151. [Google Scholar] [CrossRef]
  27. Tian, L.; Ge, B.; Li, Y. Impacts of State-Led and Bottom-up Urbanization on Land Use Change in the Peri-Urban Areas of Shanghai: Planned Growth or Uncontrolled Sprawl? Cities 2017, 60, 476–486. [Google Scholar] [CrossRef]
  28. Turner, R.E.; Rabalais, N.N. Linking Landscape and Water Quality in the Mississippi River Basin for 200 Years. Bioscience 2003, 53, 563–572. [Google Scholar] [CrossRef]
  29. Zaharia, L.; Ioana-toroimac, G.; Cocoş, O.; Ghiţă, F.A.; Mailat, E. Urbanization Effects on the River Systems in the Bucharest City Region (Romania). Ecosyst. Health Sustain. 2017, 2, e01247. [Google Scholar] [CrossRef] [Green Version]
  30. Draus, P.; Lovall, S.; Formby, T.; Baldwin, L.; Lowe-Anderson, W. A Green Space Vision in Southeast Michigan’s Most Heavily Industrialized Area. Urban Ecosyst. 2019, 22, 91–102. [Google Scholar] [CrossRef]
  31. Verdú-Vázquez, A.; Fernández-Pablos, E.; Lozano-Diez, R.V.; López-Zaldívar, Ó. Green Space Networks as Natural Infrastructures in PERI-URBAN Areas. Urban Ecosyst. 2021, 24, 187–204. [Google Scholar] [CrossRef]
  32. Chahor, Y.; Casalí, J.; Giménez, R.; Bingner, R.L.; Campo, M.A.; Goñi, M. Evaluation of the AnnAGNPS Model for Predicting Runoff and Sediment Yield in a Small Mediterranean Agricultural Watershed in Navarre (Spain). Agric. Water Manag. 2014, 134, 24–37. [Google Scholar] [CrossRef]
  33. Buchanan, B.P.; Archibald, J.A.; Easton, Z.M.; Shaw, S.B.; Schneider, R.L.; Walter, M.T. A Phosphorus Index That Combines Critical Source Areas and Transport Pathways Using a Travel Time Approach. J. Hydrol. 2013, 486, 123–135. [Google Scholar] [CrossRef]
Figure 1. (a): Locations of 130 sampled sections in Shanghai’s small- and medium-sized rives. (b): Timeline for Shanghai’s river water quality managing operations in the years 2014–2020.
Land 11 00511 g001
Figure 2. (a): Map layers illustrating the summertime data driven water quality index (WQId) and four land use type layers in Shanghai. (b): Map indicates spatially extrapolated WQId with 0.025 decimal degree resolution using Kriging regression according to the in situ measurements from sampled small- and medium-sized river sections during late summer. (c): Landscape Euclidean distance between sampled rivers and surrounded land-use types. Spatially extrapolated WQId in Shanghai’s Pudong district is omitted due to limited samples. Box charts in (c) are tagged with the intragroup averaged Euclidean distance. The Duncan’s multiple range test (ac) shows Euclidean distances across four land-use types are significantly different (p < 0.05).
Land 11 00511 g002
Figure 3. (ac): Grid maps of nighttime light (NTL), river density, and road density of Shanghai in 2019, and their linear regressions with summertime data driven water quality index (WQId). The plotted points are median values taken from each (normalized) cluster binned at every increment of 0.1 (all the same as NTL, RID, and ROD). Land use can be clustered into four types: industrial, commercial, residential, and green spaces.
Land 11 00511 g003
Figure 4. Quantitative evaluations on the maximum extent each land-use type influence the summertime water quality index (WQId). We extracted the kernel density of each land-use type using the zonal statistics for each buffer radius. Pearson’s correlation coefficients were applied to evaluate the results. (a) The buffer radius that was set up for the spatial analysis, in (be), red dotted circles indicate the maximum extent of influence, and grey shaded areas express non-significance (p < 0.05).
Land 11 00511 g004
Figure 5. (a): Summertime water quality index (WQId) variations in response to kernel density of each land use type. (b): WQId dynamics of each land use type along the buffer radius changes. (c): Error estimations for situations when selecting an inappropriate spatial extent as indicated by Figure 4b–e. We extracted values for different land use types and various buffer radii of sampled cross sections from the extrapolated WQId map (i.e., Figure 2b).
Land 11 00511 g005
Figure 6. Cost distance analysis of the spatial extents that potential pollutants may affect the water quality of the sampled cross-sections by river and road networks in the experimental area of central Shanghai. Black circles are sampled cross sections in this experimental area. (a,b) considered the single effect of rivers or roads. (c) considered combined effects of rivers and roads, where the transmission efficiency of the pollutants by rivers and roads are weighted as 1 and 0.5, respectively.
Land 11 00511 g006
Table 1. Fixed effects of human settlements on summertime WQId in Shanghai’s small- and medium-sized rivers. Statistical method: an analysis of variance procedure using Tukey’s Honestly Significant Difference test. R language glm() function: WQId ~ Land use types + Nighttime light + Road density + River density.
Fixed FactorsDegree of FreedomSum of SquaresMean Sum of SquareF-Valuep-Value
Land-use types32.381.142.370.000
Nighttime light70.210.031.060.039
River density30.150.051.810.050
Road density80.160.020.690.018
Publisher’s Note: MDPI stays neutral with regard to jurisdictional claims in published maps and institutional affiliations.

