1. Introduction
The scale of land finance and its contribution to local finance illustrates a regional law that encourages economic and social development [
1]. Land financing is a dynamic mechanism for rapid urbanization [
2,
3,
4], which helps to secure ample investment funding and the required land for urban public construction in advance. Urban construction mostly centers on industrial use [
5,
6] as it promotes economic growth and urban development. As a consequence, the level of infrastructure in the east, in developed areas and non-downtown areas, has increased considerably [
7,
8]. Land finance plays a key role in promoting the supply of economic goods in local infrastructure [
9,
10,
11] but suppresses the provision of non-economic public services such as healthcare, education, and indemnificatory apartments. It has been noted that its impact on the eastern region is less than on the central and western regions [
12,
13], and that cities with a lower dependence on land finance and stronger financial autonomy have less inhibitory effects [
14,
15]. Land expropriation gives rise to several high-quality collateral effects; that is, the leverage effect of land mortgage financing accelerates the accumulation of capital and promotes economic development [
16]. Land finance has a non-linear effect on economic growth, and the proportion of land revenue relative to the gross domestic product in the eastern and western regions at first promotes and later restrains economic growth [
17]. Land finance indirectly improves the quality of economic growth through industrial infrastructure upgrading and urbanization, but its marginal effect decreases gradually after a period of high-level urbanization [
18,
19]. Land finance, which is effective for improving the quality of economic growth in the short term, has the greatest impact in the central region and the smallest in the eastern region [
20]. Land finance also has a significant negative impact on urban total factor productivity as a result of the crowding and cost-pull effects of real estate investment. Land financing is increasing in the western, central, and northeast regions, as well as in small- and medium-sized cities
(type I and type II big cities; see
Appendix A for details). It increases in the eastern region and super-mega-cities are not significant [
21]. The increase in land financial dependence will significantly inhibit the upgrading of productive and high-end service structures, especially in the central and western regions, especially in the wake of the 2008 financial crisis [
22,
23].
Most of land financing’s raw material, that is, the land itself, is located in rural areas; however, the research on its support toward rural development is still insufficient, especially concerning the “value-added income distribution” of the land. The general consensus is that the scope of agricultural land expropriation is random, the compensation is low, and the income distribution is unreasonable [
24,
25,
26]. The root cause of the aforementioned is that the distribution of the land’s value-added income ignores the contribution of some subjects and the added value should be “returned to society,” not monopolized by a small number of people [
27,
28,
29]. Farmers’ rights and interests can be protected regarding compensation, security, and sharing by improving the mechanism of multi-party consultation and negotiation, supplemented by fundamental rights, judicial arbitration, and third-party professional assessment [
30,
31,
32]. The value-added income of land is the result of the joint action of investment, use, supply, and demand factors.
The “contribution-risk” method embodies the interests, contributions and risks of the state, the collective, and farmers, respectively [
33]. To ensure the rights and interests of farmers who had lost their land, 40% of the optimal market price of the relevant land is adopted as concomitant compensation [
34,
35]. Given the dynamic nature of locations’ conditions, infrastructure, and public service levels, the land tax system was improved and tax rules adapted to provide a guarantee for the rationalization and equitization of land income distribution [
36]. The distribution of land value-added income differs from region to region. The following positive developments occurred from 2016 to 2020: the degree of equality among the subjects of distribution was reduced, the distribution gap among the stakeholders in the eastern region was narrowed, the income distribution gap between the central and western regions was enlarged, and the level of social welfare was improved (more so in the eastern region than in the west) [
37].
The Central Office and the State Office issued a policy paper titled “Opinions on adjusting and improving the scope of land transfer income to give priority to supporting rural revitalization” in September 2020. The aim of the policy paper is to generate capital investment for rural revitalization and the cultivation of sustainable endogenous rural development. It proposes that, taking the provincial-level administrative divisions (provinces, autonomous regions, municipalities, and special administrative regions) as the measurement unit, the proportion of land transfer income to agriculture and rural areas should be more than 50%, or that it should amount to at least 10% by the end of the 14th five-year plan period. That is, the state began to implement a “land finance” policy that addresses rural and agricultural development.
Internationally, there are also practices of many other governments’ financial support for rural revitalization. For example, the US government has continuously improved the policy system and adjusted the structure of agricultural development, established a relatively perfect policy system of financial support for rural and agricultural development, and promoted rural construction [
38,
39]. Germany promotes the development of rural industry and commerce through the integration of traditional and modern innovation and the increase of diversified industrial structure models [
40]. France promotes the transformation of agriculture to specialization through fiscal expenditure, and promotes rural construction by revitalizing agriculture through science and technology [
41]. Because of its special national conditions, China supports rural development according to the land transfer income with local characteristics.
It is against this background that this study analyzed 31 provincial-level administrative divisions (PLADs) and constructed a plan to resolve those potential obstacles. It provides a theoretical starting point for effectively resolving the obstacles related to land transfer income to support rural revitalization and has practical reference value for PLADs, and to formulate more targeted policies to ensure that income derived from land transfers supports rural revitalization.
2. Materials and Methods
2.1. Data Sources
The data for this study were mainly obtained from the China Statistical Yearbooks from 2002 to 2018, the China Land and Resources Statistical Yearbook, and the Main Data Bulletin of the Third National Agricultural Census. The said data included land transfer data, local financial data, rural population data, and industrial output data. The Statistical Yearbook of China’s Land and Resources was only issued until 2018; therefore, the data in this study are only until 31 December 2017.
2.2. Study Scope
The scope of this study encompasses 31 PLADs in China. In the People’s Republic of China, PLADs form the highest level of administrative divisions under the Central People’s Government, including 23 provinces, five autonomous regions, four municipalities (directly under the Central Government), and two special administrative regions, amounting to 34 PLADs. The scope of this study does not include the two special administrative regions or Taiwan Province. China has developed special national conditions under the “one country, two systems” approach, the latter being the basic national policy put forward by the Chinese Government to realize the peaceful reunification of the country. According to Deng Xiaoping’s exposition, “one country, two systems” means that under the aegis of one China, the main body of the state adheres to the socialist system, while Hong Kong, Macao, and Taiwan retain the original capitalist system. In view of the fact that the land-related policies and systems of the latter three are different from those of China’s other provinces, there is a dearth of data on them; therefore, they were not included in the scope of this study. The obtained data are, therefore, only from 22 provinces, five autonomous regions, and four municipalities.
2.3. Research Methodology
(1) The entropy method was used to calculate the weight of each potential obstacle factor. According to the weight of factors at three levels in
Table 1, they are divided into “+” and “−“ directions according to the impact of each such impediment. The “+” direction means a higher value of obstacle factors. The entropy method is an objective weighting method, which determines weights according to the information provided by the values of various factors. This allows the researcher to avoid the subjectivity of artificial weighting and the overlap of multivariable information. The calculation process is as follows:
- ➀
Dimensionless standardization of obstacle factors (
):
- ➁
The specific gravity of after dimensionless standardization (
):
- ➂
Entropy of item j (
):
- ➃
Weight of index j (
):
In Equations (1)–(4), is the original value of the factor, i is the province (city and district) (i = 1,2,…,31), and j-j represents the indicator or index (j = 2,2,4); that is, there are two, two, and four obstacle factors within the local government, land finance, and the countryside itself, respectively: if = 0, then Rij = 0, Rij × LnRij = 0.
(2) The technique for order of preference by similarity to ideal solution (TOPSIS) sorting method was used to calculate the comprehensive obstacle degree. TOPSIS is a commonly used decision-making technique in system engineering when analyzing multi-objective decision-making. It is a method of ranking according to the proximity of a limited number of objects to the idealized target. By measuring the similarity of “positive” and “negative” ideal solutions during the period 2001–2017, the order of relative advantages and disadvantages could be determined. The equation for a weighted decision matrix and the calculation process of “positive” and “negative” ideal solutions was formulated as follows:
In Equation (5), Cij is the weighted standard value of each evaluation index, j = 1,2,…,8; i = 1,2,…,31.
The positive and negative ideal solutions were determined from the weighted sum values of eight obstacle factors in 31 PLADs. The “positive” ideal solution refers to the highest obstacle scheme and the “negative” ideal solution refers to the lowest obstacle scheme.
In Equation (6), C+ and C− are the highest obstacle scheme (positive ideal solution), and the lowest obstacle scheme (negative ideal solution), respectively.
The distances from the weighted standard value to the “positive” and “negative” ideal solution in the time series (year) was then calculated:
In Equation (7), and are the distances from the weighted standard value of each province to the “positive” and “negative” ideal solution, respectively.
The degree of obstacle and the closeness of the highest obstacle value in 31 PLADs were subsequently calculated, using the following formula:
In Equation (8), Ti is the highest obstacle value (comprehensive obstacle degree). The value range is [0,1]—the closer it is to 1, the higher the obstacle degree is.
The comprehensive obstacle degree of 31 PLADs was calculated according to Equations (5)–(8) and the logarithmic values were arranged in descending order, as shown in
Table 2.
(3) IBM’s SPSS software (the method of determining the “average connection between groups”) was used to classify the original numerical values of eight obstacle factors in 31 PLADs, as depicted in
Table 3. A significant advantage is that the maximum similarity among PLADs of the same type and the minimum similarity of PLADs within different types could be determined.
3. Results
The entropy value and weight of each obstacle factor were calculated according to Equations (1)–(4) (
Table 1).
The weighted sums of potential impediments to rural revitalization are shown in
Table 3.
According to the classification of obstacle degree and the order of function degree at each level, the comprehensive obstacle degree of 31 PLADs in
Table 3 shows that the overall difference, from the highest value of Chongqing (0.579) to the lowest value of Hainan (0.407), was not significant because the three levels of obstacles were different. Even if the comprehensive obstacle degree of the PLADs were similar, there still were differences in the influence of three or eight obstacle factors on the comprehensive obstacle degree. The comprehensive obstacle degree was divided into three sections: high (>0.535), which included nine PLADs of Chongqing and Tianjin; medium (0.465–0.535), which included 14 PLADs of Ningxia, Yunnan, and Ningxia; and low (<0.465), which included eight PLADs of Hainan and Xinjiang (
Table 2). Classes V and VI’s clustering results are shown
Table 4.
Table 4 indicates that, in the results of Classes V and VI, Jiangsu and Zhejiang were always similar, as were Beijing and Shanghai. The difference between the two classifications is that Tianjin, Guangdong, Fujian, Shandong, Chongqing, and Anhui were separated from Class V and became the third category in Class VI. Class VI reflected that the change of the obstacle degree of land transfer income supporting rural revitalization was related to the level of economic and social development and location. For example, with the exception of Hubei, Classes V and VI were all underdeveloped PLADs, such as the three PLADs in Northeast China, Inner Mongolia, and Guizhou in the southwest.
The PLADs with high, medium, and low comprehensive obstacles were subdivided into two, four, and three types, respectively (
Table 3). The results coincided with the cluster analysis in
Table 4, which showed that the classification of obstacles in 31 PLADs to support rural revitalization was reasonable, with Shanghai, Beijing, Jilin, and Liaoning being cases in point. Zhejiang and Jiangsu were alike.
The following five countermeasures were arrived at:
(1) Optimize the performance evaluation system to encourage and restrain the income from land sales to support rural revitalization. Table 6 shows that the “proportion of cities and towns in fiscal expenditure” in 31 PLADs was more than 85%. Jiangsu, Zhejiang, and the other nine provinces exceeded 90%, and 13 PLADs, such as Shandong and Anhui, ranked among the top three in the weighted sum of “proportion of cities and towns in fiscal expenditure,” as shown in
Table 3.
The reason was that the performance evaluation system encouraged local fiscal expenditures to be biased toward cities and towns to obtain political benefits. Therefore, all PLADs quantified the achievements of rural revitalization on the local government performance evaluation system to encourage local governments to gradually balance their financial expenditure between cities and rural areas. The income derived from the transfers of agricultural land, in particular, had sufficient endogenous power to support rural revitalization to the extent of solving the dependence of local financial expenditure on urban construction and promoting economic growth.
(2) Perfecting the tax-sharing system to balance the local government’s administrative and financial powers. Only eight PLADs’ income from land transfers could exceed the local fiscal deficits, such as Jiangsu and Zhejiang, as shown in Table 6. In the weighted sum value of obstacle factors of 25 PLADs, “land transfer income to make up for the fiscal deficit” ranked first in 23 of them, Jiangsu and Zhejiang being the only exceptions. It follows that the financial and administrative powers the PLADs are given on the national level should be reasonably divided to balance the financial revenue and power and to promote payments from the central finance for the provision of basic public services in underdeveloped PLADs. The PLADs’ governments should be given the authority to borrow money in accordance with the law and to implement a debt management policy, a risk liability system, introduce the market-oriented operation of infrastructure funds, build-operate-transfer (BOT), public-private partnership (PPP), and other financing models.
(3) To construct the land financial model in such a way as to ensure a sustainable supply of land and money.
Table 2 shows that the “land finance” of seven provinces, such as Tibet and Qinghai, played the highest role in respect of their three highest-ranked obstacles, while 18 PLADs ranked toward the middle. Countermeasures PLADs could introduce to ameliorate the scarcity of arable land and reserve resources include the following: resuscitating abandoned land renovation projects, improving the efficiency of transferring rural land to the construction market, supplying land indicators for new urbanization, and continuing with providing funding.
Table 3 shows that the weighted value of “the ratio of tax to land financial funds” in 24 provinces, such as Zhejiang and Jiangsu, ranked among the top three in their own provinces. It should be endeavored to lower tax rates, for example, by widening the tax base and optimizing income from real estate tax by linking it with those levied by cities and towns. A well-considered and sustainable property tax rate can ultimately become a sustainable source of local revenue.
(4) To develop policies and facilities for the agglomeration of elements in rural areas and equality between urban and rural areas. ① Give equal rights to urban and rural construction land, improve the unification of urban and rural land markets, and restrain land expropriation by local governments. For example, Inner Mongolia, Guizhou, and the three northeastern provinces “increase[d] the per capita area of land expropriation of urban population” above 200 m2. ② The Main Data Bulletin of the Third National Agricultural Census announced that there had been 207.43 million operating agricultural households in 2016, accounting for 1.92% of the total. Therefore, through land and services to jointly promote agricultural scale operation, enhance rural industrial profits. ③ The “rural population reduction ratio” in Chongqing, Jiangsu, and the other 11 provinces was more than 30%. The weighted value of this factor in the four provinces of Jiangsu and Inner Mongolia ranked in the top 3 of the provinces. There was a need to improve the social security system to realize the “unified urban and rural” model and ensure the smooth flow of urban and rural labor. ④ Strengthen the national transfer payment system for the construction of rural basic conditions in underdeveloped areas (high II; moderate III and VI; and low I provinces, Inner Mongolia, and Shanxi), so that all areas can develop markets in the countryside. ⑤ Promote rural industry by increased resource grants and facilitate the flow of factors to rural areas that would to stimulate new industries and the manufacture of high-quality products.
(5) To highlight the countermeasures to solve the highest-ranked obstacles in PLADs. The number one obstacle factor of each PLAD should be highlighted and effectively addressed. ① The autonomous regions and municipalities that are in high class I, moderate class I and III, and low class I and II should focus on balancing the financial power of the local government. ② Tibet in the high II category; Yunnan, Guizhou, Gansu in the moderate VI category; and Jiangsu and Zhejiang in the low III category should increase the proportional contribution of land and real estate-related taxes. ③ Qinghai in the high II category and Ningxia in the moderate VI category should increase the proportion of auctions and agreements in the supply of state-owned construction land. ④ Guangdong, Beijing, and Shanghai in the moderate II category should increase the proportion of financial expenditures spent in agricultural and rural areas.
4. Discussion
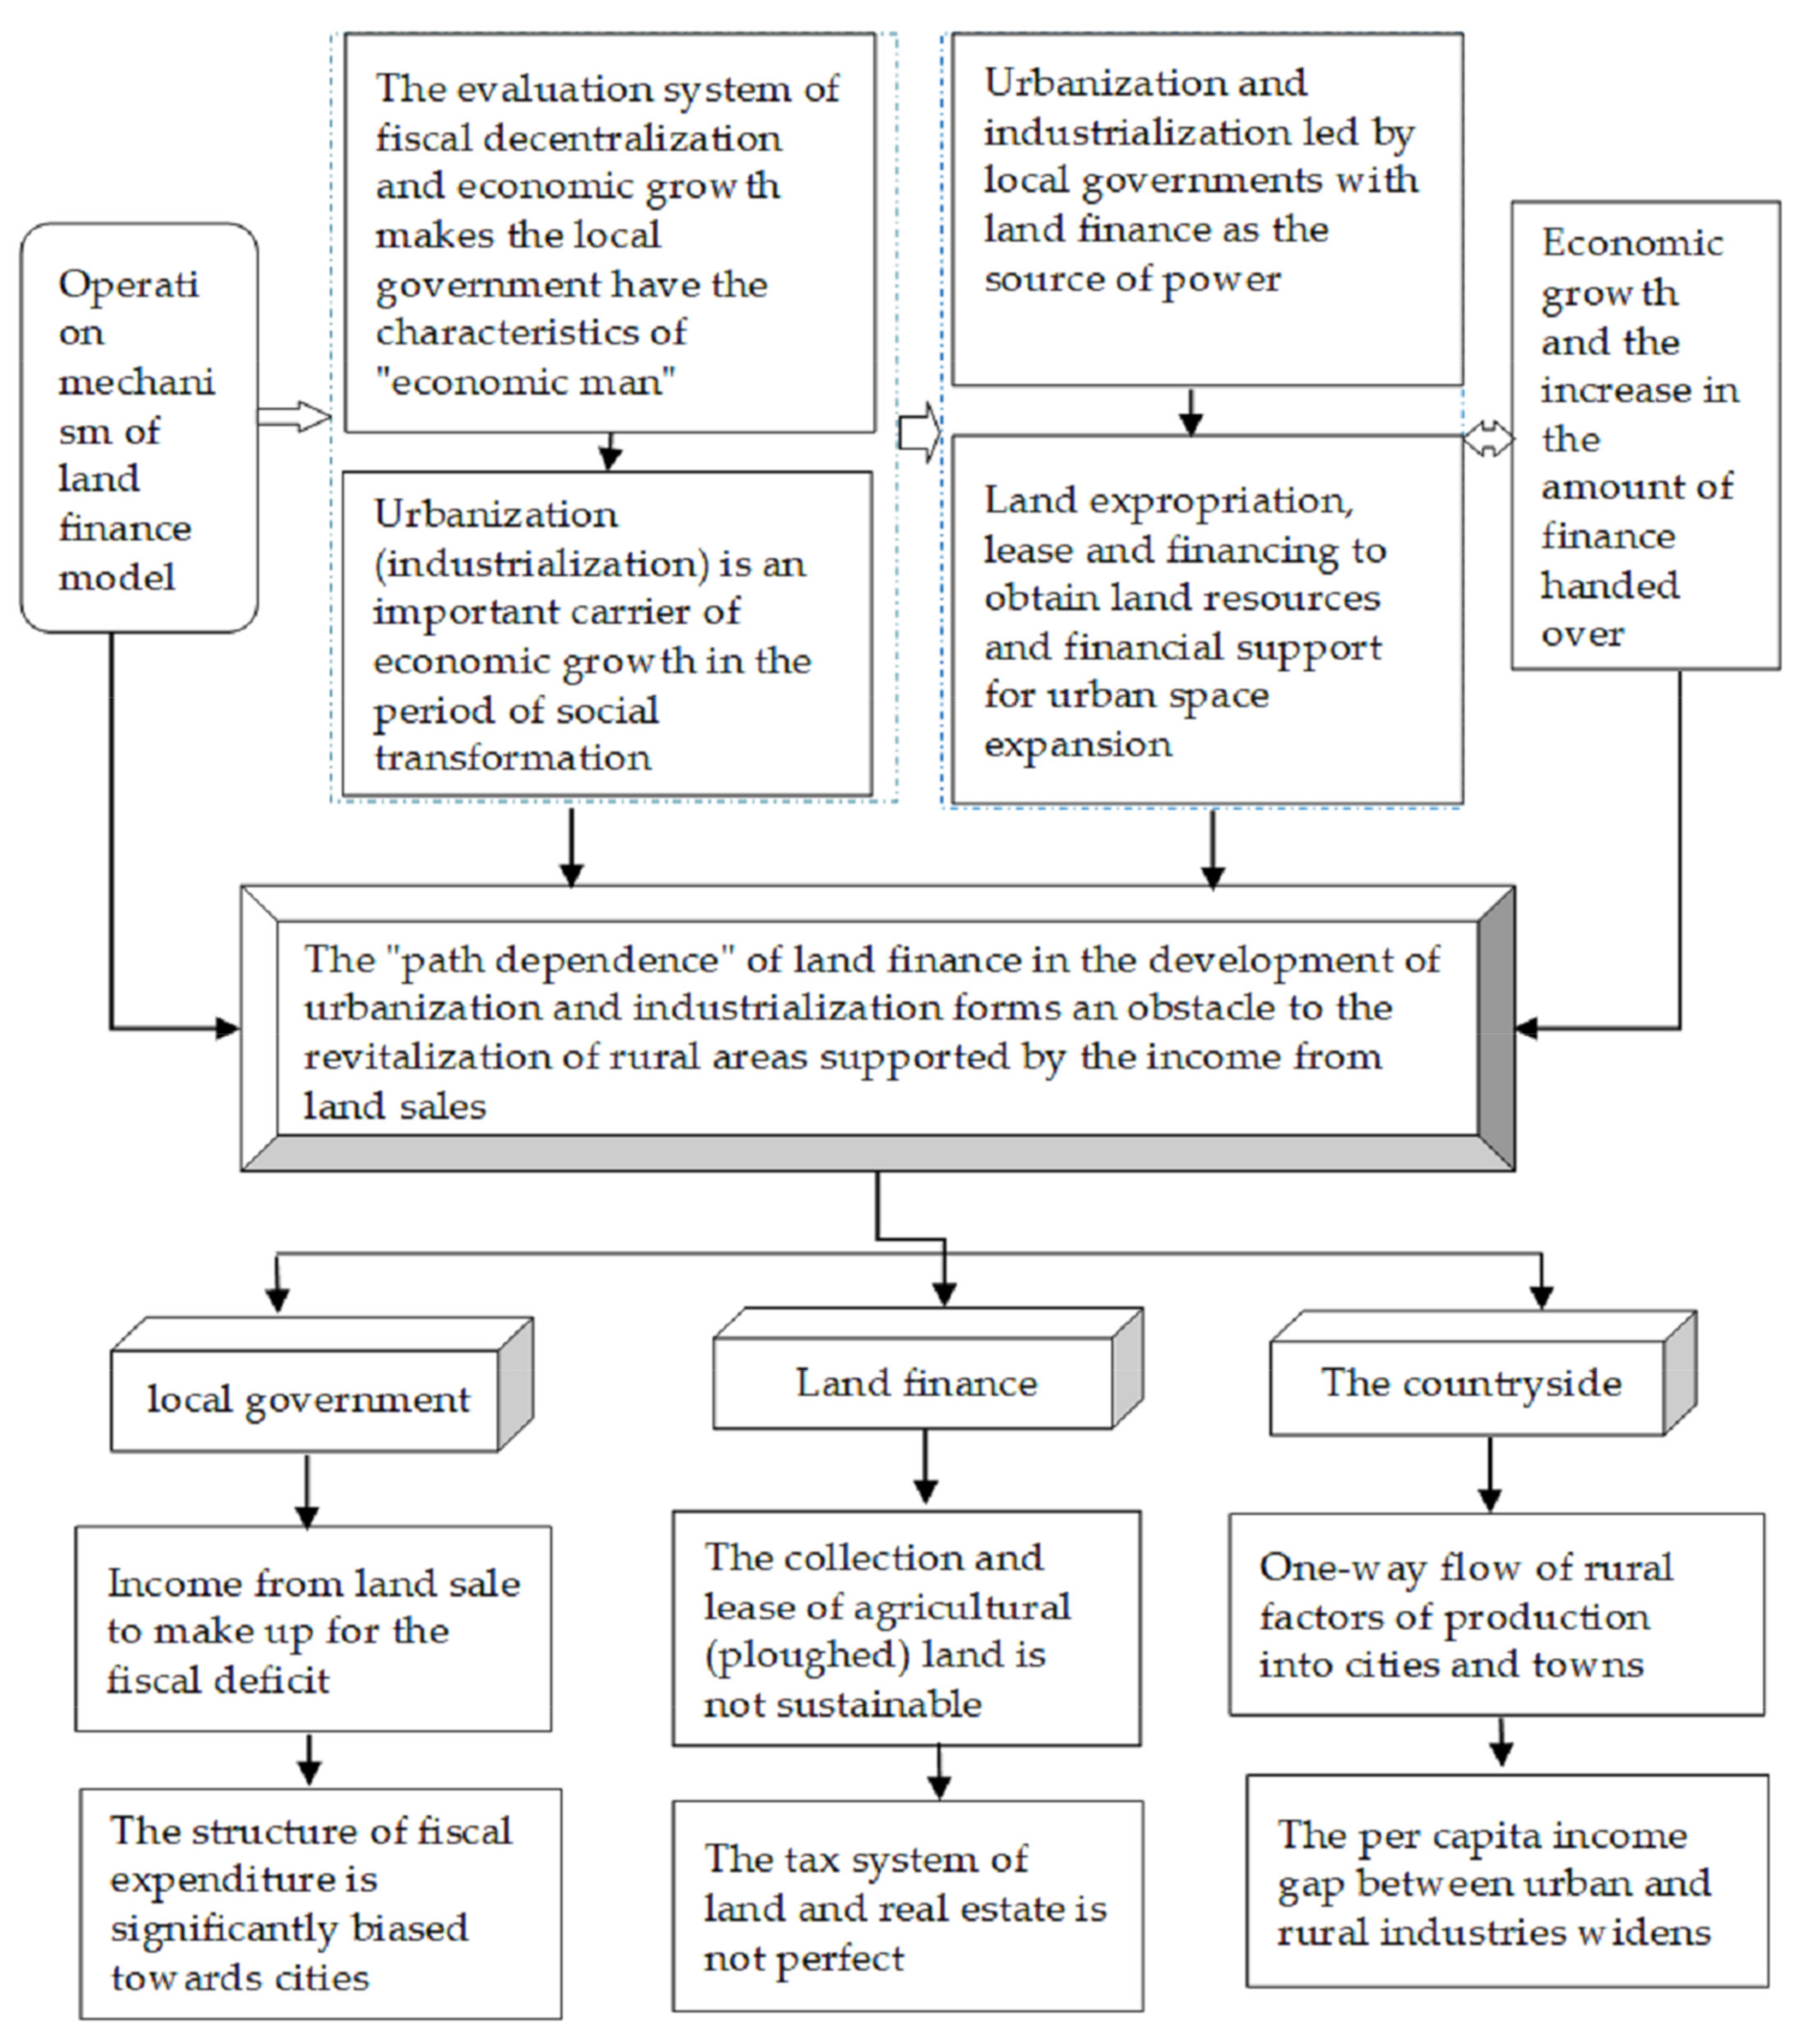
During the period of social transformation, the Party and the State established the basic line of “taking economic construction as the center,” and implemented a decentralized financial system and a performance evaluation system based on economic growth, which resulted in local governments displaying “economic man” behavior. Local governments were entrusted with the development of urbanization and industrialization to promote the economic growth of their area of jurisdiction, with their core behavior mode being urban management. Their powers included land expropriation, leases, and mortgage financing to obtain land and funding for infrastructure and urban space expansion, which effectively promoted urban economic growth and political performance benefits.
The formation of a reciprocating economic and social development model and successive governments’ deep-seated dependence on land finance directly or indirectly contributed to the obstacle factors faced by local governments in their pursuit of revitalizing income from the transfer of rural land and its mechanical operation framework, as shown in
Figure 1. The state’s “opinions on adjusting and improving the scope of land transfer income to give priority to supporting rural revitalization” involved three main elements: local government, land transfer income, and rural revitalization. The relationship between the three can be depicted as follows:
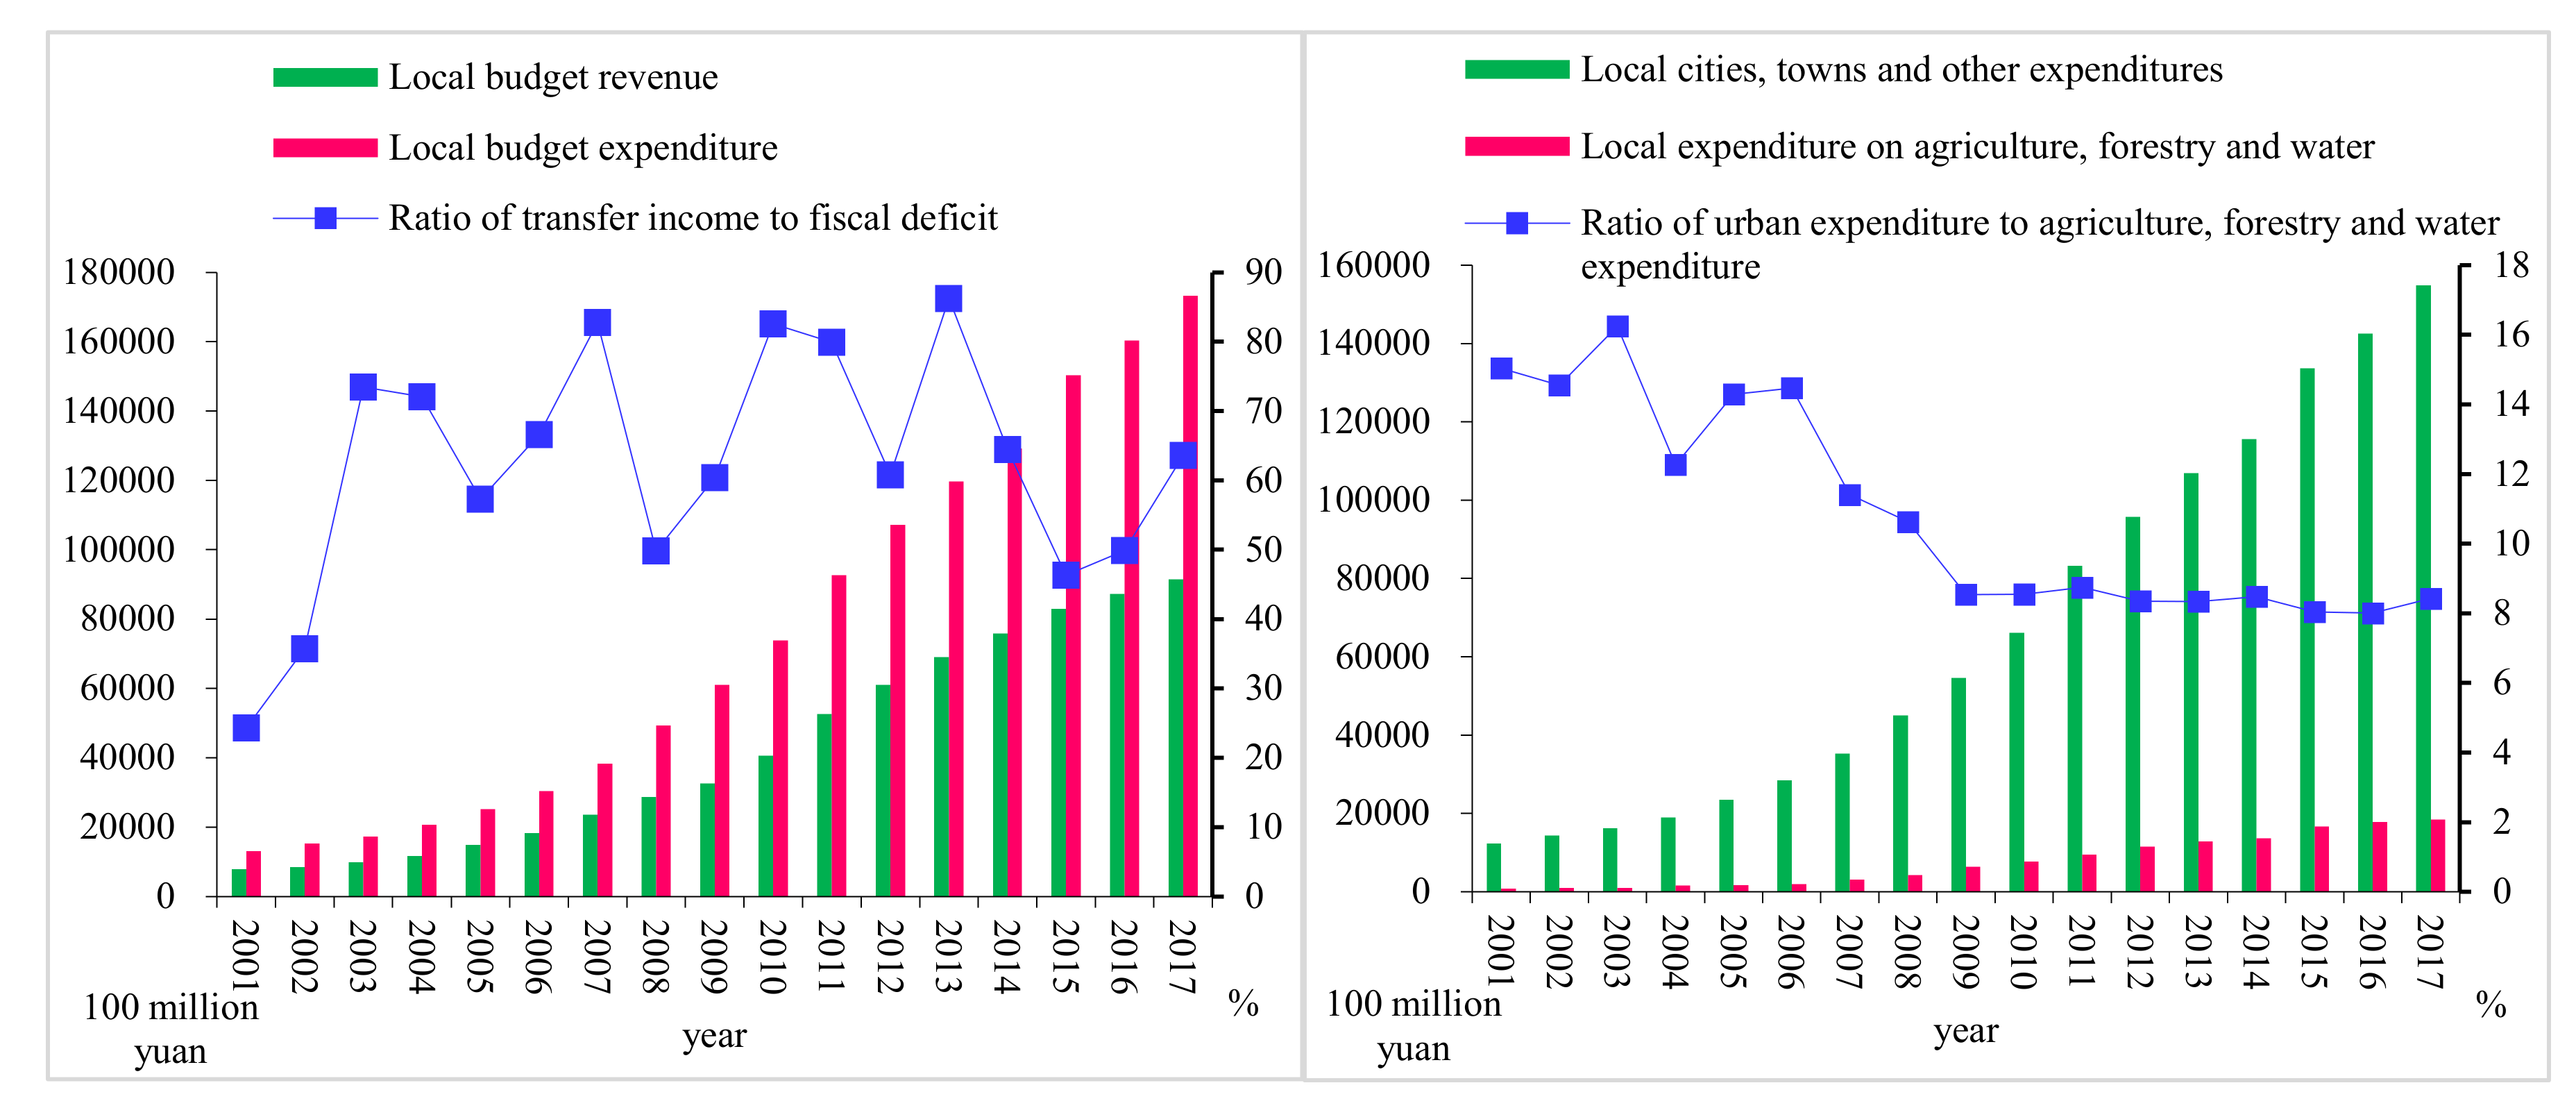
(1) The income from land transfer made up for the fiscal deficit. The tax-sharing system produced a clear deficit, and the land transfer revenue played an important role in reducing the budget deficit. Revenue from land transfers as a proportion of local fiscal deficit showed a fluctuating upward trend from 2001 to 2017, with a high of 86.2% in 2013 (
Figure 2, left-hand graph). Local budget revenue and expenditures totaled 71.67114 trillion yuan (USD 11.2531 trillion) and 127.71339 trillion yuan (USD 20 trillion), respectively, over those 17 years, with a total deficit of 56.04225 trillion yuan (USD 8.7992 trillion). Land transfer revenue totaled 35,458.63 billion yuan (USD 5567.38 billion), accounting for 63.3% of the local budget. Therefore, the financial pressure that resulted if the revenue did not match the expenditure and the land transfer revenue could not make up for the local government’s fiscal deficit; it became an obstacle to the local government’s intent to finance rural revitalization with income from land transfers.
(2) The structure of fiscal expenditure is significantly biased toward cities. Various industries in cities and towns are the focus of local expenditure, and the scale of cities and towns’ expenditures on agriculture, forestry, and water had consistently increased from 2001 to 2017. The proportion of expenditure increased from 6.2% in 2001 to 10.5% in 2009, and the value appeared to have stabilized at 10% over the following eight years, as shown in
Figure 2 (right-hand graph). The reason was that, due to China’s dual development pattern of urban and rural areas and the tax-sharing financial system, urbanization is an important carrier of the country’s economic growth. The “promotion incentive mechanism” was centered on economic growth and drove local governments to adopt the expenditure strategy of emphasizing urban infrastructure construction, and neglecting basic public services in rural areas.
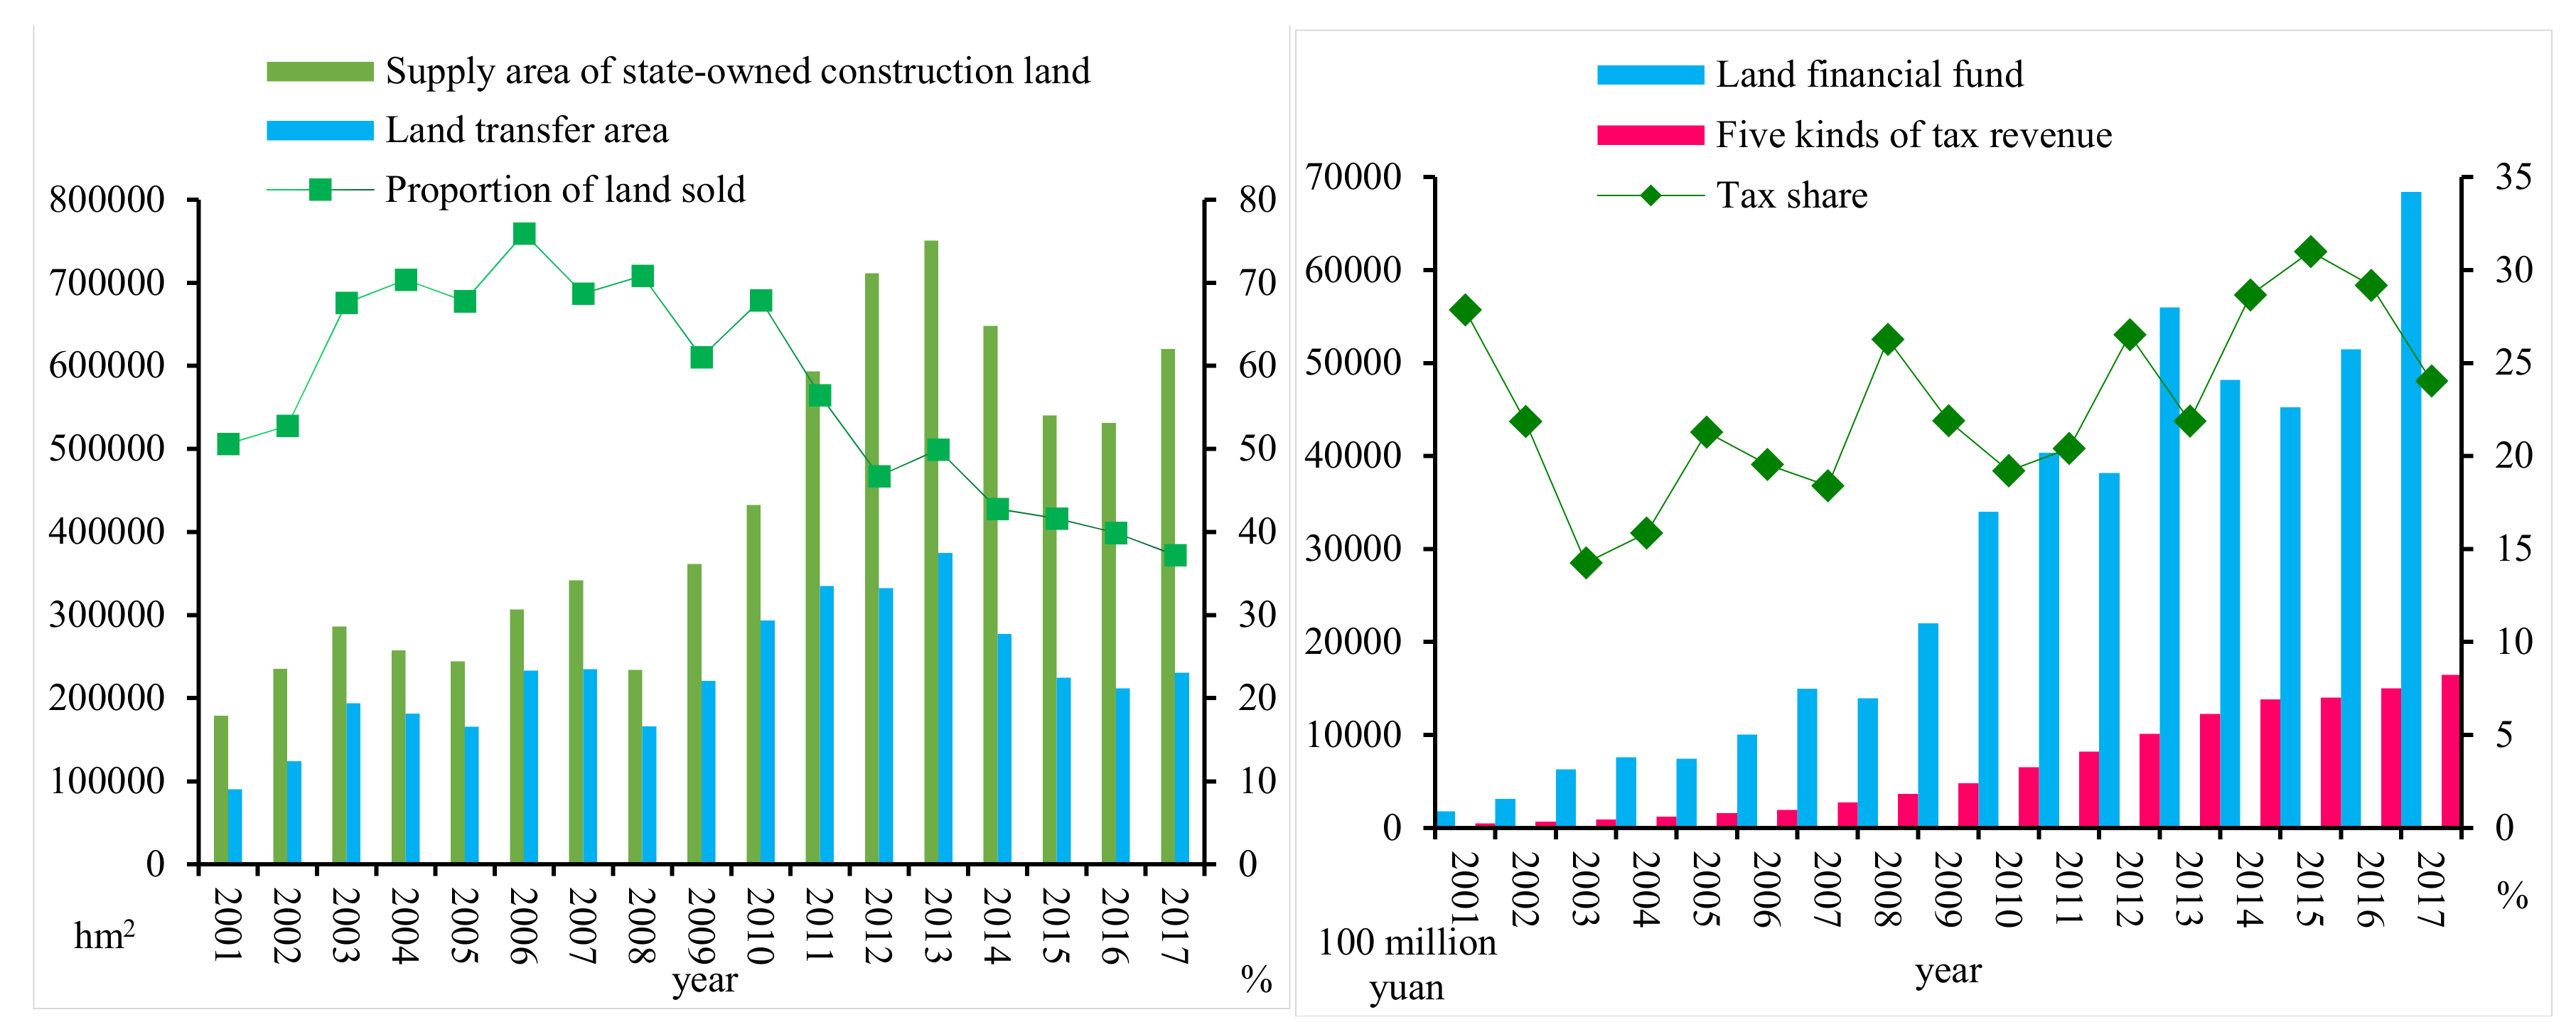
(3) The expropriation and lease of agricultural (cultivated) land are not sustainable. The China Statistical Yearbook shows that the area of cultivated land in 2017 was 134.9 million hm
2, which was 4.86 million hm
2 more than in 2000. Assuming that 7.275 million hm
2 of the total supply area of state-owned construction land from 2001 to 2017 came from cultivated land as shown in
Figure 3 (left-hand graph), it meant that 12.135 million hm
2 of cultivated land had been developed in 17 years. The highest annual figure of 751,000 hm
2 recorded in 2013 suggests that 12.9 million hm
2 of the existing arable land relative to the 1.8 billion hm
2 red line would be consumed by 2034. Likewise, the proportion of the total supply area of state-owned construction land decreased from 75.9% in 2006 to 37.2% in 2017, indicating that more state-owned construction land had been “allocated” to public welfare undertakings. The decline in the matter of state-owned construction land and land transfer began in 2014, which had led to a reduction in land financial funds, as shown in
Figure 3 (right-hand graph). Therefore, the unsustainability of “land expropriation and leasing” has become a potential obstacle to supporting rural revitalization.
(4) The tax system related to land and real estate is imperfect. To date, foreign mainstream land income levies taxes on land retention and transfer, which was the main source of local finance [
42]; it played a positive role in controlling the speculative bubble of real estate and the rapid rise of housing prices [
43], and it was an effective policy to restrain urban expansion and drive the intensive use of urban land [
44]. From 2001 to 2017, the total scale of land financial funds (land transfer income, cultivated land occupation tax, property tax, deed tax, urban land use tax, and land value-added tax), and the proportion of five kinds of taxes in the 31 PLADs during that period ranged between 14% and 31%, as shown in
Figure 3 (right-hand graph). The total scale of land finance was 46.90763 trillion yuan, of which tax revenue was 11.449 trillion yuan, accounting for 25% of the former. Most PLADs had not instituted a property tax on holding links yet, and supporting rural revitalization made it difficult for local governments to reduce land sales income by 10% through land and property taxes. Therefore, the incomplete and underdeveloped land and real estate tax system indirectly formed a potential obstacle to land transfer income that could support rural revitalization.
(5) One-way flow of rural factors of production into cities and towns. The separation of agricultural and rural development from urban and rural development was formed under the auspices of the urban–rural dual economic structure system. This system resulted in the isolation of agricultural and rural development from industrialization and urban development, with the most important factors of production, such as land, labor, and capital, having flowed to industries in cities and towns. The collective ownership of rural land belongs to the national ownership of urban land, and several land resources needed for industrialization and urbanization were requisitioned from rural land. For example, the area of land expropriated from 2001 to 2017 was 45,067.0 km
2, as shown in
Table 5. Concerning population, many surplus rural working people went to the cities to find employment. The state’s “opinions on promoting the Reform of the Household Registration Management system in small towns” (2001) stipulates that planned target management would no longer be implemented for those who applied for permanent residence in small towns. The rural population had decreased at an average annual rate of about 13 million from 2001 to 2017, and the proportion of people employed in the primary industrial sector had dropped from 50% in 2001 to 27% in 2017 (
Table 5).
Having combined the changes of obstacle factors at the national level in
Figure 1,
Figure 2 and
Figure 3 and
Table 5, we constructed a system of potential obstacle factors of 31 PLADs, covering 2001 to 2017, that supported rural revitalization, as shown in
Table 6. The specific meaning of each obstacle factor and the basic law of inter-provincial differences are as follows:
(1) At the level of the government. ① The ratio of land transfer income to the deficit: it reflects the compensation degree of land transfer income to the local fiscal deficit—the smaller the ratio is, the weaker the compensation effect, and the greater the obstacle for local governments to use land transfer income to support rural revitalization. The basic conclusion was that the ratio of land transfer income to deficit showed a regional law that converged with the level of economic and social development. ② The proportion of fiscal expenditures in cities and towns: the greater the value, the greater the proportion of urban expenditure. The path-dependence effect of promoting urban economic growth and obtaining political performance benefits made it more difficult for local governments to support rural revitalization with land transfer income. The value also reflects the regional law of convergence with the level of economic and social development.
(2) Land finance. ① The ratio of transfer of the total supply area of state-owned construction land. When measuring the sustainable degree of collection, expropriation and lease of agricultural land, the ratio of economically developed PLADs was found to be higher, while those of less developed PLADs were lower, which indicated that the urban infrastructure of developed PLADs had been improved. Payment by money transfer was mostly used in the supply of state-owned construction land, but to improve urban infrastructure, the supply of state-owned construction land in underdeveloped PLADs was more in the way of allocations. Given the limitations of cultivated land and reserve resources, the smaller the proportion of land transfer was to the total area of state-owned construction land, the greater the obstacle to land transfer income to support rural revitalization would become. ② The ratio of tax to land financial funds. The smaller the value was, the less the land and real estate tax revenue was relative to the land transfer income. In addition, the reduced land sales revenue from local government support for rural revitalization could not be effectively compensated for by land and property taxation, and the resulting obstacles were even higher. The value did not change with a change in the region’s law or rules. This presented a great obstacle, as there was no obvious regional rule for the value.
(3) The countryside itself. ① Increase the per capita area of land expropriation of urban population. The greater the value, the faster the speed of land urbanization, compared with population urbanization. This was caused by inter alia the low cost of rural labor and the large number of laborers flowing from rural areas to towns and their industrial parks, resulting in a higher degree of obstacles. The value showed the regional law as opposed to the level of economic and social development. ② Ratio of rural population reduction. The greater the value, the greater the relative reduction of the rural population, and the greater the obstacle to the income from land sales to support rural revitalization. There was no obvious regional law for this value, i.e., the size of this value did not change if there were a change in the region’s laws. ③ The per capita income gap between urban and rural areas in 2017. The greater the value, the greater the per capita income gap between urban and rural areas, and the greater the obstacle. ④ The gap in per capita industrial output value between urban and rural areas in 2017. The greater the value, the greater the gap between urban per capita secondary and tertiary industrial output value and rural per capita primary industrial output value. The numerical values of the above two obstacle factors basically showed the regional law of convergence as it pertains to economic and social development.
5. Conclusions
The research content of this paper was mainly developed from the unique research background of rural revitalization in China, and on the basis of China’s unique national conditions. Obstacles that might arise in the process of implementation of the existing policy guidance were examined to clarify their mechanisms and degrees of action. For China, the revenue obtained from land in the past tended to be used for urban development, and the total expenditure was not small, while the funds for rural development were very limited indeed. That situation gave full play to the advantages of China’s concentration of efforts to do great things, and Chinese cities have been able to develop rapidly, which had made a great contribution to China’s modernization. Yet, at the same time, it had also led to slow rural development and multiple problems in rural areas. The latter problem needs to be solved urgently, and the solution is to return to rural revitalization. The purpose of this study was to analyze the possible obstacles in the process of rural development and lay the groundwork for the actual situation. At the same time, for the world, rural revitalization is the theme that many countries pay close attention to, and because the conditions of each country are different, the sources of funds, the use of funds and specific paths for rural revitalization are different as well. However, in general, the source of funding is national finance, and other sources of land tax or rent. The money obtained from the sale of land has a public attribute, and it is understandable that this funding supports the revitalization of the countryside. As for how to make better use of the money obtained from land, it is the researcher’s opinion that China’s approach provides a possible reference for other countries and opens up new ideas for rural revitalization. According to the research of this paper, and at the same time draw lessons from the typical cases of domestic and foreign financial support for rural revitalization, such as the specific practices of the United States, Britain and France to support rural construction. This article provides some reference opinions on domestic and foreign financial support for rural development.
For China, possible policies are as follows. 1. Improve the legal and regulatory system for the rural revitalization of fiscal expenditures. Although the existing policy guidance points out specific expenditure guidance, in the process of a specific implementation, according to the obstacles that may be encountered, the support of rural revitalization by land transfer income still lacks clear laws and regulations to constrain it. In order to ensure the clear implementation of rural revitalization by land transfer income, relevant laws and regulations shall be improved and promulgated, and guiding policies shall be clearly defined, providing an in-depth education to grassroots organizations that have little knowledge of policies and regulations. 2. Since the Chinese Constitution stipulates a unitary framework for the relationship between the central and local governments, that is, centralized power, sovereign power is held by a single state agency, and local governments need to act in accordance with the will of the central government. There is a lot of information opacity between the central and local governments. Especially for village-level organizations in China, there are shortcomings such as opaque financial management expenditures. The part of the funds that are spent on rural construction and development needs to be used reasonably, and the local government needs to strengthen the clarification of the use of funds, not only knowing how much to use but also knowing where to use it according to the gap between local and policy requirements, establishing a reasonable and appropriate mechanism to ensure the smooth implementation of funds. For example, the effectiveness of rural construction is regularly inspected. Not only that, in order to reasonably use a variety of supervision to monitor the flow of funds to the village government, it is suggested here that a combination of new media supervision and mass supervision can be used to ensure that the use of funds is reasonable and efficient. 3. Increase the driving force of government officials to support rural revitalization funds. In the past, behaviors with performance appraisal as an incentive mechanism and economic-centered policy propositions tended to make certain achievements in industrialization and urbanization for government officials. As a result, government officials tend to prefer towns to villages when making decisions about fiscal spending. Now, in order to make the funding channels for rural revitalization go smoothly, it is necessary to appropriately transform the policy leadership and encourage local government officials to shift the focus of development to the countryside. The current urbanization is too saturated. The way to solve the problems of over-urbanization and alleviate various types of rural areas is rural revitalization. 4. Grasp the implementation approach of differentiated policies. Our research has identified barriers and differences in barriers to land grant revenue supporting rural revitalization across provinces. Therefore, for each region, the specific implementation of the policy should be adapted to local conditions. According to the types of areas with high, medium and low barriers, and considering the local development during the specific implementation process, it is necessary to know where the barriers are high, where to start, and how to make the implementation path smoother. For example, in some developed regions, the barriers are low, due to their high degree of modernization, the ratio of land transfer income to the deficit is high, and the overall level of support for agriculture is higher than that of underdeveloped regions. This is largely due to the extremely high level of urbanization. The main source of support for economic development in developed regions is not land finance, but other local tax revenues. Due to the spillover of economic development, the overall situation of rural development in these regions is better than that in other regions. Therefore, for these areas, the land transfer income and expenditure should be inclined to the weak areas of rural development or consider how suitable areas in rural areas can be connected to urban development while retaining their own characteristics.
Many developed countries abroad, such as the United States, Japan, France, etc., have an earlier history of rural revitalization due to their earlier modernization time. Many of their practices and experiences are of great inspiration to China and other agricultural developing countries. The research topic of this paper is briefly summarized. 1. Support agricultural and rural development projects. According to the different development conditions of each country, this part of the funds should be used for ecological construction, infrastructure construction, rural customs and civilization investment or basic farmland protection and other investment in rural development projects that should be focused and selected according to the actual situation. 2. Improve the agricultural subsidy policy. In the process of rural revitalization, agriculture has always been the top priority that cannot be ignored. Agriculture involves food security, and food security is the lifeblood of a country. Conditional large agricultural countries should pay attention to basic agricultural conditions according to their own development conditions, and improve subsidy policies suitable for agriculture. 3. Innovate the source of investment funds. Due to its different national conditions and systems, each country has different sources of funds to support rural development, innovatively seek new sources of funds from the original sources of funds, and invest reasonably in local rural development. 4. Strengthen the integration and management of financial support for agriculture. There may be different sources and channels of financial support for agriculture, and there is a lack of unified management of funds. Each country can set up special offices of relevant departments or other public welfare organizations according to specific systems to manage the sources and use channels of local funds, so as to make expenditures more affordable. Use is clearly documented.
In short, countries do not necessarily copy the existing experience, but extract useful enlightenment for agricultural developing countries from these existing experience models. It can also be traced back to other types of obstacles generated in the process of financial support for rural development, so that obstacles can be solved purposefully and rural construction can be carried out more smoothly.


