Communication

Allometric Models for Estimating the Height of Robinia pseudoacacia L. in Restoration Plantations

by
Dimitrios Manolopoulos
1,
Konstantinos Vasileioris
1,
Elias Milios
1,
Kyriaki Kitikidou
1,*,
Gavriil Spyroglou
2 and
Kalliopi Radoglou
1
1
Department of Forestry and Management of the Environment and Natural Resources, Democritus University, Pandazidou 193, 68200 Orestiada, Greece
2
Forest Research Institute, Hellenic Agricultural Organization DEMETER, 57006 Thessaloniki, Greece
*
Author to whom correspondence should be addressed.
Land 2022, 11(4), 471; https://doi.org/10.3390/land11040471
Submission received: 14 February 2022 / Revised: 22 March 2022 / Accepted: 23 March 2022 / Published: 25 March 2022

Abstract

:
In this study, we aimed to develop height growth models using forest data with the measured total height, bole height and diameter at breast height, targeting Robiniapseudoacacia plantations of various ages, located in restoration plantations of former mining areas of a lignite center in Northwestern Greece. To achieve this goal, 24 circular plots were randomly established in plantations of different ages. Eleven models were tested for data fit, and the selection of the models was based on three statistical criteria. The developed models revealed that black locust plantations grow well, thus being an excellent species for the restoration of former mines. There is no comparison between pre- and post-mining areas, thus site quality and other aspects are not taken into account; our models give a basis for assessments of areas affected by mining.

1. Introduction

European Union (EU) climate neutrality by 2050 is mapped out in the Green Deal policy, which is part of the EU’s long-term plan. As a cornerstone of the plan, energy transition is essential, as is cutting greenhouse gas emissions, decarbonizing the energy sector, and using carbon sequestration to offset any greenhouse gas emissions that have already been released into the environment. Renewable Energy Directive II, a component of the European Green Deal, lays forth guidelines for the EU to reach a minimum 32% proportion of renewables in final energy consumption by 2030 [1]. As an alternative to the emissions-intensive fossil fuels, forest species have long been recognized for their potential contribution to improving carbon sequestration and carbon storage [2,3]. Even though forest plantations constitute just 7% of the world’s forest area, they play a critical role in the preservation of landscape ecosystem services and contribute to landscape variety [4]. Since the Common Agricultural Policy (CAP) was adopted by EU countries in 1988, short-rotation forest plantings have been pushed as an element of the set-aside strategy to meet national and supranational objectives for climate neutrality, as well as to meet set-aside requirements under the CAP. Short-rotation forest plantations based on fast-growing tree species such aswillow, poplar and black locust are developed across Europe, providing high biomass energy and fiber outputs [5], as well as capturing carbon, thus contributing to climate change mitigation [4].
Black locust, a natural tree species of North America [6], was transported to Europe and other areas of the globe, where it grew rapidly and became a popular hardwood species, despite being a non-native species [7,8,9,10]. It is a light demanding [8,10,11] and fast-growing species [12,13]. Moreover, black locust has wood of high density, exhibits high genetic variation, while it is tolerant to drought and air pollution [11]. It is considered as an invasive species [8,10,13]; however, it has the advantage of coping with various soil conditions [9,14], and contributing to biodiversity in urban environments, agricultural landscapes and abandoned lands [9,15].Black locust may be used for timber, poles, firewood, bee-keeping, feedstock, energy plantations, wood fiber and fodder production [16,17]. It is also used for erosion control and rehabilitation of areas disturbed by mining [9,18,19,20,21,22].
In Greece, black locust is widely used in urban areas and in reforestations, in the context of restoration of intensely disturbed ecosystems, mainly as a mean of erosion control. Furthermore, there is a national program of planting trees in marginal agricultural lands where in many cases black locust is used. As a novice alien species, black locust is considered a naturalized neophyte in Greece [23]. Even so, it is regarded as an economically significant multi-purpose species, as a nitrogen-fixing species for the restoration of degraded, marginal land and surface mine reclamation, erosion prevention and control, and carbon sequestration [24]. Under the 2080/92 Regulation (Community Aid Scheme for Forestry Measures in Agriculture), landowners were obligated to plant black locust treesin order to reduce agricultural waste and improve the environment. Furthermore, the Public Power Cooperation SA, Hellas (PPC) uses black locust to rehabilitate damaged coal mine areas [25,26]. Finally, black locust has been effectively introduced to rangelands to meet the grazing animal requirement when plants become dormant in the summer [27,28,29,30]. Animals benefit from the high nutrient content of the leaves and non-woody material produced by the black locust as a meal source [31].
Plantation silvicultural parameters must be precisely measured to provide long-term environmental and economic benefits, as well as a reduction in the vulnerability of short-rotation forest plantings to risks. Short-rotation plantations typically have a known stand age, but in the field, other important factors, such as diameter at breast height and height, are taken into account in the interpretation of stem volume, growth and forest structure. As obtaining accurate measurements in the field is expensive, time-consuming and labor-intensive, it is usual practice to measure just a sample of the trees in a permanent or temporary plot [32,33,34,35,36,37].
It should be noted that not all black locust plantations are short-rotation coppices. In Hungary, the mean rotation age of black locust stands is 30 years and the main crop volume ranges between 80 and 280 m3/ha [38]. In [11,20], they refer to a biomass production of 46.2 up to 68.1 tons/ha, in biomass plantations in marginal sites of Hungary at the age of 7 years.
There is no study regarding height growth and dendrometrical characteristics of Robinia pseudoacacia plantations in Greece. Using the observed height, diameter at breast height and age data over the black locust (R. pseudoacacia) plantations in former mining regions in Greece, height growth models (height–age and height–diameter models) were constructed. For surface–mine reclamation, a precise prediction of growth amount is crucial to this research, which will provide the foundation for rational forest management plans and management skills.

2. Materials and Methods

2.1. Study Area

The trees of black locust that had been planted in order to restore the former lignite mining areas of Western Greece and were studied in the context of this research, are placed in Amyntaio (40°35′27.56″ N, 21°39′4.15″ E) and Ptolemaida (40°28′58.18″ N, 21°44′59.58″ E) [39]. The location of these two areas is shown in Figure 1. Apart from R. pseudoacacia, Spartium junceum, Cupressus sempervirens L. var. pyramidalis, C. arizonica Greene, C. sempervirens F. var. horizontalis, Pinus nigra J.F. Arnold., P. brutia Ten. and various fruit species, were used to a much lesser extent. Other forest species that have been planted sporadically are Cedrus atlantica (Endl) Manetti, Platanus orientalis L., Eleagnus angustifolia L. and Acer spp. (according to the PPC archives). The mean annual temperature is 13.1 °C, and the total annual precipitation is 448.1 mm (meteorological station of Ptolemaida) [40].

2.2. Input Data

In the study area, 24 circular plots were randomly established in plantations of different ages. The ages were determined through the counting of the number of annual growth rings in cross-sections that were taken at the base of cut trees. Three plots were established in plantations of each age. The youngest age of a plantation where plots were established was 4 years old and the oldest age was 23 years old. In the plantations of 4 and 6 years old, the established plots had a radius of 8.92 m (area of approximately 250 m2), while in the rest of the plots, the radius was 12.62 m (area of approximately 500 m2). In the plots established in the plantations of 4 and 6 years old, each tree consisted of a group of sprouts.
In each plot, the total height and the bole height (height free of branches) of each tree were measured. Moreover, the trees were classified as dominants, codominants, intermediate or suppressed [41,42].
In cases where the trees consisted of group of sprouts (plantations of 4 and 6 years old) only the tallest sprout per tree was classified in the different crown classes, and measured.
For the development of height–age models, the following variables of dominant trees were measured:
Total height of dominant trees H (m).
Bole height of dominant trees Hb (m).
Age of dominant trees t (years).
In addition to the total height, bole height was used as a dependent variable for assessing stand dynamics, because at young ages it is expected that bole height will increase the precision of the estimations [43].
For the development of height–diameter models, the following variables of dominant trees were measured:
Total height of dominant trees H (m).
Bole height of dominant trees Hb (m).
Diameter at breast height D (cm).
The same observation regarding the young stands and the height of the trunk, applies here as well.
Basic statistics for the measured variables are given in Table 1.

2.3. Fitted Models

Eleven models were tested for fitting to data (Table 2), using the SPSS statistical package [44]:

2.4. Comparison Criteria for the Fitted Models

Three of the most common comparison criteria were used for the selection of the model of best fit (Table 3) [45]:

3. Results

3.1. Height–Age Models

All models had statistically significantregression coefficients, i.e., not including zero in their confidence intervals. Based on the values for the comparison criteria, the quadratic model was selected for the estimation of both total height and bole height (Table 4, highlighted in green):
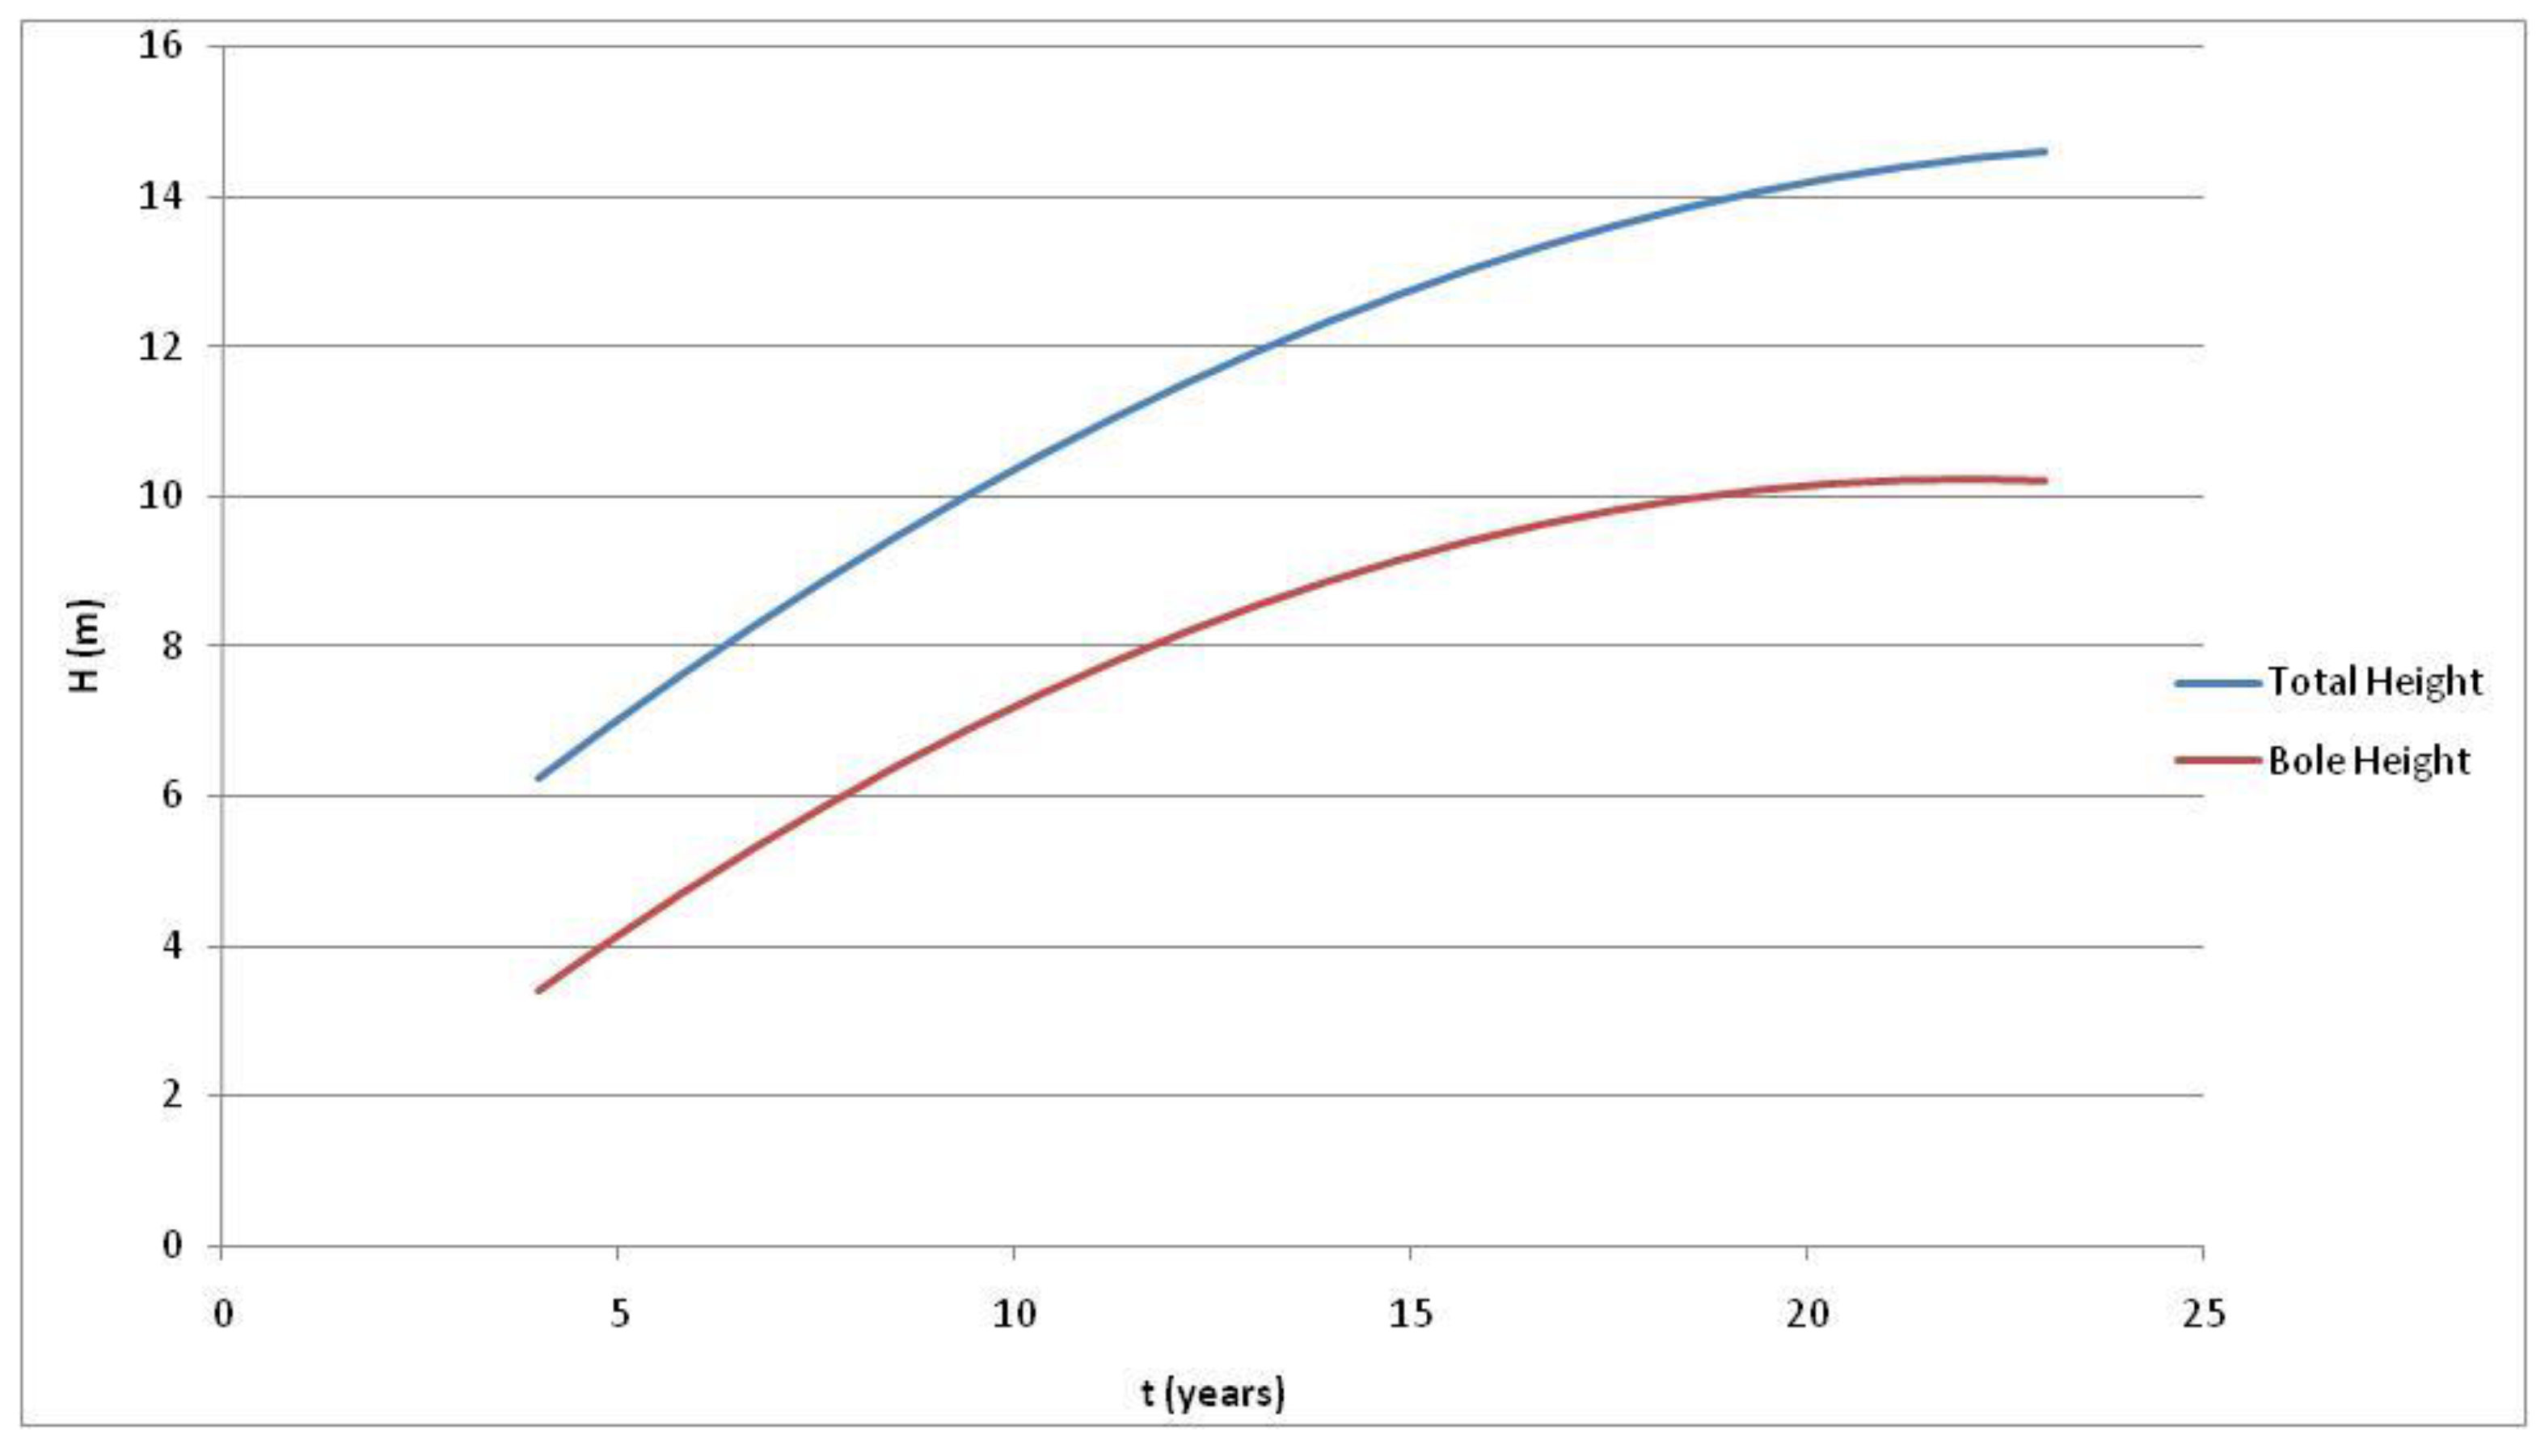
The selected models for developing the height–age curves in Figure 2, were:
H ^ = 2.736 + 0.953 t 0.019 t 2
H ^ b = 0.054 + 0.924 t 0.021 t 2

3.2. Height–Diameter Models

All models hadstatistically significant regression coefficients, i.e., not including zero in their confidence intervals. Based on the values for the comparison criteria, the quadratic model was selected for the estimation of both total height and bole height (Table 5, highlighted in green):
Regarding the selection of the quadratic model, this would lead to a parabolic curve, where the height decreases beyond a certain diameter (inflection point); this cannot represent a functional form for a height–diameter relationship. Such a curve would show a biologically illogical behavior and unreasonable estimates. This phenomenon should be considered when choosing a height–diameter model, in addition to data-related, statistical criteria [46,47]. Having this in mind, the next best fit models, i.e., the cubic model (highlighted in blue), and the S-curve model (highlighted in pink), for the estimation of the total height and bole height, respectively, are selected.
The selected models for developing the height–age curves in Figure 3, were:
H ^ = 1.989 + 2.036 D 0.078 D 2 + 0.001 D 3
H ^ b = e 2.757 7.373 D
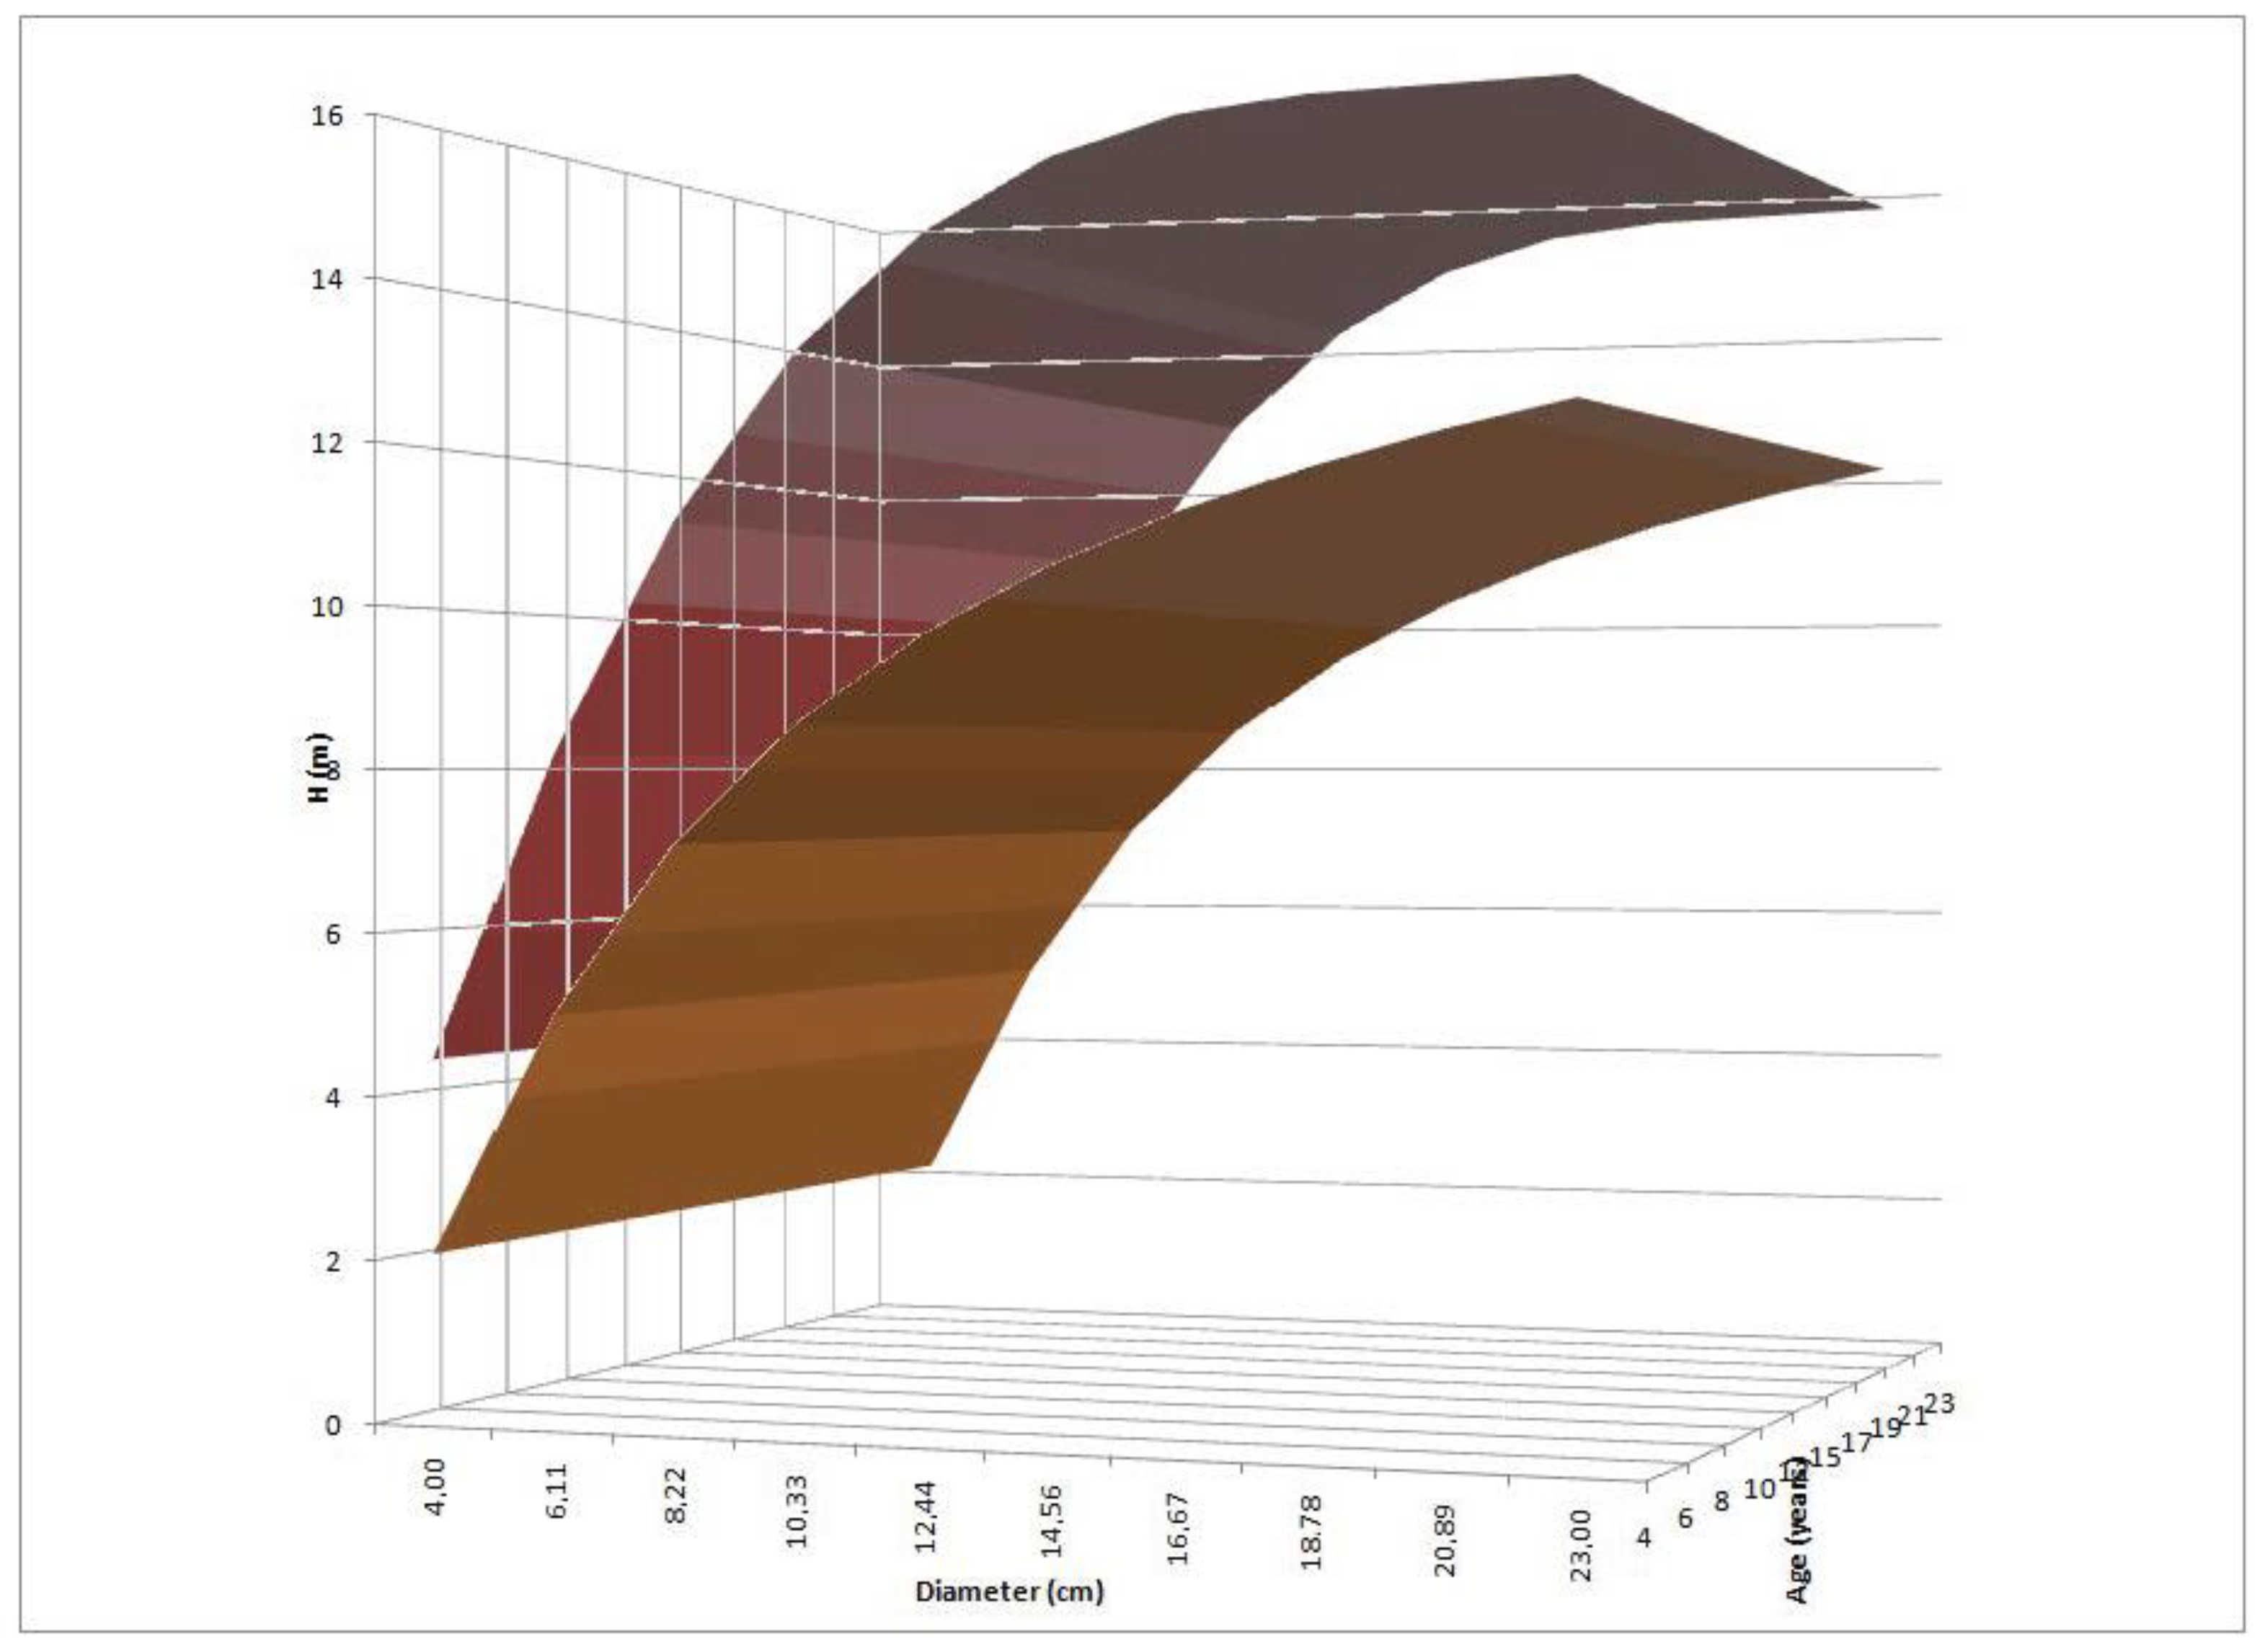
In Figure 4 and Figure 5, the selected models are illustrated in a 3D graph including all variables (total height estimations, bole height estimations, age and diameter at breast height of the sampled trees). In both cases, i.e., total height and bole height estimation via age (Figure 4), and total height and bole height estimation via diameter (Figure 5), the estimated surfaces do not intersect, indicating that total height and bole height can be estimated simultaneously via age, and via diameter. This feature of the selected models is referred to as compatibility [48]. The two compatible model systems, which are composed of H ^ and H ^ b base models (simultaneous models) are:
Model   system   1 :   { H ^ = 2.736 + 0.953 t 0.019 t 2 H ^ b = 0.054 + 0.924 t 0.021 t 2
Model   system   2 :   { H ^ = 1.989 + 2.036 D 0.078 D 2 + 0.001 D 3 H ^ b = e 2.757 7.373 D

4. Discussion

According to height growth evaluation of the black locust plantations of this study, their growth pattern is comparable to the worst sites in Hungary, as described in [38]. Specifically, the height growth of dominant trees of our study is somewhat between those of IV and V yield class [38] from [11,49,50]. We note that “yield class I” corresponds to the best potential productivity of a stand, and “yield class V” to the worst potential productivity of a stand. In Nyírség, which is one of the best growing areas for black locust in the Carpathian basin yield class, the mean height of the main stand trees at the age of 20 years is 14.7 m for yield class IV and 12 m for yield class V [49]. On the other hand, in selected cultivars in Hungary, the main stand trees have a mean height of 16 m at the age of 20 years for yield class IV and 14 m for yield class V [50].
However, the curve created in the present study, using the age and height of dominant trees as input data, cannot directly be compared with the aforementioned Hungary studies. All of them referred to the mean height of dominant and codominant trees in plantations that have been subjected to silvicultural treatments, such as tending operations, cleanings and thinning [38] from [11,49,50], where it is possible that trees with inferior height had been removed.
Nicolescu et al. (2020) [51] mentioned that dominant height in stands of black locust in Europe can outreach 20 m at the age of 20 m. Moreover, they present the minimum and maximum dominant heights in pure species stands at the age of 20 years in Romania, Belgium and France. The estimated height of the dominant trees of the present study is well above the minimum heights in Romania and Belgium. On the other hand, stands in France (Aquitaine Region) exhibit a minimum dominant height almost equal to the height estimated from our model for the age of 20 years.
The course of age–total height curve of the dominant trees in the studied plantations is impressive, if we consider that these plantations were established in deposits from lignite mining. The deposits are not considered as uniform and high differences in site productivity among them were expected. However, the selected age–total height model exhibits a very good fit with high coefficient of determination (R2 = 0.85).
Using the bole height instead of total height as a dependent variable did not improve the estimates as expected [43], since in young stands estimates of bole height using age are better than those of total height (Table 4 and Table 5). There are some factors which could explain not only the absence of improvement of estimates in bole height but the observed deterioration in the coefficient of determination from age–total height to age–bole height model (Table 4). First of all, the older black locust plantations seem to be mature enough that the base of the tree crown no longer rises (see Figure 2). So, our models not only refer to young stands; moreover, the bole height is strongly influenced by the light availability inside the plantations, since low light leads to self-pruning [41,52]. The light availability in the plantations is strongly related to their density. In the studied plantations, the planting spacing was variable in different plantation ages. The plantation density range where the data were collected was 1113–3947 (living trees)/ha. That, in combination with the fact that no silvicultural treatment took place in the plantation, led to the conclusion that the variability of light conditions was very high in the areas where the measured black locust trees grew. Thus, the coefficient of determination (R2 = 0.76) of the selected age–bole height model was lower than that of the selected age–total height model. However, it is still high.
In the case of diameter–total height and diameter–bole height selected models the coefficients of determination (R2 = 0.68 and R2 = 0.65, respectively) were lower than those of age–height selected models, but they are satisfactory and acceptable. In fact, they are high for diameter–height models developed for plantations of various densities (see above). The tree density (competition conditions) strongly affects diameter growth, while height growth is, to some extent, independent of stand density [41].
Spyroglou et al. (2021) [26] found an average biomass of 57.6 t/ ha in the black locust plantations in former mining regions of the investigated lignite center in Northwestern Greece, and they mentioned that the accumulated biomass of the plantations exhibits a potential to improve the footprint of carbon in the region.
The characteristics of the developed allometry models show that dominant trees grow very well (as mentioned above for age–total height curve) in deposits from lignite mining. Based on that, we can conclude that black locust is a perfect candidate species for the restoration of degraded substrates as deposits from mining operations.
In both cases of estimation (total height estimation via age and bole height estimation via diameter), the estimated surfaces do not intersect (Figure 3 and Figure 4), indicating compatibility of the models estimating the total height and bole height. Thus, the developed models provide accurate estimations of total and bole height of dominant trees in the studied and in analogues sites plantations and can be used as a tool for the better understanding and analysis of stand structure of the species formations [53,54] in degraded sites.
The analysis and understanding of stand structure of black locust plantations is crucial for the development of the proper silvicultural system for the achievement of our management goals [55].
Either our management goal is wood production through plantation forestry, or the conversion of plantations to second growth mixed with other species stands or the reduction—elimination of the invasive black locust presence in adjacent natural ecosystems, the developed models can be a useful tool for forest practice in the studied sites and in plantations of analogous sites.
More research is needed regarding the stand structure and growth of plantations—reforestations of black locust in Greece in order to increase our knowledge on the species performance in various sites. Site quality and other criteria are not examined, because there is no comparison between pre- and post-mining sites; our models serve as a foundation for evaluating mining-impacted areas. To reiterate what we have said so far, the results of our study can be applied locally as well as elsewhere, applying a well-known methodology regarding height growth modeling.

5. Conclusions

The characteristics of the developed allometry models show that dominant trees grow very well in deposits from lignite mining. So, black locust is a perfect candidate species for the restoration of degraded substrates as deposits from mining operations. In both cases of estimation (total height estimation via age and bole height estimation via diameter), the estimated surfaces do not intersect, indicating compatibility of the models estimating the total height and bole height. Thus, the developed models provide accurate estimations of total and bole height of dominant trees in the studied and in analogues sites plantations and can be used as a tool for the better understanding and analysis of stand structure of the species formations in degraded sites. Because there is no comparison between non-mining and post-mining areas, site quality and other factors are not considered; our models serve as a foundation for assessing mining-impacted areas. The results of this work can be used both locally and in other similar sites, in terms of height growth modeling.

Author Contributions

Conceptualization, E.M., K.K. and D.M.; methodology, E.M. and K.K.; formal analysis, K.K., E.M., D.M. and K.V.; investigation, D.M., K.V., G.S.; data curation, K.K., E.M.; writing—original draft preparation, E.M. and K.K.; writing—review and editing, E.M., K.K., D.M., K.V., G.S. and K.R.; supervision, E.M.; project administration, K.R.; funding acquisition, K.R. All authors have read and agreed to the published version of the manuscript.

Funding

This research was funded by Single RTDI state Aid Action Research–Create–Innovation with the co-financial of Greece and the European Union (European Regional Development Fund) in context with Operational Program Competitiveness, Entrepreneurship and Innovation (EΠANEK) of the NSRF 2014–2020 (project contribution of the tree planted land of West Macedonia lignite center to protection of environment and to mitigation of climate change T1EDK-02521).

Institutional Review Board Statement

Not applicable.

Informed Consent Statement

Not applicable.

Data Availability Statement

Not applicable.

Acknowledgments

The authors would like to thank the Public Power Cooperation SA, Hellas (PPC) for its cooperation.

Conflicts of Interest

The authors declare no conflict of interest.

References

  1. Sikkema, R.; Proskurina, S.; Banja, M.; Vakkilainen, E. How can solid biomass contribute to the EU’s renewable energy targets in 2020, 2030 and what are the GHG drivers and safeguards in energy- and forestry sectors? Renew. Energy 2021, 165, 758–772. [Google Scholar] [CrossRef]
  2. Xu, Z.; Smyth, C.; Lempriere, T.; Rampley, G.J.; Kurz, W.A. Climate change mitigation strategies in the forest sector: Biophysical impacts and economic implications in British Columbia, Canada. Mitig. Adapt. Strat. Glob. Chang. 2018, 23, 257–290. [Google Scholar] [CrossRef] [Green Version]
  3. Lelieveld, J.; Klingmüller, K.; Pozzer, A.; Burnett, R.T.; Haines, A.; Ramanathan, V. Effects of fossil fuel and total anthropogenic emission removal on public health and climate. Proc. Natl. Acad. Sci. USA 2019, 116, 7192–7197. [Google Scholar] [CrossRef] [Green Version]
  4. Silva, L.N.; Freer-Smith, P.; Madsen, P. Production, restoration, mitigation: A new generation of plantations. New For. 2018, 50, 153–168. [Google Scholar] [CrossRef]
  5. Pleguezuelo, C.R.R.; Zuazo, V.H.D.; Bielders, C.; Bocanegra, J.A.J.; PereaTorres, F.; Martínez, J.R.F. Bioenergy farming using woody crops. A review. Agron. Sustain. Dev. 2015, 35, 95–119. [Google Scholar] [CrossRef] [Green Version]
  6. Burns, R.M.; Honkala, B.H.; United States. Forest Service. Silvics of North America. Silvics of North America. Volume 2, Hardwoods. In Agriculture Handbook 654; U.S. Government Printing Office: Washington, DC, USA, 1990. [Google Scholar]
  7. Keresztesi, B. Breeding and cultivation of black locust, Robinia pseudoacacia, in Hungary. For. Ecol. Manag. 1983, 6, 217–244. [Google Scholar] [CrossRef]
  8. Cierjacks, A.; Kowarik, I.; Joshi, J.; Hempel, S.; Ristow, M.; von der Lippe, M.; Weber, E. Biological Flora of the British Isles: Robinia pseudoacacia. J. Ecol. 2013, 101, 1623–1640. [Google Scholar] [CrossRef]
  9. Vítková, M.; Pergl, J.; Sádlo, J. Black locust: From global ecology to local management—A case study from the Czech Republic. In Introduced Tree Species in European Forests: Opportunities and Challenge; Krumm, F., Vítková, L., Eds.; European Forest Institute: Joensuu, Finland, 2016; pp. 306–318. [Google Scholar]
  10. Vítková, M.; Müllerová, J.; Sádlo, J.; Pergl, J.; Pyšek, P. Black locust (Robinia pseudoacacia) beloved and despised: A story of an invasive tree in Central Europe. For. Ecol. Manag. 2017, 384, 287–302. [Google Scholar] [CrossRef]
  11. Rédei, K.; Csiha, I.; Keserű, Z.; Ágnes, K.V.; Gyori, J. The Silviculture of Black Locust (Robinia pseudoacacia L.) in Hungary: A Review. South-East Eur. For. 2011, 2, 101–107. [Google Scholar] [CrossRef] [Green Version]
  12. Dini-Papanastasi, O.; Panetsos, C.P. Relation between growth and morphological traits and genetic parameters of Robinia pseudoacacia var. monophylla D.C. in Northern Greece. Silvae Genet. 2000, 49, 37–44. [Google Scholar]
  13. Radtke, A.; Ambraß, S.; Zerbe, S.; Tonon, G.; Fontana, V.; Ammer, C. Traditional coppice forest management drives the invasion of Ailanthus altissima and Robinia pseudoacacia into deciduous forests. For. Ecol. Manag. 2013, 291, 308–317. [Google Scholar] [CrossRef]
  14. Papaioannou, A.; Chatzistathis, T.; Papadopoulos, G. Robinia pseudοacacia as a valuable invasive species for the restoration of degraded croplands. Catena 2016, 137, 310–317. [Google Scholar] [CrossRef]
  15. Campagnaro, T.; Nascimbene, J.; Tasinazzo, S.; Trentanovi, G.; Sitzia, T. Exploring patterns, drivers and structure of plant community composition in alien Robinia pseudoacacia secondary woodlands. iForest—Biogeosci. Forest 2018, 11, 586–593. [Google Scholar] [CrossRef]
  16. Barrett, R.P.; Mebrahtu, T.; Hanover, J. Black locust: A multi-purpose tree species for temperate climates. In Advances in New Crops: Proceedings of the First National Symposium NEW CROPS, Research, Development, Economics, Indianapolis, Indiana, 23–26 October 1988; Janick, J., Simon, J.E., Eds.; Timber Press: Portland, OR, USA, 1990; pp. 278–283. [Google Scholar]
  17. Bongarten, B.C.; Huber, D.A.; Apsley, D.K. Environmental and genetic influences on short-rotation biomass production of black locust (Robinia pseudoacacia L.) in the Georgia Piedmont. For. Ecol. Manag. 1992, 55, 315–331. [Google Scholar] [CrossRef]
  18. Papanastasis, V.P.; Platis, P.D.; Dini-Papanastasi, O. Effects of age and frequency of cutting on productivity of Mediterranean deciduous fodder tree and shrub plantations. For. Ecol. Manag. 1998, 110, 283–292. [Google Scholar] [CrossRef]
  19. Böhm Ch Quinkenstein, A.; Freese, D. Yield prediction of young black locust (Robinia pseudoacacia L.) plantations for woody biomass production using allometric relations. Ann. For. Res. 2011, 54, 215–227. [Google Scholar]
  20. Rédei, K.; Csiha, I.; Keseru, Z. Black locust (Robinia pseudoacacia L.) short-rotation crops under marginal site conditions. Acta Silv. Lignaria Hung. 2011, 7, 125–132. [Google Scholar]
  21. Carl, C.; Lehmann, J.R.K.; Landgraf, D.; Pretzsch, H. Robinia pseudoacacia L. in Short Rotation Coppice: Seed and Stump Shoot Reproduction as well as UAS-based Spreading Analysis. Forest 2019, 10, 235. [Google Scholar] [CrossRef] [Green Version]
  22. Nicolescu, V.-N.; Buzatu-Goanță, C.; Bartlett, D.; Iacob, N. Regeneration and Early Tending of Black Locust (Robinia pseudoacacia L.) Stands in the North-West of Romania. South-East Eur. For. 2019, 10, 97–105. [Google Scholar] [CrossRef] [Green Version]
  23. Arianoutsou, M.; Bazos, I.; Delipetrou, P.; Kokkoris, Y. The alien flora of Greece: Taxonomy, life traits and habitat preferences. Biol. Invasions 2010, 12, 3525–3549. [Google Scholar] [CrossRef]
  24. Jaber, Y.; Radoglou, K.; Tziaferidis, S.R.; Xanthopoulos, G.; Spyroglou, G.; Fotelli, M.N. Effects of symbiotic N fixation and resprouting on the photosynthetic performance of black locust seedlings. In Proceedings of the HELECOS 10 Ecology and the Conservation of Nature: Advances and Retreats in an Age of Crisis, online, 14–17 October 2021; p. 231, Hellenic Ecological Society. Available online: https://helecos10.gr/wp-content/uploads/2021/12/helecos10-proceedings-final.pdf (accessed on 30 January 2021).
  25. Panagopoulos, T.; Hatzistathis, A. Early growth of Pinus nigra and Robina pseudoacacia stands: Contributions to soil genesis and landscape improvement on lignite spoils in Ptolemaida. Landsc. Urban Plan. 1995, 32, 19–29. [Google Scholar] [CrossRef]
  26. Spyroglou, G.; Fotelli, M.; Nanos, N.; Radoglou, K. Assessing Black Locust Biomass Accumulation in Restoration Plantations. Forests 2021, 12, 1477. [Google Scholar] [CrossRef]
  27. Ainalis, A.B.; Tsiouvaras, C.N. Forage production of woody fodder species and herbaceous vegetation in a silvopastoral system in northern Greece. Agrofor. Syst. 1998, 42, 1–11. [Google Scholar] [CrossRef]
  28. Papachristou, T.G.; Papanastasis, V.P. Forage value of Mediterranean deciduous woody fodder species and its implication to management of silvo-pastoral systems for goats. Agrofor. Syst. 1994, 27, 269–282. [Google Scholar] [CrossRef]
  29. Papachristou, T.; Platis, P.; Papanastasis, V.; Tsiouvaras, C. Use of deciduous woody species as a diet supplement for goats grazing Mediterranean shrublands during the dry season. Anim. Feed Sci. Technol. 1999, 80, 267–279. [Google Scholar] [CrossRef]
  30. Papachristou, T.; Platis, P.D. Intake by goats browsing kermes oak alone or choices of different browse combinations: Implications for Mediterranean grazing systems. Rangel. J. 2011, 33, 221–227. [Google Scholar] [CrossRef]
  31. Papachristou, T.G.; Platis, P.D.; Papachristou, I.; Samara, T.; Spanos, I.; Chavales, E.; Bataka, A. How the structure and form of vegetation in a black locust (Robinia pseudoacacia L.) silvopastoral system influences tree growth, forage mass and its nutrient content. Agrofor. Syst. 2020, 94, 2317–2330. [Google Scholar] [CrossRef]
  32. Curtis, R.O. Height-Diameter and Height-Diameter-Age Equations For Second-Growth Douglas-Fir. For. Sci. 1967, 13, 365–375. [Google Scholar] [CrossRef]
  33. Huang, S.; Titus, S.J. An age-independent individual tree height prediction model for boreal spruce–aspen stands in Alberta. Can. J. For. Res. 1994, 24, 1295–1301. [Google Scholar] [CrossRef]
  34. Moore, J.A.; Zhang, L.; Stuck, D. Height-Diameter Equations for Ten Tree Species in the Inland Northwest. West. J. Appl. For. 1996, 11, 132–137. [Google Scholar] [CrossRef] [Green Version]
  35. Huang, S.; Price, D.; Titus, S.J. Development of ecoregion-based height–diameter models for white spruce in boreal forests. For. Ecol. Manag. 2000, 129, 125–141. [Google Scholar] [CrossRef]
  36. Peng, C.; Zhang, L.; Liu, J. Developing and Validating Nonlinear Height–Diameter Models for Major Tree Species of Ontario’s Boreal Forests. North. J. Appl. For. 2001, 18, 87–94. [Google Scholar] [CrossRef] [Green Version]
  37. Avery, T.E.; Burkhart, H. Forest Measurements; McGraw-Hill Science Engineering: New York, NY, USA, 2002. [Google Scholar]
  38. Redei, K. Akácosok FaTermése. (Yield of Black Locust Stands); FRI Research Report; FRI: Budapest, Hungary, 1984. [Google Scholar]
  39. Deliverable of the Project with Code T1EDK 02521. Project Title: Contribution of the Tree Planted Land of Western Macedonia Lignite Center to Protection of Environment and to Mitigation of Climate Change. Work Pack: Collection and Processing of Study Area Data. Head: PPC SA. Stakeholders Involved: DUTH, ENA. 2019. Available online: http://comit.fmenr.duth.gr/ (accessed on 13 February 2022). (In Greek).
  40. Platis, P.; Papachristou TSpanos, Ι.; Meliadis, I.; Kazanzidis, S.; Halivopoulos, G.; Giakzidis, G.; Mantzanas, K. Special Plant Study for the Restoration of Vegetation of the Mines in Ptolemaida, in Kozani Regional Unit, in the Context of the Environmental Impact Assessment of PPC SA; Hellenic Agricultural Organization “Dimitra”: Thessaloniki, Greece, 2011. (In Greek) [Google Scholar]
  41. Oliver, C.D.; Larson, B.C. Forest Stand Dynamics; John Wiley & Sons: Hoboken, NJ, USA, 1996. [Google Scholar]
  42. Smith, D.M.; Larson, B.C.; Kelty, M.J.; Ashton, M.S. The Practice of Silviculture: Applied Forest Ecology; John Wiley & Sons: Hoboken, NJ, USA, 1997. [Google Scholar]
  43. Hoyer, G.E.; Herman, F.R. Height-Age and Site Index Curves for Pacific Silver Fir in the Pacific Northwest; U.S. Department of Agriculture: Washington, DC, USA, 1989.
  44. IBM Corp. IBM SPSS Statistics for Windows; Version 21.0; IBM Corp: Armonk, NY, USA, 2012. [Google Scholar]
  45. Kitikidou, K. Applied Statistics with the Use of the SPSS Statistical Package; Springer Nature: Berlin, Germany, 2005. (In Greek) [Google Scholar]
  46. Yuancai, L.; Parresol, B.R. Remarks on Height-Diameter Modeling; Springer Nature: Berlin, Germany, 2001. [Google Scholar]
  47. Ahmadi, K.; Alavi, S.J.; Kouchaksaraei, M.T.; Aertsen, W. Non-linear height-diameter models for oriental beech (Fagus orientalis Lipsky) in the Hyrcanian forests, Iran. Biotechnol. Agron. Soc. Environ. 2013, 17, 431–440. [Google Scholar]
  48. Zhou, Z.; Fu, L.; Zhou, C.; Sharma, R.P.; Zhang, H. Simultaneous compatible system of models of height, crown length, and height to crown base for natural secondary forests of Northeast China. Forests 2022, 13, 148. [Google Scholar] [CrossRef]
  49. Rédei, K.; Csiha, I.; Keseru, Z.; Rásó, J.; Kamandiné Végh, Á.; Antal, B. Growth and yield of Black locust (Robinia pseudoacacia L.) stands in Nyírség growing region (north-east Hungary). South-East Eur. For. 2014, 5, 13. [Google Scholar] [CrossRef] [Green Version]
  50. Rédei, K.; Keserű, Z.; Csiha, I.; Rásó, J.; Honfy, V. Plantation Silviculture of Black Locust (Robinia pseudoacacia L.) Cultivars in Hungary—A Review. South-East Eur. For. 2017, 8, 151–156. [Google Scholar] [CrossRef] [Green Version]
  51. Nicolescu, V.N.; Rédei, K.; Mason, W.L.; Vor, T.; Pöetzelsberger, E.; Bastien, J.C.; Brus, R.; Benča, T.; Ðodan, M.; Cvjetkovic, B.; et al. Ecology, growth and management of black locust (Robinia pseudoacacia L.), a non-native species integrated into European forests. J. For. Res. 2020, 31, 1081–1101. [Google Scholar] [CrossRef] [Green Version]
  52. Dafis, S. Forest Ecology; Giahoudis-Giapoulis publications: Thessaloniki, Greece, 1986. (In Greek) [Google Scholar]
  53. Bountis, D.; Milios, E. Does crown class classification improve the initiation and development analysis of post-fire pinus brutia stands? Cerne 2017, 23, 61–68. [Google Scholar] [CrossRef] [Green Version]
  54. Milios, E. Towards an integrated conservation vision of narrow habitat types -Silvicultural interventions. In Handbook for the Sustainable Management and Long-Term Conservation of a Narrow ENDEMIC Habitat type in a Limited Area of Occupancy—The Case of the Habitat Type 9590 *Cedrus Brevifolia Forests (Cedrosetum Brevifoliae); Eliades, N., Ed.; LIFE-KEDROS, Nature Conservation Unit, Frederick University: Frederick, Cyprus, 2021; pp. 41–52. [Google Scholar]
  55. Milios, E.; Petrou, P.; Pytharidis, K.; Christou, A.; Eliades, N. Assessment of how natural stand structure for narrow endemic Cedrus brevifolia Henry supports silvicultural treatments for its sustainable management. South-East Eur. For. 2021, 12, 21–34. [Google Scholar] [CrossRef]
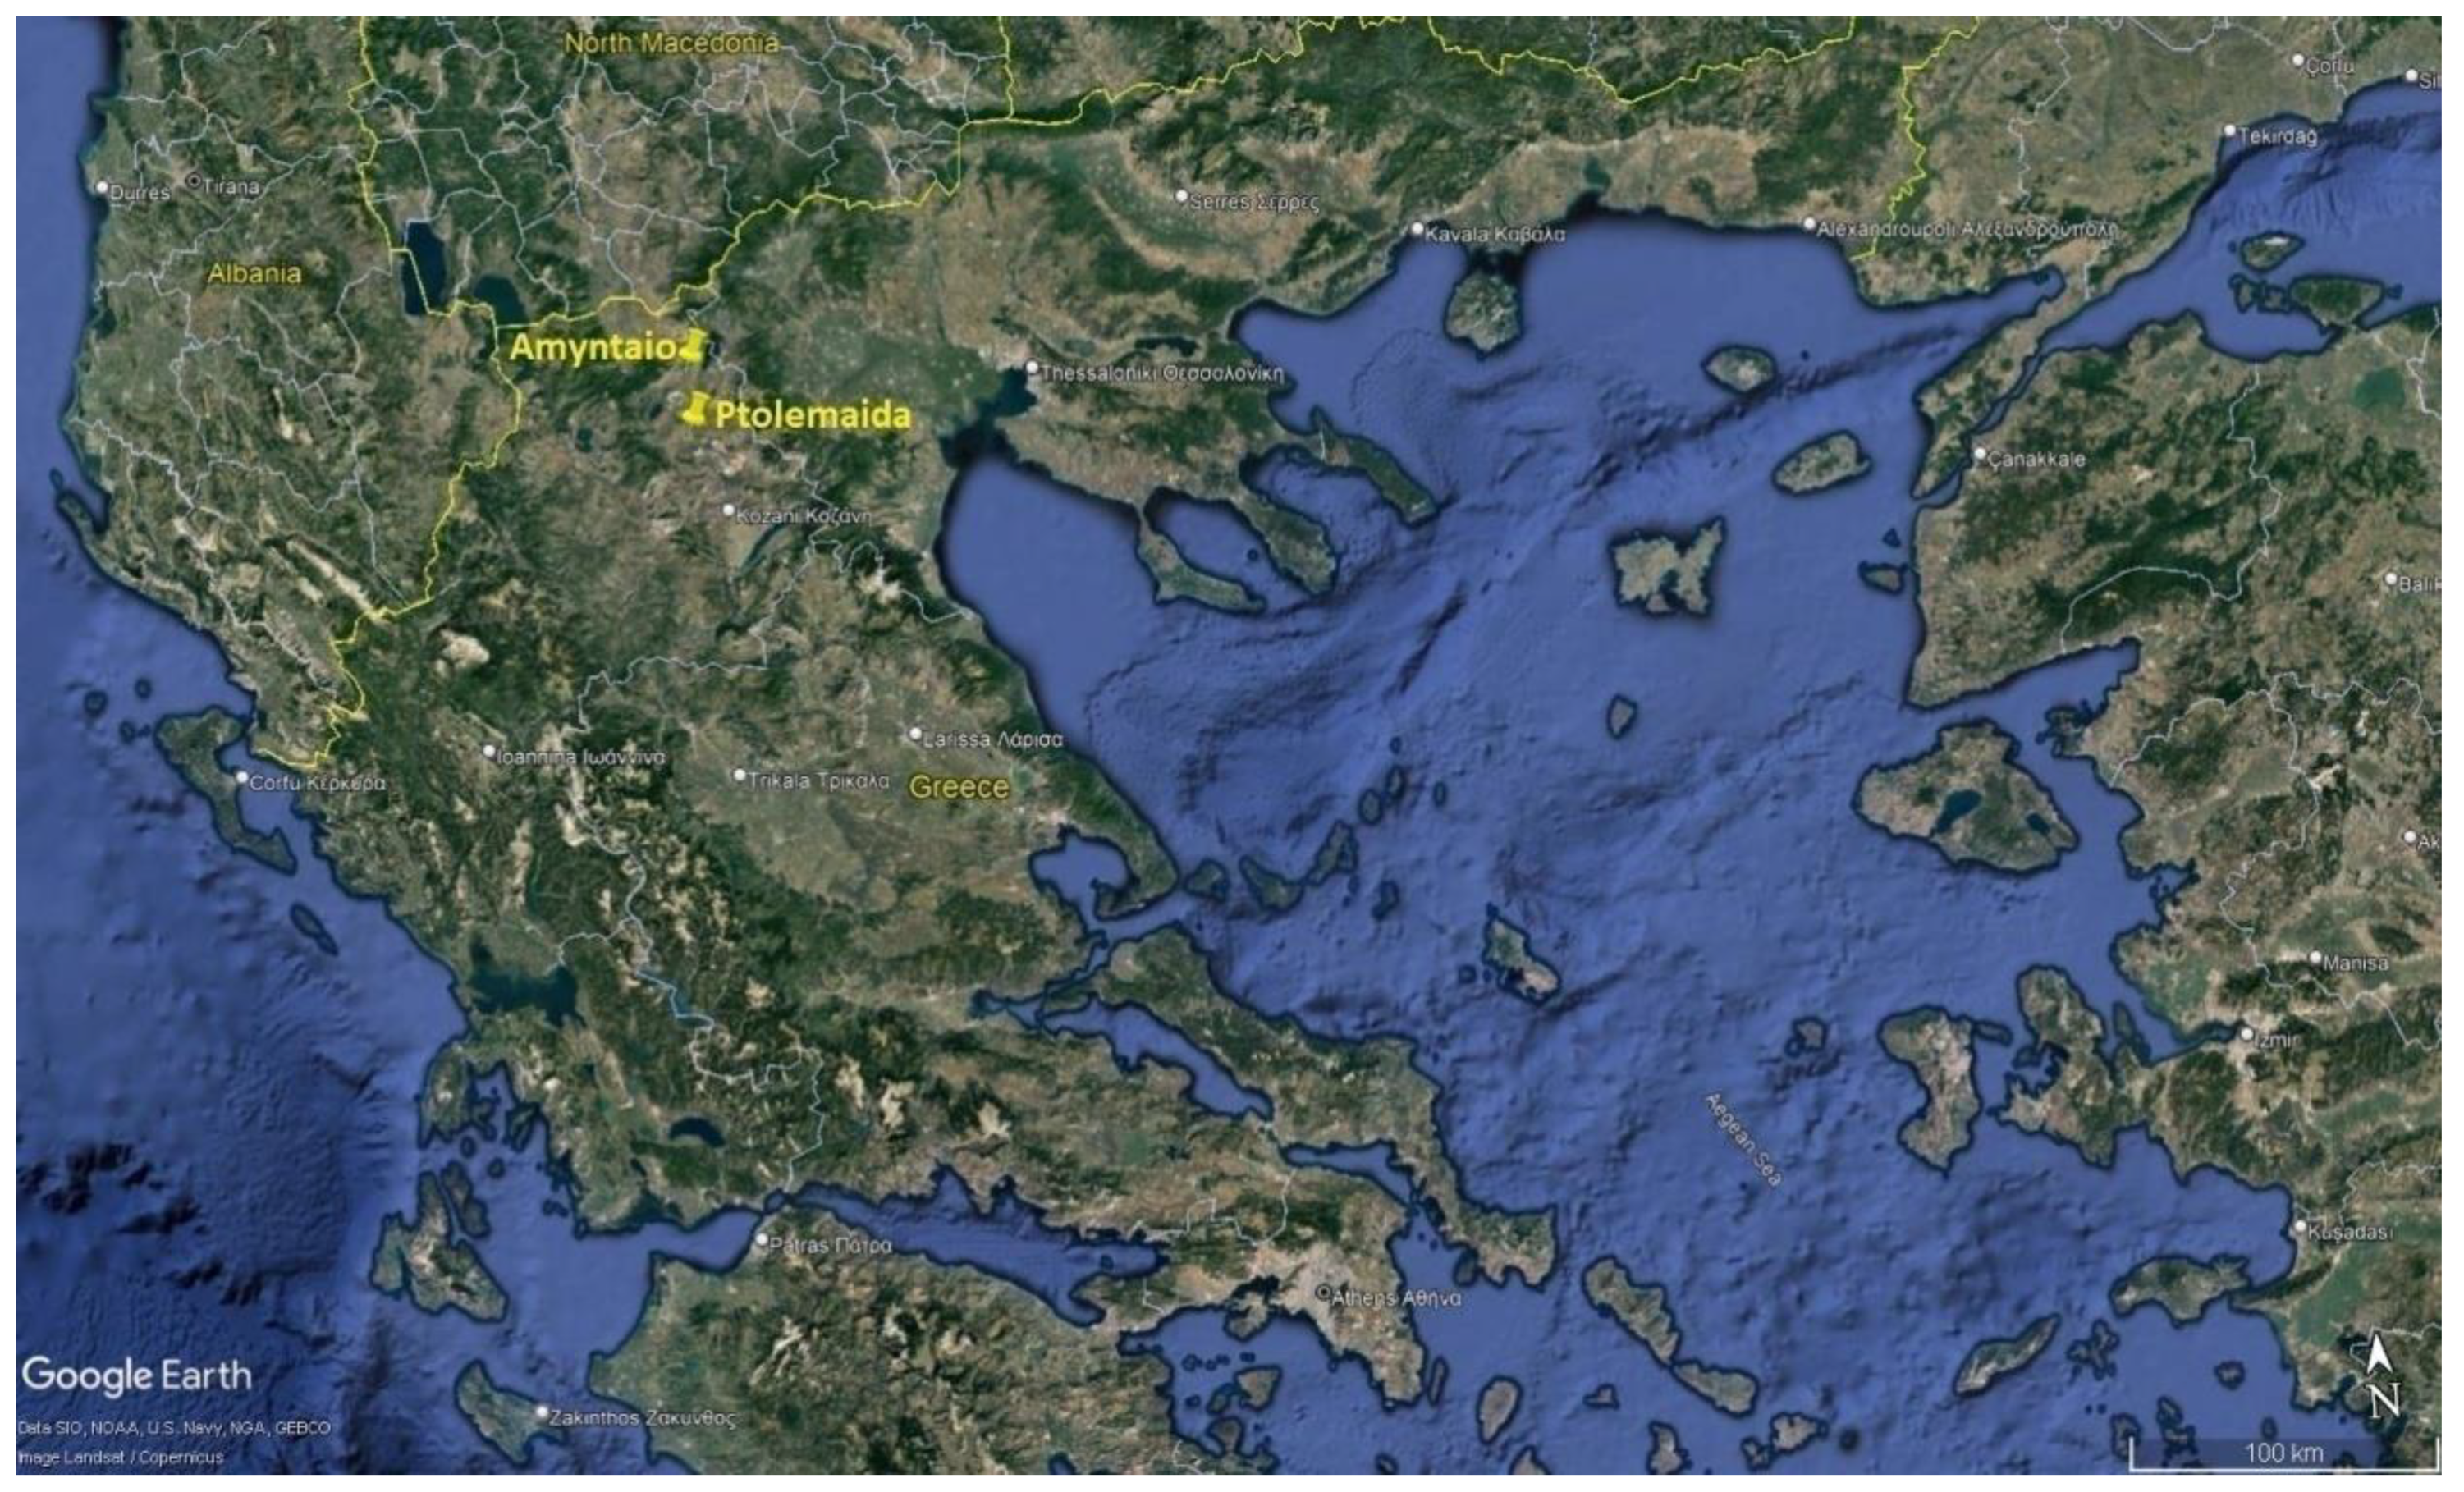
Figure 1. Study country (locations of the two study areas are marked with yellow push pins).
Land 11 00471 g001
Figure 2. Height–age curves for Robinia pseudoacacia in the study area.
Land 11 00471 g002
Figure 3. Height–diameter curves for Robiniapseudoacacia in the study area.
Land 11 00471 g003
Figure 4. Total height estimation (upper surface) and bole height estimation (lower surface), with estimation surfaces developed from the selected total height–age and bole height–age models.
Land 11 00471 g004
Figure 5. Total height estimation (upper surface) and bole height estimation (lower surface), with estimation surfaces developed from the selected total height–diameter and bole height–diameter models.
Land 11 00471 g005
Table 1. Summary statistics for input data (measurements on dominant trees).
MeanStandard
Deviaton
MinMaxN of
Dominant * Trees
Total height H (m)12.243.086.0017.50537
Bole height Hb (m)8.512.672.0014.00537
Diameter at breast height D (cm)12.714.303.6628.81537
Age t (years)15.206.084.0023.00537
* Dominant is a tree with a crown that extends above the general cover of crown cover, and its crown is not physically restricted from above, although possibly somewhat crowded by other trees on the sides.
Table 2. Models fitted to input data.
Νο.Model’s NameHeight–Age ModelsHeight–Diameter Models
1Linear H ^ = b 0 + b 1 t
H ^ b = b 0 + b 1 t
H ^ = b 0 + b 1 D
H ^ b = b 0 + b 1 D
2Logarithmic H ^ = b 0 + b 1 ln t
H ^ b = b 0 + b 1 ln t
H ^ = b 0 + b 1 ln D
H ^ b = b 0 + b 1 ln D
3Inverse H ^ = b 0 + b 1 t
H ^ b = b 0 + b 1 t
H ^ = b 0 + b 1 D
H ^ b = b 0 + b 1 D
4Quadratic H ^ = b 0 + b 1 t + b 2 t 2
H ^ b = b 0 + b 1 t + b 2 t 2
H ^ = b 0 + b 1 D + b 2 D 2
H ^ b = b 0 + b 1 D + b 2 D 2
5Cubic H ^ = b 0 + b 1 t + b 2 t 2 + b 3 t 3
H ^ b = b 0 + b 1 t + b 2 t 2 + b 3 t 3
H ^ = b 0 + b 1 D + b 2 D 2 + b 3 D 3
H ^ b = b 0 + b 1 D + b 2 D 2 + b 3 D 3
6Power H ^ = b 0 t b 1
H ^ b = b 0 t b 1
H ^ = b 0 D b 1
H ^ b = b 0 D b 1
7Compound H ^ = b 0 b 1 t
H ^ b = b 0 b 1 t
H ^ = b 0 b 1 D
H ^ b = b 0 b 1 D
8S-curve H ^ = e b 0 + b 1 t
H ^ b = e b 0 + b 1 t
H ^ = e b 0 + b 1 D
H ^ b = e b 0 + b 1 D
9Logistic H ^ = 1 1 u + b 0 b 1 t
H ^ b = 1 1 u + b 0 b 1 t
H ^ = 1 1 u + b 0 b 1 D
H ^ b = 1 1 u + b 0 b 1 D
10Growth H ^ = e b 0 + b 1 t
H ^ b = e b 0 + b 1 t
H ^ = e b 0 + b 1 D
H ^ b = e b 0 + b 1 D
11Exponential H ^ = b 0 e b 1 t
H ^ b = b 0 e b 1 t
H ^ = b 0 e b 1 D
H ^ b = b 0 e b 1 D
H ^ : estimated total tree height (m), H ^ b : estimated bole height (m), t: measured tree age (years), D: measured diameter at breast height (cm), bi: regression coefficients, u: upper bound of the dependent variable.
Table 3. Comparison criteria for selecting the model of best fit.
CriterionFormulaOptimum
Value
Coefficient of determination R 2 = 1 i = 1 n ( H ^ i H ¯ ) 2 i = 1 n ( H i H ¯ ) 2
R 2 = 1 i = 1 n ( H ^ b i H ¯ b ) 2 i = 1 n ( H b i H ¯ b ) 2
1
Standard error of the estimate S E E = i = 1 n ( H ^ i H i ) 2 n p
S E E = i = 1 n ( H ^ b i H b i ) 2 n p
min
Root of the mean squared error R M S E = i = 1 n ( H ^ i H i ) 2 n
R M S E = i = 1 n ( H ^ b i H b i ) 2 n
min
H ^ : estimated total tree height (m), H ¯ : average measured total tree height (m), H ^ b : estimated bole height (m), H ¯ b : average measured bole height (m), p: number of regression coefficients, n:sample size (count of sampled trees).
Table 4. Values for the comparison criteria for selecting the height–age model.
ModelTotal Height EstimationBole Height Estimation
R2SEERMSER2SEERMSE
10.81351.33121.32750.70021.46461.4605
20.83431.25471.25120.74701.34531.3415
30.76241.50251.49830.70841.44441.4404
40.85291.18221.18520.76621.29331.2905
50.83001.27093.09940.76181.30541.6693
60.83681.24541.24430.72701.39751.4032
70.75741.51831.54690.61931.65041.7067
80.81011.34321.35520.74671.34621.3536
90.84531.21251.21390.69291.48232.4523
100.75741.51831.54640.62001.64881.7001
110.75741.51831.54650.62001.64881.7000
Table 5. Values for the comparison criteria for selecting the best height–diameter model.
ModelTotal Height EstimationBole Height Estimation
R2SEERMSER2SEERMSE
10.56152.04122.03550.54851.79731.7923
20.64991.82401.81890.63821.60891.6044
30.64281.84241.83730.63661.61241.6079
40.68601.72741.72500.67621.52191.5206
50.68251.73701.78510.61621.65712.3157
60.60601.93511.95140.57001.75391.7938
70.46122.26272.35670.40802.05812.2383
80.66691.77911.78260.65421.57281.5774
90.63361.86591.88740.56511.76392.1349
100.46032.26462.36610.40902.05632.2262
110.46032.26462.36620.40902.05632.2262
Publisher’s Note: MDPI stays neutral with regard to jurisdictional claims in published maps and institutional affiliations.