Abstract
Urban expansion is not only reflected in the increase in horizontal urban area, but also in the increase in vertical urban height, that is, the city’s vertical expansion. Exploring the spatiotemporal evolution of urban vertical expansion and its influencing factors is critical for furthering urban expansion research. This paper characterized the degree of urban vertical expansion using the floor area ratio (FAR) of newly added residential land in Jiangsu Province, China, from 2009 to 2018, and discussed the spatiotemporal characteristics, regional differences and influencing factors of urban vertical expansion. The results indicate the following: (1) The degree of urban vertical expansion in Jiangsu Province exhibited an inverted “U” shape that increased and then decreased. Spatially, it presented a pattern of high in the west and low in the east areas, while high in the north and low in the south areas. (2) There were significant α-convergence, β-convergence and club convergence phenomena in Jiangsu Province’s urban vertical expansion. The convergence speed was fast in the north and south areas but slow in the middle. (3) Real estate development investment and slope had a significant positive impact on urban vertical expansion, while urban per capita disposable income and economic structure had a non-linear impact on urban vertical expansion intensity. Finally, this paper highlighted the importance of further investigation into urban expansion from multiple dimensions. The government should strengthen its control over the various land plot ratios to ensure the city’s orderly expansion and healthy development.
1. Introduction
Cities are carriers of population agglomeration and economic development [1]. Since the 21st century, China has entered a period of rapid urbanization [2,3]. The built-up area expanded from 22,400 km2 in 2000 to 60,721 km2 in 20191. Excessive urban expansion speed can easily lead to problems such as inefficient land use [4], landscape fragmentation [5], loss of cultivated land [6] and environment pollution [7]. Therefore, grasping the spatiotemporal evolution characteristics of urban expansion is critical for efficiently solving the problems caused by rapid urban expansion. It must be noted that our attention to urban expansion issue has thus FAR been limited to the horizontal level. However, as a three-dimensional space, the urban expansion also has three-dimensional attributes [8,9,10,11]. In other words, urban vertical expansion is an important part of urban expansion that cannot be ignored [11,12]. Urban vertical expansion can effectively reflect the concentration of population and economy in the city with the improvement of building height as its most obvious feature [13]. At present, China not only faces the problem of unreasonable urban horizontal expansion [14,15] but also has the issue of excessively high vertical construction intensity. China’s plot ratio of residential and commercial land FAR exceeds that of developed countries [16]. Moreover, the excessive urban vertical expansion also contributes to “urban diseases”, such as overcrowding and traffic congestion [17,18]. Therefore, in July 2020, 15 departments, including the Ministry of Housing and Urban–Rural Development, issued Opinions on Strengthening the Green and Low-Carbon Construction of County Towns (Jiancun (2021) No. 45). The document proposed that the density and height of buildings in the county be strictly controlled to ensure the county’s future low-carbon development of the county. In terms of building height, China’s urban construction needs to “cool down”.
In the existing relevant literature, scholars mostly focused on horizontal urban expansion [19,20,21,22]. However, with the development of construction technology and the intensification of requirements for land conservation and intensive use, urban expansion showed increasingly significant vertical expansion characteristics [23,24]. It is also difficult to accurately describe the spatial changes of cities based solely on horizontal analysis [25]. Nonetheless, with the support of remote sensing technology and multivariate data, the research on urban vertical expansion was gradually carried out. For example, Barr and Cohen used the Kriging method to conduct spatial analysis of building plot ratios in New York City on a grid scale. It was found that as a building’s distance from the city center increased, its FAR decreased [26]. Handayani et al. examined urban expansion by using geospatial analysis, including remote sensing and geographic information system. It revealed that urban expansion in the central business district of Surabaya, Indonesia was more reflected in a vertical than a horizontal dimension [27]. On the street scale, Li et al. and Li et al. conducted spatial analysis and influencing factors exploration on the FAR of the main urban areas of Guangzhou and Dalian City in China. They found that the spatial distribution of residential FAR was unbalanced and convergent, and factors such as the nature of the residential underlying surface, location and land rent all had an important impact on residential FAR [28,29]. Zhang et al. used GeoEye images to obtain the building heights of residential neighborhoods in Beijing from 1949 to 2009 and discovered that the vertical structure of residential neighborhoods formed a “low–high” pattern from urban central areas to the urban edges [30]. On the national scale, Zhou et al. used data from China Land Market Network to analyze the spatiotemporal evolution characteristics and influencing factors of the FAR of newly added residential land in 320 cities in China, and found that the FAR of China’s newly added residential land had a protruding pattern in the middle, followed by the west, and a lower pattern in the east, with an increasing continuous spatial agglomeration [31]. Zambon et al. conducted long-term series research in Greece and established that cities alternated their expansion process between horizontal and vertical phases [32].
It is not difficult to see that the existing relevant studies mainly explored the spatiotemporal characteristics of urban vertical expansion at the small-scale scope of the central urban area and the urban level [31,32,33,34] with relatively few pertinent studies at the regional scale. In terms of characterizing the degree of urban vertical expansion, a variety of indicators, such as building height, building floor and floor area ratio are used [10,25,33]. Based on existing research, the FAR index is also the most commonly used spatial planning control index in many developed countries, such as the United States [35], the United Kingdom [36], Japan [8,37] and Singapore [38]. In addition, China’s residential land accounts for about 30% of total land area2; it is not only an important part of urban construction land, but also a significant land type regulated by the government. Therefore, this paper intended to select the FAR of newly added residential land as an indicator of urban vertical expansion and to use Jiangsu Province in China as an example to analyze the spatiotemporal revolution characteristics and influencing factors of urban vertical expansion from 2009 to 2018 at the regional level. It should be noted that Jiangsu Province is on China’s southeast coast and is one of its most economically and socially developed provinces; there are clear regional differentiation characteristics within the province, forming three gradient development areas in Southern Jiangsu, Central Jiangsu and Northern Jiangsu (Figure 1). Hence, choosing Jiangsu Province as the research area can not only exhibit the spatiotemporal characteristics of urban vertical expansion but also help in studying and assessing the law of urban vertical expansion in different development areas. It is also useful for understanding the characteristics and laws governing urban vertical expansion in China and other countries or regions.
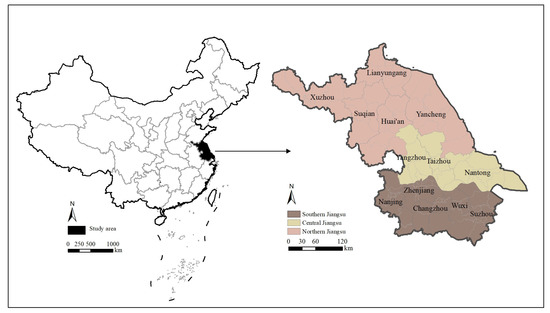
Figure 1.
The location of research area.
2. Methods and Data
This section introduces the spatiotemporal feature analysis method to be used, examines the theoretical influencing factors of urban vertical expansion, constructs an econometric model and explains the research data source and processing method.
2.1. Research Methods of Spatiotemporal Characteristics
2.1.1. Measurement of the City’s Vertical Expansion
In this paper, the floor area ratio (FAR) of newly added residential land was used to measure the degree of urban vertical expansion. FAR usually refers to the ratio of gross construction area on the ground to net land area within a particular parcel. Under China’s current residential land transfer system, the government sets the upper and lower limits of the plot ratio. The larger the plot ratio, the more residential area is available for sale on the plot, resulting in higher profits. Therefore, developers always choose to develop residential buildings according to the prescribed upper limit. Consequently, this article assumes that the government’s upper limit for the residential plot ratio is the true FAR of the plot. Restricted by the regulatory detailed planning under the current urban planning legal system and the Residential Design Code (GB 50368-2005), the number of residential floors in China can be roughly divided into five categories (6 layers, 11 layers, 18 layers, 26 layers and 33 layers). Generally, the FAR of 6 floors and below is 0.8–1.5, while it is 1.5–1.8 for 11 floors, 1.8–2.4 for 18 floors, 2.5–3 for 26 floors and 3–3.5 for 33 floors. Based on the above analysis, combined with relevant research, this article believes that the building FAR and building height have extremely high consistency [25,39]. The higher FAR, the greater degree of urban vertical expansion.
2.1.2. Trend and Convergence Analysis
This paper used the trend analysis tool in ArcGIS spatial analysis to fit the global trend map of urban vertical expansion in Jiangsu Province from 2009 to 2018.
Convergence analysis is a tool for measuring the dynamic evolution law of the gap between regions. It can effectively analyze the evolution law and characteristics of a certain element between regions. Common convergence analysis has three types: α-convergence, β-convergence and club convergence. The specific meaning and calculation methods are as follows [40]:
(1) α-convergence: α-convergence means that the difference in the degree of vertical expansion between cities is shrinking over time. The following formula can be used to calculate α-convergence:
where is the coefficient of variation in period t of Jiangsu Province; is the vertical expansion degree of district i in period t; n is the number of research units.
(2) β-convergence: Convergence can be divided into absolute β-convergence and conditional β-convergence. Conditional β-convergence is based on absolute β-convergence by adding control variables to avoid omission of explanatory variables [41]. Considering that the regression results of the two convergent models are highly consistent [42], we further analyze and demonstrate the influencing factors in Section 4. Therefore, we finally choose absolute β-convergence to analyze the spatiotemporal evolution of urban vertical expansion. Absolute β-convergence means that districts (counties) with a lower degree of vertical expansion have a higher growth rate than districts (counties) with a higher degree of vertical expansion, ultimately leading to the convergence of vertical expansion in all districts (counties). The absolute β-convergence model is as follows:
where represents the growth rate of the vertical expansion degree of district i from period t to period t + T. and are, respectively, the degree of vertical expansion at the end and the beginning of the period. α and β are the parameters to be estimated. T is the time span; is the random error term. Convergence rate , if β is significantly less than 0, there is β-convergence.
(3) Club convergence: Considering the consistency of space, many scholars proposed the concept of club convergence [43,44]. In the field of geography, it can be understood that geographically adjacent regions tend to be assimilated during development. When verifying whether there is club convergence, the data is generally classified according to different characteristics, and then the absolute β-convergence is used for verification within the group. This article first validates whether there is absolute β-convergence in 95 districts (counties) in Jiangsu Province, and then divides them into Southern Jiangsu, Central Jiangsu and Northern Jiangsu to determine whether there is club convergence inside the geographic locations.
2.2. Analysis of Influencing Factors and Model Construction
2.2.1. Main Influencing Factors of Urban Vertical Expansion
To promote the economical and intensive use of urban construction land and ensure the smooth implementation of regulatory detailed planning, the local government will set a series of parameters for management and control when residential land is transferred. The FAR index can well reflect the residential construction. The FAR setting is an official policy restriction, and the settings in some areas indeed lack scientificity. Nevertheless, as the scientific nature of urban planning continues to improve, the factors considered in plot ratio setting are becoming increasingly comprehensive [8,45,46].
Based on existing research, the influencing factors of urban vertical expansion are summarized as follows: (1) Physical geography factors: mainly latitude and slope. According to the relevant regulations of the Uniform Standard for Civil Building Design (GB50352-2019), residential construction must meet the basic sunshine standards. Therefore, to ensure light duration at higher latitudes, the floor height must be appropriately reduced or the distance between buildings increased, which reduces the degree of urban vertical expansion. In areas with large surface undulations, land leveling investment must be raised. In order to obtain average profits, developers may increase development intensity [29]. At the same time, areas with large surface undulations lack land for residential development. With the scarcity of land resources, the local government is motivated to push up the FAR of residential land [31]. (2) Economic growth factors: Mainly urban per capita disposable income and economic structure. Urban per capita disposable income and economic structure reflect the level of urban economic development, and their growth has promoted the development of the service industry, stimulated demand for urban residential land and led to an increase in the intensity of building development [47]. With the development of the economy, residents’ purchasing power and consumption power gradually rises, promoting their pursuit of low-density (FAR) living space. Therefore, there may be a non-linear relationship between residents’ consumption capacity and residential land’s FAR [31]. When the economy develops to a certain level, the increase in urban per capita disposable income and the modernization of the industrial structure inhibits urban vertical expansion. The amount of investment in real estate development reflects a region’s enthusiasm for real estate development, which is mostly concentrated in new city areas. These areas always have higher urban positioning as the city’s future growth pole, and the government appropriately increases the setting of urban building height [48]. (3) Social development factors: Mainly population density. The region’s higher population density means greater housing consumption demand, but the annual land supply area is limited [49]. The imbalance between supply and demand leads to an increase in the residential plot ratio in areas with limited space. Thus, areas with higher population density often choose to increase the FAR of residential land to accommodate more people.
Based on the above analysis, it is possible to conclude that urban per capita disposable income (UPCDI) and economic structure (STRU) have a non-linear impact on urban vertical expansion. The specific manifestation is that the initial stage of economic development has a positive effect, but after a certain level of economic development, it has a restraining effect. While urban population density (PD), real estate development investment (REDI) and land slope (SLOPE) have a positive impact on urban vertical expansion, increased latitude (LAT) has a negative effect.
2.2.2. Model Construction
Based on theoretical analysis, we constructed an econometric model to explore factors influencing vertical expansion in Jiangsu Province. The specific expression of the model is as follows:
where represents the vertical expansion degree of region I in period j. , , , , and respectively, represent urban per capita disposable income, economic structure (regional tertiary output value/regional GDP), population density (regional resident population/regional administrative area), real estate development investment, latitude and slope of region i in period j. and represent the quadratic term of urban per capita disposable income and economic structure of region i in period j. is a constant term, and is the term of random error.
2.3. Data Sources and Data Processing
The China Land Market Network (https://www.landchina.com/ (accessed on 11 December 2020)) is a comprehensive platform serving the Chinese land market. The platform is responsible for disseminating information on land supply, land parcel transfer and land-related policies and regulations. It has a large amount of data, a reliable source and a fast update speed. This article collected 33,648 pieces of Jiangsu Province residential land transaction data from the China Land Market Network and sorted them by district (county) and period (a total of 13 indicators, including land use, FAR upper limit, transaction area, transaction time, etc.). The yearly average FAR of new residential land in each district (county) was calculated on this basis. Other economic and social data for districts (counties) were obtained from the China Regional Economic Statistical Yearbook, Jiangsu Statistical Yearbook and statistical yearbooks of each city in Jiangsu Province. In addition, some missing data were supplemented by interpolation. The slope data was calculated by using a digital elevation model (DEM), and the average value in the area was taken to represent the district’s (county) slope. The latitude data is obtained by calculating the district’s (county) centroid.
According to administrative divisions in 2020, Jiangsu Province had 95 districts (counties). For units that were inconsistent with the current administrative divisions, the FAR of newly added residential land is processed as follows: (1) For the districts (counties) undergoing consolidation, the land transaction data of the two districts (counties) is merged, and the FAR of newly added residential land in the area is calculated. (2) For areas where there was no change in the scope of administrative regions, such as county to district, county to city and city to district, the original data is used. In addition, the administrative division boundary map of Jiangsu Province is extracted and vectorized as the research work’s base map.
Table 1 shows the descriptive statistical values of each variable in the model. It can be seen that the highest FAR of the explained variable is 5.440, the minimum is 0.900, the average is 2.061 and the standard deviation is FAR less than the average, indicating that the FAR value distribution of each sample is relatively uniform. The sample value distribution of UPCDI, STRU and LAT in explanatory variables is also relatively uniform; the standard deviations of PD, REDI and SLOPE are greater than the average, and the sample values are relatively different.

Table 1.
Descriptive statistics of variables.
3. The Spatiotemporal Pattern and Evolution Laws of Urban Vertical Expansion
3.1. The Spatiotemporal Pattern of Urban Vertical Expansion
3.1.1. Trend Analysis
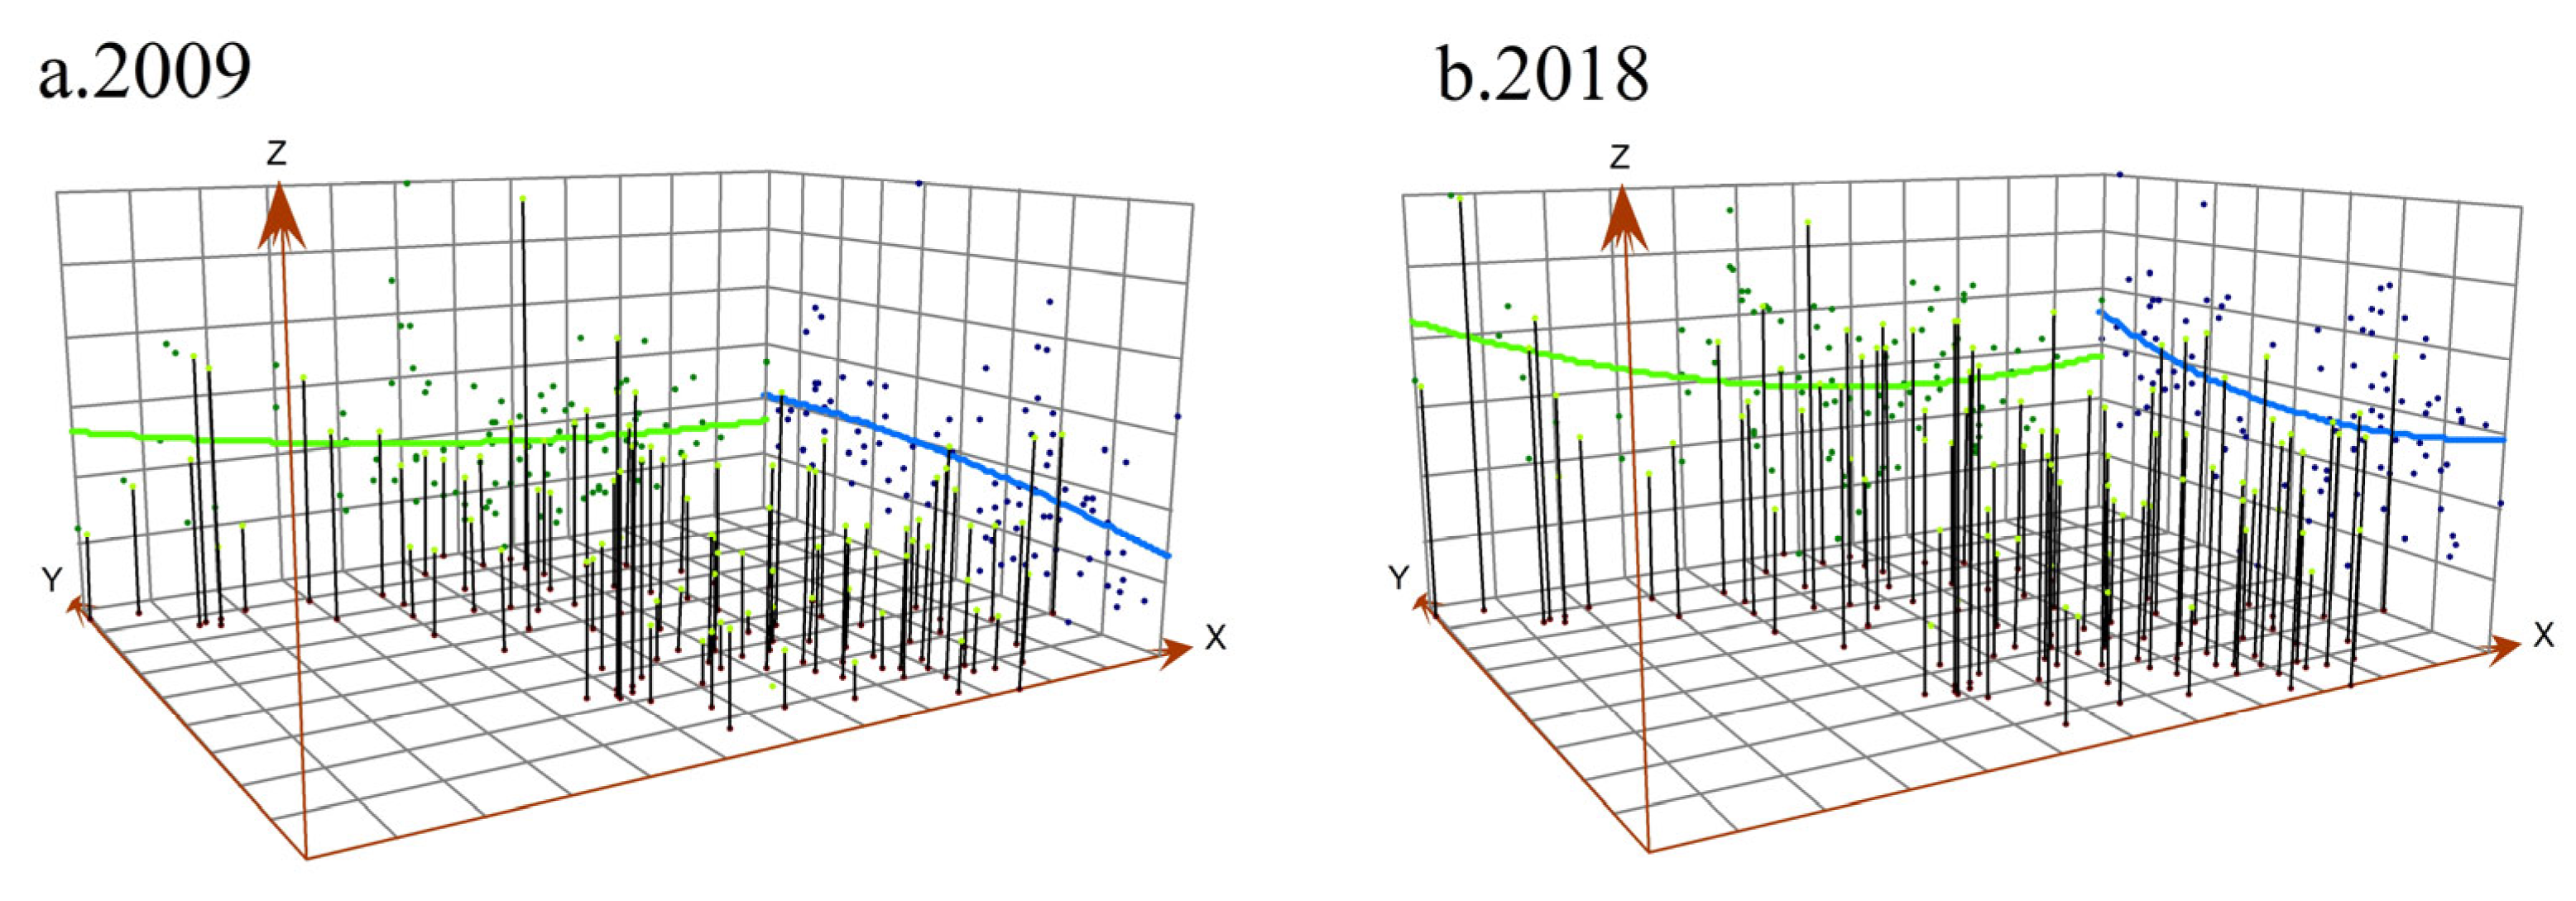
We generated trend maps of Jiangsu Province’s urban vertical expansion in 2009 and 2018 (Figure 2). The Y-axis direction represents the south to north areas, and the blue line represents the change trend from north to south. The X-axis direction denotes the west to east areas, and the green line represents the change trend from east to west. Z signifies the FAR value of newly added residential land.
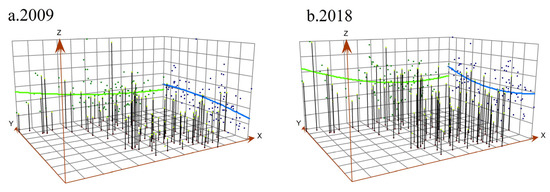
Figure 2.
Trend analysis of urban vertical expansion in Jiangsu Province: (a,b).
Figure 2 shows that the degree of urban vertical expansion in Jiangsu Province in 2009 exhibited a downward trend in the Y-axis direction, indicating that vertical expansion decreased from north to south. In the X-axis direction, it displayed a decreasing trend from west to east. In 2018, it had a pattern of highs in the north and south and lows in the middle. From west to east, it maintained a downward trend, and the decline was greater than in 2009. In general, the intensity of urban vertical expansion in Jiangsu Province was high in the north, low in the south, high in the west and low in the east.
3.1.2. Analysis of Regional Characteristics
We classified all samples as “center-periphery”. The central area, for example, refers to the part where the administrative unit was the “district” before 2009. Given that their urbanization level was still relatively low, those removed from counties and made districts after 2009 were divided into peripheral areas with other counties. Figure 3 shows that the degree of urban vertical expansion in Jiangsu Province exhibited an inverted “U” characteristic. The lowest value was 1.81 in 2009, while the highest value was 2.20 in 2015. The degree of vertical expansion gradually decreased after 2015, and the degree of expansion in 2018 was the same as in 2010. According to the perspective of the “center-periphery” classification, the central area’s vertical expansion in 2009 was much greater than that of the peripheral counties. However, the peripheral counties had a higher vertical expansion rate, which surpassed the central area in 2013 before falling back after 2015. The pattern remained unchanged until the end of the study period.
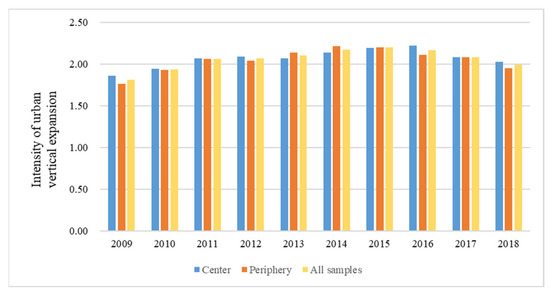
Figure 3.
Urban vertical expansion intensity in Jiangsu Province. (Classified by center-periphery).
3.1.3. Analysis of Regional Difference
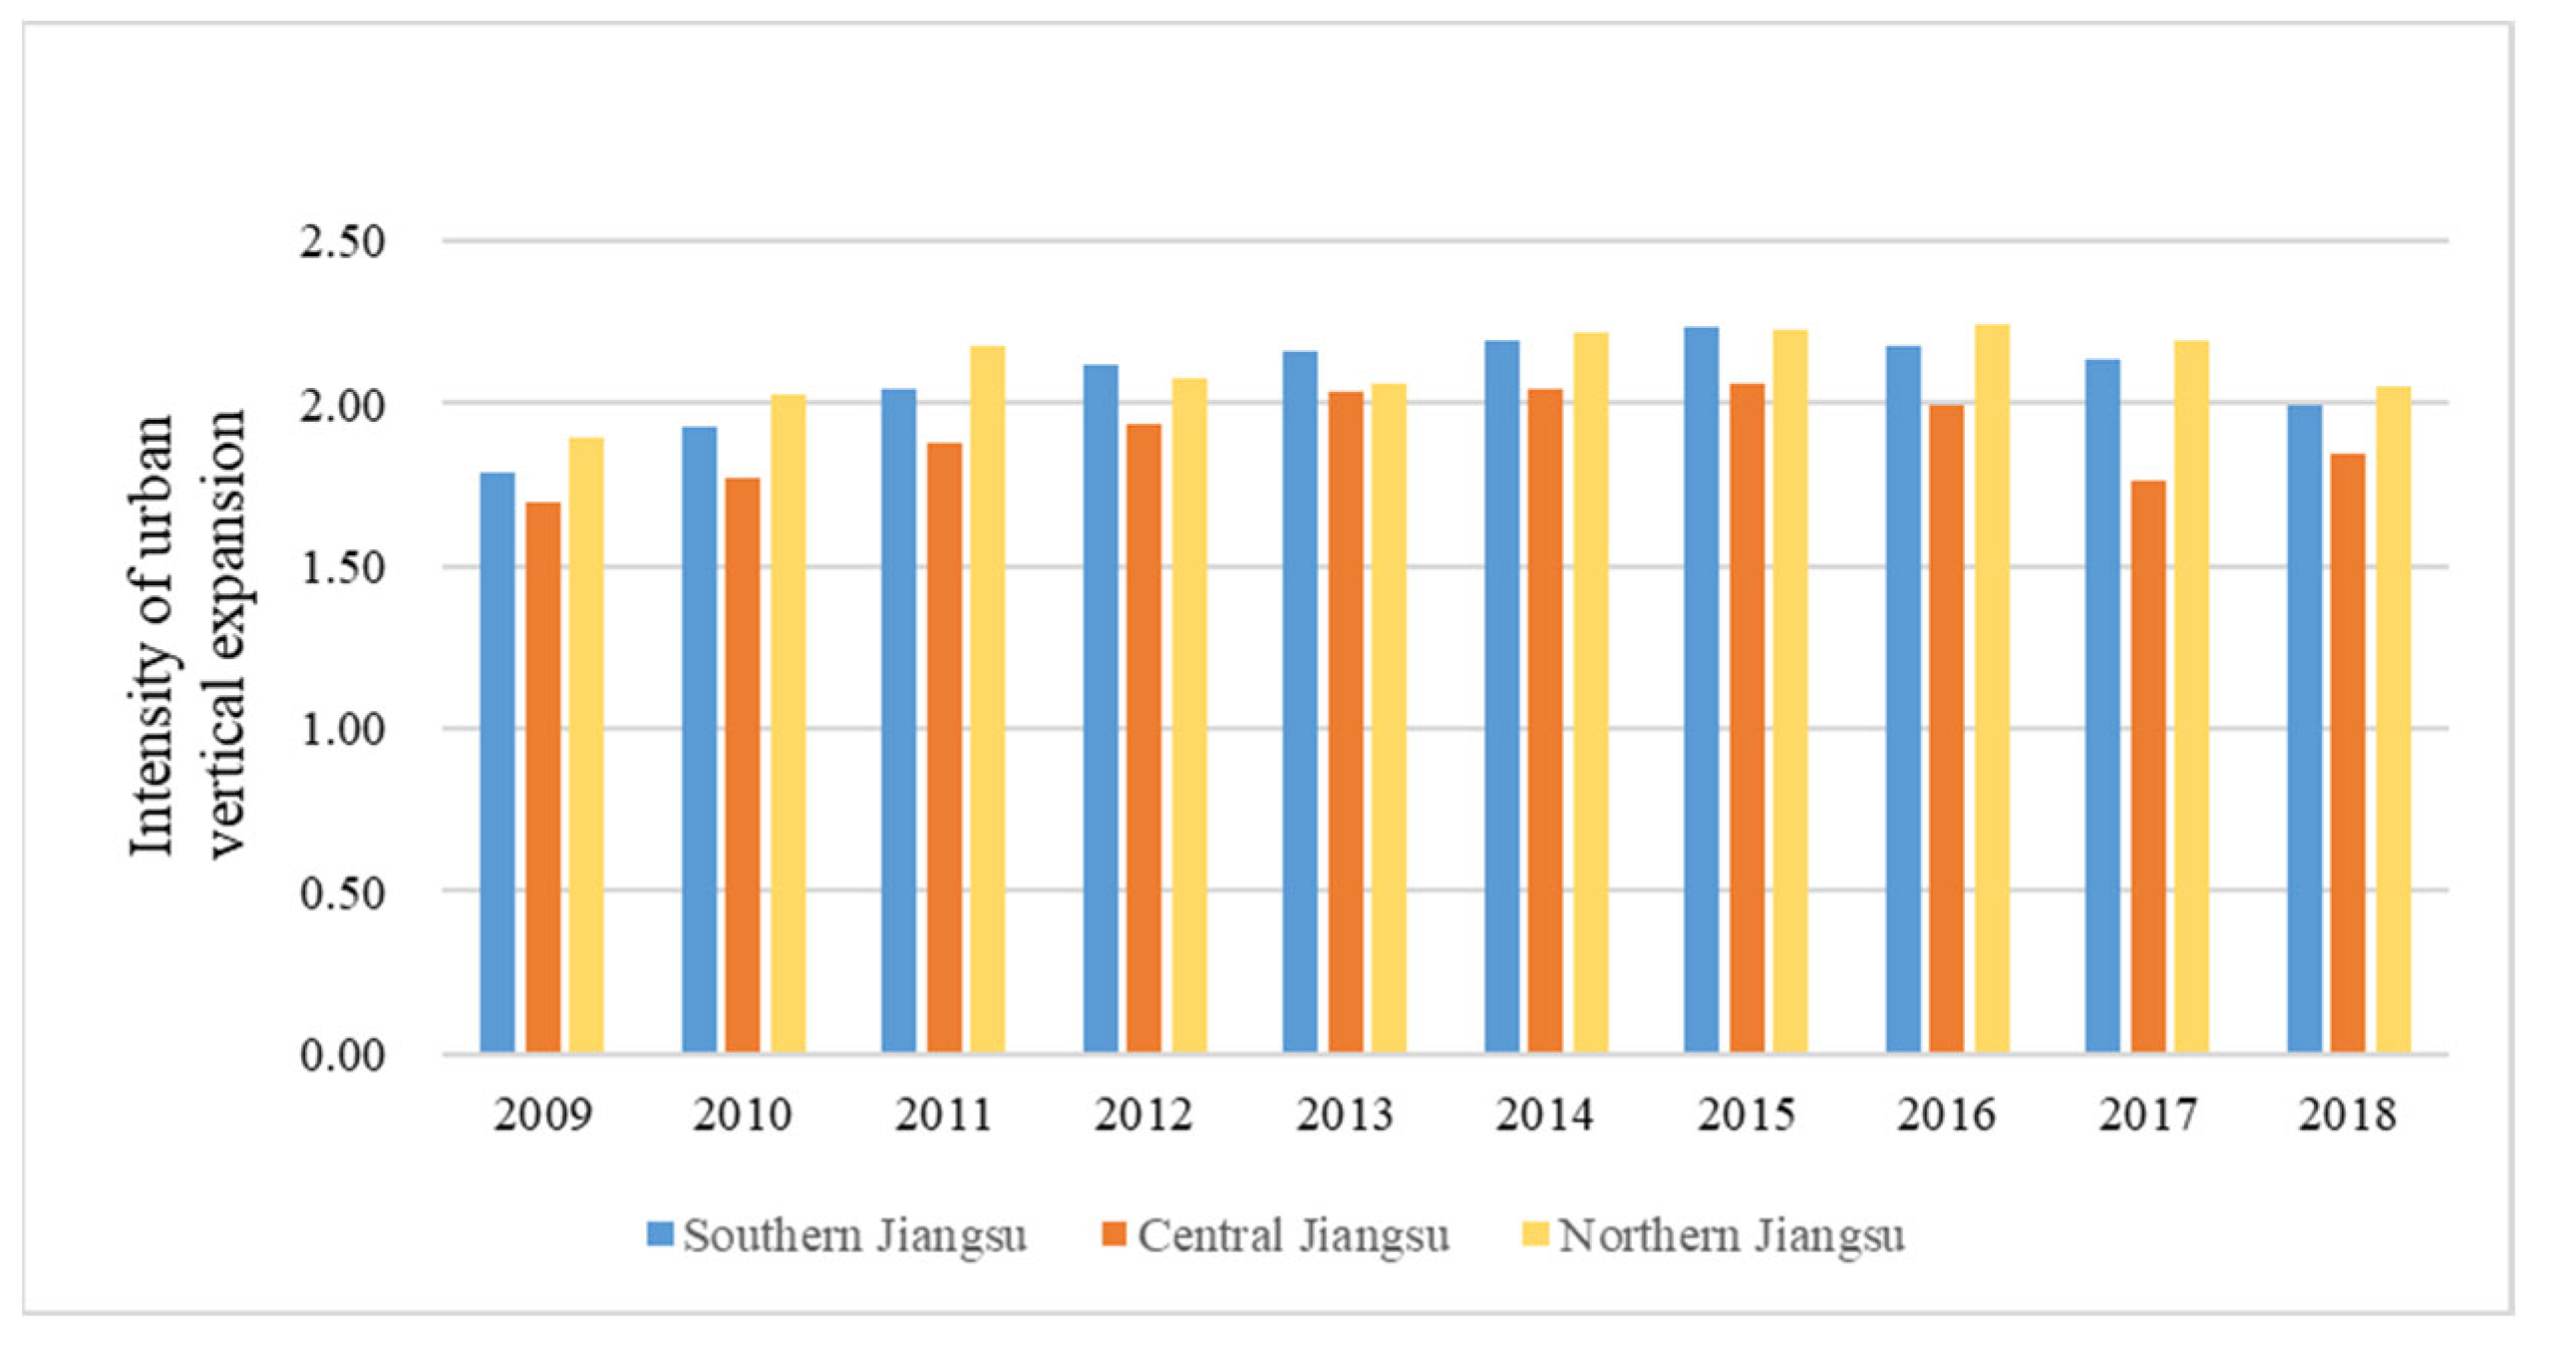
Jiangsu Province was further divided into three major regions: Southern Jiangsu, Central Jiangsu and Northern Jiangsu. The Southern Jiangsu region includes a total of 39 districts (counties) under the jurisdiction of five cities (Nanjing, Suzhou, Wuxi, Changzhou and Zhenjiang). The Central Jiangsu region includes a total of 19 districts under the jurisdiction of three cities (Nantong, Taizhou and Yangzhou). The Northern Jiangsu region includes a total of 37 districts (counties) under the jurisdiction of five cities (Xuzhou, Yancheng, Suqian, Huai’an and Lianyungang). Figure 4 exhibits that Northern Jiangsu had the greatest degree of urban vertical expansion, followed by Southern Jiangsu and Central Jiangsu. The pattern remained unchanged throughout the study period.

Figure 4.
Urban vertical expansion intensity in Jiangsu Province. (Classified by regional difference).
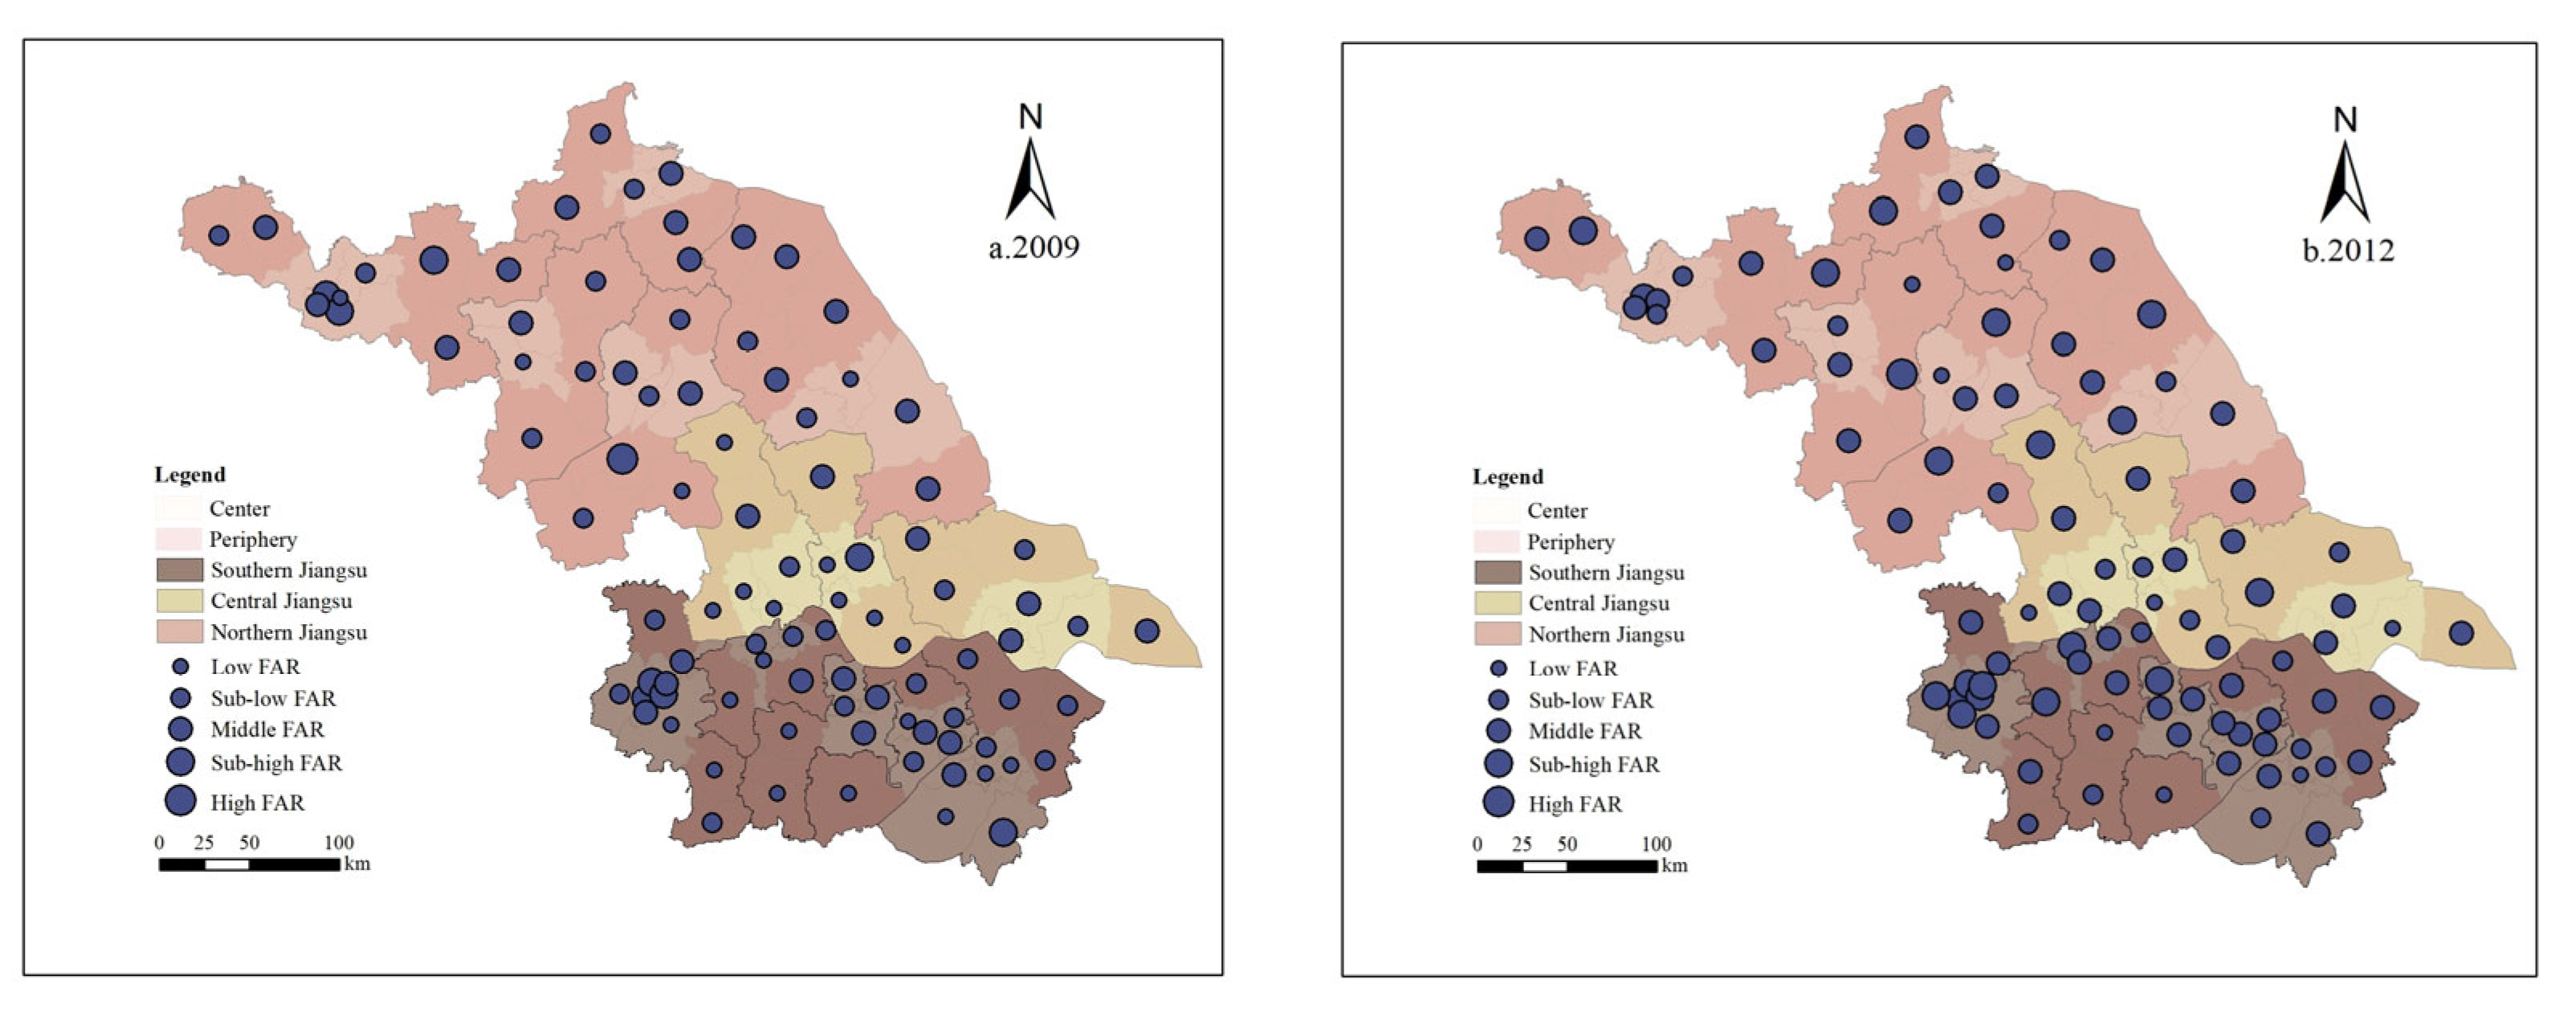
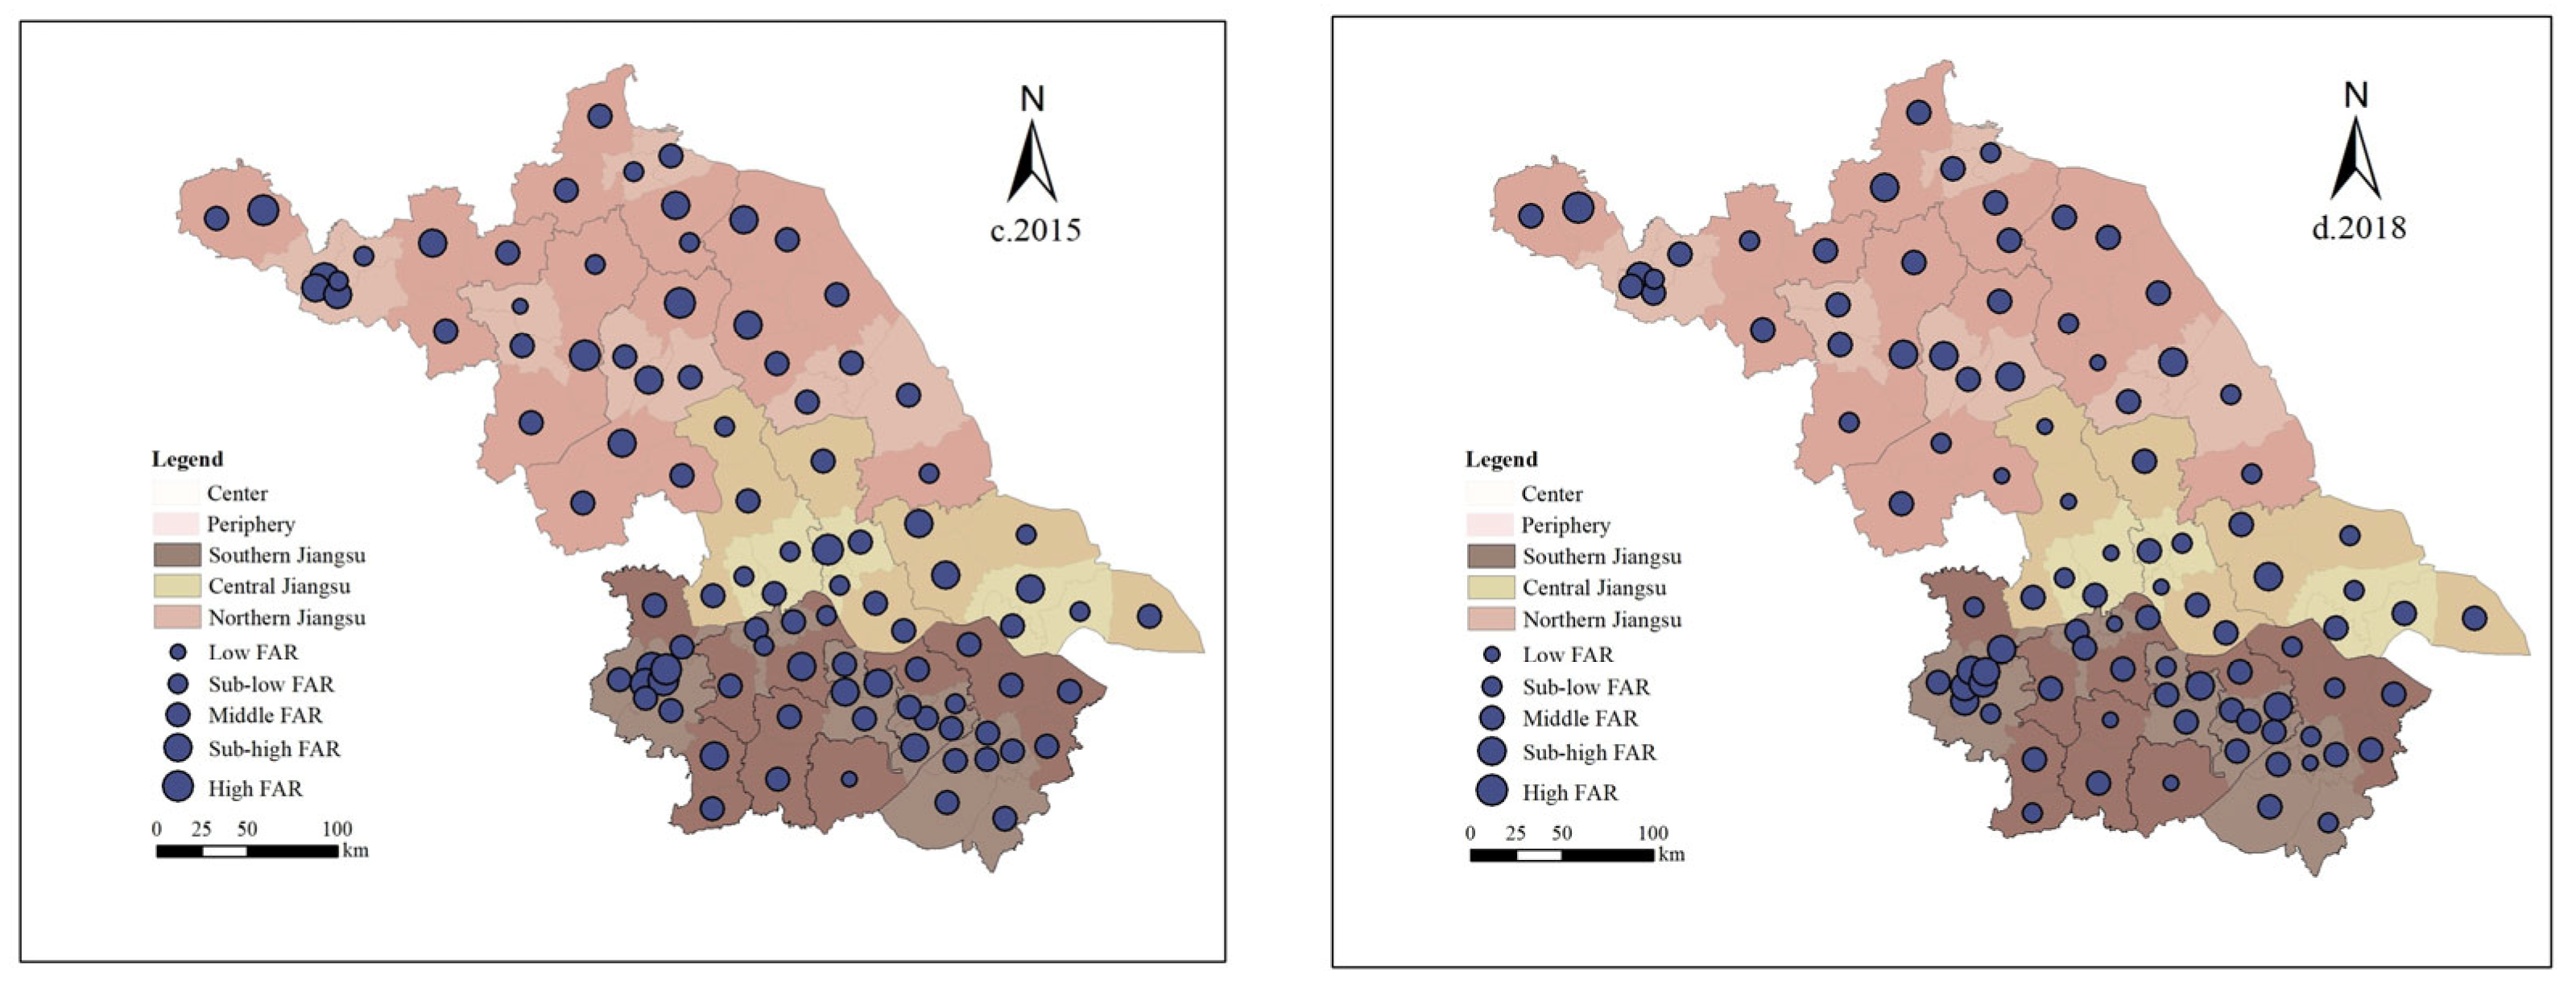
The degree of vertical expansion of districts and counties in Jiangsu Province in 2009, 2012, 2015 and 2018 were visualized via ArcGIS (Figure 5). Breakpoints were manually set to 1.5, 1.8, 2.4 and 3.0. Based on the average FAR of newly added residential land in China in the past ten years, combined with the current regulatory detailed planning of residential land, a plot ratio of 2.4 and below is a reasonable development intensity [25,31]. Figure 5 displays that the high-value areas (FAR > 2.4) of urban vertical expansion in Jiangsu Province were mainly concentrated in Northern Jiangsu and the center of Nanjing City, while the low-value areas (FAR ≤ 1.8) gradually shifted from Southern Jiangsu to Central Jiangsu. The median-value area distribution (1.8 < FAR ≤ 2.4) was relatively balanced. From 2009 to 2012, there was a relatively evident urban vertical expansion in Jiangsu Province. The number of high-value areas increased from 8 to 20, with suburban counties and cities (county-level cities) accounting for most of the newly added high-value areas. The pattern in 2015 was similar to that of 2012. Northern Jiangsu was the focal point for high-value areas, while vertical expansion in Central and Southern Jiangsu was gradual. The distribution of median-value areas was relatively balanced. In 2018, the degree of urban vertical expansion in Jiangsu Province showed the following pattern: Northern Jiangsu > Southern Jiangsu > Central Jiangsu. The degree of vertical expansion showed a decrease, and the number of high-value areas reduced from 25 to 15. The “cooling” policy had a significant impact on urban height.

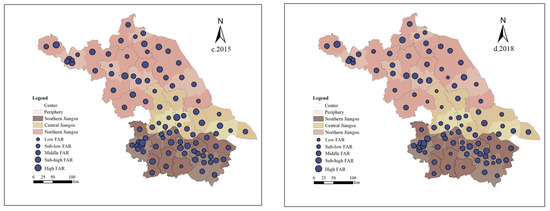
Figure 5.
Spatial distribution pattern of urban vertical expansion in Jiangsu Province. (from 2009 to 2018).
3.2. The Evolution Laws of Urban Vertical Expansion
To analyze and further reveal the spatial evolution process of urban vertical expansion intensity, we used α-convergence, β-convergence and club convergence.
3.2.1. Analysis of α-Convergence
We first calculated the average value and standard deviation of Jiangsu Province’s vertical expansion degree from 2009 to 2018 and used a formula to calculate the coefficient of variation of the vertical expansion degree.
Table 2 depicts that the coefficient of variation of urban vertical expansion in Jiangsu Province has a fluctuating downward trend that can be roughly divided into two stages: During the first phase, which lasted from 2009 to 2011, the coefficient of variation showed a “V” trend that decreased and then increased. In 2008, the Ministry of Housing and Urban–Rural Development issued a Notice on Strengthening the Management and Supervision and Inspection of the Floor Area Ratio of Construction Land (Jiangui (2008) No. 227). The local government began to strengthen the supervision and inspection of buildings’ FAR in May 2009. This led to the convergence of the degree of vertical expansion in various regions. However, from 2010 to 2011, the coefficient of variation suddenly rebounded. The reason for this was that the vertical expansion degree of counties and cities (county-level cities) closer to the central urban area increased rapidly. For example, Jurong City is adjacent to Qixia District in Nanjing City, and its degree of vertical expansion increased from 1.28 to 2.61. To obtain higher economic radiation intensity, counties and cities (county-level cities) chose land closer to big cities for development and attracted a large number of floating people who worked in big cities by offering low housing prices. Hence, the government intended to increase the residential plot ratio, which broke the original steady-state structure and caused the coefficient of variation to rapidly increase. The second phase, from 2012 to 2017, saw a decrease in the fluctuation of the coefficient of variation, which only recovered in 2015. The vertical expansion pattern of all districts (counties) in Jiangsu was stable. This may be because the Ministry of Housing and Urban–Rural Development issued Measures for the Administration of the Floor Area Ratio of Construction Land (Jiangui (2012) No. 22) in 2012. Subsequently, cities in Jiangsu Province introduced corresponding measures to further limit indicators such as floor height and FAR, effectively restricting the degree of vertical expansion. During this period, areas with a rapid increase in the degree of vertical expansion in the previous stage were effectively controlled. For example, the degree of vertical expansion in Jurong City dropped from 2.61 to 2.05.
Table 2.
The variation coefficient of urban vertical expansion in Jiangsu Province.
3.2.2. Analysis of β-Convergence
We used formula (2) to analyze the absolute β-convergence of the vertical expansion degree in 95 districts (counties) in Jiangsu Province and estimated the data at different periods. The results are shown in Table 3.
Table 3.
Estimation results of absolute β-convergence.
Table 3 shows that the estimation results for the three periods (i.e., 2009–2014, 2014–2018 and 2009–2018) were all significantly negative. Jiangsu Province’s urban vertical expansion depicted absolute β-convergence, with convergence rates of 0.255, 0.144 and 0.148. It should be noted that the β-convergence of three periods had different meanings. Between 2009–2014 and 2009–2018, the urban vertical expansion in Jiangsu Province showed an upward trend. During these two time periods, β-convergence meant that areas with a higher degree of expansion had a “trickle-down effect” relative to areas with a lower degree of expansion. Lower areas have caught up in urban vertical expansion, particularly between 2009 and 2014. Affected by policy regulation, the degree of vertical expansion generally showed a downward trend from 2014 to 2018. Due to the existence of β-convergence, areas with higher urban vertical expansion had a faster decline rate, resulting in value convergence with low-value areas. With the steady progress of ecological civilization construction and the continuous improvement of space management and control in recent years, the degree of vertical expansion in all parts of Jiangsu has shown a clear downward trend. The degree of urban vertical expansion is expected to gradually form a three-level ladder feature (“central urban area–suburban area–outer suburban area”) in the future, and a more reasonable urban development and construction pattern will emerge.
3.2.3. Analysis of Club Convergence
The 95 districts (counties) in Jiangsu Province were grouped according to their geographical location. Southern Jiangsu (SJ), Central Jiangsu (CJ) and Northern Jiangsu (NJ) are used as “clubs” for convergence analysis to further test whether there was club convergence in the degree of urban vertical expansion in Jiangsu Province. The results are shown in Table 4.
Table 4.
Estimation results of club convergence.
Table 4 displays that club convergence occurred in the three major regions of Southern Jiangsu, Central Jiangsu and Northern Jiangsu in most years. Club convergence in Southern and Northern Jiangsu had better temporal continuity and a faster convergence rate. The reason for this could be that Southern and Northern Jiangsu had a higher level of regional integration. For example, the integration of Nanjing, Zhenjiang and Yangzhou, as well as the integration of Suzhou, Wuxi and Changzhou, had already been listed as regional development strategies in Southern Jiangsu. Northern Jiangsu was vigorously promoting the construction of the Huaihai economic zone; Xuzhou is positioned as the economic zone’s central city, highlighting Suqian City and Huai’an City through its developed transportation network. Therefore, Southern and Northern Jiangsu had more advanced transportation networks and integration, resulting in a higher degree of internal convergence. Against the background of bipolar development, the “Collapse of Central Jiangsu” situation was also reflected. Despite its proximity to Southern Jiangsu, Taizhou City’s transportation center degree in the urban agglomeration was low [50]. Yangzhou relied more on the promotion of the Nanjing Metropolitan Circle and the integration of Nanjing, Zhenjiang and Yangzhou. Nantong City was part of the Shanghai metropolitan area and was greatly affected by it. Ultimately, the strength of internal connections and the convergence rate in Central Jiangsu were both low.
4. Analysis on the Influencing Factors of Urban Vertical Expansion
4.1. Analysis of Results
To systematically reveal the specific impact of each variable, we first estimated all samples (Model 1). Then, Model 2 was obtained after deleting the insignificant variable PD. In addition, considering the heterogeneity of different geographic units, subregional estimations were performed for Southern Jiangsu (Model 3), Central Jiangsu (Model 4) and Northern Jiangsu (Model 5). Given that the three major regions were divided by latitude, the LAT variable was excluded from the regional estimation to avoid interfering with the results. We first used the LSDV method to determine whether the individual dummy variables were significant. The results show that most individual dummy variables were significant, implying that the original hypothesis (H0: a mixed model should be established) was rejected. The fixed effects model (Model 1) was then determined using the Hausmann test (p-value less than 0.05). The subsequent models were also estimated according to this procedure, with Model 5 adopting OLS mixed estimation and the rest using fixed effects. Table 5 displays the regression results.
Table 5.
Estimated results of the model.
The estimated results reveal the following: (1) In Models 1 and 2, real estate development investment and economic structure had a significant positive impact on the degree of urban vertical expansion, which was consistent with the theoretical analysis. In addition, the quadratic regression coefficients for urban per capita disposable income and economic structure were both significantly negative. This meant that economic development and urban vertical expansion had an inverted U-shaped relationship. Inflection points were CNY 40,484 (UPCDI) and 0.649 (STRU) (Model 2). This finding corroborated the relevant research conclusion. The FAR of residential land first increased as economic development improved. When the economy develops to a certain level, residents will pursue greater comfort in their living conditions, resulting in a slowing or even a decline in the growth rate of residential FAR [31]. (2) The impact of slope and real estate development investment was positive and significant. Higher land leveling costs will increase the intensity of residential development. Furthermore, given the scarcity of land resources, the local government would appropriately increase the FAR of the transferred land. New urban districts with prominent positioning are important growth poles and city cards for future urban development and building heights are often higher. However, as the latitude increased, so did the building development intensity, which contradicted the theoretical analysis but was consistent with the results of the trend analysis (Figure 2) and related research [31,32]. (3) For the regional samples, the regression results show that the influencing factors in the three regions were quite different. Southern Jiangsu was greatly affected by economic development, while Central and Northern Jiangsu were heavily influenced by population density.
4.2. Discussion
As mentioned above, the setting of FAR was influenced to a certain extent by local government decision makers as a policy restriction; however, they still made decisions based on natural, economic and social factors. Moreover, due to different development statuses and development modes in various regions, decision makers in different places had diverse priorities in the setting of FAR. According to the estimation results of different regions in Jiangsu Province, the economy of Southern Jiangsu developed, and the setting of FAR in this region was more affected by the economy. On the one hand, urban per capita disposable income in Southern Jiangsu was higher and residents’ purchasing power was stronger; they were willing to pursue low-density housing [31]. On the other hand, relevant studies indicated that an increase in FAR was often accompanied by a decline in house prices [51]. Moreover, local governments were willing to obtain more benefits under the premise of ensuring the stability of the real estate market and the incentive of economic development, resulting in an inverted “U” relationship between economic development and urban vertical expansion. This relationship did not fully appear in Northern and Central Jiangsu. Only the indicator of urban disposable income had a nonlinear impact on urban vertical expansion in Northern Jiangsu. In Central Jiangsu, there was a single linear relationship between economic development and urban vertical expansion. From 2009 to 2018, the population growth rates in city proper in Central and Northern Jiangsu reached 4.6% and 5.6%3, respectively, significantly higher than the 2.8% growth rate in Southern Jiangsu. The rapid process of population urbanization stimulated demand for housing, but the amount of land available for sale by local governments each year was limited. Thus, local governments paid more attention to the impact of population, and by increasing the setting of residential land’s FAR, the residential construction area could be raised, allowing for more population to be absorbed. This also explains why the population density in Central and Northern Jiangsu significantly improved the degree of urban vertical expansion. It is also worth mentioning that this paper’s results were in line with the existing relevant studies. For example, Zhou found that the impact of economic factors on urban vertical expansion was only significant in East and Northeast China (relatively developed regions), while the impact of population was only significant in Central China (lagging behind the eastern region) [31]. Moreover, Zambon’s research showed that the economic impact of urban vertical expansion was increasing over time, while the population impact was gradually weakening [32]. In addition, it can be found from the FAR-setting system in other countries that the influencing factors behind it were different. The setting of FAR in China [31], India [52] and Japan [8] were strictly controlled by the government because land resources in these countries are scarce and the relationship between people and land was tense. Consequently, governments needed to consider factors such as population, environment and economic development, make the best decision and promote sustainable urban development through target restrictions. In some countries where the contradiction between people and land is not as strong (such as the United States), the setting of FAR is more flexible [53], and the urban vertical expansion of cities is more affected by economic factors [54].
5. Conclusions
This paper used the FAR of newly added residential land to characterize the degree of urban vertical expansion. First, we used trend and convergence analyses to explore the spatiotemporal evolution characteristics of urban vertical expansion in Jiangsu Province from 2009 to 2018. Subsequently, an empirical model was constructed to further investigate the factors influencing the urban vertical expansion. The research conclusions are as follows: (1) The degree of urban vertical expansion in Jiangsu Province presented an inverted “U” characteristic. The lowest value was 1.81 in 2009, and the highest value appeared in 2015. The degree of urban vertical expansion gradually decreased after 2015. In terms of spatial distribution, Jiangsu Province’s urban vertical expansion depicted the following pattern: Northern Jiangsu > Southern Jiangsu > Central Jiangsu, with the extent of expansion in the west being higher than that in the east. From a “center-periphery” perspective, the vertical expansion of peripheral counties (county-level cities) in 2009 was lower than that of the central urban area. However, the degree of vertical expansion of peripheral counties (county-level cities) grew faster and surpassed that of central urban areas in 2013 but then declined after 2015. In addition, there was the phenomenon of rapid urban vertical expansion in suburban counties (county-level cities) near large cities’ central areas. For example, Jurong City (county-level city) was adjacent to Nanjing City’s Qixia District, and its degree of urban vertical expansion increased from 1.28 in 2009 to 2.61 in 2011. (2) With the continuous advancement of regional integration and the construction of urban agglomerations, the degree of vertical expansion of Jiangsu cities had a relatively evident β-convergence. The convergence rate was the fastest in 2009–2014, reaching 0.255. At the same time, there was a club convergence phenomenon in Southern, Central and Northern Jiangsu; the convergence rate was fast in the north and south but slow in the middle. (3) The econometric models’ estimated results reveal that real estate development investment and slope had a significant positive impact on the degree of urban vertical expansion in Jiangsu Province. Economic development had a nonlinear effect on urban vertical expansion. In the initial stage of economic development, the degree of vertical expansion increased with economic growth. However, when the economy reached a certain stage, residents were more willing to pursue low-density (FAR) living space, and the degree of vertical expansion decreases with economic development.
This paper established the spatiotemporal evolution characteristics of urban vertical expansion at the regional scale and explored the factors influencing urban vertical expansion, and its results shed light on how China and other countries can systematically promote and improve the level of urban construction. On the one hand, we should strengthen the control of FAR of various urban land in the process of promoting urbanization. For example, in seeking economic development, local governments in China increased the FAR setting of commercial and residential land to obtain higher land-sales revenue, while decreased the FAR setting of industrial land to attract more companies to settle in the city [55,56]. As a result, the FAR of residential land in China’s big cities FAR exceeded that of other central cities in countries with scarce land resources (such as Seoul, South Korea) [33]. However, the low-density development of industrial land is widespread [16]. Therefore, in the future, local governments must further optimize the scientificity of the FAR setting of various types of land to effectively ensure high-quality development. On the other hand, more research into urban vertical expansion and its changes is necessary. Urban expansion is a three-dimensional expansion process. It is difficult to comprehensively measure the level and characteristics of urban expansion by only considering the horizontal dimension. It is essential to examine the characteristics of urban expansion in multiple dimensions. Internet data, cadastral data, land transaction data, radar scanning imaging and other data should be used to analyze the characteristics of urban vertical expansion. In terms of land use types, it is also necessary to expand from residential to commercial, industrial and other types of land. In addition to paying attention to the above-ground space, underground space analysis is an important part of urban development that cannot be overlooked.
It is worth noting that this study initially explored the spatiotemporal evolution characteristics of urban vertical expansion on a mesoscale using Jiangsu Province as an example; deficiencies were inevitable: First, the research area’s typicality and representativeness can be improved. In the future, it will be necessary to explore more regions. Second, this article only considered the FAR of newly added residential land and lacks comprehensive consideration of other types of land.
Author Contributions
Conceptualization, N.W. and Z.C.; methodology, N.W.; software, N.W.; validation, Z.C., T.L. and M.Z.; formal analysis, Z.C.; data curation, T.L.; writing—original draft preparation, N.W.; writing—review and editing, Z.C.; visualization, N.W.; supervision, Z.C., T.L. and M.Z.; funding acquisition, Z.C. All authors have read and agreed to the published version of the manuscript.
Funding
This research was funded by the National Natural Science Foundation of China (Grant Number: 42171244) and the research project of China Land Surveying and Planning Institute (20201211977, 2017041101371).
Institutional Review Board Statement
Not applicable.
Informed Consent Statement
Not applicable.
Data Availability Statement
The data that support the findings of this study are available from the author upon reasonable request.
Conflicts of Interest
The authors declare no conflict of interest.
Notes
| 1 | Data source: China Urban Construction Statistical Yearbook (2001, 2020). |
| 2 | Data source: China Urban Construction Statistical Yearbook (2020). |
| 3 | Data source: China Urban Construction Statistical Yearbook (2009, 2018). |
References
- Yue, W.; Liu, Y.; Fan, P. Measuring urban sprawl and its drivers in large Chinese cities: The case of Hangzhou. Land Use Policy 2013, 31, 358–370. [Google Scholar] [CrossRef]
- Chen, M.; Liu, W.; Tao, X. Evolution and assessment on China’s urbanization 1960–2010: Under-urbanization or over-urbanization? Habitat Int. 2013, 38, 25–33. [Google Scholar] [CrossRef]
- Sun, P.; Song, W.; Xiu, C.; Liang, Z. Non-coordination in China’s urbanization: Assessment and affecting factors. Chin. Geogr. Sci. 2013, 23, 729–739. [Google Scholar] [CrossRef] [Green Version]
- Chen, Y.; Chen, Z.; Xu, G.; Tian, Z. Built-up land efficiency in urban China: Insights from the General Land Use Plan (2006–2020). Habitat Int. 2016, 51, 31–38. [Google Scholar] [CrossRef]
- Dadashpoor, H.; Azizi, P.; Moghadasi, M. Land use change, urbanization, and change in landscape pattern in a metropolitan area. Sci. Total Environ. 2019, 655, 707–719. [Google Scholar] [CrossRef] [PubMed]
- Liu, Z.; Liu, S.; Qi, W.; Jin, H. Urban sprawl among Chinese cities of different population sizes. Habitat Int. 2018, 79, 89–98. [Google Scholar] [CrossRef]
- Yuan, C.; Ng, E.; Norford, L.K. Improving air quality in high-density cities by understanding the relationship between air pollutant dispersion and urban morphologies. Build. Environ. 2014, 71, 245–258. [Google Scholar] [CrossRef]
- Joshi, K.K.; Kono, T. Optimization of floor area ratio regulation in a growing city. Reg. Sci. Urban Econ. 2009, 39, 502–511. [Google Scholar] [CrossRef]
- He, Q.; Liu, Y.; Zeng, C.; Yin, C.; Tan, R. Simultaneously simulate vertical and horizontal expansions of a future urban landscape: A case study in Wuhan, Central China. Int. J. Geogr. Inf. Sci. 2017, 31, 1907–1928. [Google Scholar] [CrossRef]
- Qin, J.; Fang, C.; Wang, Y.; Li, G.; Wang, S. Evaluation of three-dimensional urban expansion: A case study of Yangzhou City, Jiangsu Province, China. Chin. Geogr. Sci. 2015, 25, 224–236. [Google Scholar] [CrossRef]
- Luan, Q.; Jiang, W.; Liu, S.; Guo, H. Impact of Urban 3D Morphology on Particulate Matter 2.5 (PM2.5) Concentrations: Case Study of Beijing, China. Chin. Geogr. Sci. 2020, 30, 294–308. [Google Scholar] [CrossRef]
- Fan, J.; Zhou, L. Three-dimensional intergovernmental competition and urban sprawl: Evidence from Chinese prefectural-level cities. Land Use Policy 2019, 87, 104035. [Google Scholar] [CrossRef]
- Pan, X.-Z.; Zhao, Q.-G.; Chen, J.; Liang, Y.; Sun, B. Analyzing the Variation of Building Density Using High Spatial Resolution Satellite Images: The Example of Shanghai City. Sensors 2008, 8, 2541. [Google Scholar] [CrossRef] [PubMed] [Green Version]
- Yue, W.; Zhang, L.; Liu, Y. Measuring sprawl in large Chinese cities along the Yangtze River via combined single and multidimensional metrics. Habitat Int. 2016, 57, 43–52. [Google Scholar] [CrossRef]
- Schneider, A.; Chang, C.; Paulsen, K. The changing spatial form of cities in Western China. Landsc. Urban Plan. 2015, 135, 40–61. [Google Scholar] [CrossRef]
- Zhang, J. Comparison of plot ratio of construction land in large cities at home and abroad. Urban Probl. 2015, 4, 12–16. [Google Scholar] [CrossRef]
- Long, Y.; Gu, Y.; Han, H. Spatiotemporal heterogeneity of urban planning implementation effectiveness: Evidence from five urban master plans of Beijing. Landsc. Urban Plan. 2012, 108, 103–111. [Google Scholar] [CrossRef]
- Deng, F.; Huang, Y. Uneven Land Reform and Urban Sprawl in China: The Case of Beijing. Prog. Plan. 2004, 61, 211–236. [Google Scholar] [CrossRef]
- Xiao, J.; Shen, Y.; Ge, J.; Tateishi, R.; Tang, C.; Liang, Y.; Huang, Z. Evaluating urban expansion and land use change in Shijiazhuang, China, by using GIS and remote sensing. Landsc. Urban Plan. 2006, 75, 69–80. [Google Scholar] [CrossRef]
- Zhang, Z.; Liu, F.; Zhao, X.; Wang, X.; Shi, L.; Xu, J.; Yu, S.; Wen, Q.; Zuo, L.; Yi, L.; et al. Urban Expansion in China Based on Remote Sensing Technology: A Review. Chin. Geogr. Sci. 2018, 28, 727–743. [Google Scholar] [CrossRef] [Green Version]
- Xu, Q.; Zheng, X.; Zhang, C. Quantitative Analysis of the Determinants Influencing Urban Expansion: A Case Study in Beijing, China. Sustainability 2018, 10, 1630. [Google Scholar] [CrossRef] [Green Version]
- Salem, M.; Bose, A.; Bashir, B.; Basak, D.; Roy, S.; Chowdhury, I.R.; Alsalman, A.; Tsurusaki, N. Urban Expansion Simulation Based on Various Driving Factors Using a Logistic Regression Model: Delhi as a Case Study. Sustainability 2021, 13, 805. [Google Scholar] [CrossRef]
- Guo, J.; Sun, B.; Qin, Z.; Wong, S.W.; Wong, M.S.; Yeung, C.W.; Shen, Q. A study of plot ratio/building height restrictions in high density cities using 3D spatial analysis technology: A case in Hong Kong. Habitat Int. 2017, 65, 13–31. [Google Scholar] [CrossRef] [Green Version]
- Zhang, W.; Li, W.; Zhang, C.; Hanink, D.M.; Liu, Y.; Zhai, R. Analyzing horizontal and vertical urban expansions in three East Asian megacities with the SS-coMCRF model. Landsc. Urban Plan. 2018, 177, 114–127. [Google Scholar] [CrossRef]
- He, S.; Wang, X.; Dong, J.; Wei, B.; Duan, H.; Jiao, J.; Xie, Y. Three-Dimensional Urban Expansion Analysis of Valley-Type Cities: A Case Study of Chengguan District, Lanzhou, China. Sustainability 2019, 11, 5663. [Google Scholar] [CrossRef] [Green Version]
- Barr, J.; Cohen, J.P. The floor area ratio gradient: New York City, 1890–2009. Reg. Sci. Urban Econ. 2014, 48, 110–119. [Google Scholar] [CrossRef]
- Handayani, H.H.; Murayama, Y.; Ranagalage, M.; Liu, F.; Dissanayake, D. Geospatial Analysis of Horizontal and Vertical Urban Expansion Using Multi-Spatial Resolution Data: A Case Study of Surabaya, Indonesia. Remote Sens. 2018, 10, 1599. [Google Scholar] [CrossRef] [Green Version]
- Li, S.Y.; Wu, Z.F.; Li, B.Y.; Liu, Y.L. The spatial and temporal characteristics of residential floor area ratio in metropolitan at multi-scales based on Internet real estate data:Case study of Guangzhou. Geogr. Res. 2016, 35, 770–780. [Google Scholar] [CrossRef]
- Li, X.M.; Zhang, D.H.; Tian, S.Z.; Sun, H.; Wang, M. Study on spatial-temporal differentiation of plot ratio of urban residential areas -- a case study of four districts in Dalian. Geogr. Res. 2018, 38, 531–538. [Google Scholar] [CrossRef]
- Zheng, Z.; Zhou, W.; Wang, J.; Hu, X.; Qian, Y. Sixty-Year Changes in Residential Landscapes in Beijing: A Perspective from Both the Horizontal (2D) and Vertical (3D) Dimensions. Remote Sens. 2017, 9, 992. [Google Scholar] [CrossRef] [Green Version]
- Zhou, D.; Li, Z.; Wang, S.; Tian, Y.; Zhang, Y.; Jiang, G. How does the newly urban residential built-up density differ across Chinese cities under rapid urban expansion? Evidence from residential FAR and statistical data from 2007 to 2016. Land Use Policy 2021, 104, 105365. [Google Scholar] [CrossRef]
- Zambon, I.; Colantoni, A.; Salvati, L. Horizontal vs vertical growth: Understanding latent patterns of urban expansion in large metropolitan regions. Sci. Total Environ. 2019, 654, 778–785. [Google Scholar] [CrossRef] [PubMed]
- Yu, B.; Liu, H.; Wu, J.; Hu, Y.; Zhang, L. Automated derivation of urban building density information using airborne LiDAR data and object-based method. Landsc. Urban Plan. 2010, 98, 210–219. [Google Scholar] [CrossRef]
- Yoshida, H.; Omae, M. An approach for analysis of urban morphology: Methods to derive morphological properties of city blocks by using an urban landscape model and their interpretations. Comput. Environ. Urban Syst. 2005, 29, 223–247. [Google Scholar] [CrossRef]
- Weiss, M.A. Skyscraper Zoning: New York’s Pioneering Role. J. Am. Plan. Assoc. 1992, 58, 201–212. [Google Scholar] [CrossRef]
- Wheaton, W.C. Land Use and Density in Cities with Congestion. J. Urban Econ. 1998, 43, 258–272. [Google Scholar] [CrossRef] [Green Version]
- Gao, X.; Asami, Y.; Katsumata, W. Evaluating Land-Use Restrictions concerning the Floor Area Ratio of Lots. Environ. Plan. C Gov. Policy 2006, 24, 515–532. [Google Scholar] [CrossRef] [Green Version]
- Grace Wong, K.M. Vertical cities as a solution for land scarcity: The tallest public housing development in Singapore. Urban Design Int. 2004, 9, 17–30. [Google Scholar] [CrossRef]
- Zhang, P. Spatiotemporal Features of the Three-Dimensional Architectural Landscape in Qingdao, China. PLoS ONE 2015, 10, e0137853. [Google Scholar] [CrossRef] [Green Version]
- Vojinović, B.; Acharya, S.; Próchniak, M.J.H.J.O.E. Convergence analysis among the ten European transition economies. Hitotsubashi J. Econ. 2009, 50, 123–141. [Google Scholar]
- Yin, S.G.; Yang, S.; Chen, Y.R.; Bai, C.Q. Spatial-temporal evolution patterns and convergence analysis housing priceto-income ratio in Yangtze River Delta. Geogr. Res. 2020, 39, 2521–2536. [Google Scholar] [CrossRef]
- Ye, J.J. Research on Regional Differences, Distribution Dynamics and Convergence of Consumption Upgrading in China. Inq. Imto Econ. Issues 2021, 4, 12–26. [Google Scholar]
- Holmes, M.J.; Otero, J.; Panagiotidis, T. Property heterogeneity and convergence club formation among local house prices. J. Hous. Econ. 2019, 43, 1–13. [Google Scholar] [CrossRef]
- Erdogan, S.; Okumus, I. Stochastic and club convergence of ecological footprint: An empirical analysis for different income group of countries. Ecol. Indic. 2021, 121, 107123. [Google Scholar] [CrossRef]
- Tian, Y.; Zhou, D.; Jiang, G. A new quality management system of admittance indicators to improve industrial land use efficiency in the Beijing−Tianjin−Hebei region. Land Use Policy 2021, 107, 105456. [Google Scholar] [CrossRef]
- Kono, T.; Kaneko, T.; Morisugi, H. Necessity of minimum floor area ratio regulation: A second-best policy. Ann. Reg. Sci. 2010, 44, 523–539. [Google Scholar] [CrossRef]
- Gao, Y.; Tian, L.; Cao, Y.; Zhou, L.; Li, Z.; Hou, D. Supplying social infrastructure land for satisfying public needs or leasing residential land? A study of local government choices in China. Land Use Policy 2019, 87, 104088. [Google Scholar] [CrossRef]
- Frantz, D.; Schug, F.; Okujeni, A.; Navacchi, C.; Wagner, W.; van der Linden, S.; Hostert, P. National-scale mapping of building height using Sentinel-1 and Sentinel-2 time series. Remote Sens. Environ. 2021, 252, 112128. [Google Scholar] [CrossRef] [PubMed]
- Fan, J.; Zhou, L.; Yu, X.; Zhang, Y. Impact of land quota and land supply structure on China’s housing prices: Quasi-natural experiment based on land quota policy adjustment. Land Use Policy 2021, 106, 105452. [Google Scholar] [CrossRef]
- Fang, D.C.; Sun, M.Y. The reconstruction of the spatial structure of the Yangtze River Delta city group in the high-speed railera—Based on the social network analysis. Econ. Geogr. 2015, 35, 50–56. [Google Scholar] [CrossRef]
- Asabere, P.K. The Determinants of Land Values in an African City: The Case of Accra, Ghana. Land Econ. 1981, 57, 385–397. [Google Scholar] [CrossRef]
- Shenvi, A.; Slangen, R.H. Enabling Smart Urban Redevelopment in India through Floor Area Ratio Incentives. 2018. Available online: http://resp.llas.ac.cn/C666/handle/2XK7JSWQ/235510 (accessed on 1 February 2022).
- Lv, Y.T. A Comparative study of land development rights and their transfer systems in the three countries of Britain, the United States and France. World Agric. 2016, 11, 98–102. [Google Scholar] [CrossRef]
- Moon, B. The effect of FAR (floor area ratio) regulations on land values: The case of New York. Pap. Reg. Sci. 2019, 98, 2343–2354. [Google Scholar] [CrossRef]
- Liu, Y.; Fan, P.; Yue, W.; Song, Y. Impacts of land finance on urban sprawl in China: The case of Chongqing. Land Use Policy 2018, 72, 420–432. [Google Scholar] [CrossRef]
- Liu, Y.; Gao, H.; Cai, J.; Lu, Y.; Fan, Z. Urbanization path, housing price and land finance: International experience and China’s facts. Land Use Policy 2022, 113, 105866. [Google Scholar] [CrossRef]


Publisher’s Note: MDPI stays neutral with regard to jurisdictional claims in published maps and institutional affiliations. |
© 2022 by the authors. Licensee MDPI, Basel, Switzerland. This article is an open access article distributed under the terms and conditions of the Creative Commons Attribution (CC BY) license (https://creativecommons.org/licenses/by/4.0/).