
Exploratory Analysis on the Spatial Distribution and Influencing Factors of Beitang Landscape in the Shangzhuang Basin


Abstract
:1. Introduction
- (1)
- What are the structural characteristics of the Beitang landscape in Huizhou area? Under different landform types, soil types, and vegetation types, what kind of Beitang structure models have been adopted for adaption?
- (2)
- Within a specific range, what are the spatial distribution characteristics of the Beitang landscape? What kind of structural model does this distribution feature correspond to? How does the Beitang landscape system composed of different structural models work?
- (1)
- Study the spatial distribution and landscape characteristics of Beitang landscapes in hilly and mountainous regions and summarize the structural models of different types of Beitang landscapes.
- (2)
- Take a small watershed in the Shangzhuang Basin as an example to quantitatively analyze the characteristics and structural patterns of the Beitang landscape in the study area.
2. Related Work
3. Materials and Methods
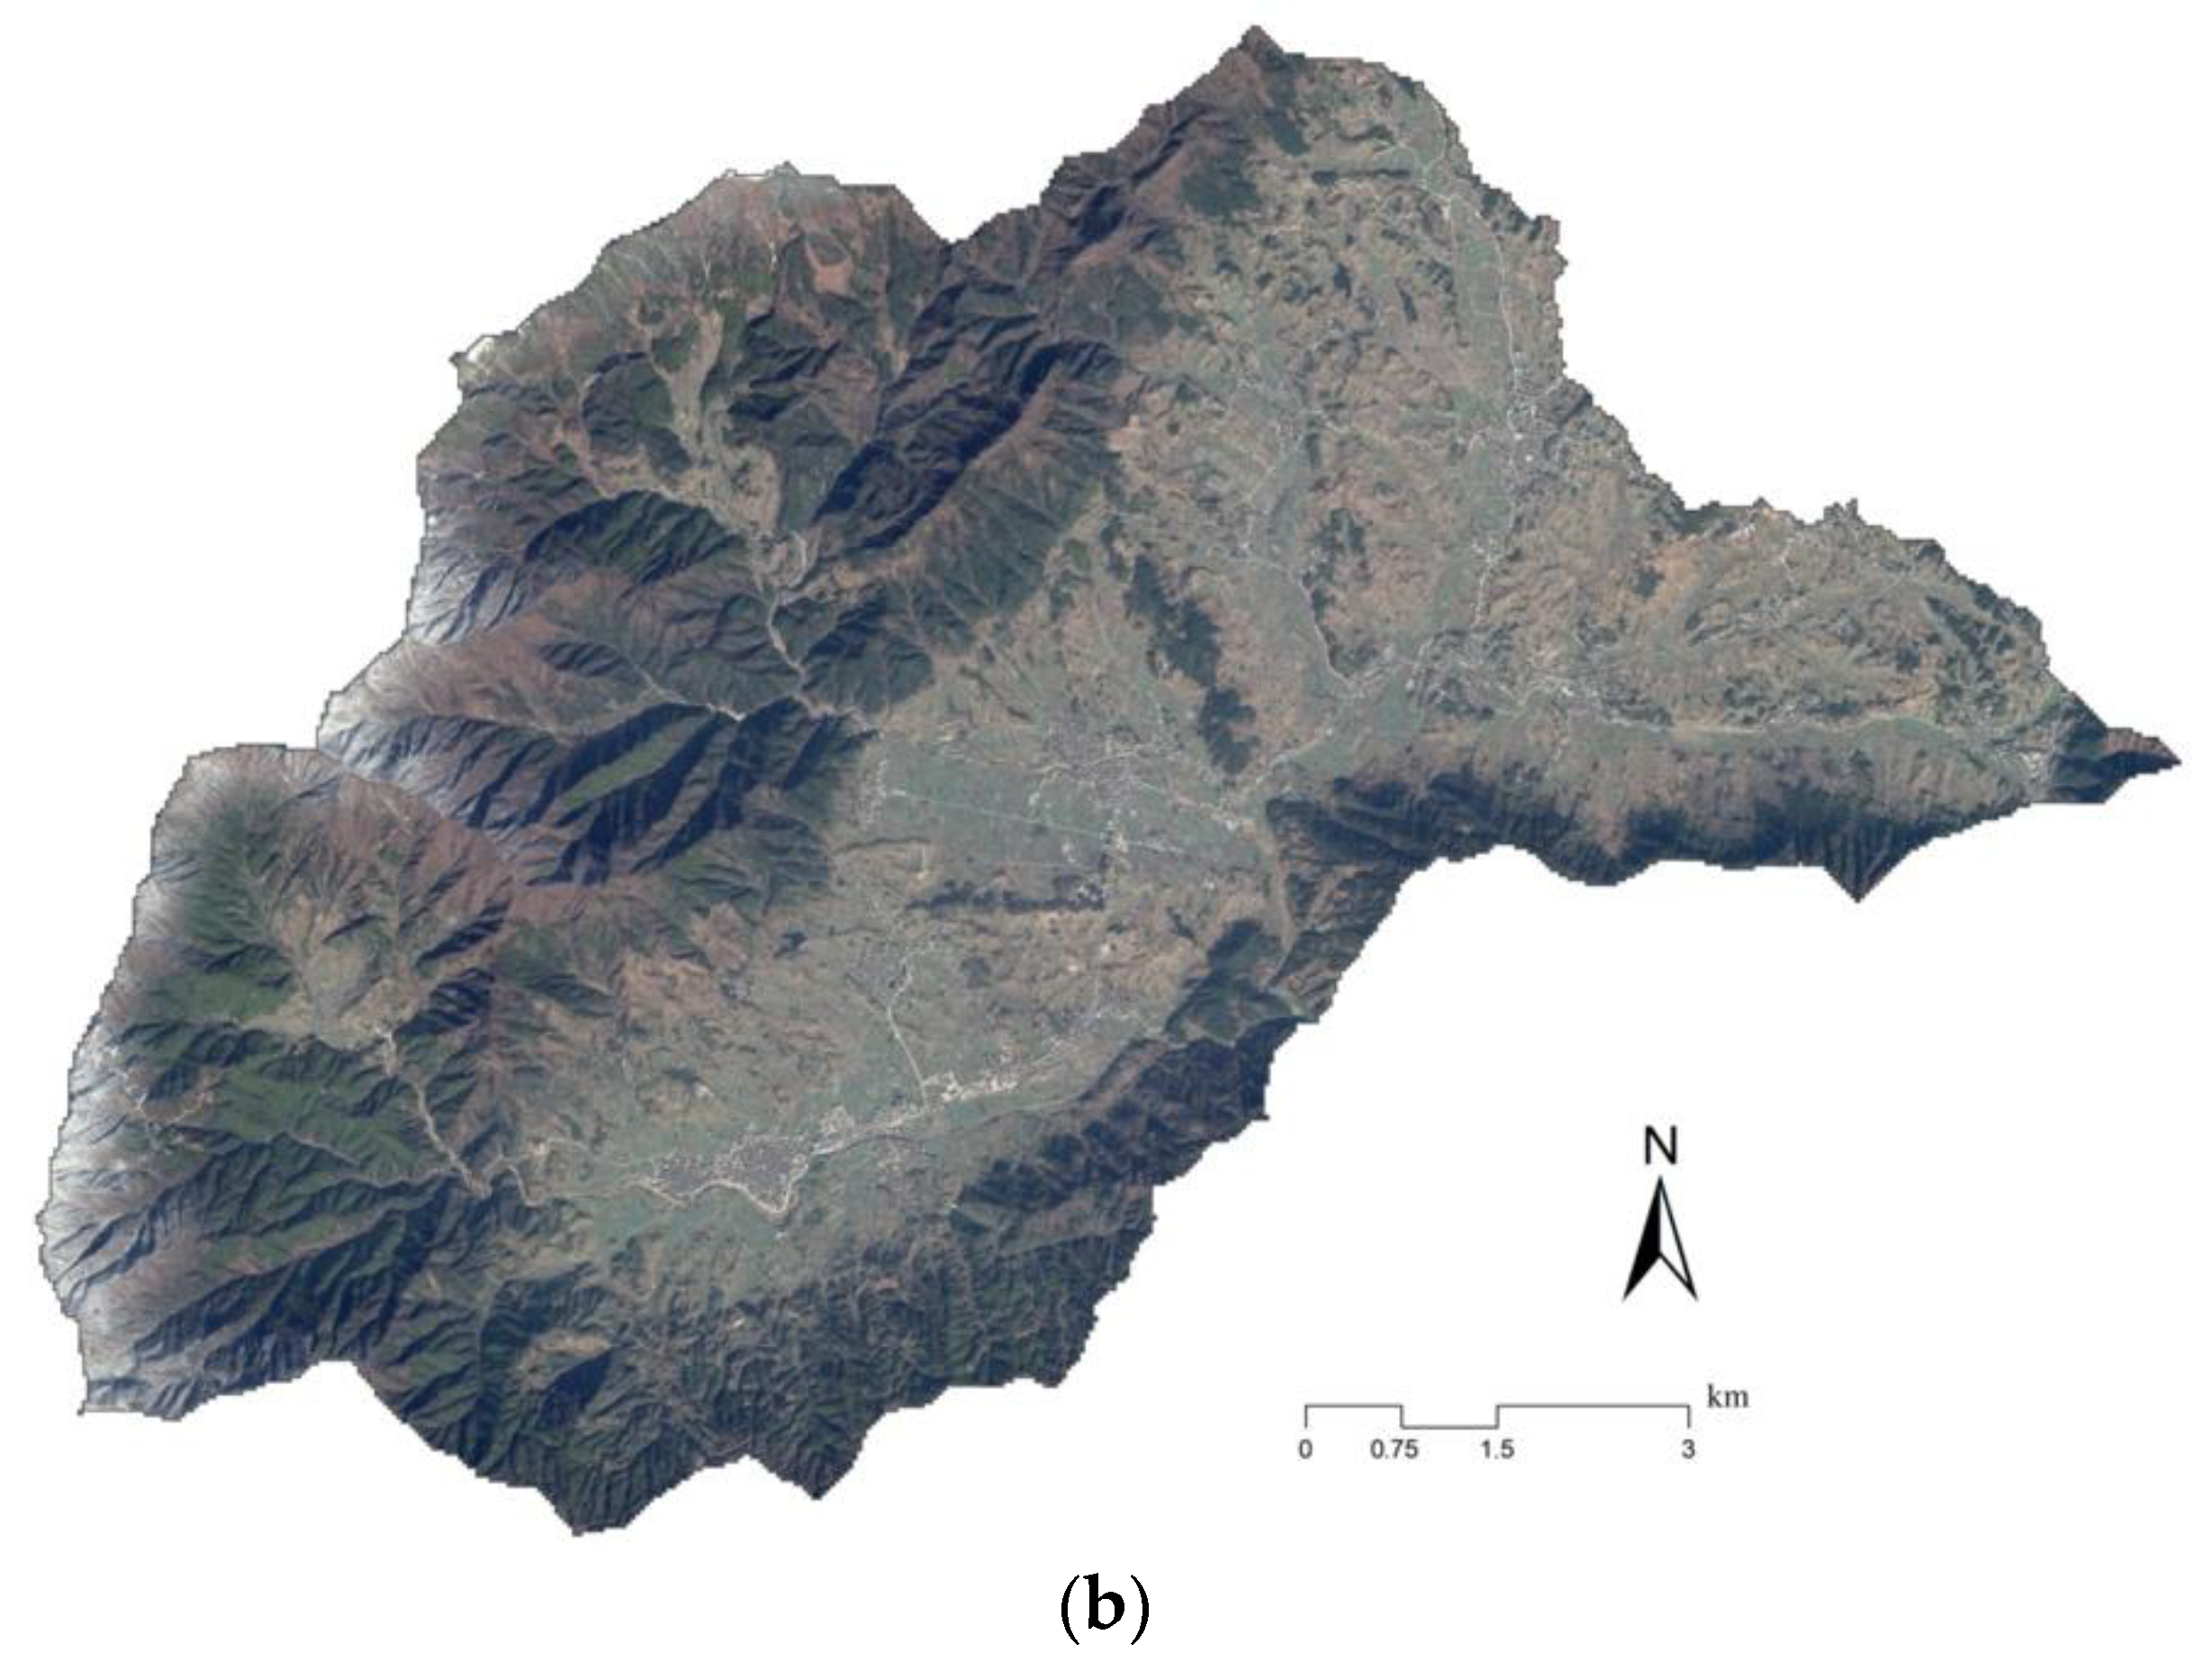
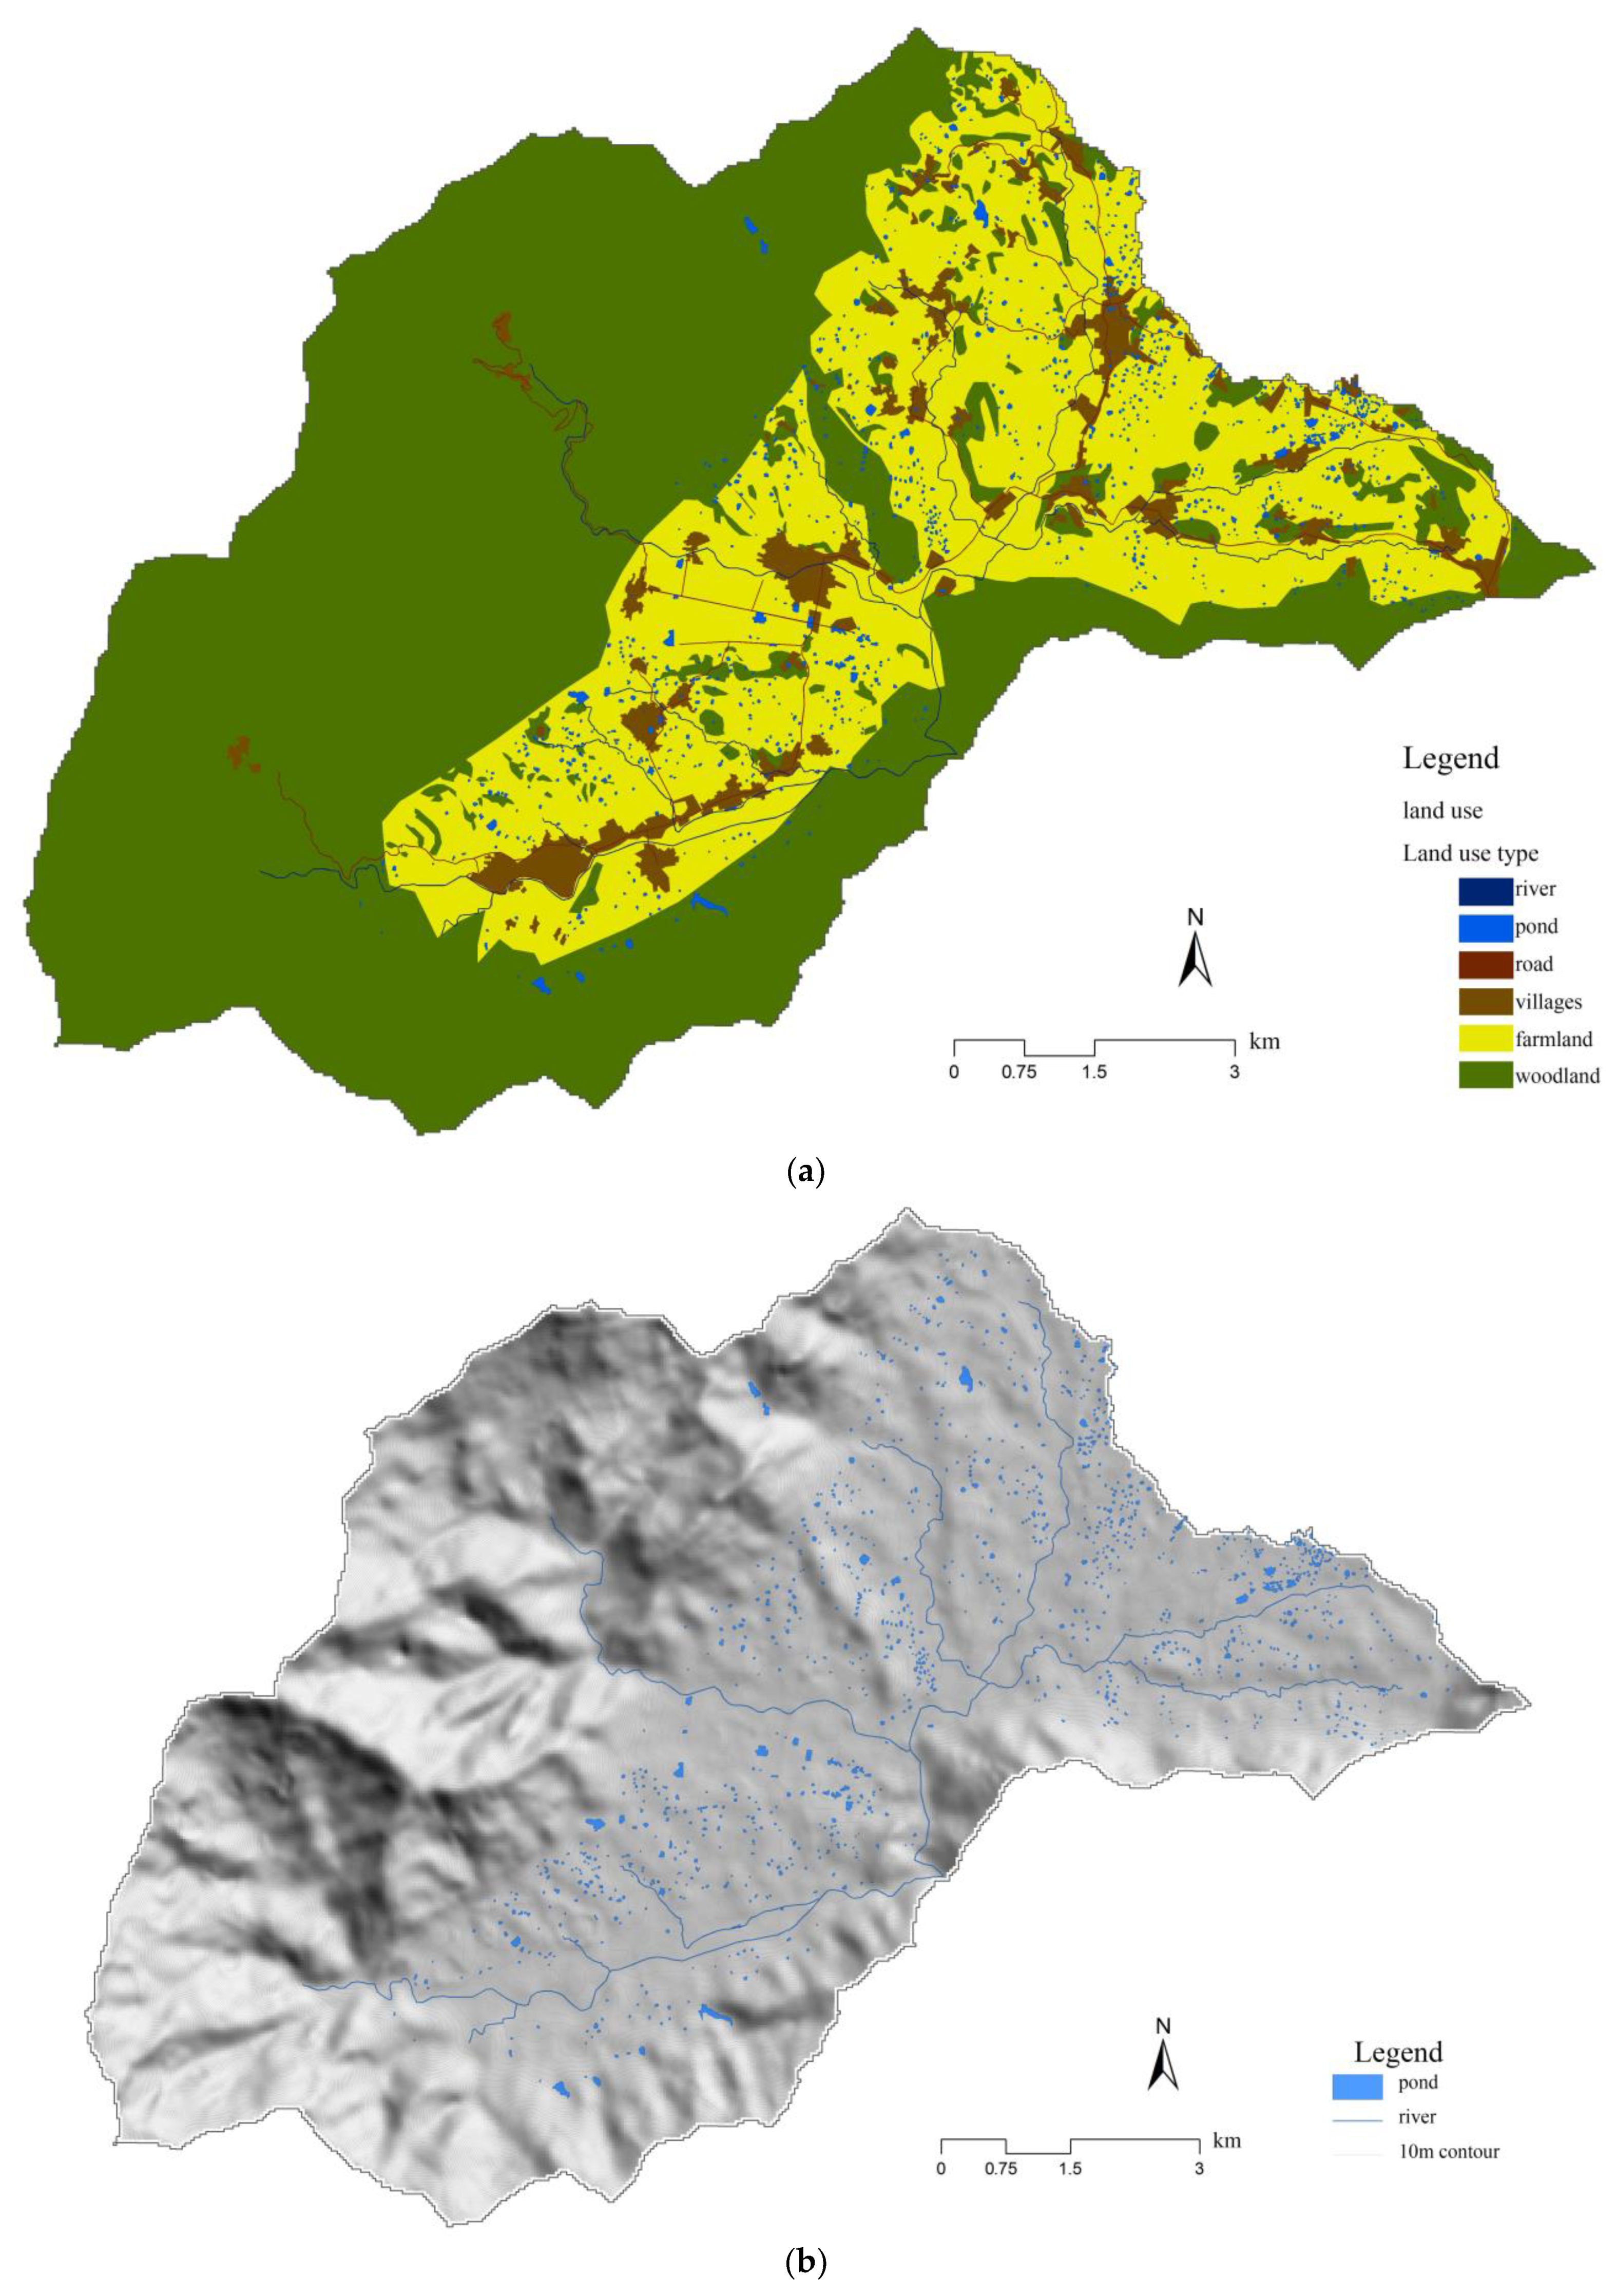
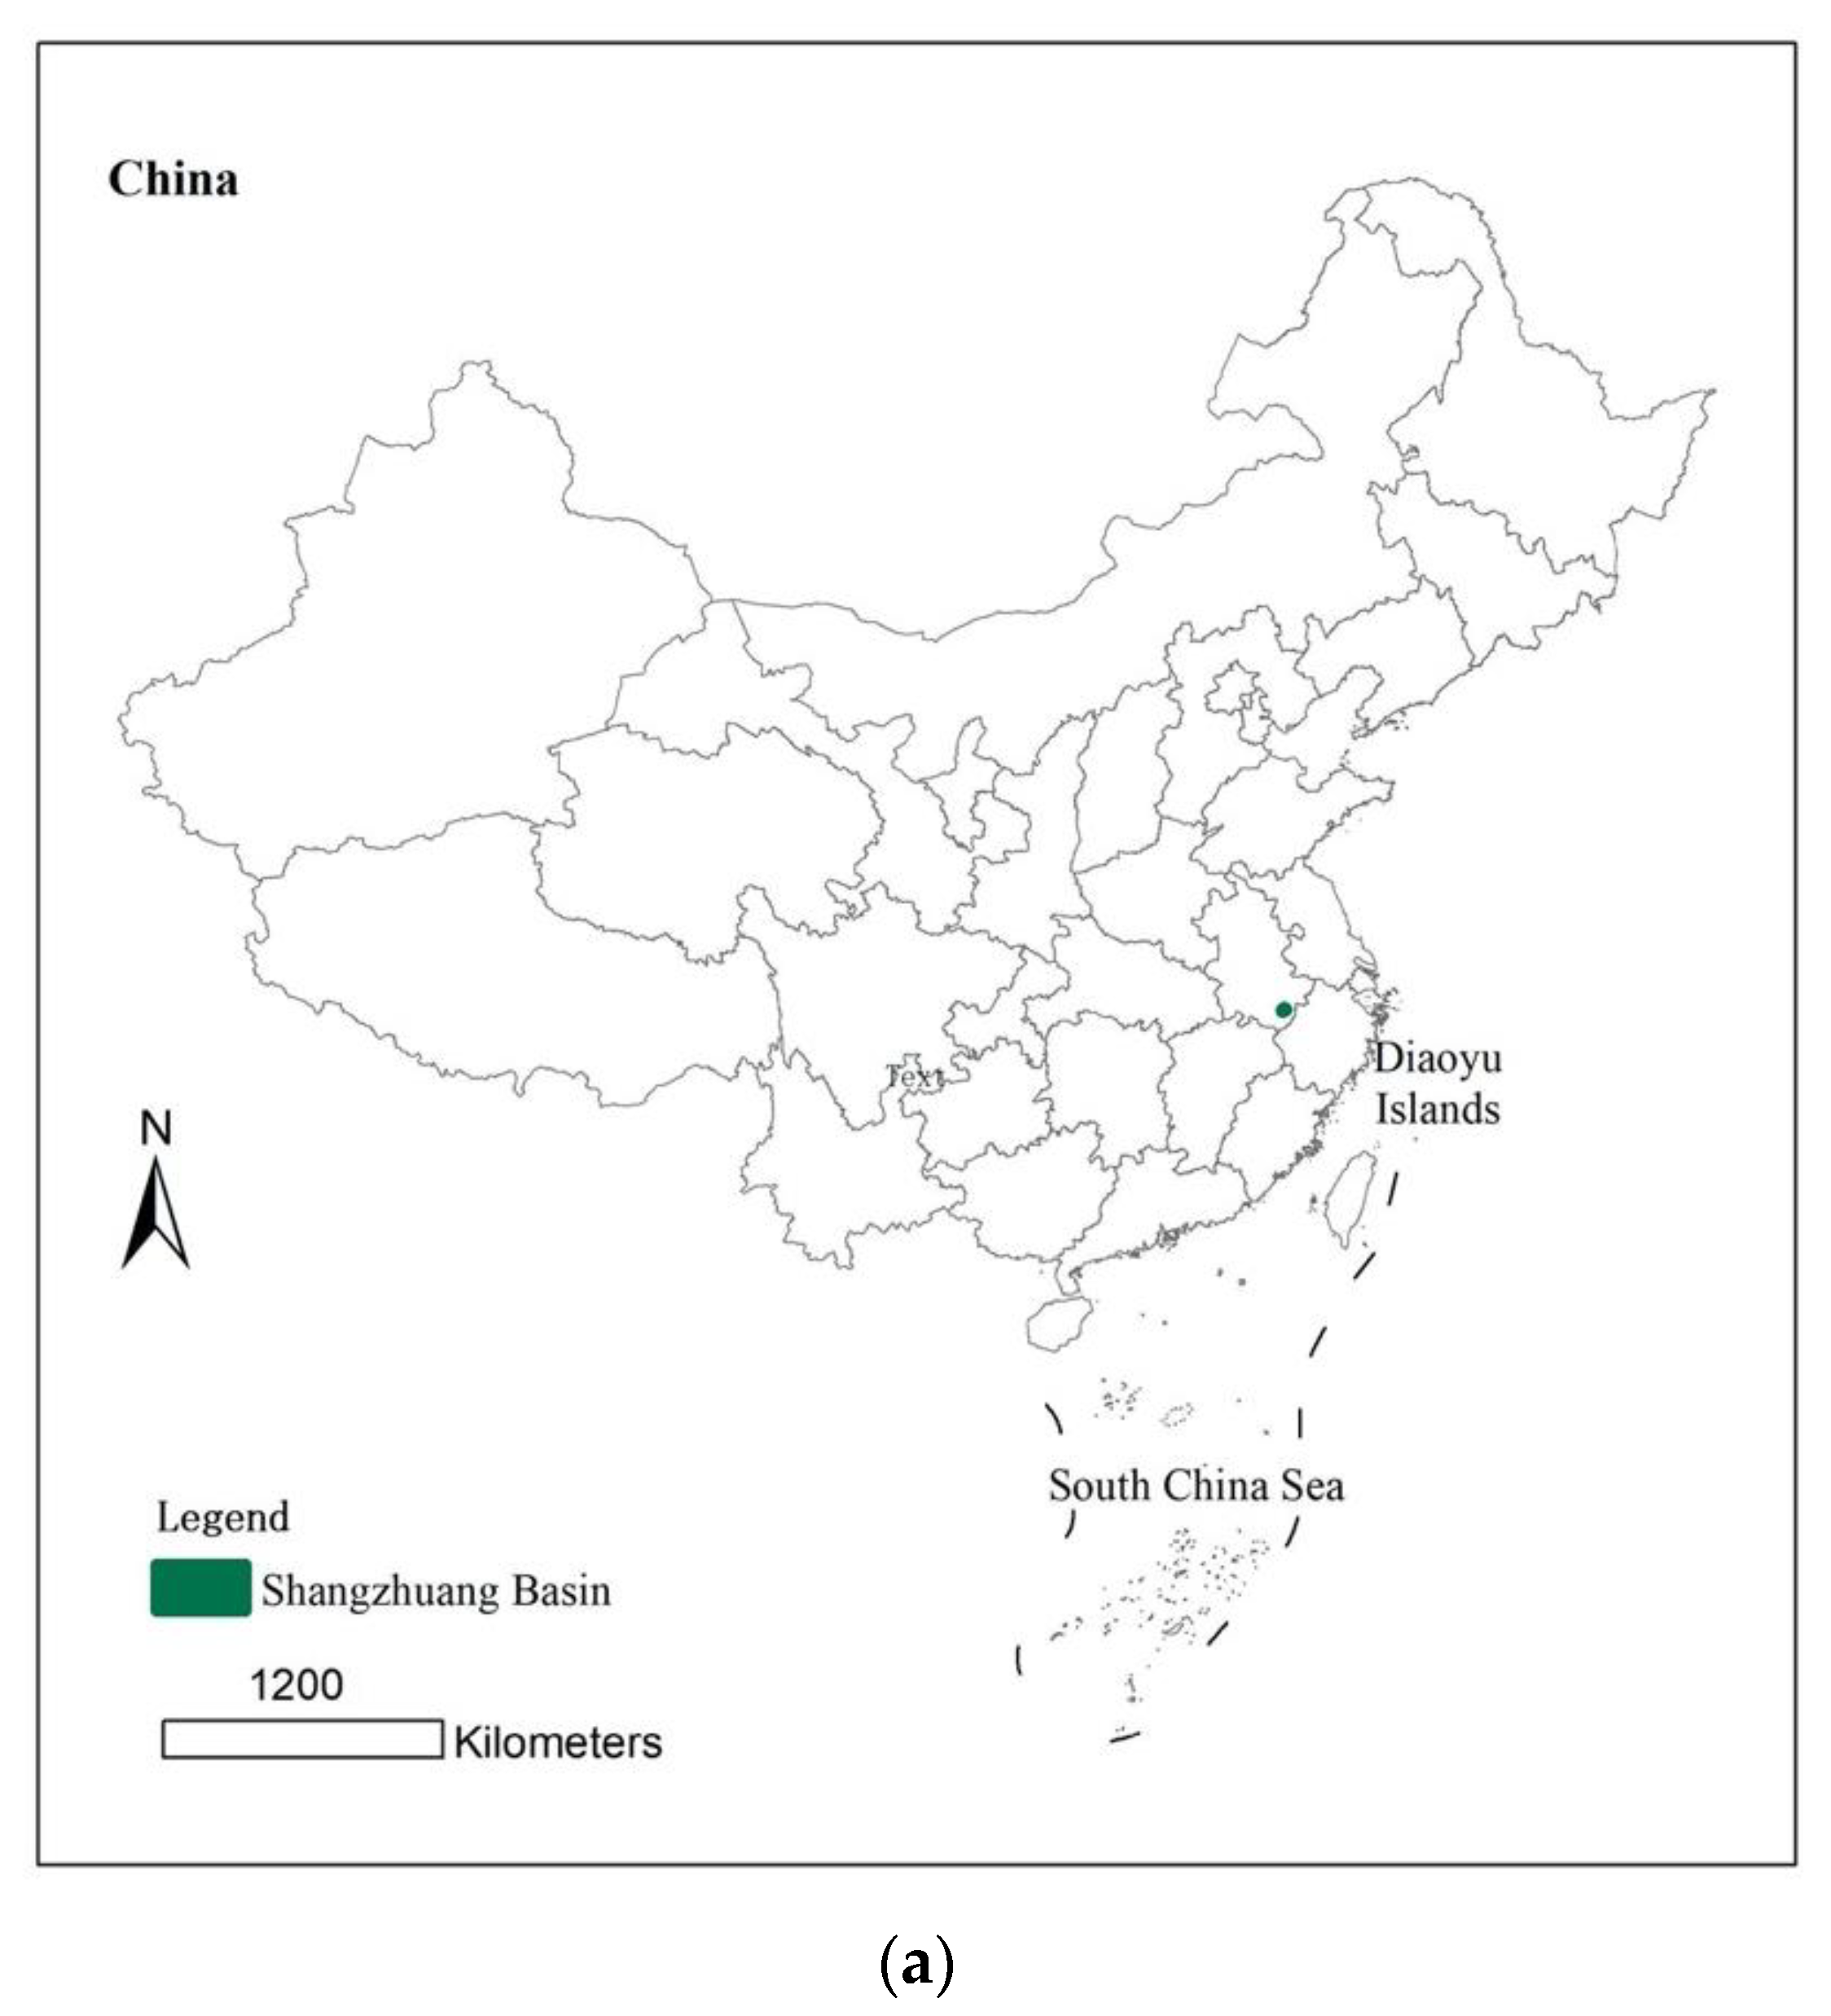
3.1. Study Area
3.2. Methods
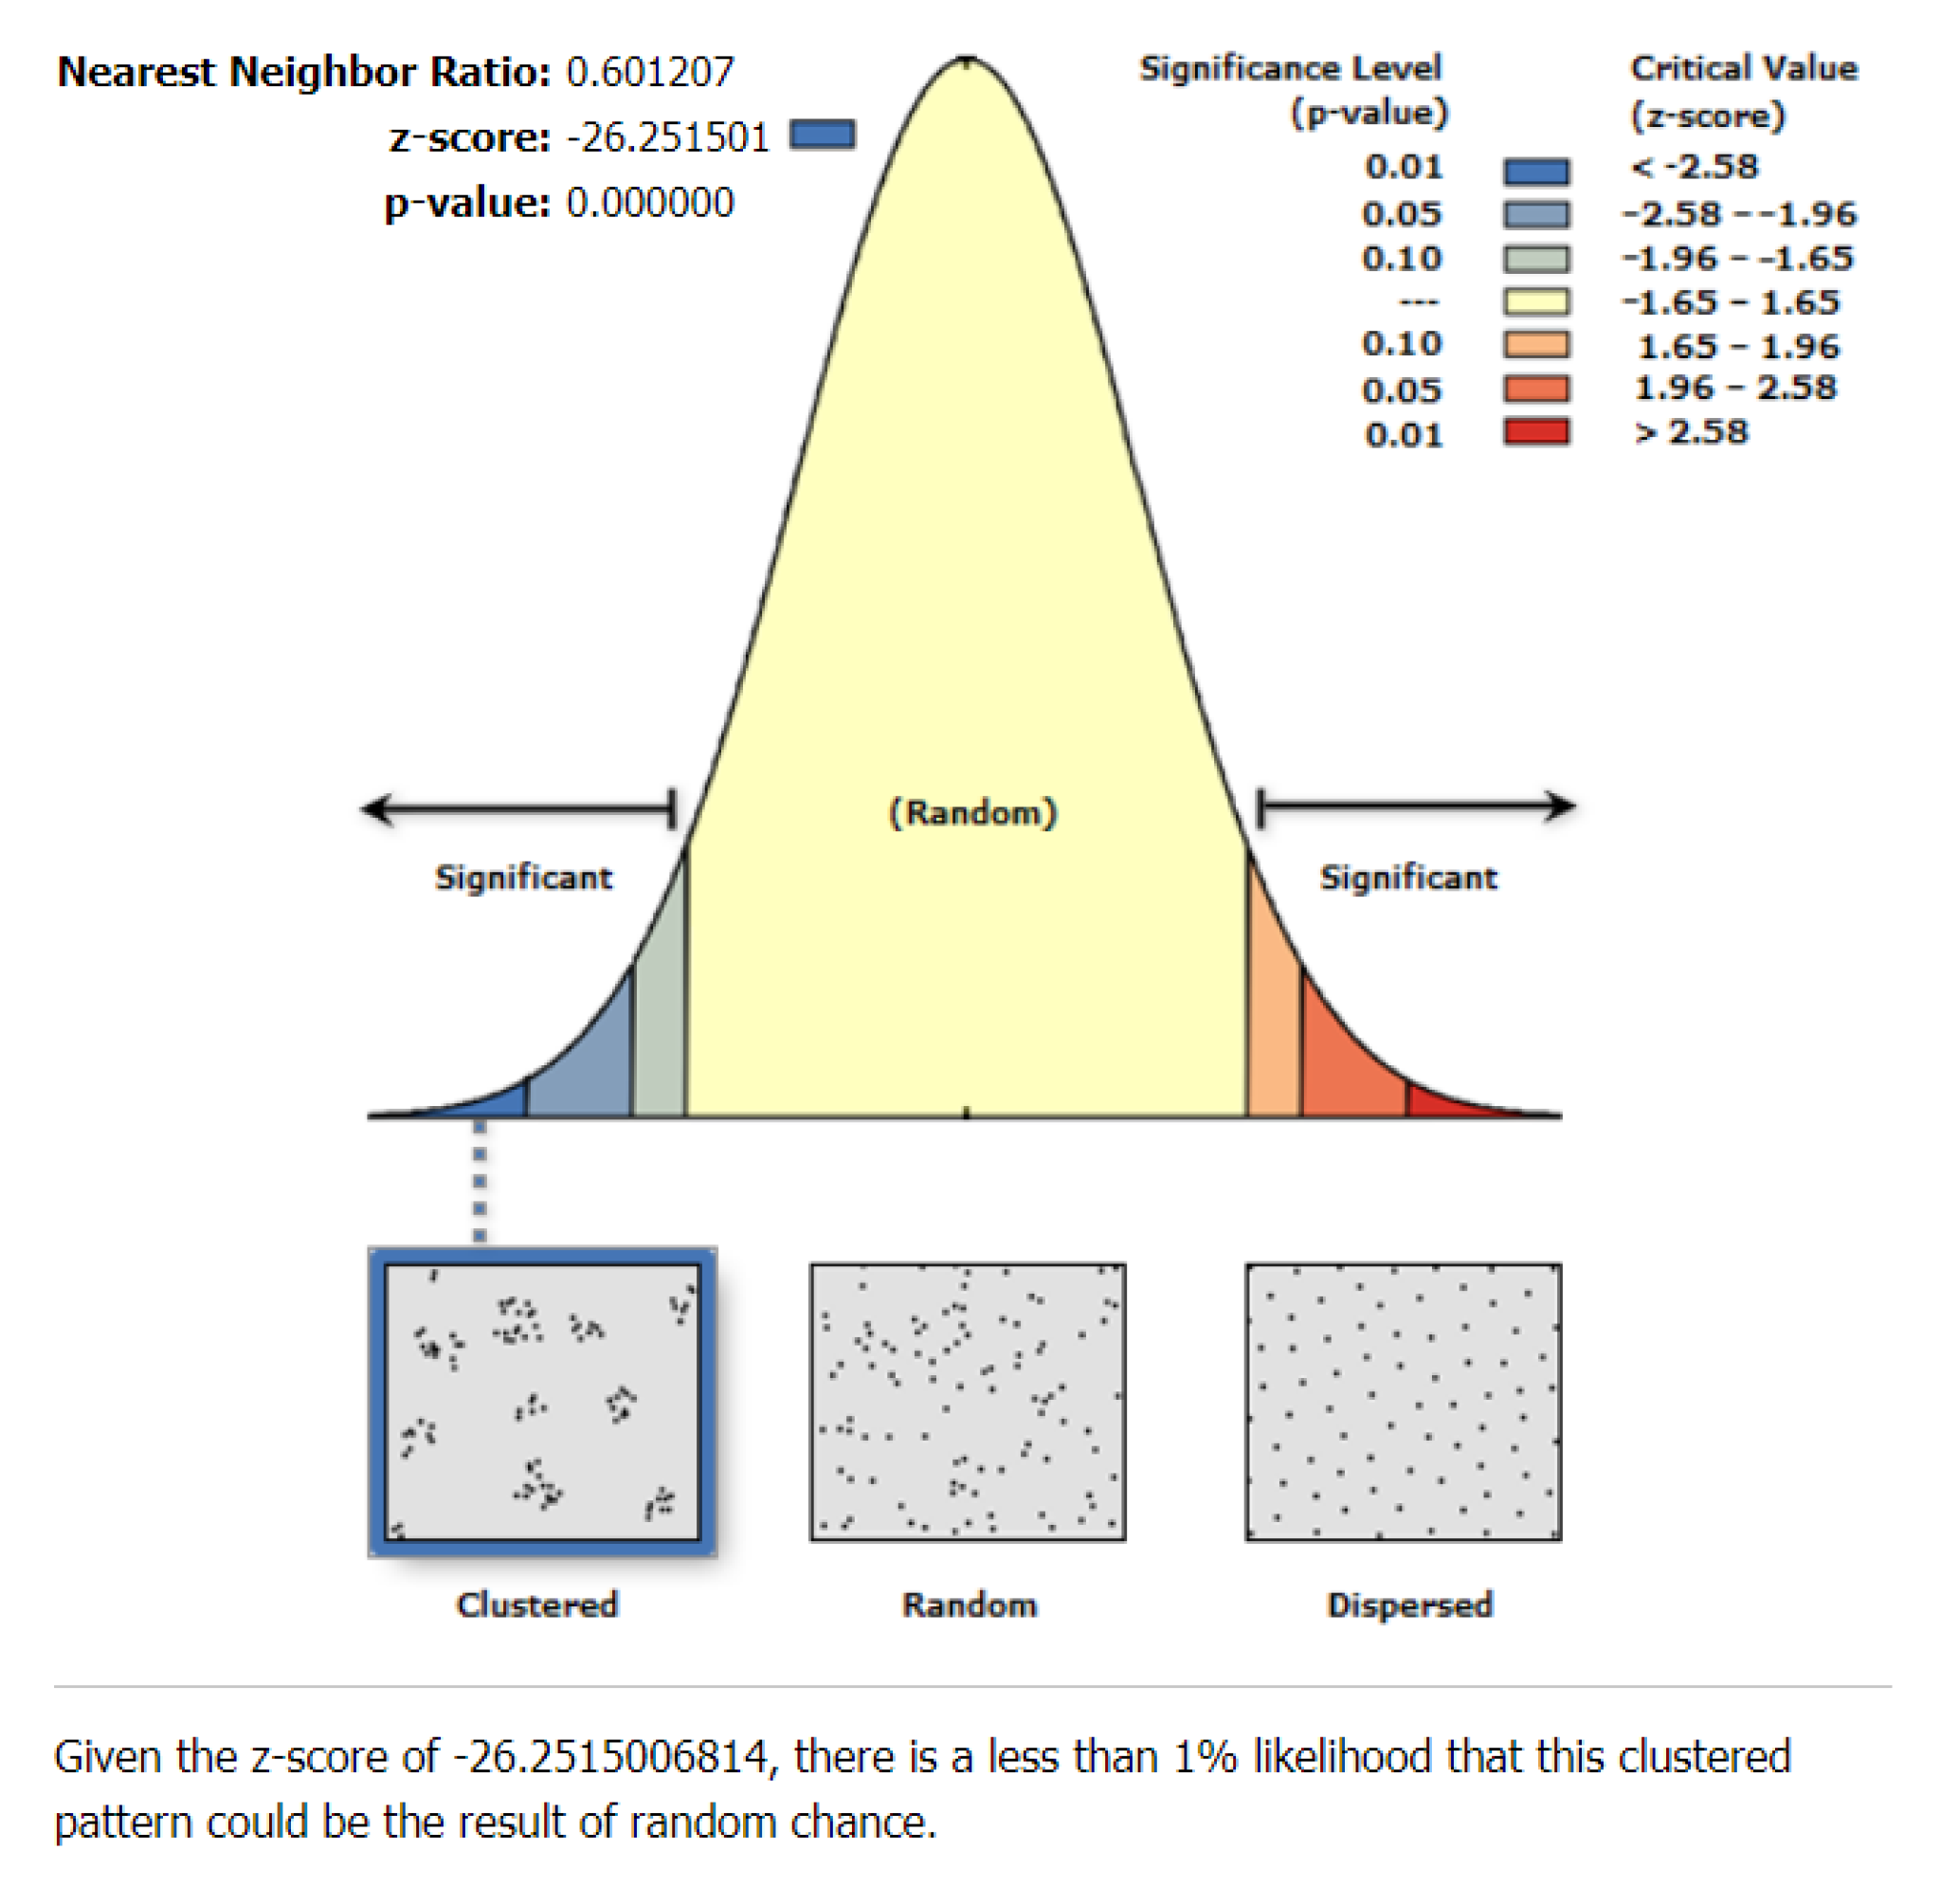
3.2.1. Average Nearest Neighbor Index
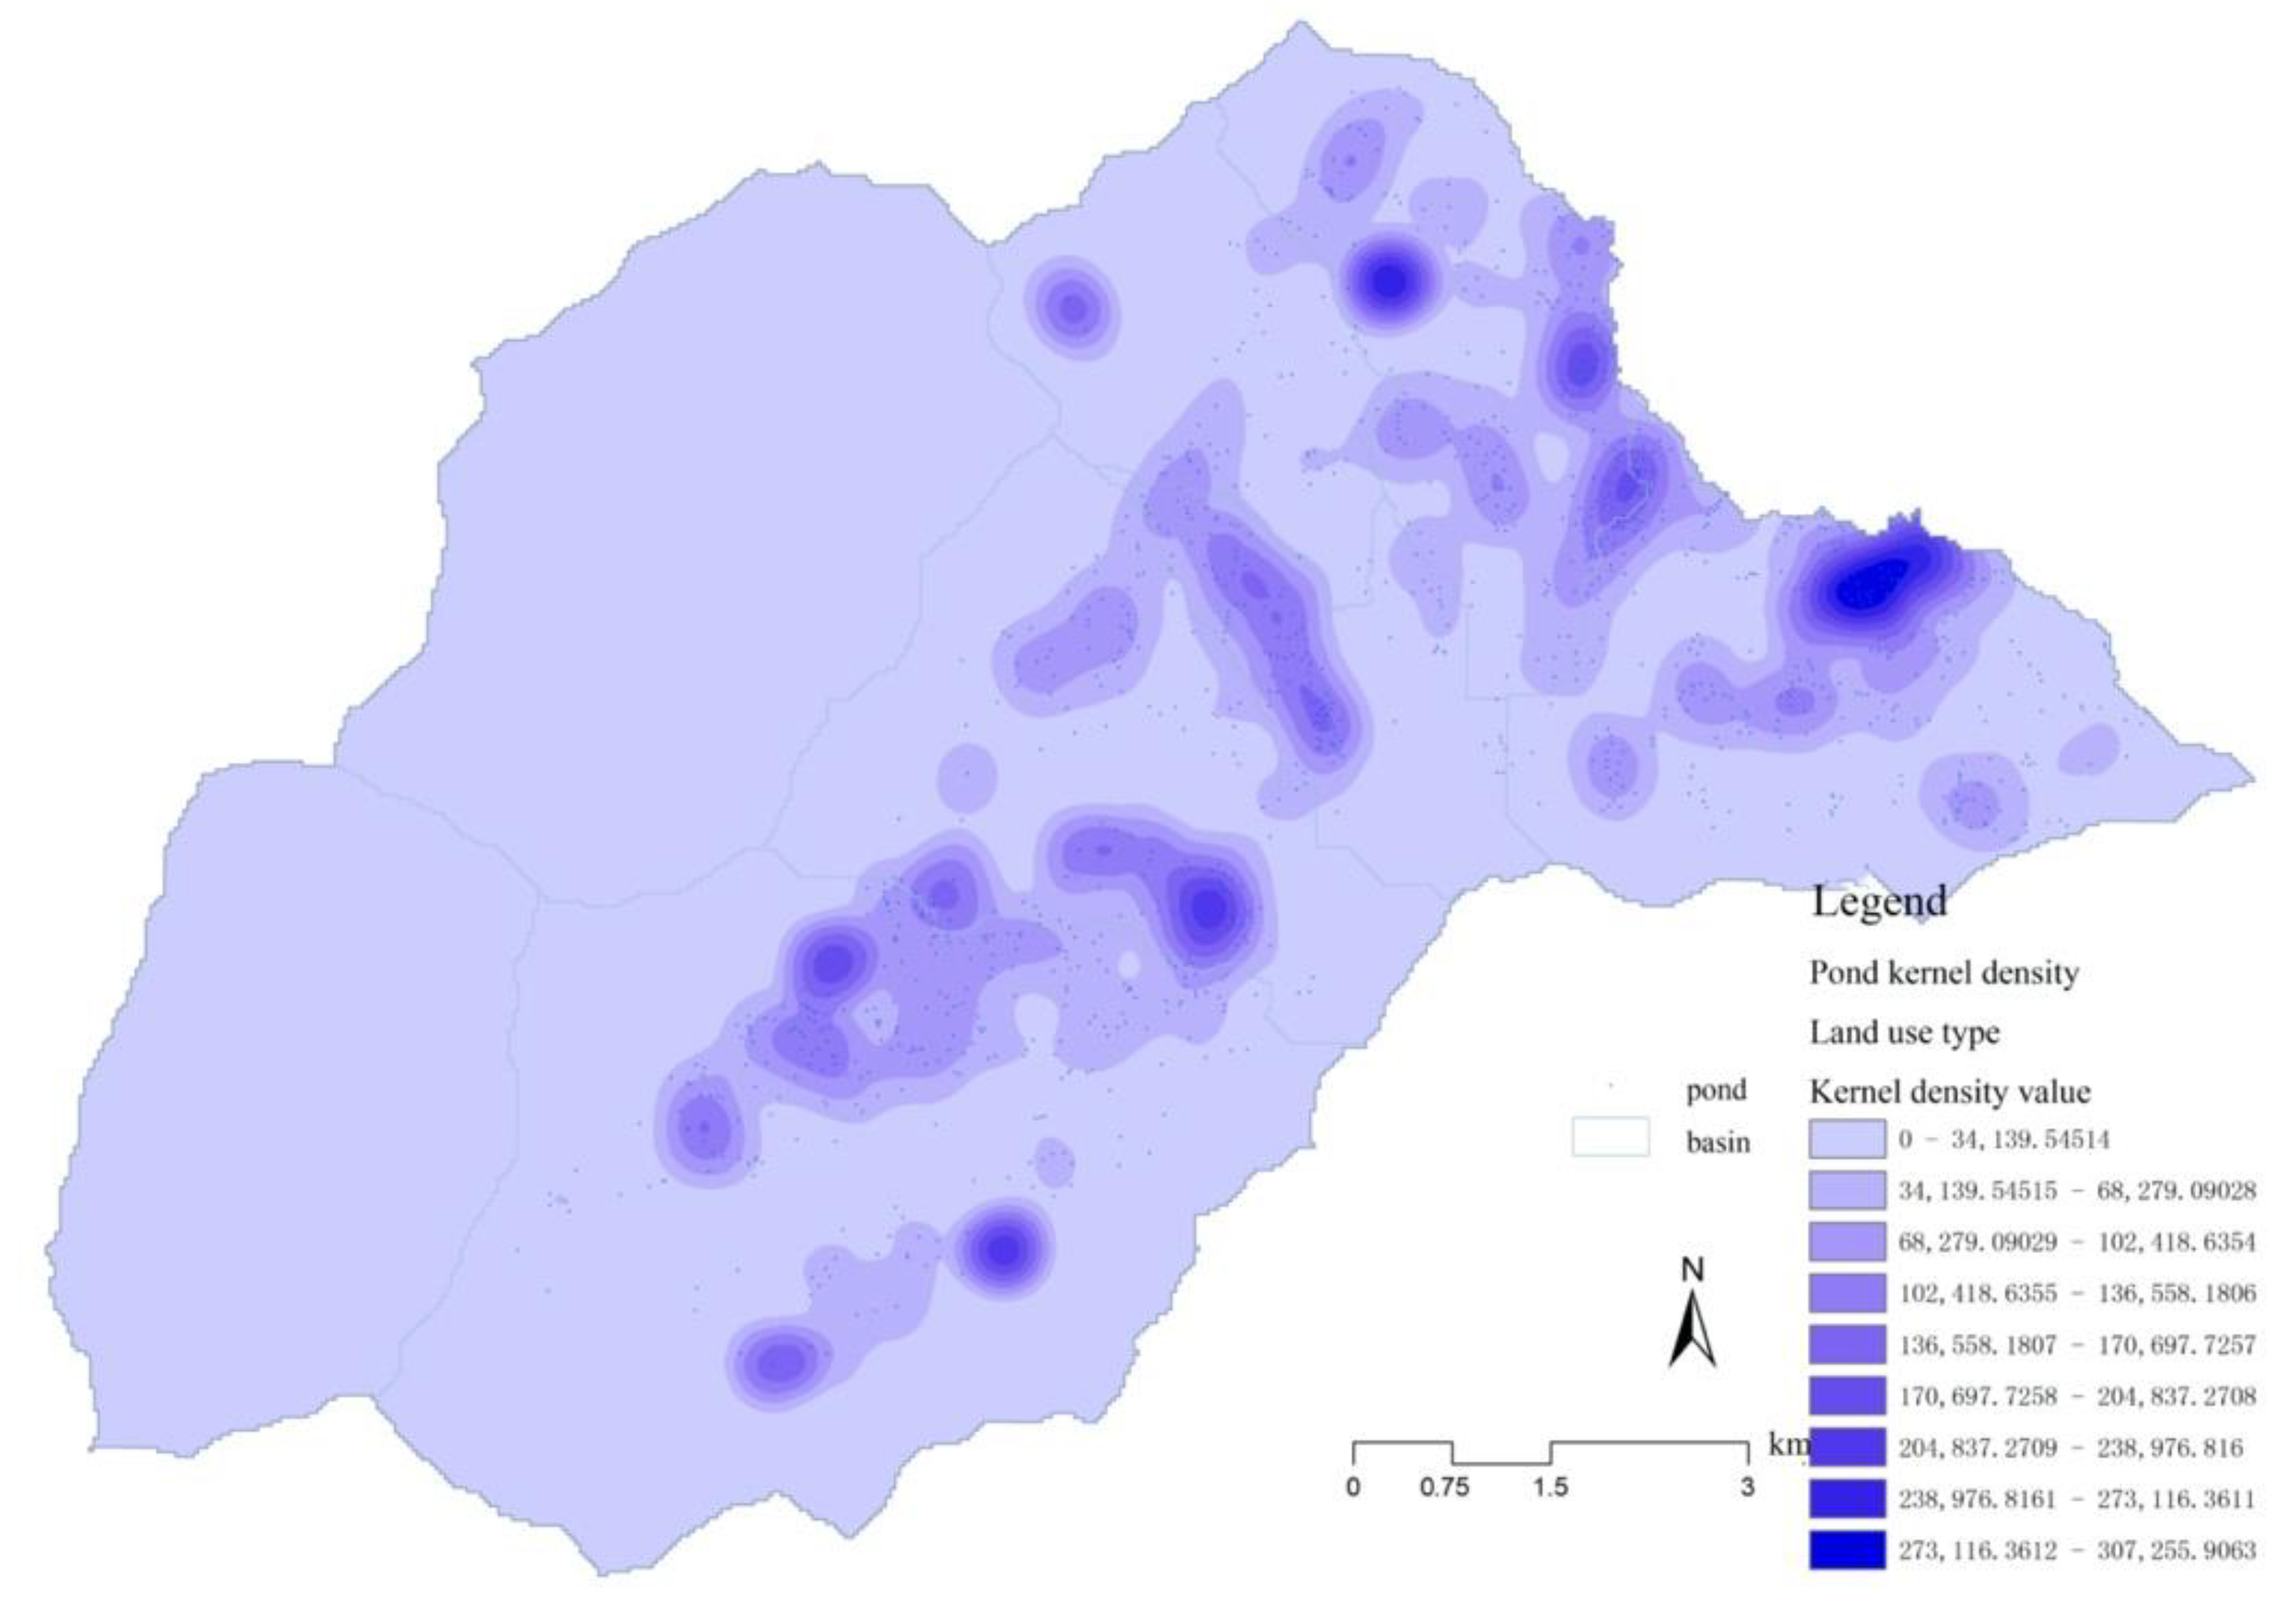
3.2.2. Kernel Density Estimation
3.2.3. GeoDetector
4. Results
4.1. Spatial Distribution Characteristics
4.2. Influencing Factors
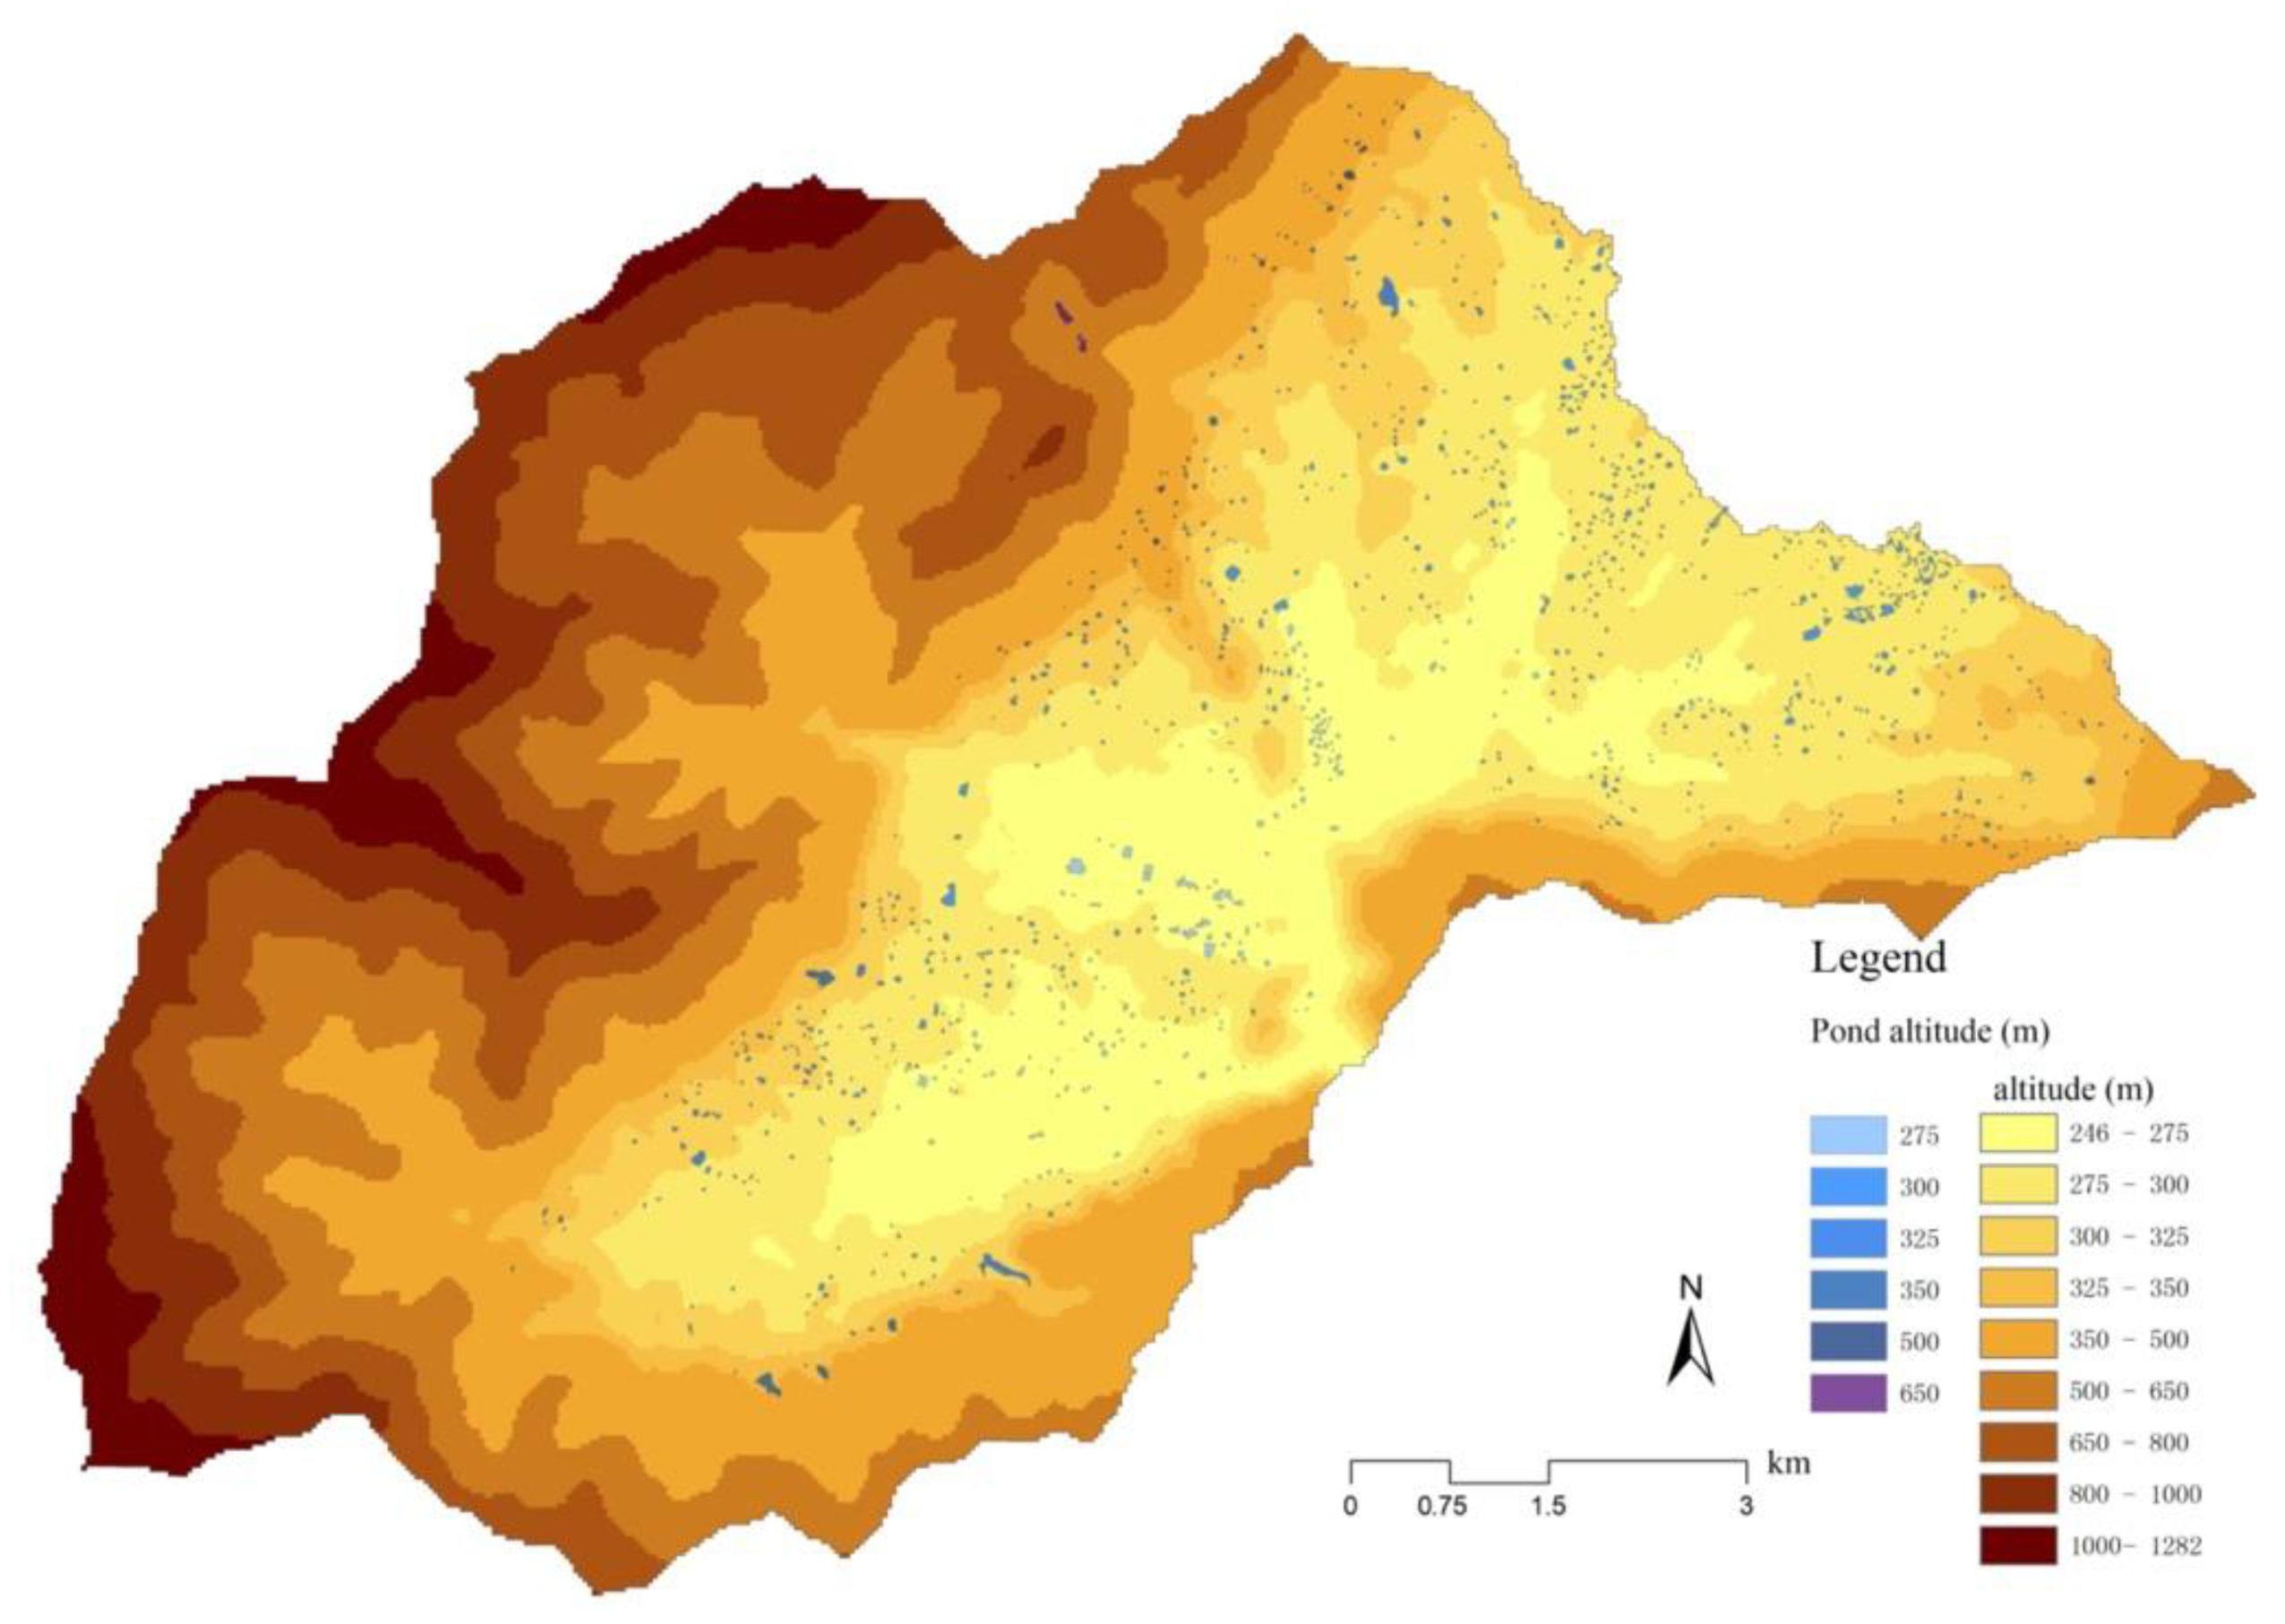
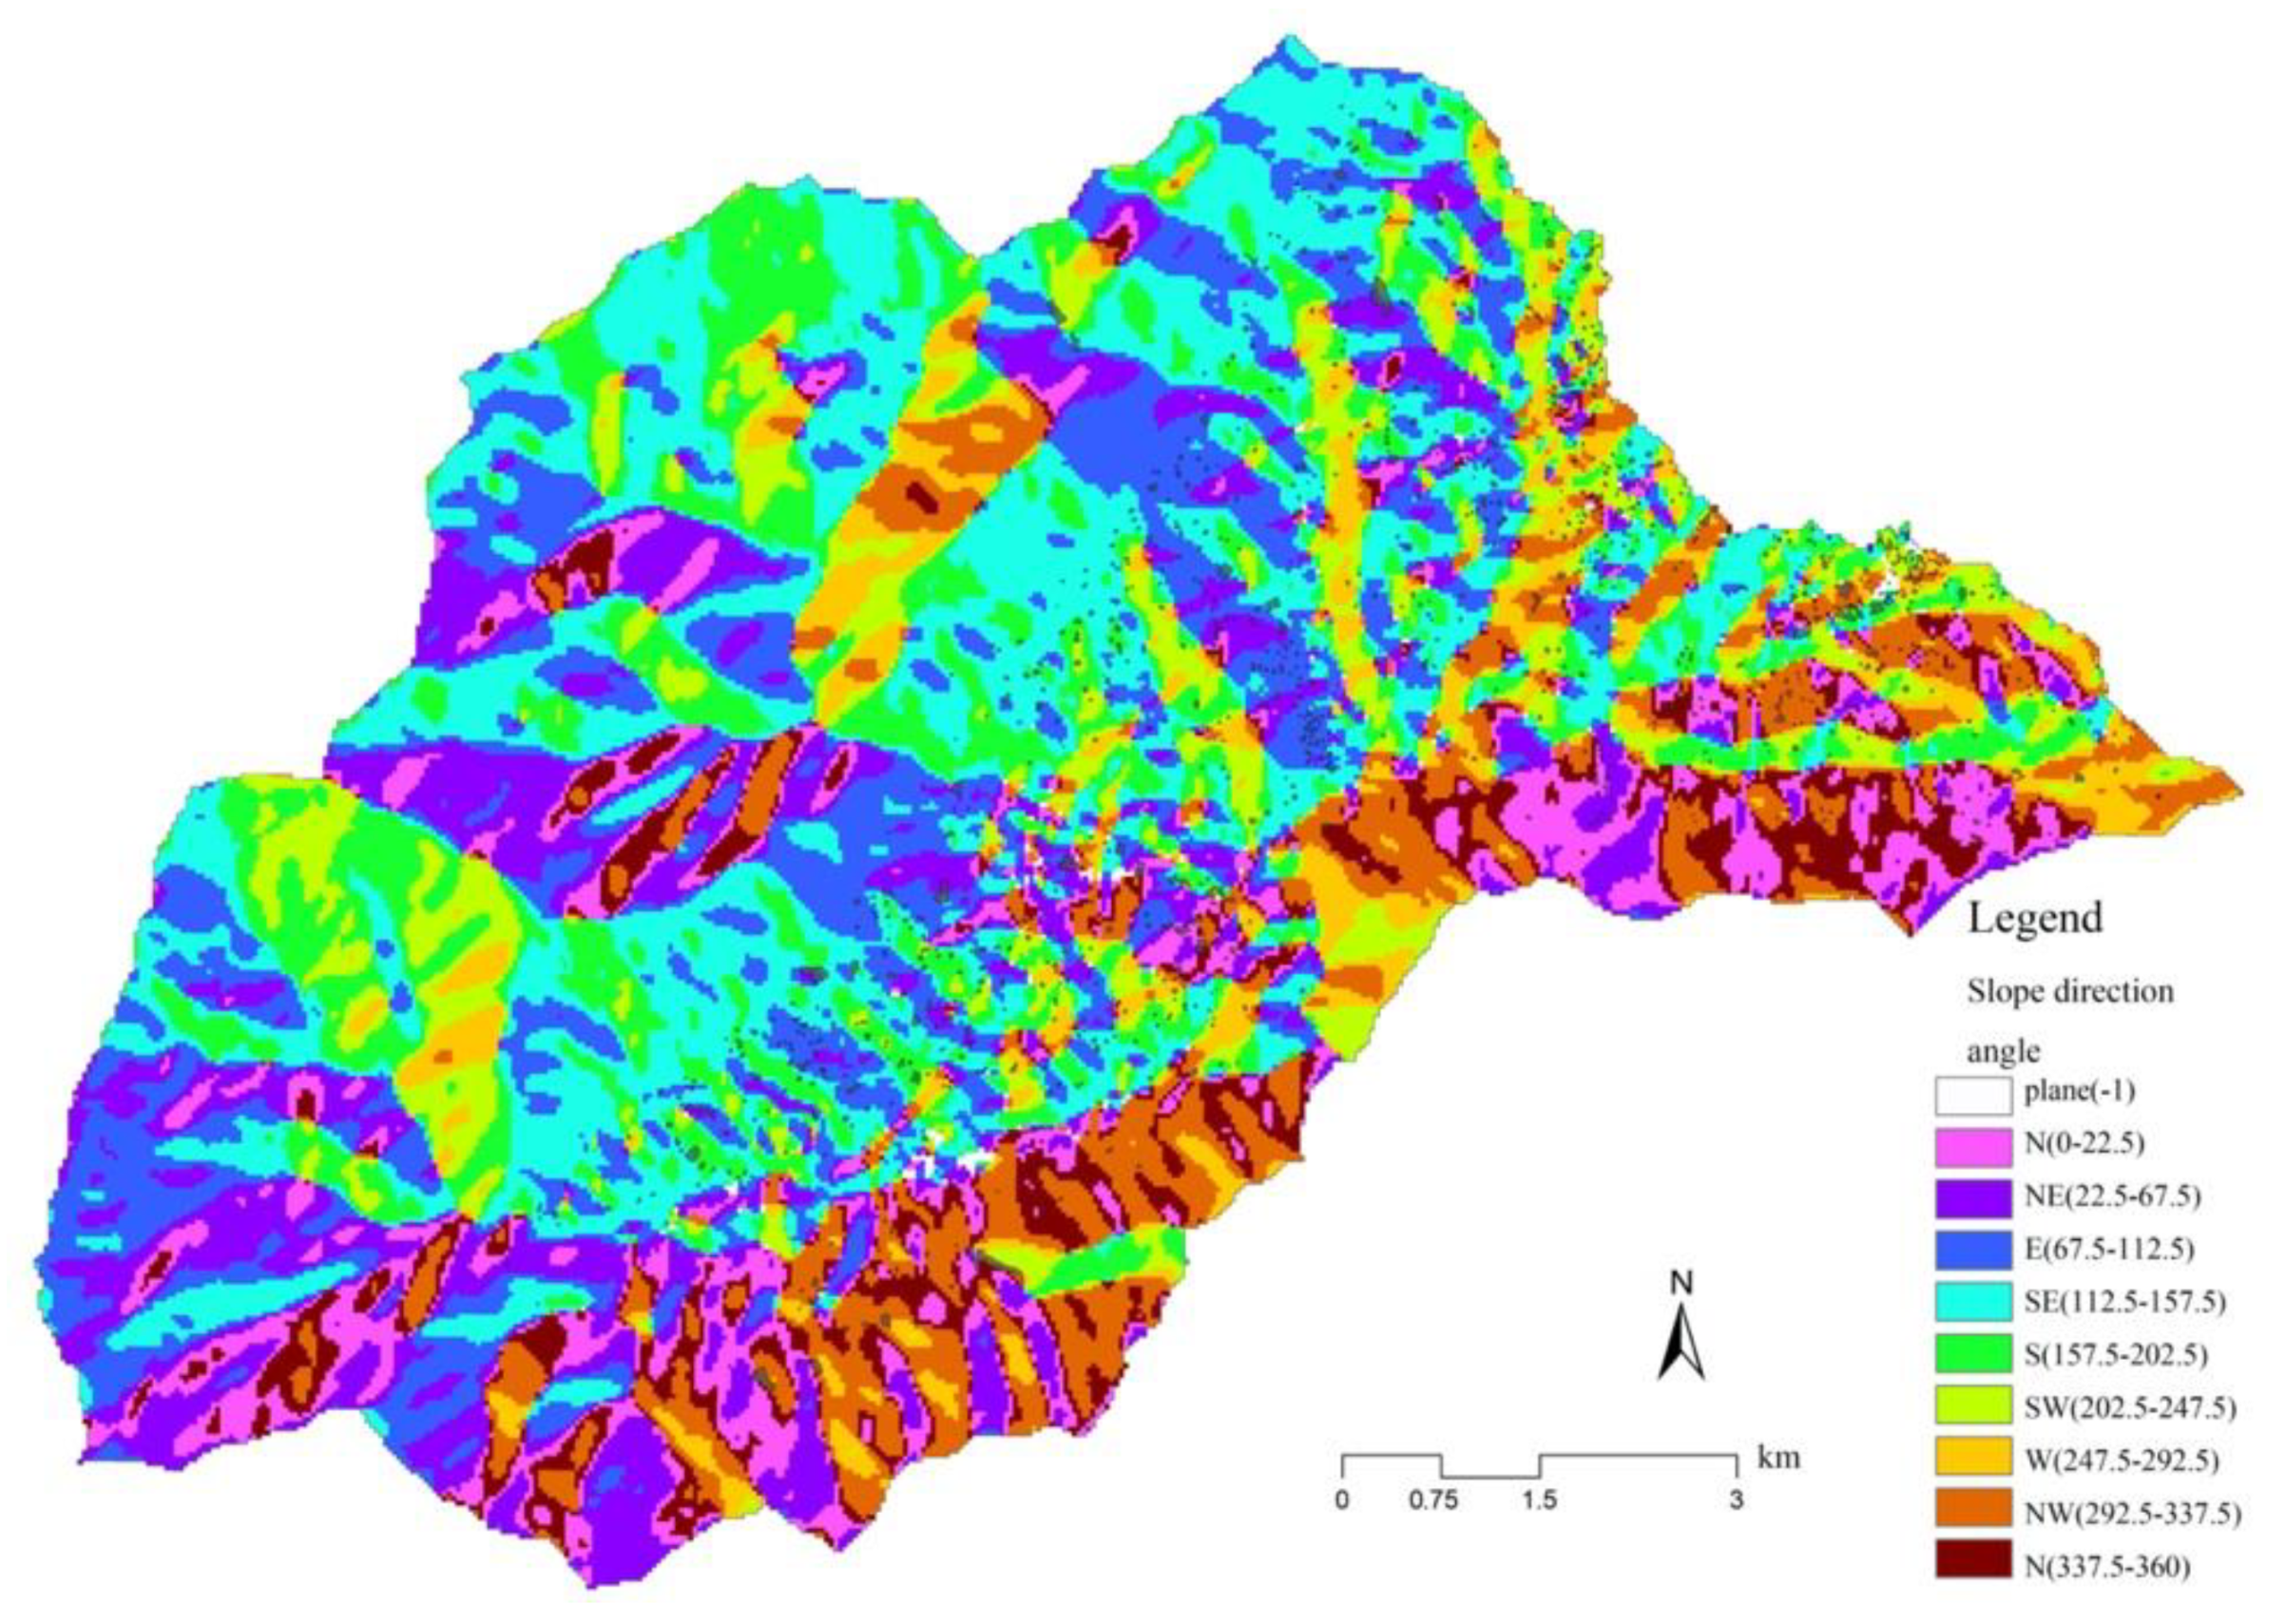
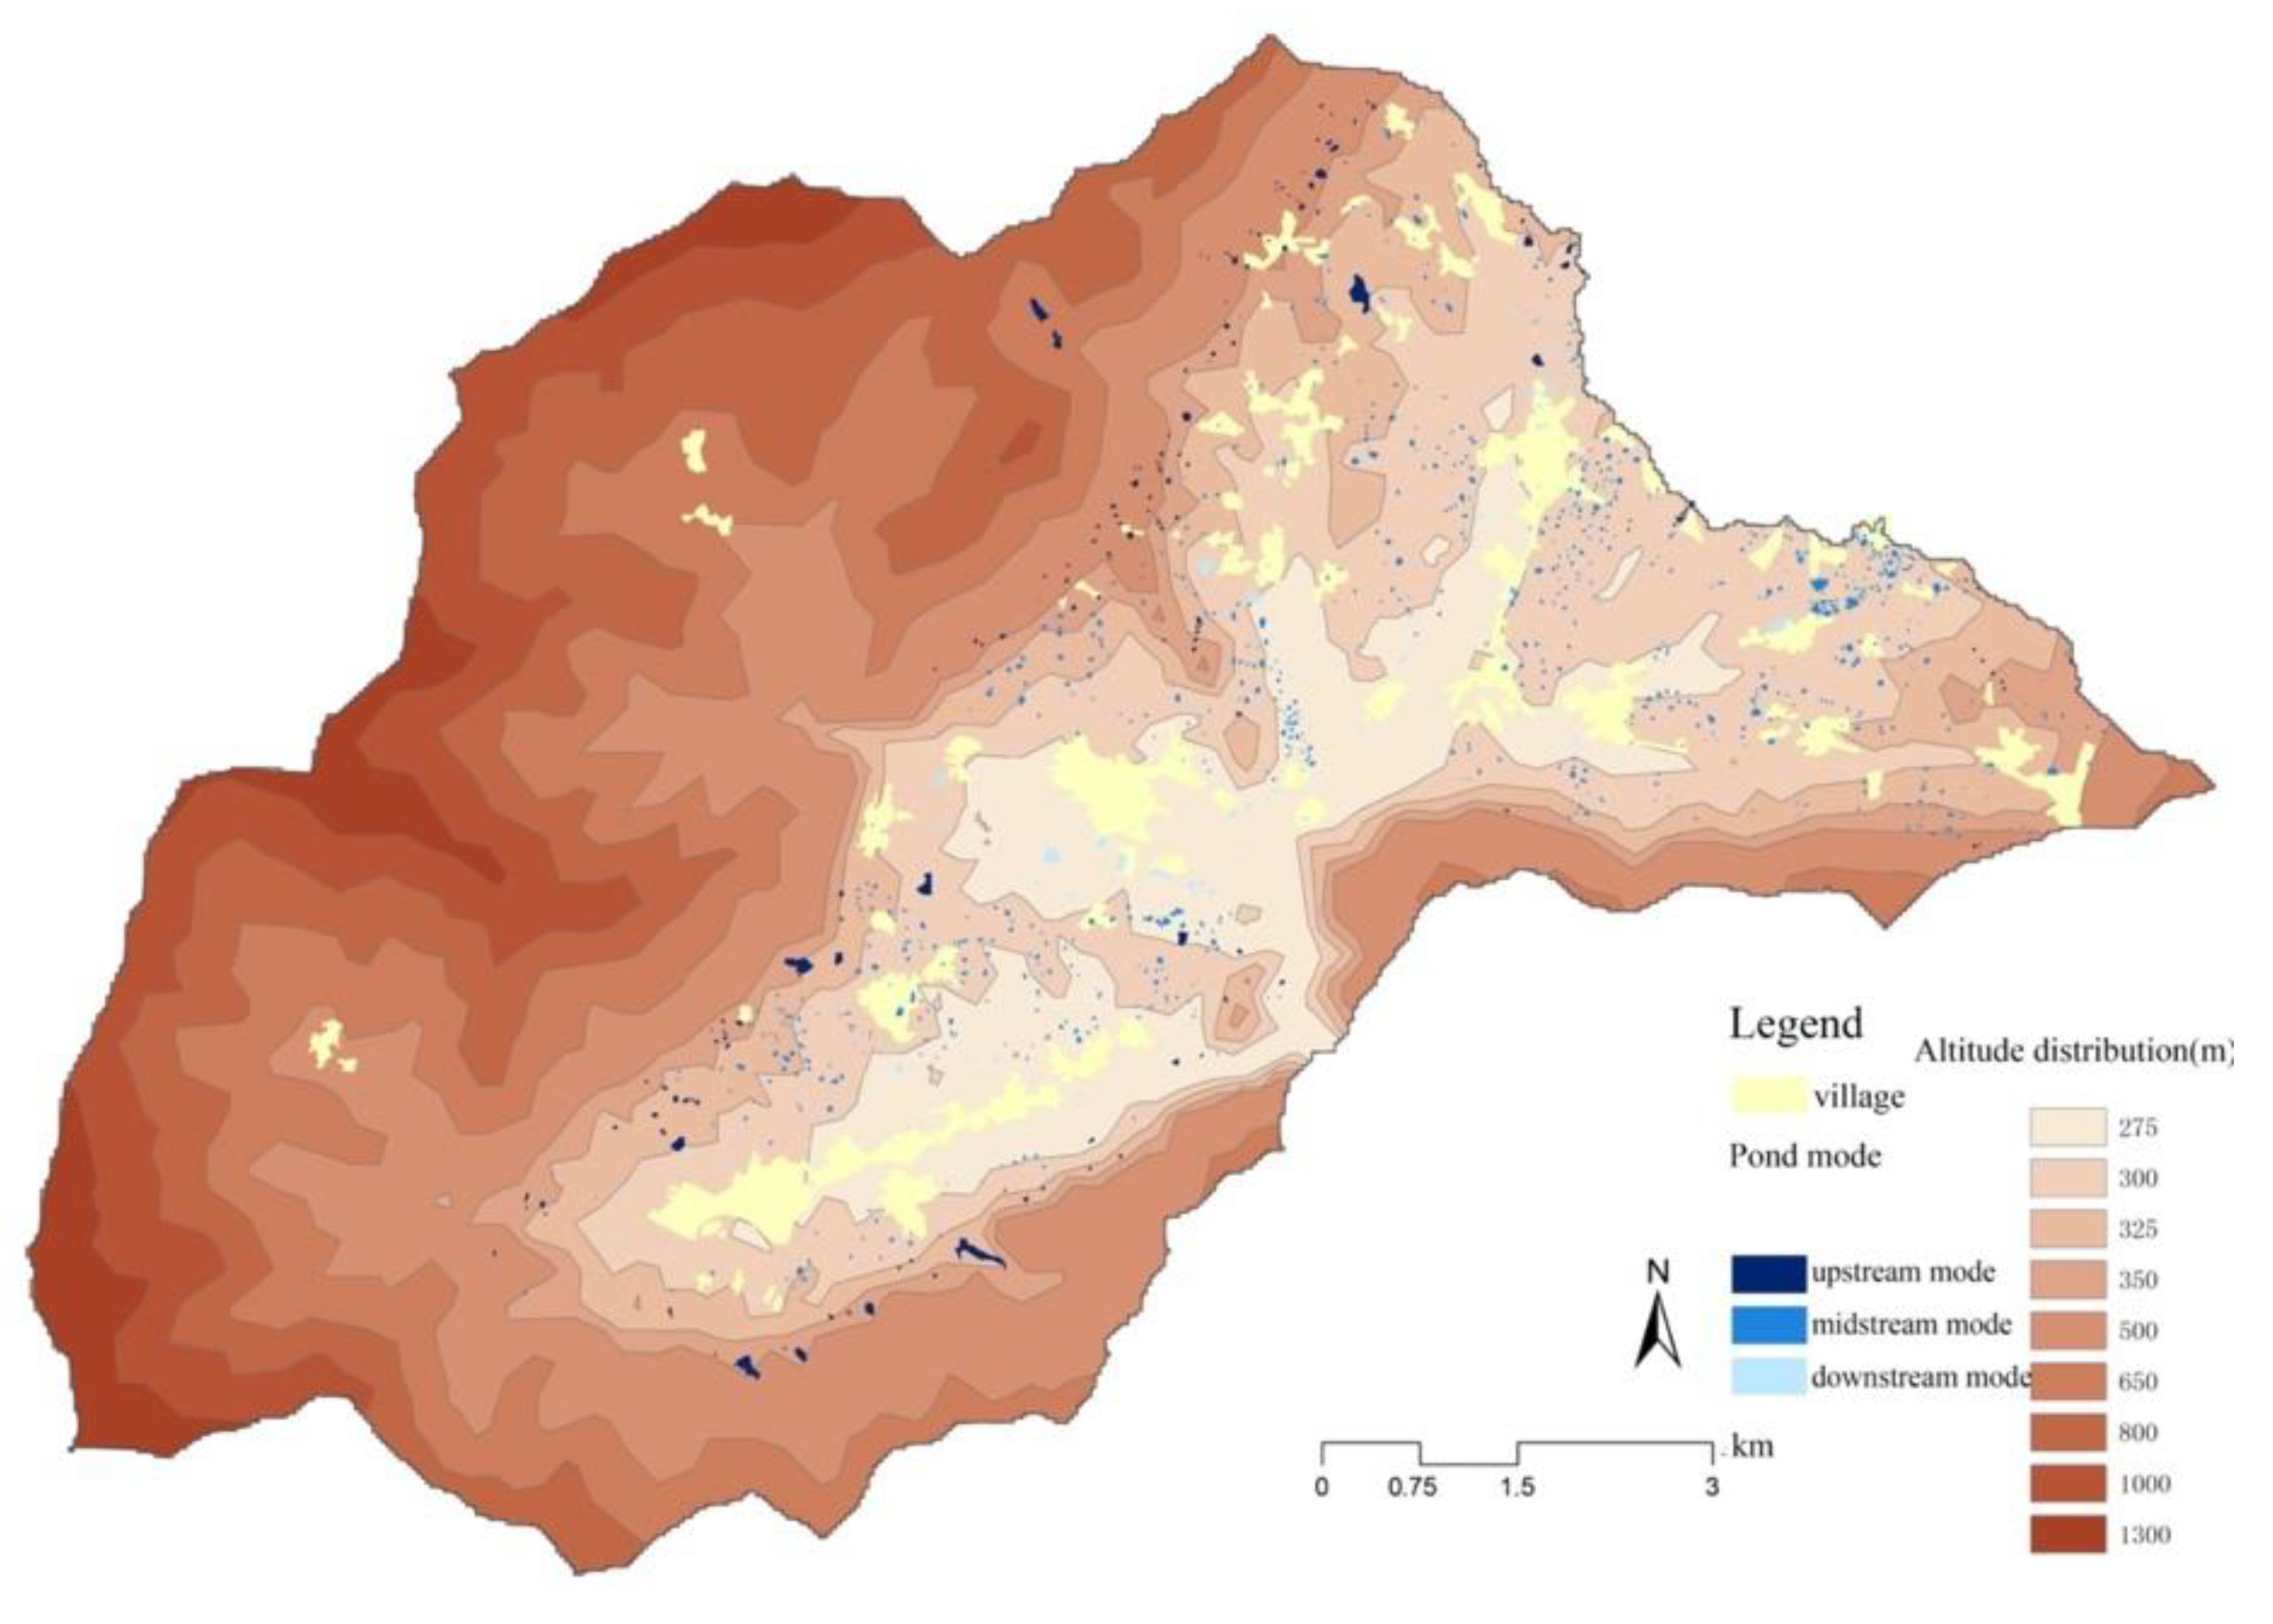
4.2.1. Elevation, Slope, and Aspect
- (1)
- Elevation
- (2)
- Slope
- (3)
- Aspect
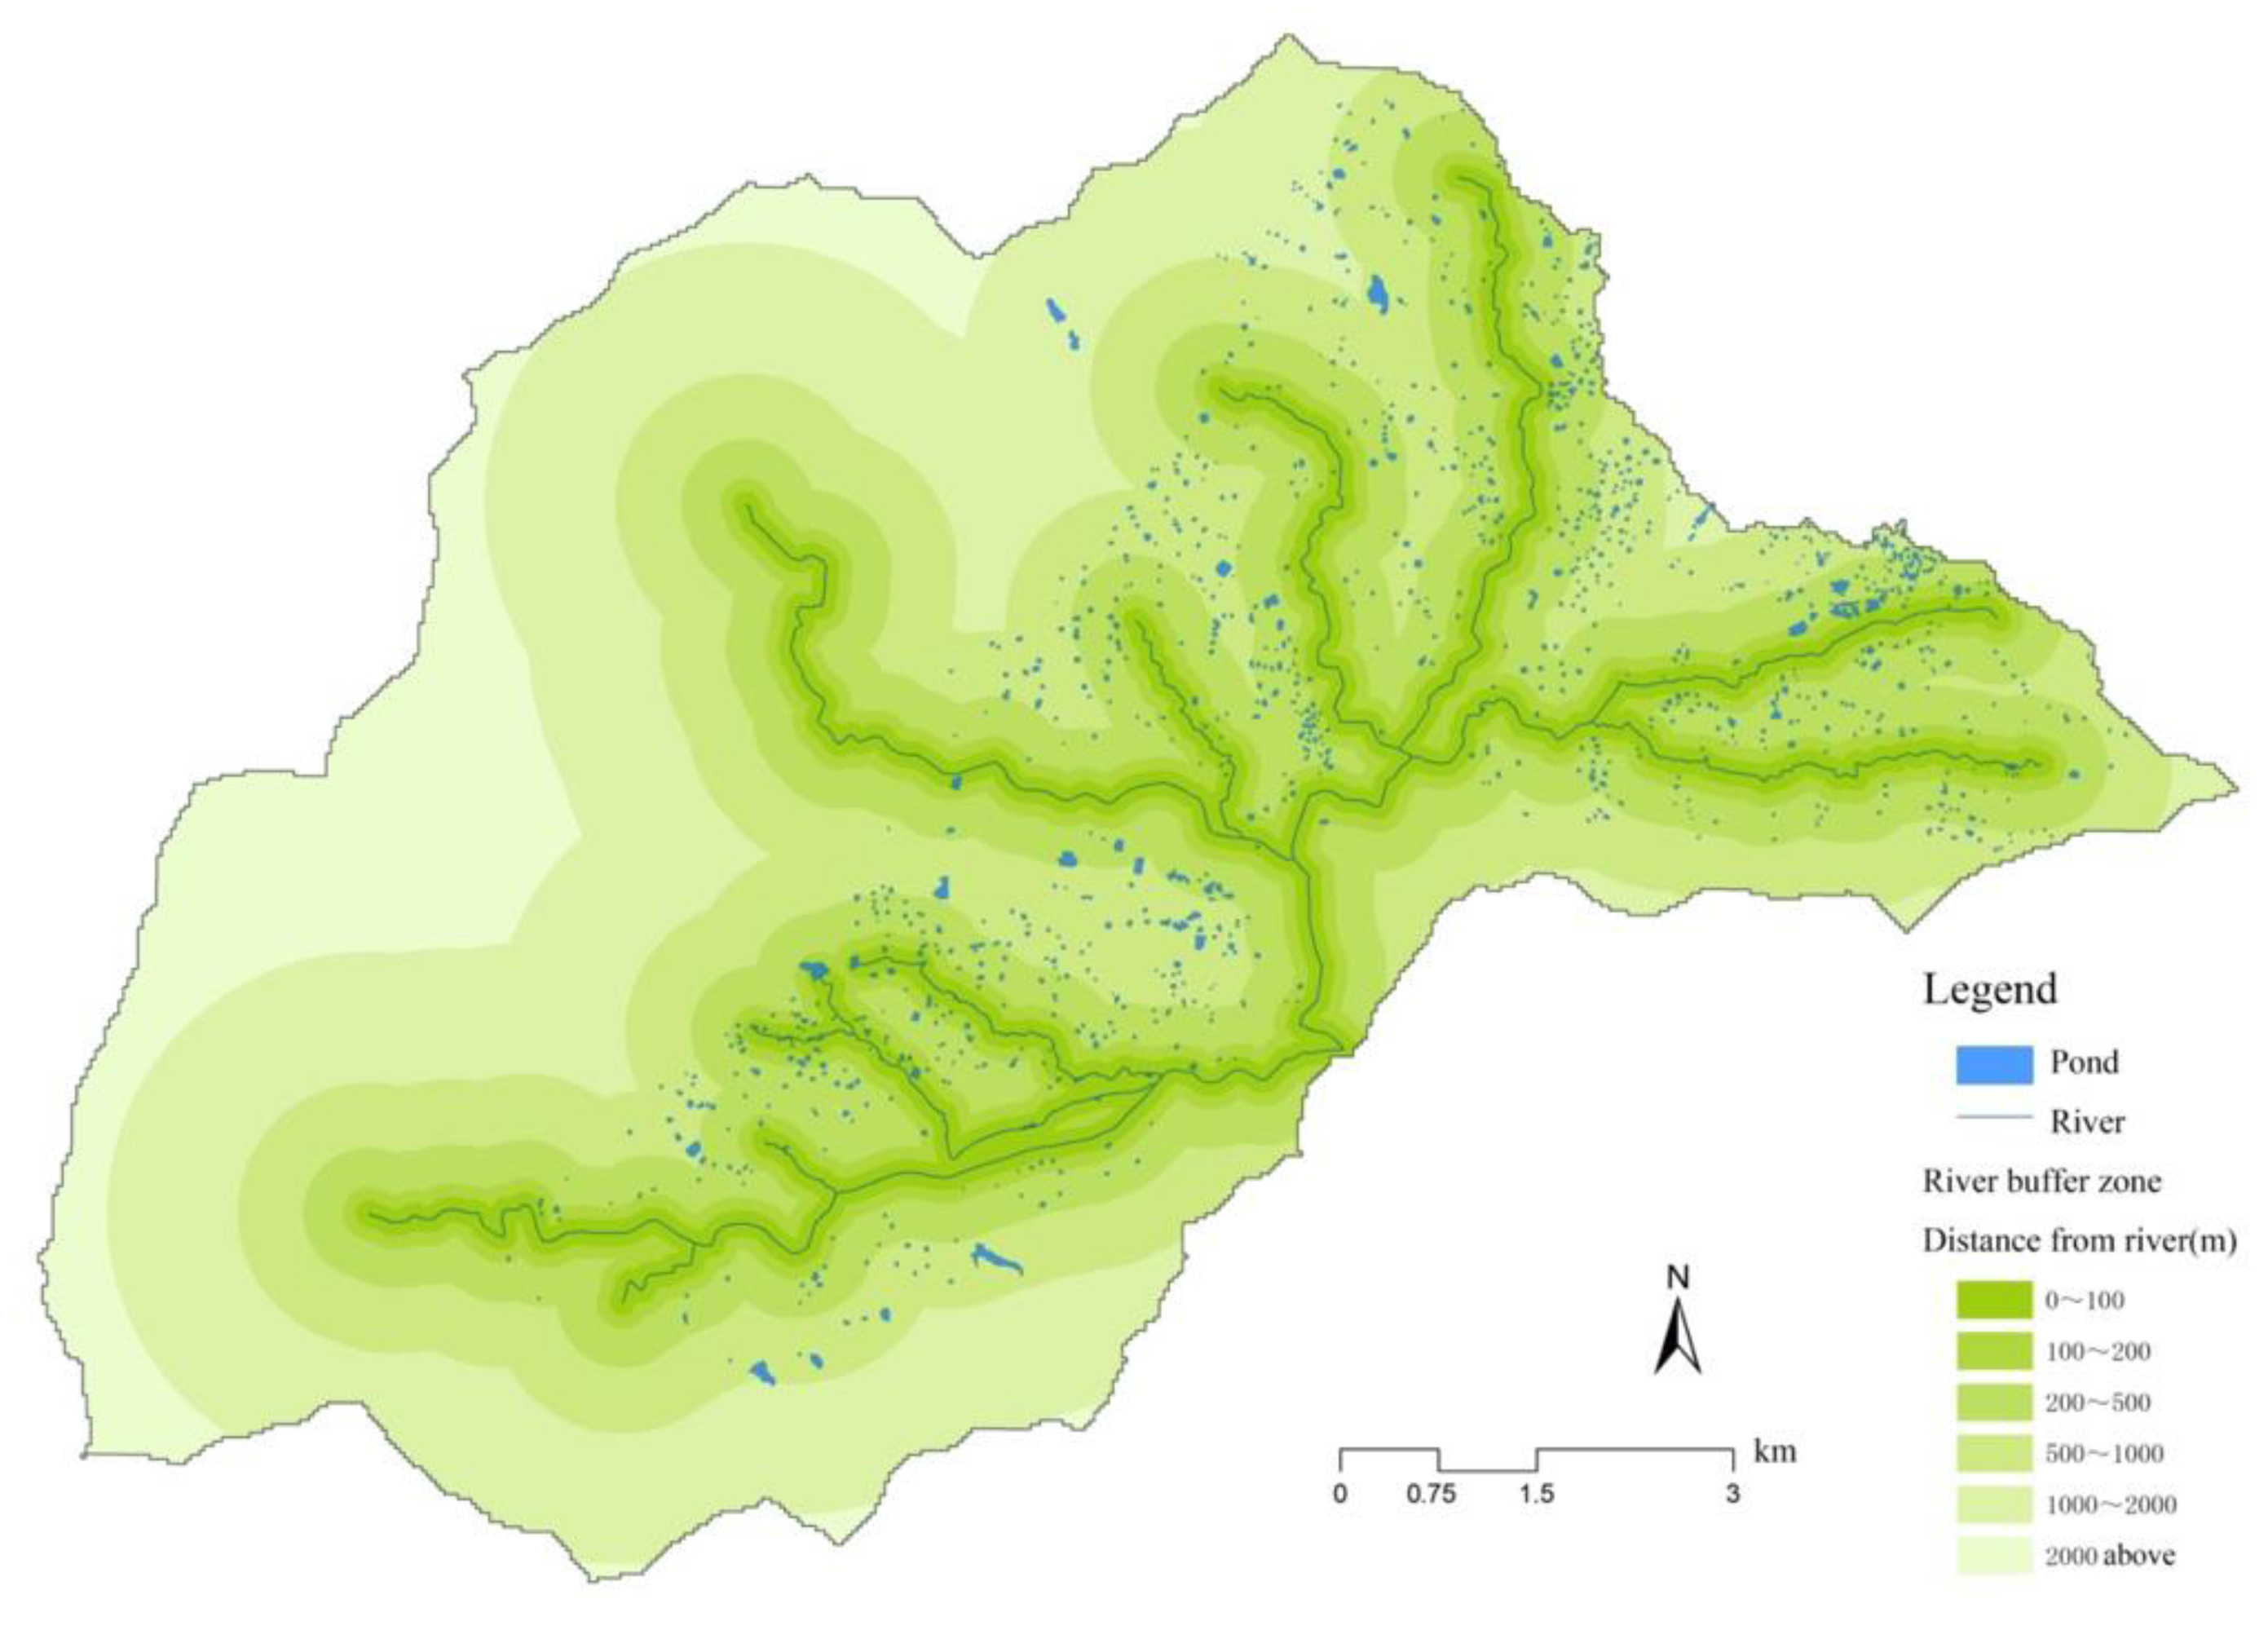
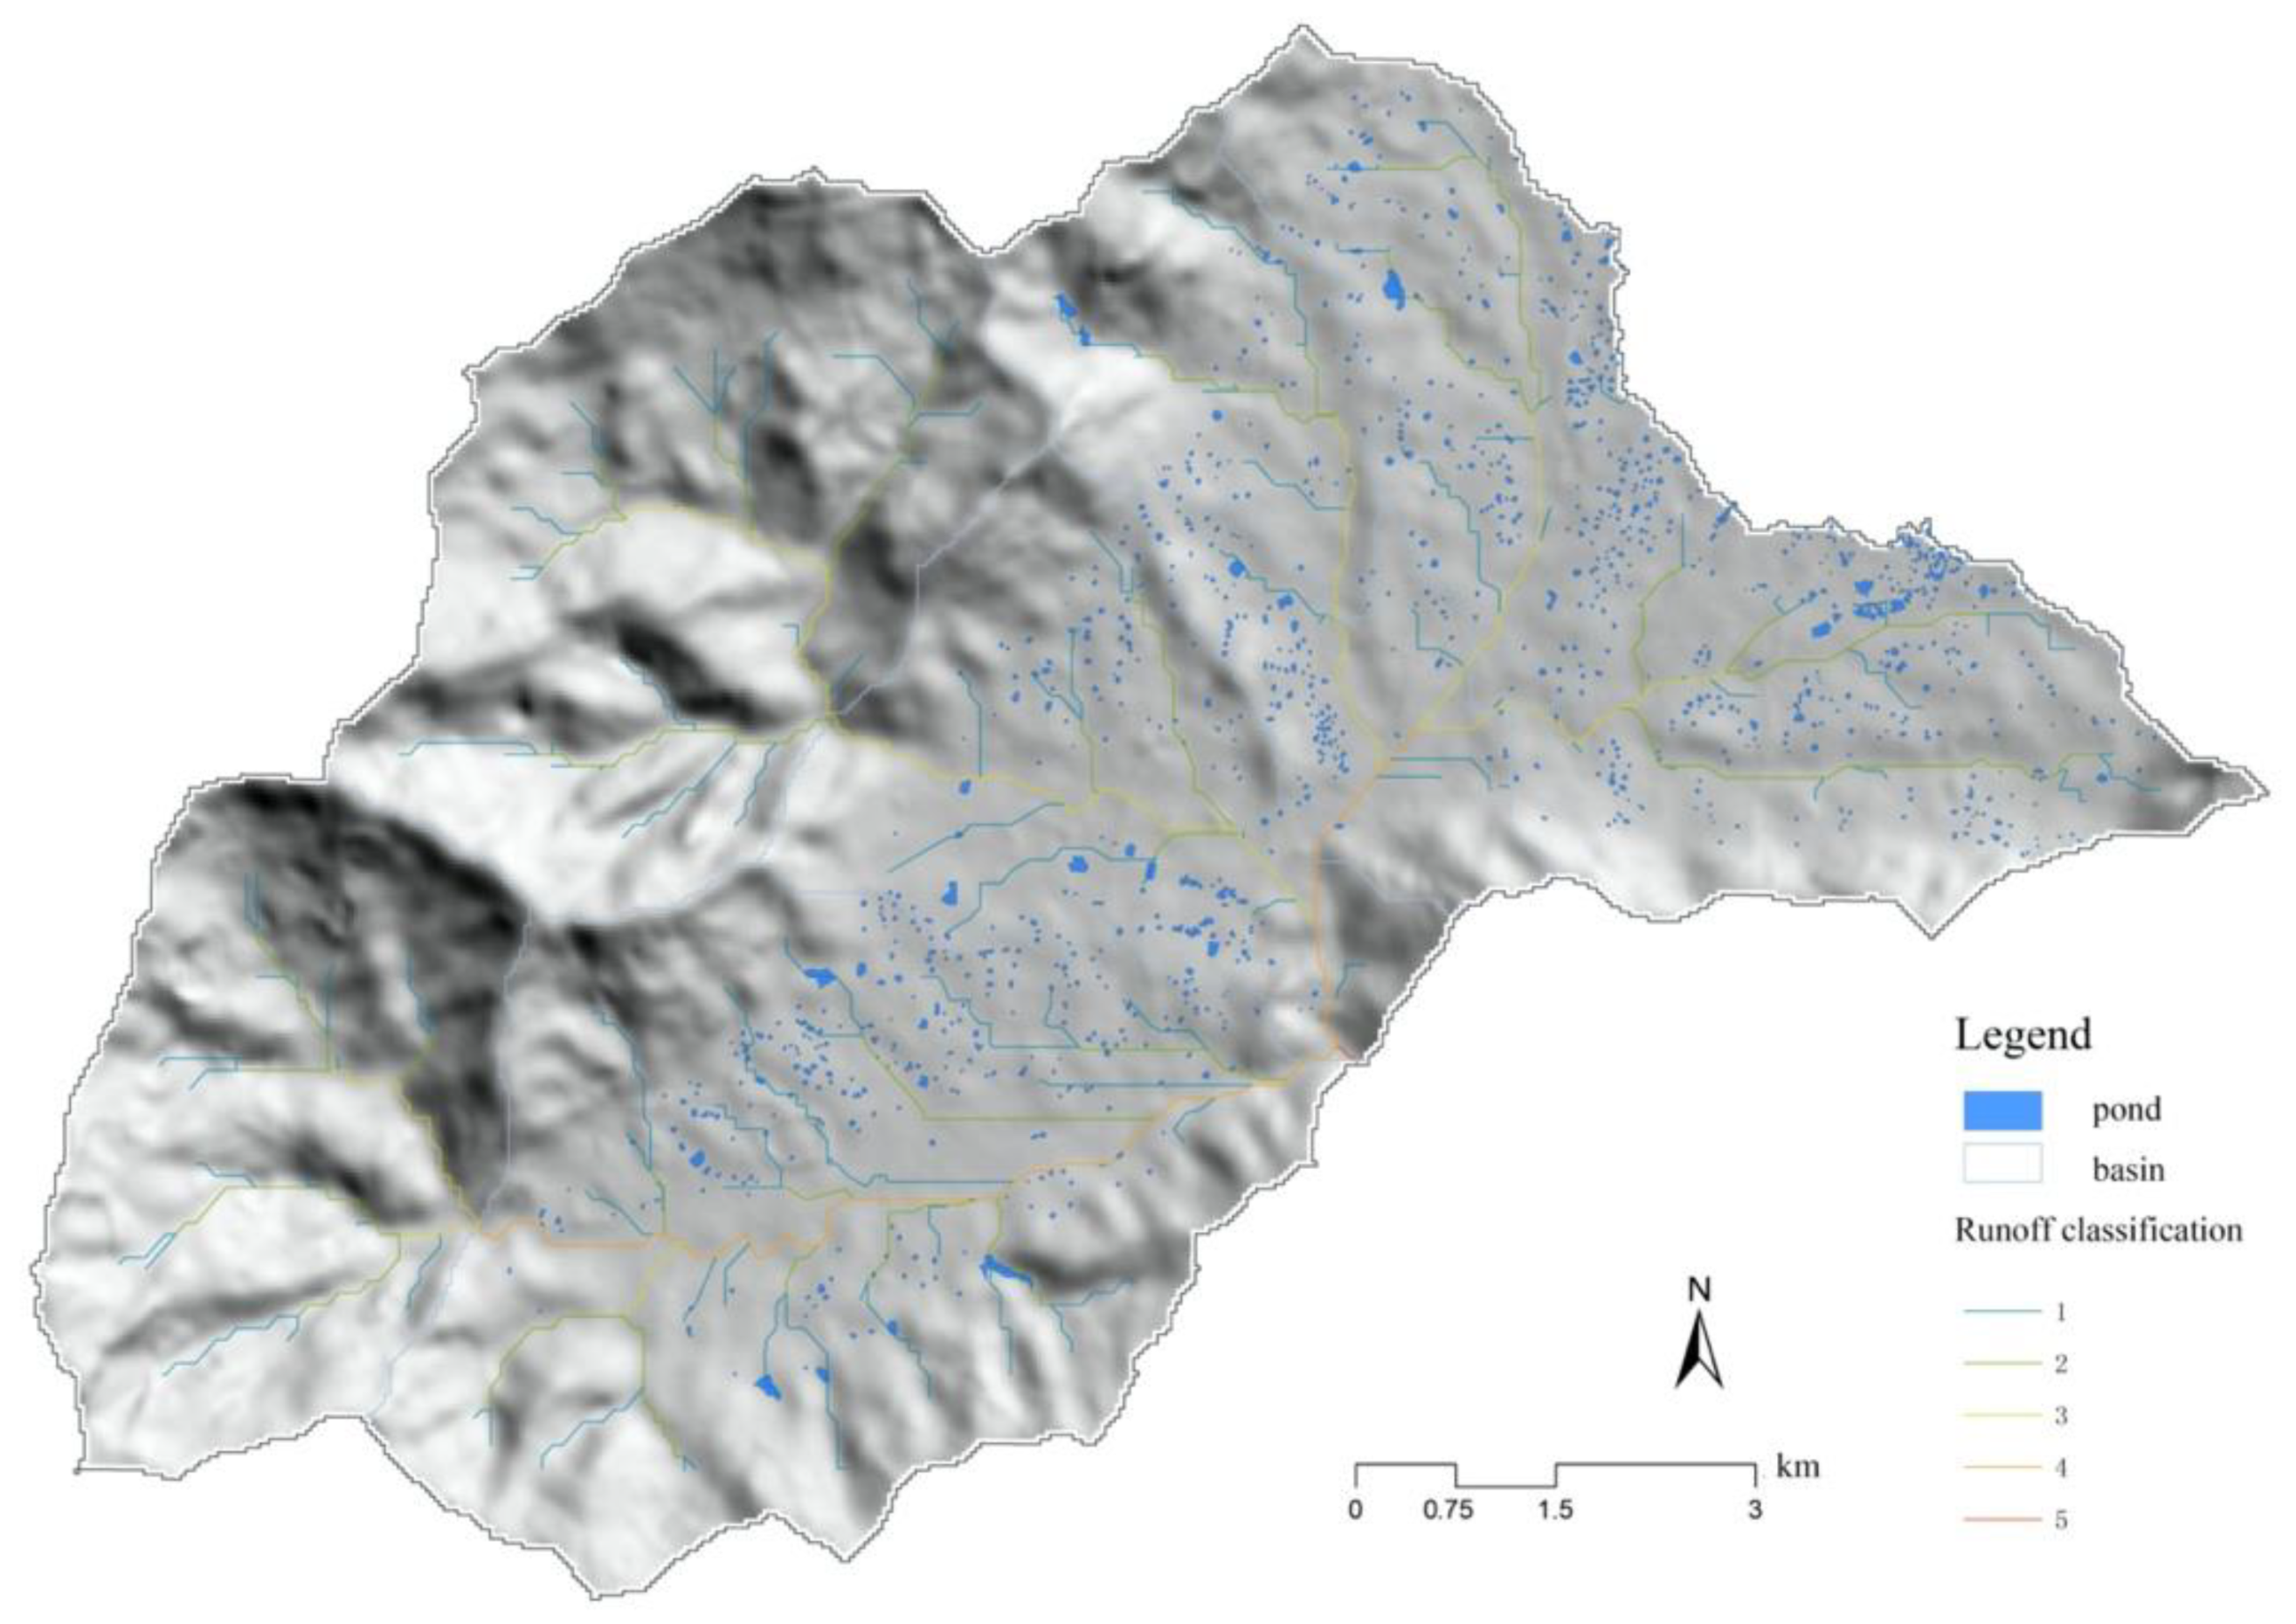
4.2.2. Rivers, Watersheds, and Runoff
- (1)
- Rivers
- (2)
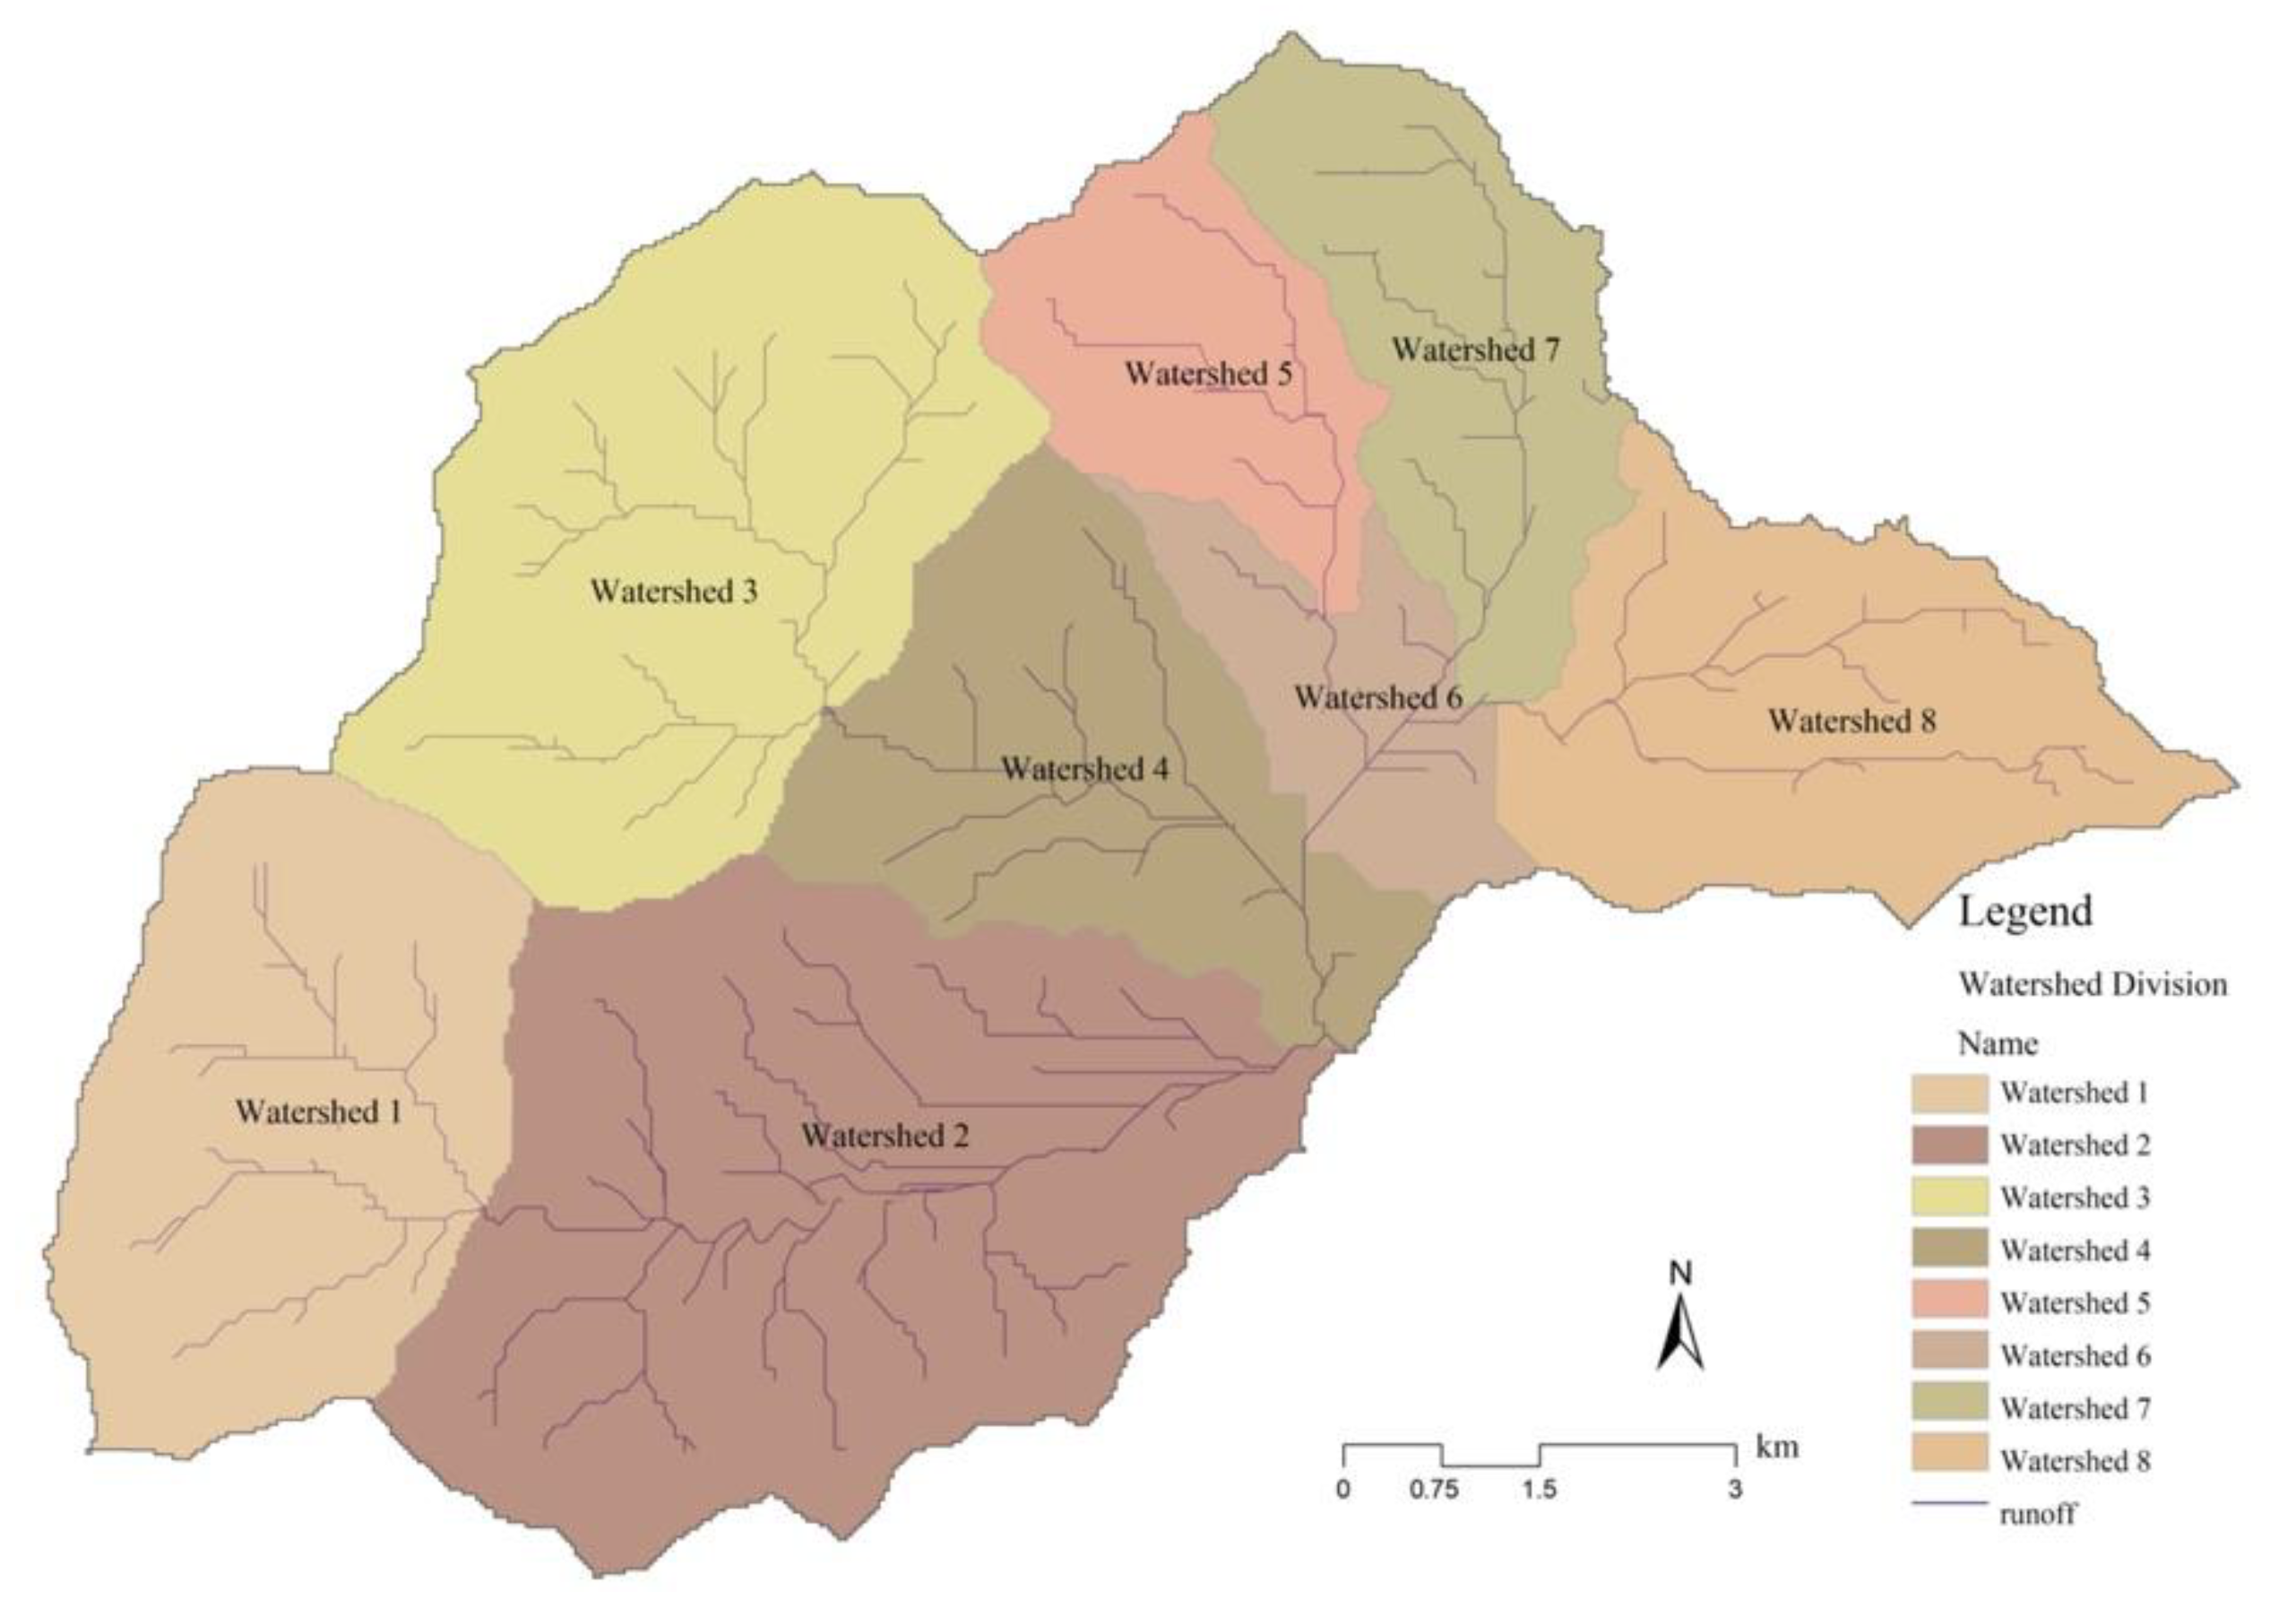
- Watersheds
- (3)
- Runoff
4.2.3. Roads and Villages
- (1)
- Roads
- (2)
- Villages
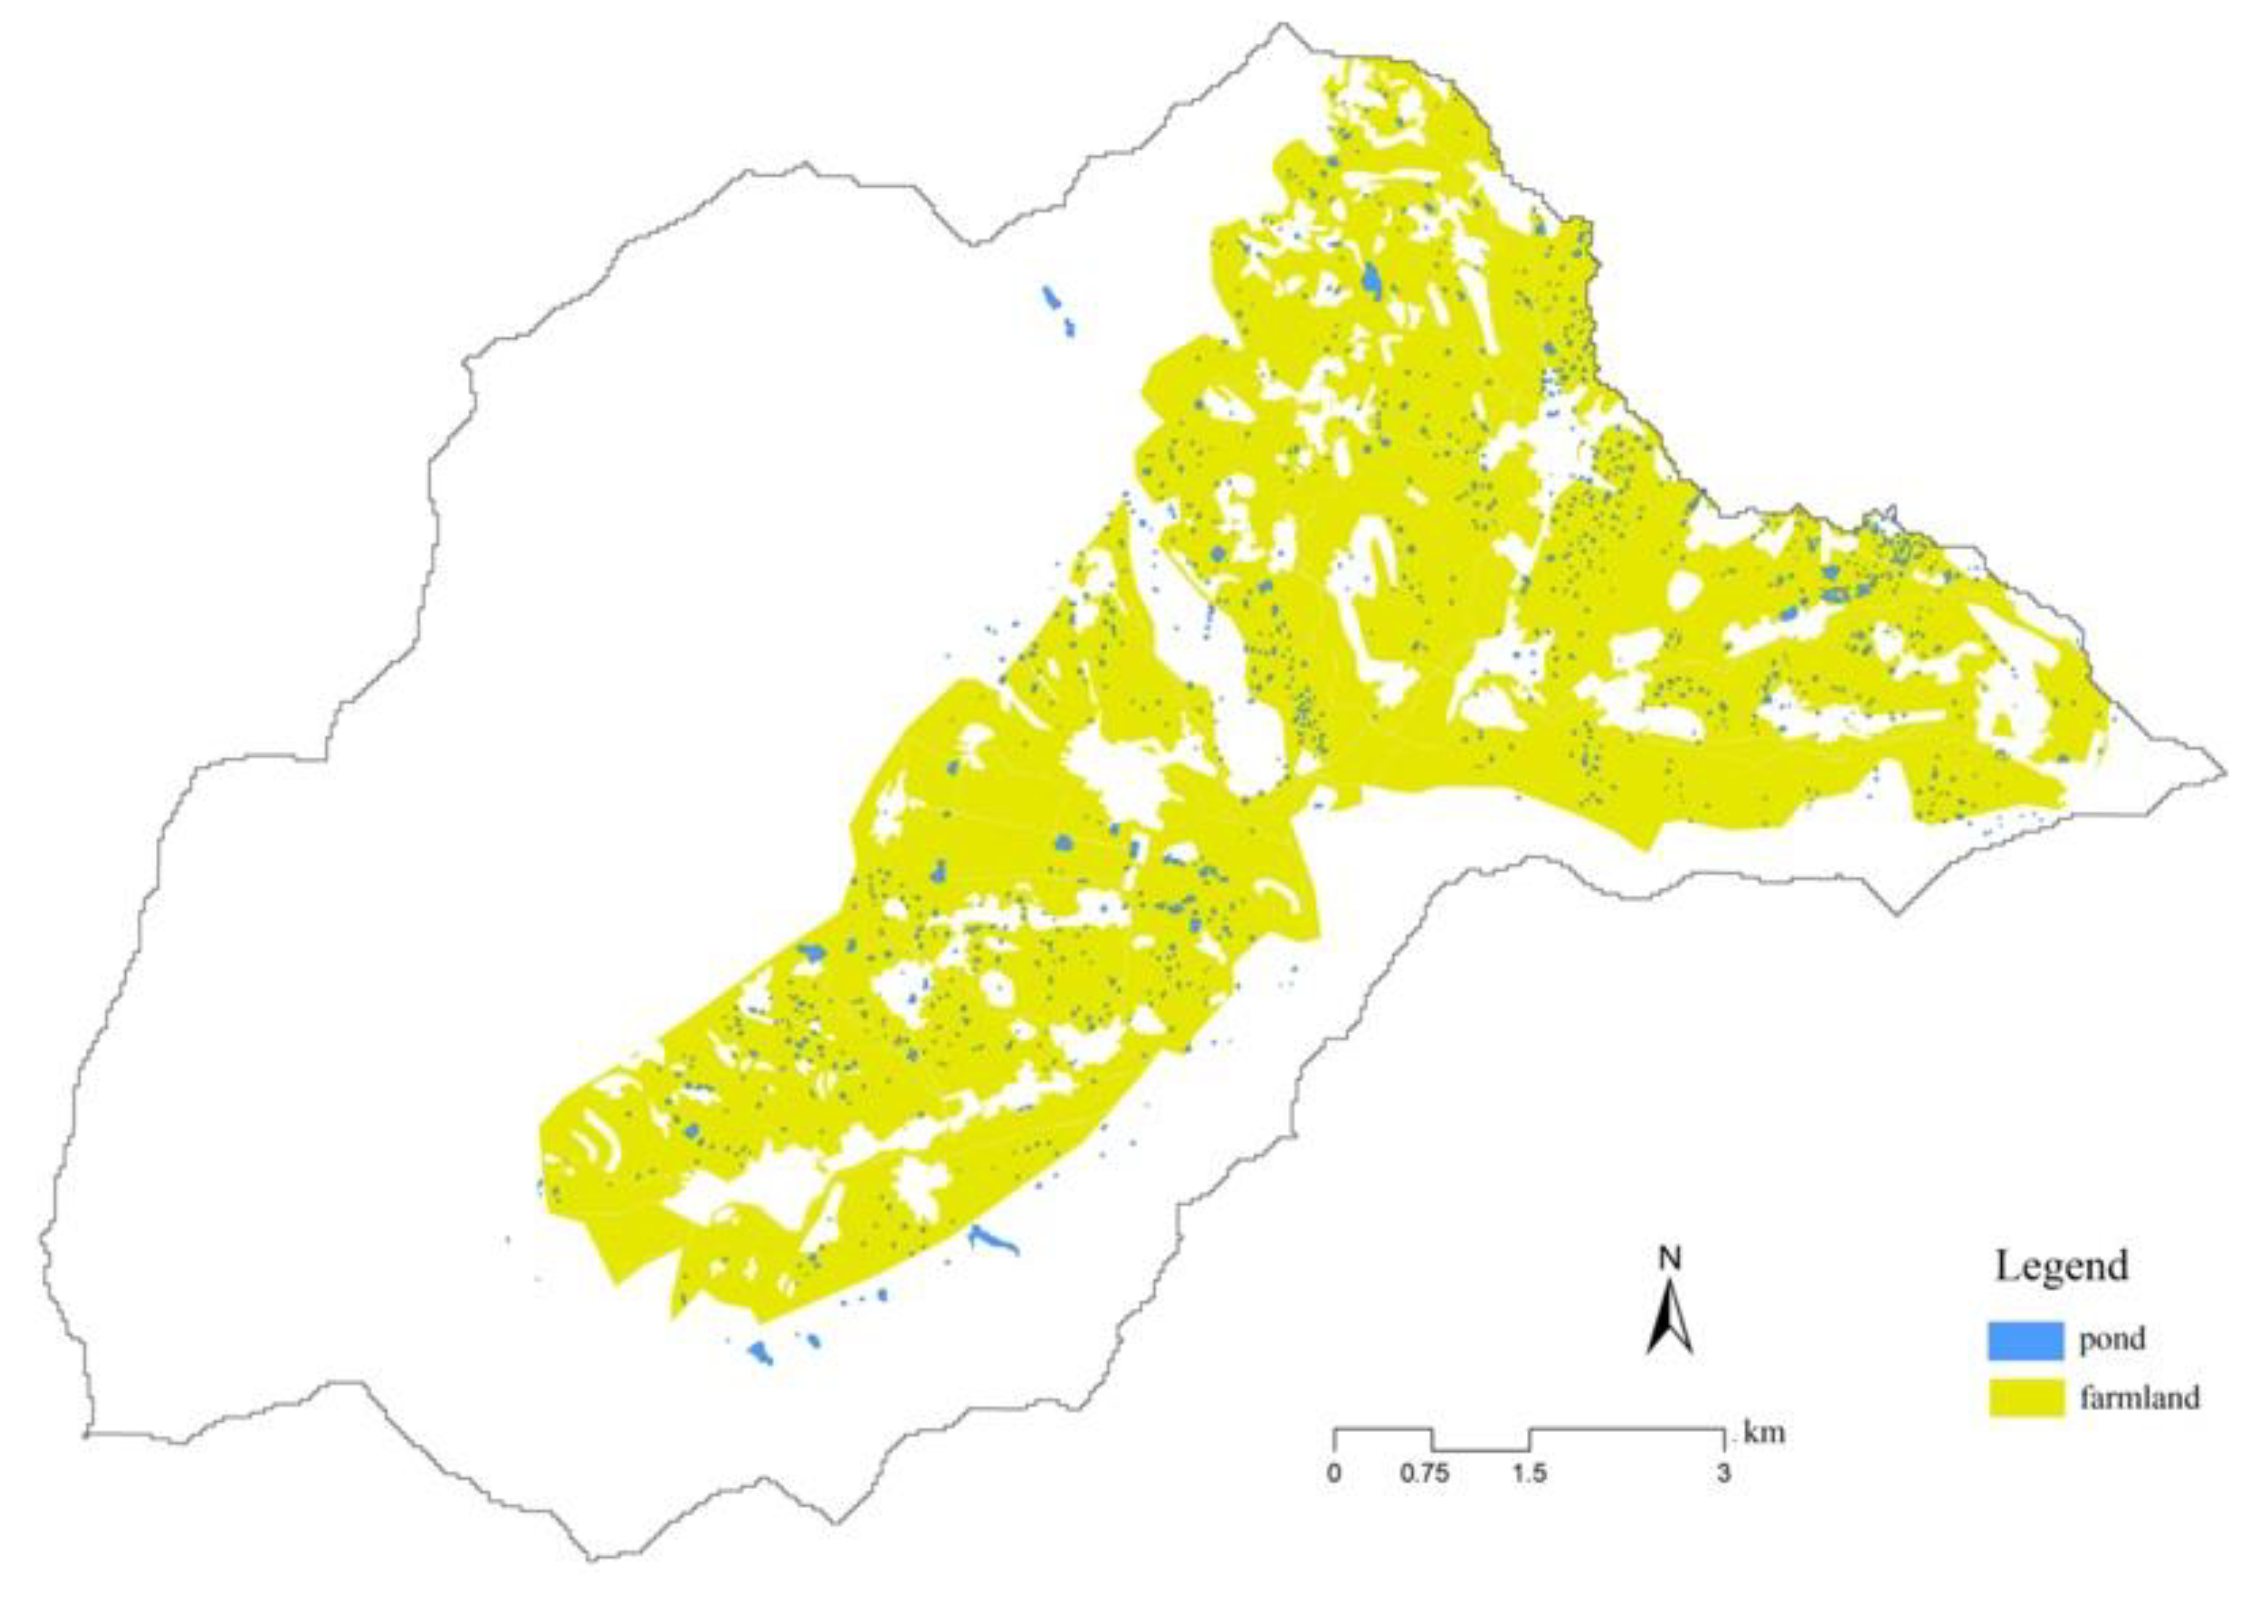
4.2.4. Farmland and Woodland
- (1)
- Farmland
- (2)
- Woodland
4.3. Landscape Pattern
5. Discussions
- (1)
- Open up paddy field in the lowland of hilly country, reserve space for flood discharge
- (2)
- Maximize the rain-collecting area and make rain and floodwater resources
- (3)
- Select high places for settlement layout to avoid flood hazards
6. Conclusions
Author Contributions
Funding
Institutional Review Board Statement
Informed Consent Statement
Data Availability Statement
Conflicts of Interest
References
- Yu, K.; Jiang, Q.; Wang, Z.; Li, M. The research progress and prospect of beitang landscape. Areal Res. Dev. 2015, 34, 130–136. [Google Scholar]
- Chen, W.; Nover, D.; Yen, H.; Xia, Y.; He, B.; Sun, W.; Viers, J. Exploring the multiscale hydrologic regulation of multipond systems in a humid agricultural catchment. Water Res. 2020, 184, 115987. [Google Scholar] [CrossRef] [PubMed]
- Gao, J.; Wang, R.; Huang, J. Ecological engineering for traditional chinese agriculture—A case study of beitang. Ecol. Eng. 2015, 76, 7–13. [Google Scholar] [CrossRef]
- Bertoncin, A.P.d.S.; Pinha, G.D.; Baumgartner, M.T.; Mormul, R.P. Extreme drought events can promote homogenization of benthic macroinvertebrate assemblages in a floodplain pond in brazil. Hydrobiologia 2019, 826, 379–393. [Google Scholar] [CrossRef]
- Hill, M.J.; Hassall, C.; Oertli, B.; Fahrig, L.; Robson, B.J.; Biggs, J.; Samways, M.J.; Usio, N.; Takamura, N.; Krishnaswamy, J. New policy directions for global pond conservation. Conserv. Lett. 2018, 11, e12447. [Google Scholar] [CrossRef] [Green Version]
- Camnasio, E.; Becciu, G. Evaluation of the feasibility of irrigation storage in a flood detention pond in an agricultural catchment in northern italy. Water Resour. Manag. 2011, 25, 1489–1508. [Google Scholar] [CrossRef]
- Gledhill, D.G.; James, P. Socio-economic variables as indicators of pond conservation value in an urban landscape. Urban Ecosyst. 2012, 15, 849–861. [Google Scholar] [CrossRef]
- Yang, J.; Yang, R.; Chen, M.-H.; Su, C.-H.J.; Zhi, Y.; Xi, J. Effects of rural revitalization on rural tourism. J. Hosp. Tour. Manag. 2021, 47, 35–45. [Google Scholar] [CrossRef]
- Yang, J.; Guo, A.; Li, Y.; Zhang, Y.; Li, X. Simulation of landscape spatial layout evolution in rural-urban fringe areas: A case study of ganjingzi district. GISci. Remote Sens. 2019, 56, 388–405. [Google Scholar] [CrossRef]
- Song, X.; Chang, K.-t.; Yang, L.; Scheffran, J. Change in environmental benefits of urban land use and its drivers in chinese cities, 2000–2010. Int. J. Environ. Res. Public Health 2016, 13, 535. [Google Scholar] [CrossRef] [Green Version]
- Bicudo da Silva, R.F.; Batistella, M.; Millington, J.D.; Moran, E.; Martinelli, L.A.; Dou, Y.; Liu, J. Three decades of changes in brazilian municipalities and their food production systems. Land 2020, 9, 422. [Google Scholar] [CrossRef]
- Zhang, L.; Ge, D.; Sun, P.; Sun, D. The transition mechanism and revitalization path of rural industrial land from a spatial governance perspective: The case of shunde district, china. Land 2021, 10, 746. [Google Scholar] [CrossRef]
- Zhao, Z.; Sharifi, A.; Dong, X.; Shen, L.; He, B.-J. Spatial variability and temporal heterogeneity of surface urban heat island patterns and the suitability of local climate zones for land surface temperature characterization. Remote Sens. 2021, 13, 4338. [Google Scholar] [CrossRef]
- Wu, W.; Ma, J.; Guo, Z. A study on the mechanism of rural landscape architecture in rural flower show—Taking beitang village of changxing county as an example. J. Shandong For. Sci. Technol. 2017, 47, 132–135. [Google Scholar]
- Song-tao, Z. Investigation report on rural vegetation in coastal region of beitang in tianjin province. J. Anhui Agric. Sci. 2010, 8, 856–8568. [Google Scholar]
- Wang, J.; Wang, X. New urbanization: A new vision of China’s urban-rural development and planning. Front. Arch. Res. 2015, 4, 166–168. [Google Scholar] [CrossRef] [Green Version]
- Liu, H.; Jia, Y.; Niu, C. “Sponge city” concept helps solve China’s urban water problems. Environ. Earth Sci. 2017, 76, 473. [Google Scholar] [CrossRef]
- Chen, W.; He, B.; Nover, D.; Lu, H.; Liu, J.; Sun, W.; Chen, W. Farm ponds in southern China: Challenges and solutions for conserving a neglected wetland ecosystem. Sci. Total Environ. 2019, 659, 1322–1334. [Google Scholar] [CrossRef]
- Ho, L.T.; Van Echelpoel, W.; Goethals, P.L. Design of waste stabilization pond systems: A review. Water Res. 2017, 123, 236–248. [Google Scholar] [CrossRef]
- Sarkkinen, M.; Kujala, K.; Gehör, S. Decision support framework for solid waste management based on sustainability criteria: A case study of tailings pond cover systems. J. Clean. Prod. 2019, 236, 117583. [Google Scholar] [CrossRef]
- Yang, J.; Wang, Y.; Xiu, C.; Xiao, X.; Xia, J.; Jin, C. Optimizing local climate zones to mitigate urban heat island effect in human settlements. J. Clean. Prod. 2020, 275, 123767. [Google Scholar] [CrossRef]
- Yang, J.; Yang, Y.; Sun, D.; Jin, C.; Xiao, X. Influence of urban morphological characteristics on thermal environment. Sustain. Cities Soc. 2021, 72, 103045. [Google Scholar] [CrossRef]
- Sriyaraj, K.; Shutes, R. An assessment of the impact of motorway runoff on a pond, wetland and stream. Environ. Int. 2001, 26, 433–439. [Google Scholar] [CrossRef]
- Boothby, J. Framing a strategy for pond landscape conservation: Aims, objectives and issues. Landsc. Res. 1999, 24, 67–83. [Google Scholar] [CrossRef]
- Biggs, J.; Williams, P.; Whitfield, M.; Nicolet, P.; Weatherby, A. 15 years of pond assessment in britain: Results and lessons learned from the work of pond conservation. Aquat. Conserv. Mar. Freshw. Ecosyst. 2005, 15, 693–714. [Google Scholar] [CrossRef]
- Harrell, L.J.; Ranjithan, S.R. Detention pond design and land use planning for watershed management. J. Water Resour. Plan. Manag. 2003, 129, 98–106. [Google Scholar] [CrossRef]
- Boothby, J.; Hull, A.P. A census of ponds in cheshire, north west england. Aquat. Conserv. Mar. Freshw. Ecosyst. 1997, 7, 75–79. [Google Scholar] [CrossRef]
- Huang, S.-L.; Lee, Y.-C.; Budd, W.W.; Yang, M.-C. Analysis of changes in farm pond network connectivity in the peri-urban landscape of the taoyuan area, taiwan. Environ. Manag. 2012, 49, 915–928. [Google Scholar] [CrossRef]
- Jeffries, M. Ponds and the importance of their history: An audit of pond numbers, turnover and the relationship between the origins of ponds and their contemporary plant communities in south-east Northumberland, UK. Hydrobiologia 2012, 689, 11–21. [Google Scholar] [CrossRef] [Green Version]
- Fiener, P.; Auerswald, K.; Weigand, S. Managing erosion and water quality in agricultural watersheds by small detention ponds. Agric. Ecosyst. Environ. 2005, 110, 132–142. [Google Scholar] [CrossRef]
- Fairchild, G.W.; Velinsky, D.J. Effects of small ponds on stream water chemistry. Lake Reserv. Manag. 2006, 22, 321–330. [Google Scholar] [CrossRef] [Green Version]
- Geekiyanage, N.; Pushpakumara, D. Ecology of ancient tank cascade systems in island sri lanka. J. Mar. Isl. Cult. 2013, 2, 93–101. [Google Scholar] [CrossRef] [Green Version]
- Shannon, K.; Manawadu, S. Indigenous landscape urbanism: Sri lanka’s reservoir & tank system. J. Landsc. Archit. 2007, 2, 6–17. [Google Scholar]
- Kakade, B.; Neelam, G.; Petare, K. Farm-pond based watershed development: A mechanism for ecosystem and socioeconomic rejuvenation: A case study from adihalli-myllanhalli villages in hassan district, karnataka, india. Water Int. 2003, 28, 519–526. [Google Scholar] [CrossRef]
- Blayac, T.; Mathé, S.; Rey-Valette, H.; Fontaine, P. Perceptions of the services provided by pond fish farming in lorraine (France). Ecol. Econ. 2014, 108, 115–123. [Google Scholar] [CrossRef]
- Hettiarachchi, M.; Morrison, T.H.; Wickramsinghe, D.; Mapa, R.; De Alwis, A.; McAlpine, C.A. The eco-social transformation of urban wetlands: A case study of colombo, Sri Lanka. Landsc. Urban Plan. 2014, 132, 55–68. [Google Scholar] [CrossRef]
- Hill, M.J.; Wood, P.J.; Fairchild, W.; Williams, P.; Nicolet, P.; Biggs, J. Garden pond diversity: Opportunities for urban freshwater conservation. Basic Appl. Ecol. 2021, 57, 28–40. [Google Scholar] [CrossRef]
- Thornhill, I.; Batty, L.; Hewitt, M.; Friberg, N.R.; Ledger, M.E. The application of graph theory and percolation analysis for assessing change in the spatial configuration of pond networks. Urban Ecosyst. 2018, 21, 213–225. [Google Scholar] [CrossRef] [Green Version]
- Swartz, T.M.; Coon, J.J.; Mattes, J.R.; Miller, J.R. Identifying opportunities to conserve farm ponds on private lands: Integration of social, ecological, and historical data. Land 2019, 8, 127. [Google Scholar] [CrossRef] [Green Version]
- Lousada, S.; Cabezas, J.; Castanho, R.A.; Gómez, J.M.N. Hydraulic planning in insular urban territories: The case of madeira island—ribeira brava. Water 2021, 13, 2951. [Google Scholar] [CrossRef]
- Lousada, S.; Castanho, R.A. Gis-based assessment of morphological and hydrological parameters of ribeira dos socorridos and ribeira do vigário basins, madeira island, portugal. Curr. World Environ. 2021, 16, 408–426. [Google Scholar] [CrossRef]
- Silverman, B.W. Density Estimation for Statistics and Data Analysis; Chapman & Hall: London, UK, 1986. [Google Scholar]
- Hall, P.; Sheather, S.J.; Jones, M.; Marron, J.S. On optimal data-based bandwidth selection in kernel density estimation. Biometrika 1991, 78, 263–269. [Google Scholar] [CrossRef]
- Yang, J.; Song, C.; Yang, Y.; Xu, C.; Guo, F.; Xie, L. New method for landslide susceptibility mapping supported by spatial logistic regression and geodetector: A case study of duwen highway basin, sichuan province, china. Geomorphology 2019, 324, 62–71. [Google Scholar] [CrossRef]
- Wang, H.; Qin, F.; Xu, C.; Li, B.; Guo, L.; Wang, Z. Evaluating the suitability of urban development land with a geodetector. Ecol. Indic. 2021, 123, 107339. [Google Scholar] [CrossRef]
- Yu, K. Ecological security patterns in landscapes and gis application. Geogr. Inf. Sci. 1995, 1, 88–102. [Google Scholar] [CrossRef]


| Area of the Beitang (m2) | Number of Beitangs |
|---|---|
| <1000 | 972 |
| 1000–2000 | 148 |
| 2000–5000 | 39 |
| 5000–10,000 | 13 |
| >10,000 | 7 |
| Factors | Aspect | Slope | Distance from Villages | Distance from Roads | Distance from Rivers | Distance of Farmland | Altitude |
|---|---|---|---|---|---|---|---|
| q value | 0.0532 | 0.0839 | 0.1914 | 0.2189 | 0.2763 | 0.3105 | 0.3657 |
| p value | 0 | 0 | 0 | 0 | 0 | 0 | 0 |
Publisher’s Note: MDPI stays neutral with regard to jurisdictional claims in published maps and institutional affiliations. |
© 2022 by the authors. Licensee MDPI, Basel, Switzerland. This article is an open access article distributed under the terms and conditions of the Creative Commons Attribution (CC BY) license (https://creativecommons.org/licenses/by/4.0/).
Share and Cite
Song, S.; Wang, S.; Ye, H.; Guan, Y. Exploratory Analysis on the Spatial Distribution and Influencing Factors of Beitang Landscape in the Shangzhuang Basin. Land 2022, 11, 418. https://doi.org/10.3390/land11030418
Song S, Wang S, Ye H, Guan Y. Exploratory Analysis on the Spatial Distribution and Influencing Factors of Beitang Landscape in the Shangzhuang Basin. Land. 2022; 11(3):418. https://doi.org/10.3390/land11030418
Chicago/Turabian StyleSong, Shangzhou, Shaohua Wang, Huichun Ye, and Yong Guan. 2022. "Exploratory Analysis on the Spatial Distribution and Influencing Factors of Beitang Landscape in the Shangzhuang Basin" Land 11, no. 3: 418. https://doi.org/10.3390/land11030418
APA StyleSong, S., Wang, S., Ye, H., & Guan, Y. (2022). Exploratory Analysis on the Spatial Distribution and Influencing Factors of Beitang Landscape in the Shangzhuang Basin. Land, 11(3), 418. https://doi.org/10.3390/land11030418