1. Introduction
The paper presents the results of research that was developed as a basis for decision-making processes in the context of the impacts of global climate change. It deals with a very important part of the urban environment, namely urban forests, which are significant in mitigating the impacts of climate change (in the landscape and urban space). However, urban forests themselves are critically threatened by the impacts of climate change. When taking planning measures in periurban forests, these two realities must always be addressed simultaneously: adaptation measures to mitigate the effects of climate change on the forest complex in question and its use to mitigate the effects of climate change on its surroundings must both be considered. The research was carried out near the town of Mladá Boleslav. The aim was to analyse the hydrological regime of the Štěpánka Forest Park—which has the nickname, “the lungs of Mladá Boleslav”—in the context of the current state of the site, especially focusing on the tree communities currently found on the site, to assess how this state might change in the event of significant impacts of climate change (drought). In addition to describing the characteristics of the water regime of the site, this paper aims to describe:
Current (visible) changes in habitat and forest characteristics due to global climate change;
Predicted changes in runoff conditions of the site in relation to the change in water balance parameters caused by the changes of forest structure in the locality;
Predicted threats caused by the changes in relation to changed runoff conditions—changes in potential water retention in the area, potential erosion threats.
Based on the results of this analysis, we then propose framework adaptation measures in individual types of tree vegetation communities, especially with regard to the restoration technologies of this important site, the tree composition of “matrix forest stand”, meaning an ecologically appropriate forest stand (tree species composition, structure, texture) without specific park interventions (aesthetics, exotic tree species, cultivars etc.), and the phasing of forest park restoration.
The importance of urban greenery in mitigating the effects of climate change has been demonstrated in many studies, e.g., [
1,
2,
3,
4]. Regarding urban forests in particular, many factors are pertinent. One of the most important is where the forest is located in relation to the city—whether it is in the centre or at the edge. If we look, for example, at the Bela forest in Ostrava, we find that it is almost in the centre of the city, largely surrounded by a built-up area. From the information available, we also find that this forest and others in the Ostrava district fall into the category of special-purpose forests with the main function of recreation [
5].
A number of other urban forests also fall under the category of special purpose forests. However, some, such as the Hradec Králové urban forests, are not included in this category as they are located on the outskirts of the city and are not completely surrounded by buildings. In Hradec Králové, the city tries to accommodate recreation as well, as evidenced by the number of hiking trails. Nevertheless, it does not restrict the production potential of the forest in any way, so it could be described as an economic forest [
6]. From this example, we can see that urban forests are individual and unique and fulfil different functions, either productive or nonproductive, to different extents.
In her publication on their positive impacts of urban green spaces, Dr Šerá [
7] divides their functions into three categories: environmental, economic and social–psychological.
Forests are threatened by climate change [
8,
9,
10,
11]. Anthropogenic influences will continue to contribute to climate change in the future [
12]. On the other hand, forests also help mitigate the effects of climate change. From an environmental point of view, trees in cities help to lower the temperature of urban heat islands. This phenomenon can be observed mostly at night and depending on the season [
13]. The cooling effect of green islands extends beyond their immediate area. The cooling effects on the city are most pronounced in the summer—the time when cooling is most needed [
14].
Deutscher et al. [
15] were able to obtain coefficients of determination (R
2) of 0.66 and 0.73 for probe-measured and simulated soil moisture under tree stand and park lawn land cover, respectively. The results demonstrated that tree cover had a significant positive effect on the hydrological regime of the locality through interception, transpiration and the effects on soil moisture. Simulations suggested that tree cover was twice as effective at mitigating runoff than park lawn and almost seven times better than impervious surfaces. In the case of the potential replacement of trees in favour of park lawn or impervious surfaces, an increase in runoff of 14% and 81% respectively could be expected. Rainwater infiltration in urban environments through artificially created habitats is summarised by Funai and Kupec [
16,
17], who present the results of a 3-year experiment in Ohio [
17]. Analysis suggests that incorporating expanded shale into bioremediating gardens as a replacement for high sand content can maintain all engineering specifications and may increase the survival rates of plants beyond rates currently found in high-sand-content rain gardens. The survival rate for plants in the control plot was 48.3%, while experimental plots were 96.5% and 75.8%, respectively.
The study of Bowler et al. [
18] showed that green areas had an average temperature of 1 °C less than built-up areas. Vegetation reduces the urban heat island effect and can also reduce temperatures globally. Since high temperatures are detrimental to human health, green spaces are essential [
19].
Cooling occurs by evapotranspiration [
7], which is based on a calculation of the evaporation of water from the ground and also includes the removal of water from vegetation. Thus, not only does cooling occur, but also the humidification of the air.
From an environmental point of view, however, this is not all that vegetation in the city provides. One of the other functions of trees in the city is to improve air quality. In the United States, a study has been published using data on the concentrations of pollutants (ozone, sulphur dioxide, carbon monoxide and nitrogen dioxide) and the subsequent removal of these compounds by urban vegetation. The investigation was carried out in 55 cities and shows that the improvement in air quality increases with the amount of vegetation. Particulate matter is removed from the air all year round. Furthermore, the study estimates that tree cover removed up to 711,000 tons of pollutants from the air per year in US cities [
20].
Greenery is also important from a sociopsychological point of view. It is proven that being in nature or just looking at greenery triggers positive physiological reactions. For example, Brown et al. [
21] say it can reduce the effects of stress factors and has a positive effect on mental and psychological health. It has been observed that just looking at greenery lowers the heart rate and generally calms down the body. It is also proven that greenery near human dwellings has a positive effect on human physical activity. The proximity of green spaces can influence a person’s physical activity [
22], and has been shown to reduce respiratory diseases, cardiovascular diseases and mental disorders [
23]. On the other hand, Šerá [
24] states we can also encounter the negative impact of greenery. Pollen, flying fluff, thorns and the toxicity of some plants are often mentioned. However, all this can be eliminated by the right choice of tree species.
Aesthetics, in a study by Tyrväinen and Miettinen [
25], refers to people’s preference for living in a pleasant environment and is reflected in property prices. The presence of trees is valued by people, so if trees are lost, financial compensation is required [
26].
As was mentioned in the Introduction, one of the main aims of the article is to assess the differences in the water regime parameters (especially the precipitation/runoff ratio) of urban forests in their current state and when they are strongly affected by drought, one of the consequences of climate change.
There are a number of methods for assessing the runoff conditions of a site in relation to changes in water balance parameters. One that could be applied is the Soil Conservation Service curved number method of runoff curve numbers (CN). This is a conceptual and empirical hydrological model used to estimate the volume of direct runoff in small catchments, up to about 10 km
2, based on the height of the rainfall event, from a parameter referred to as the CN curve [
27]. The runoff curve number method was designed in the USA for the Soil Conservation Service and published in 1954 in the National Engineering Handbook, Hydrology
Section 4. The method is widely used mainly because of its simplicity and relatively low input data requirements. The key parameter is the CN number, which summarises the characteristics of the watershed. These are the soil hydrological characteristics, land use and land management, and previous saturation of the catchment [
27,
28]. The method of runoff curve numbers applicable to engineering practice and adapted for use in the Czech Republic was introduced in the valid methodology of Janeček et al. [
29]. In design practice in the Czech Republic, it is used for designing technical erosion control measures such as for paths of concentrated surface runoff, swales, ditches and protective dykes, and for assessing the impact of erosion control measures on surface runoff [
29]. Rainfall-runoff models based on the CN curve method are a widely used analytical tool. Nowadays, in the era of dynamic development of geographic information system (GIS) and earth remote sensing (ERS) tools, semidistributed and fully distributed forms of input data are increasingly applied [
30]. The model describes average trends, which precludes its perfect prediction. Another limitation is the unsuitability of the method for low rainfall and higher frequency of occurrence, and it does not account for spatiotemporal variability or the intensity of rainfall. The application is limited to causal rain of constant intensity throughout its course [
27,
28,
30,
31,
32,
33,
34,
35,
36].
The rational method of runoff calculation, also known as the runoff coefficient method, can be used to calculate the amount of retained water and runoff from a site. The rational method was first used in 1889 and developed by Emil Kuichling. The rational equation is the easiest method to obtain peak runoff from a watershed; it is the most common and quickest method of runoff estimation. The rational method is the oldest, but probably the most widely used, method for designing storm drains. It is for small areas, especially the size of the drainage basin fixed to a few acres [
37].
2. Materials and Methods
The area of interest, Štěpánka Forest Park, is located to the south-east of the town of Mladá Boleslav, in the Central Bohemia Region. The Klenice River, a left-side tributary of the Jizera River, flows through the site. It is an extensive complex of vegetation, playgrounds and sports areas (volleyball, tennis, etc.). The park was founded in 1881 and was revitalised in 2014, when paths were improved, new public lighting was installed and new furniture (benches, trash cans, bike racks and information signs) was provided. An observation pier with seating was built at the widest point of the river and the terrain was landscaped. The altitude ranges from 204 to 238 m above sea level. The total area of the project area is 31.02 ha. The basic situation of the park and its projection onto an aerial image is presented in
Figure 1.
The floodplain has soils with medium infiltration rates even at full saturation, comprising mainly medium-to-deep, moderately-to-well-drained, loamy-to-clayey loam soils. The slopes of the park belong to the hydrological group of soils with high infiltration rates even at full saturation, comprising mainly deep, well-to-excessively-drained sands and gravels [
38].
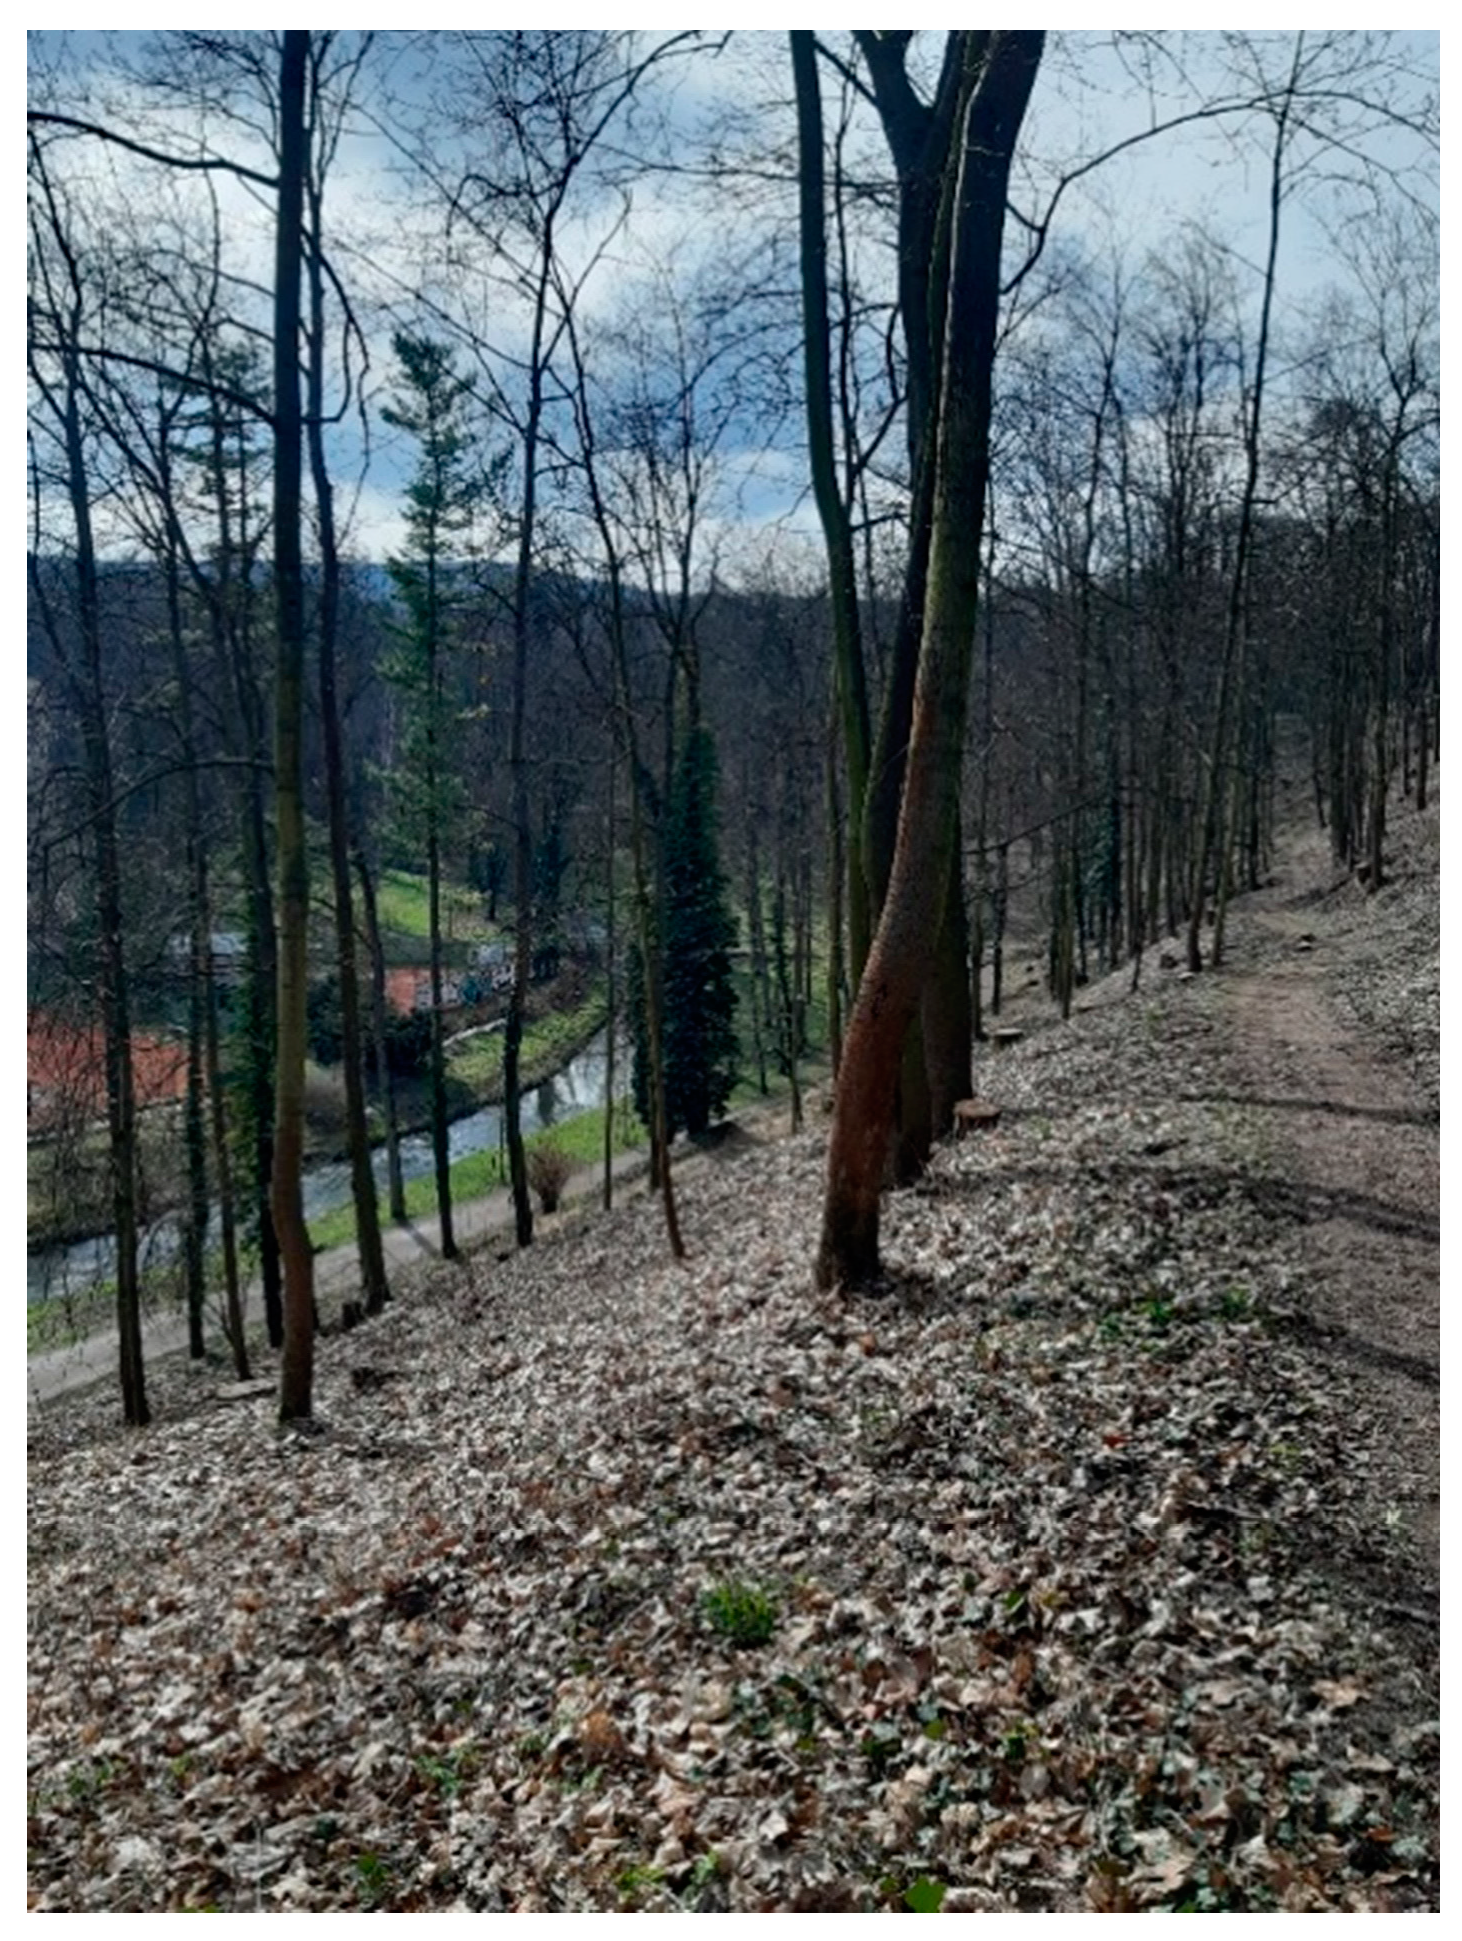
The vegetation on the site has the character of an involved forest stand, mostly at the mature stage (older stands); some stands are on the verge of regeneration. The forest cover is mostly composed of a mixture of tree species that can be characterised as natural in terms of habitat conditions, with a varying admixture of non-native tree species that have been introduced into the stands primarily to enhance species diversity and aesthetics. The spatial differentiation of species, or the presence of non-native (parkland, exotic trees), as well as the structure of the stands, is entirely consistent with the notional zoning of the park. In the locations most attractive to visitors (the central part of the park), non-native species (especially conifers) are often found in individual plantations, while the peripheral parts of the park are more akin to a ‘forest’, both in terms of species composition and structure. Except for the central part of the park (the valley floodplain), which has been adapted for recreational purposes, the current forest communities correspond significantly to the original forest communities, with the obvious modification of the park forest (see
Figure 2). The forest park has an original park core, which is surrounded by forest stands originally established for timber production. It is not currently used for this purpose, however, production trees are still part of its constitution.
The current tree composition of the park is very diverse. It can be simplistically divided into two categories. The first category consists of stands of native trees with an admixture of economic trees and trees that can be described as invasive, that have been introduced into the stands probably for economic reasons. In these stands, the main species are winter oak, heart lime, Norway maple, hornbeam, ash, beech and, to a lesser extent, alder and willow. The economically usable tree species present are larch and Scots pine. Previously, there was probably also spruce in the forest stands, but this was probably removed when it died because of the drought. White fir was probably also of economic importance, but this species can also be observed naturally occurring in the area in the inversions of vegetation stages. The white acacia can be considered an invasive economic tree species, and somewhere on the borderline of this group is the Douglas fir, which is also sporadically found on the site. The second category of trees is park trees, whose function is primarily compositional and aesthetic. This includes some of the above-mentioned species (fir, Douglas fir), but of particular importance are the red yew, various species of exotic firs and pines and representatives of the cypress family.
Methodologically, the current status of the park forest stands was evaluated using standard methods. The forest communities (
Figure 2) were classified using the simplified classification of the Czech forest typology system [
39]. The current effects of a shortage of water on the forest stands were assessed visually using the method of random sampling plots so that in each forest community several plots were situated according to the relevant conditions (forest structure, the age of the forest, terrain character etc.).
The ICCP reports [
40] speak of several scenarios of an average increase in the Earth’s temperature between 1.1 and 6.4 °C by the end of the 21st century. Although the trend is not linear and the change will not be uniform over the area, a simplified view is that the change will be about 3 °C in 2100, i.e., about 1.5 °C in 2050, in about 30 years’ time.
In the Czech Republic, vertical forest vegetation stages are defined according to the combination of temperature and precipitation [
41], and the potential forest communities that occur on them are also defined.
If the average annual temperature increases by 1.5 °C, the area will experience a shift in vegetation stages as predicted by some authors [
42,
43]. This will result in degradation of forest stands, as they will not be able to respond flexibly to the change in mean annual temperature (here the term “forest degradation”). As the presented site is located in an urban park permanently visited by city residents, it is absolutely unthinkable to leave degraded forest cover on the site for safety reasons. The park manager will be forced to remove the forest cover. Therefore, the area will be free of forest cover, hence the term ‘deforestation’.
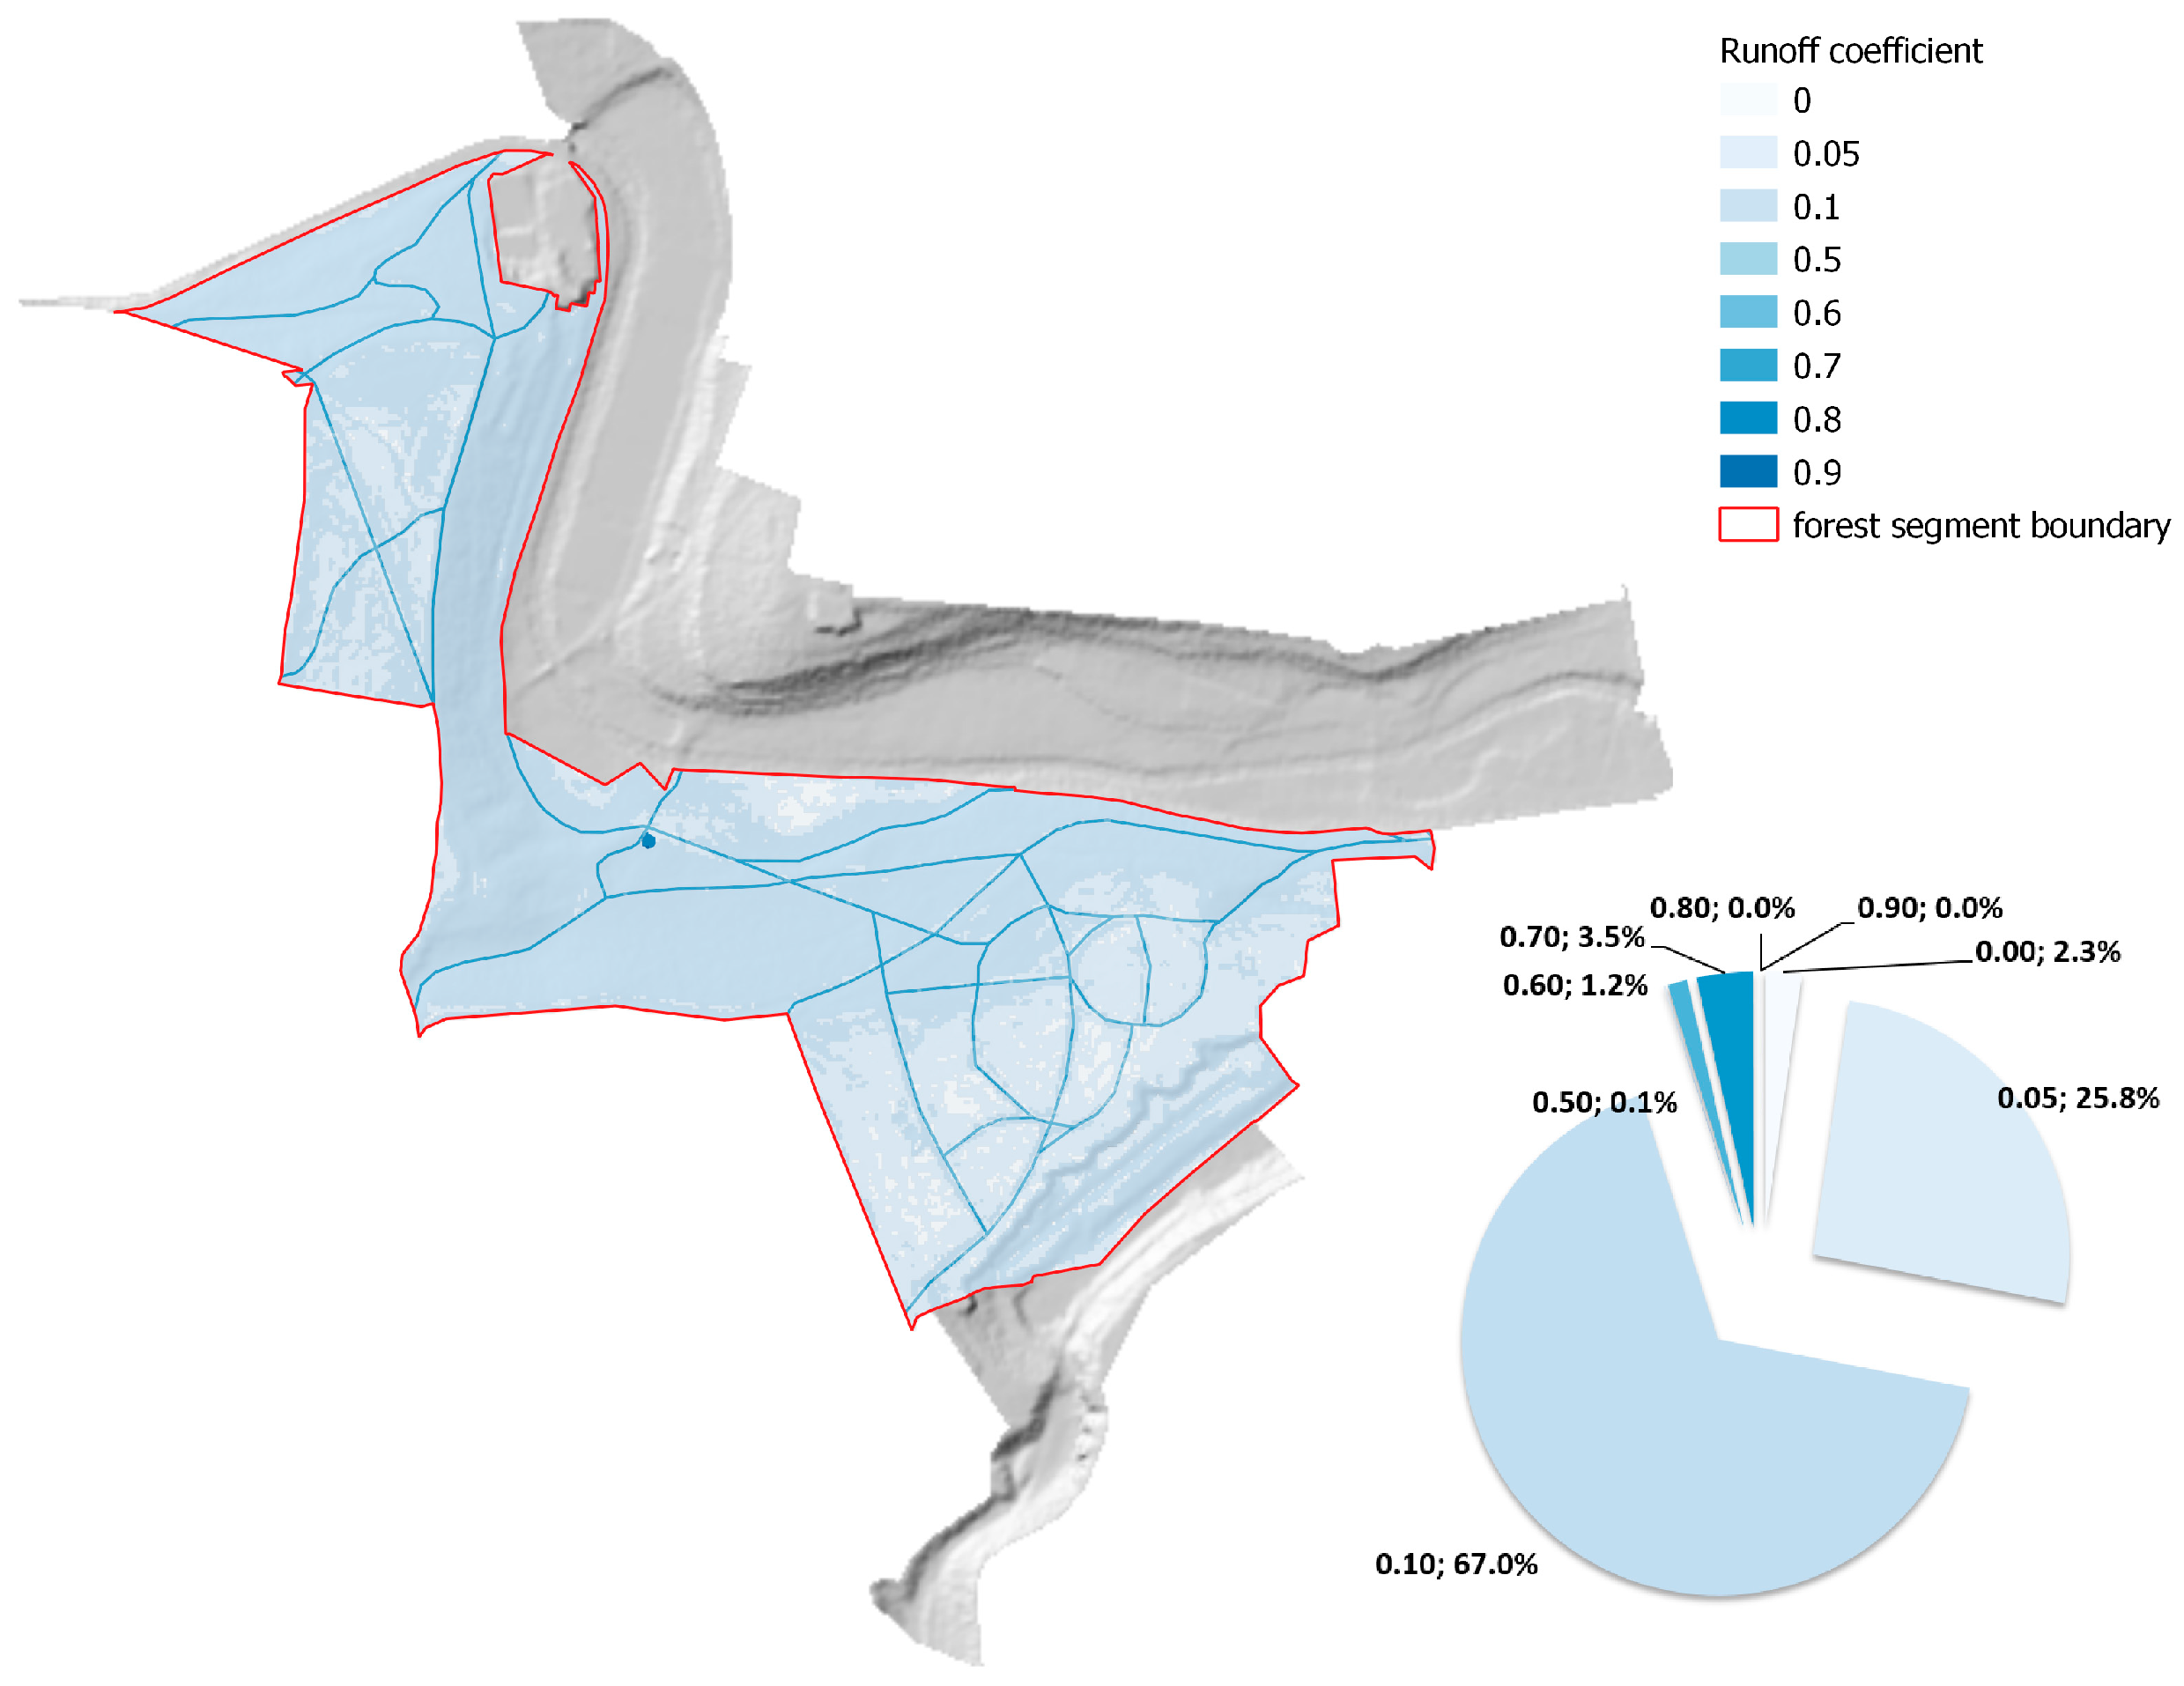
A model of the runoff coefficient was made for the whole park area, as well as for the part on the left bank of the Klenice River (forested part). The runoff and water retention characteristics were calculated for the left bank (forested part) of the site and were then compared for the current state and for the possible deforestation of this part of the park. In this part of the park, with its steep wooded slopes, significant changes in runoff (water balance parameters) were expected due to deforestation. The rational method of runoff calculation [
41], also known as the runoff coefficient method, was selected as the most appropriate for estimating the amount of water retained and run off from the site. The analysis of the site and input data for the runoff modelling was carried out over a map base and digital relief model of the Czech Republic 5th generation (DMR 5G). A digital terrain model of the park was created by interpolating data from DMR 5G. This represents a digital representation of the natural or human-modified land surface in the form of discrete point heights in an irregular triangular area network, with a full mean error in height of 0.18 m in exposed terrain and 0.30 m in forested terrain.
The values of short-term rain intensity were obtained from the DES_RAIN program, which was developed in 2011 by Darina Vaššová and Pavel Kovář [
44]. The station Mladá Boleslav was chosen to obtain the values of short-term rain intensity (rainfall events with a duration of up to 120 min and recurrence intervals of 2, 5, 10, 20, 50 and 100 years) (see
Table 1).
According to ČSN 75 6101 Sewerage systems and sewerage connections [
45]—recommended frequencies and periodicities of calculated rainfall using rational methods [
41]—the design rainfall with a periodicity of 0.2, which corresponds to a frequency of once every five years, was determined. The calculation was made for rainfall events with a duration of up to 120 min and recurrence intervals of 2, 5, 10, 20, 50 and 100 years.
Based on ČSN 75 6101 Sewerage networks and sewerage connections [
45] and on the basis of TNV 75 9011 Rainwater management [
46], the surface runoff from the area under consideration was calculated, both under the existing land use and under the condition without vegetation. For the rational method, the ‘runoff coefficient’ method was applied with runoff coefficient values according to TP 83 Drainage of roads [
46]. For individual areas of the site, values were used according to the slope and land use divisions.
The slope of the area was reclassified into slope classes in relation to the analytical methods used to determine the rainfall-runoff ratios according to ČSN 75 6101 [
45] and TP 83 [
47] the hypsometry of the site. The hypsometry of the site was also partially used to determine the segments of woody vegetation or the definition of forest vegetation stages, as well as to analyse the potential erosion hazard of the site that would result from the destruction of the forest cover on the site due to drought.
In addition to the amount of runoff, the volume of water draining from the site, peak flows, rainfall and runoff balances indicative of the potential retention capacity of the site were determined. The runoff in this context is seen as a balance parameter that can be modelled simply by the chosen method, with the other parameters either remaining constant (rainfall) or changing with a direct effect on runoff (plant transpiration or evapotranspiration).
The surface runoff (l
s
−1) was calculated using the rational method given in ČSN 75 6101 [
38], according to the equation:
Q—maximum storm water runoff, in l s−1;
Ψ—runoff coefficient (0 < Ψ ≤ 1), dimensionless;
S—catchment area measured horizontally, in ha;
i—intensity of the standard rainfall of the considered periodicity, in ls−1 ha−1.
The runoff volume calculation is based on the runoff method used. It is the total amount of water (m
3) that will flow out of the area during a given rainfall event. It was determined on the basis of the relationship:
where
O—volume of storm-water runoff, in m3;
Ψ—runoff coefficient (0 < Ψ ≤ 1), dimensionless;
S—catchment area measured horizontally, in ha;
Ht—rainfall of the considered rainfall periodicity, in mm.
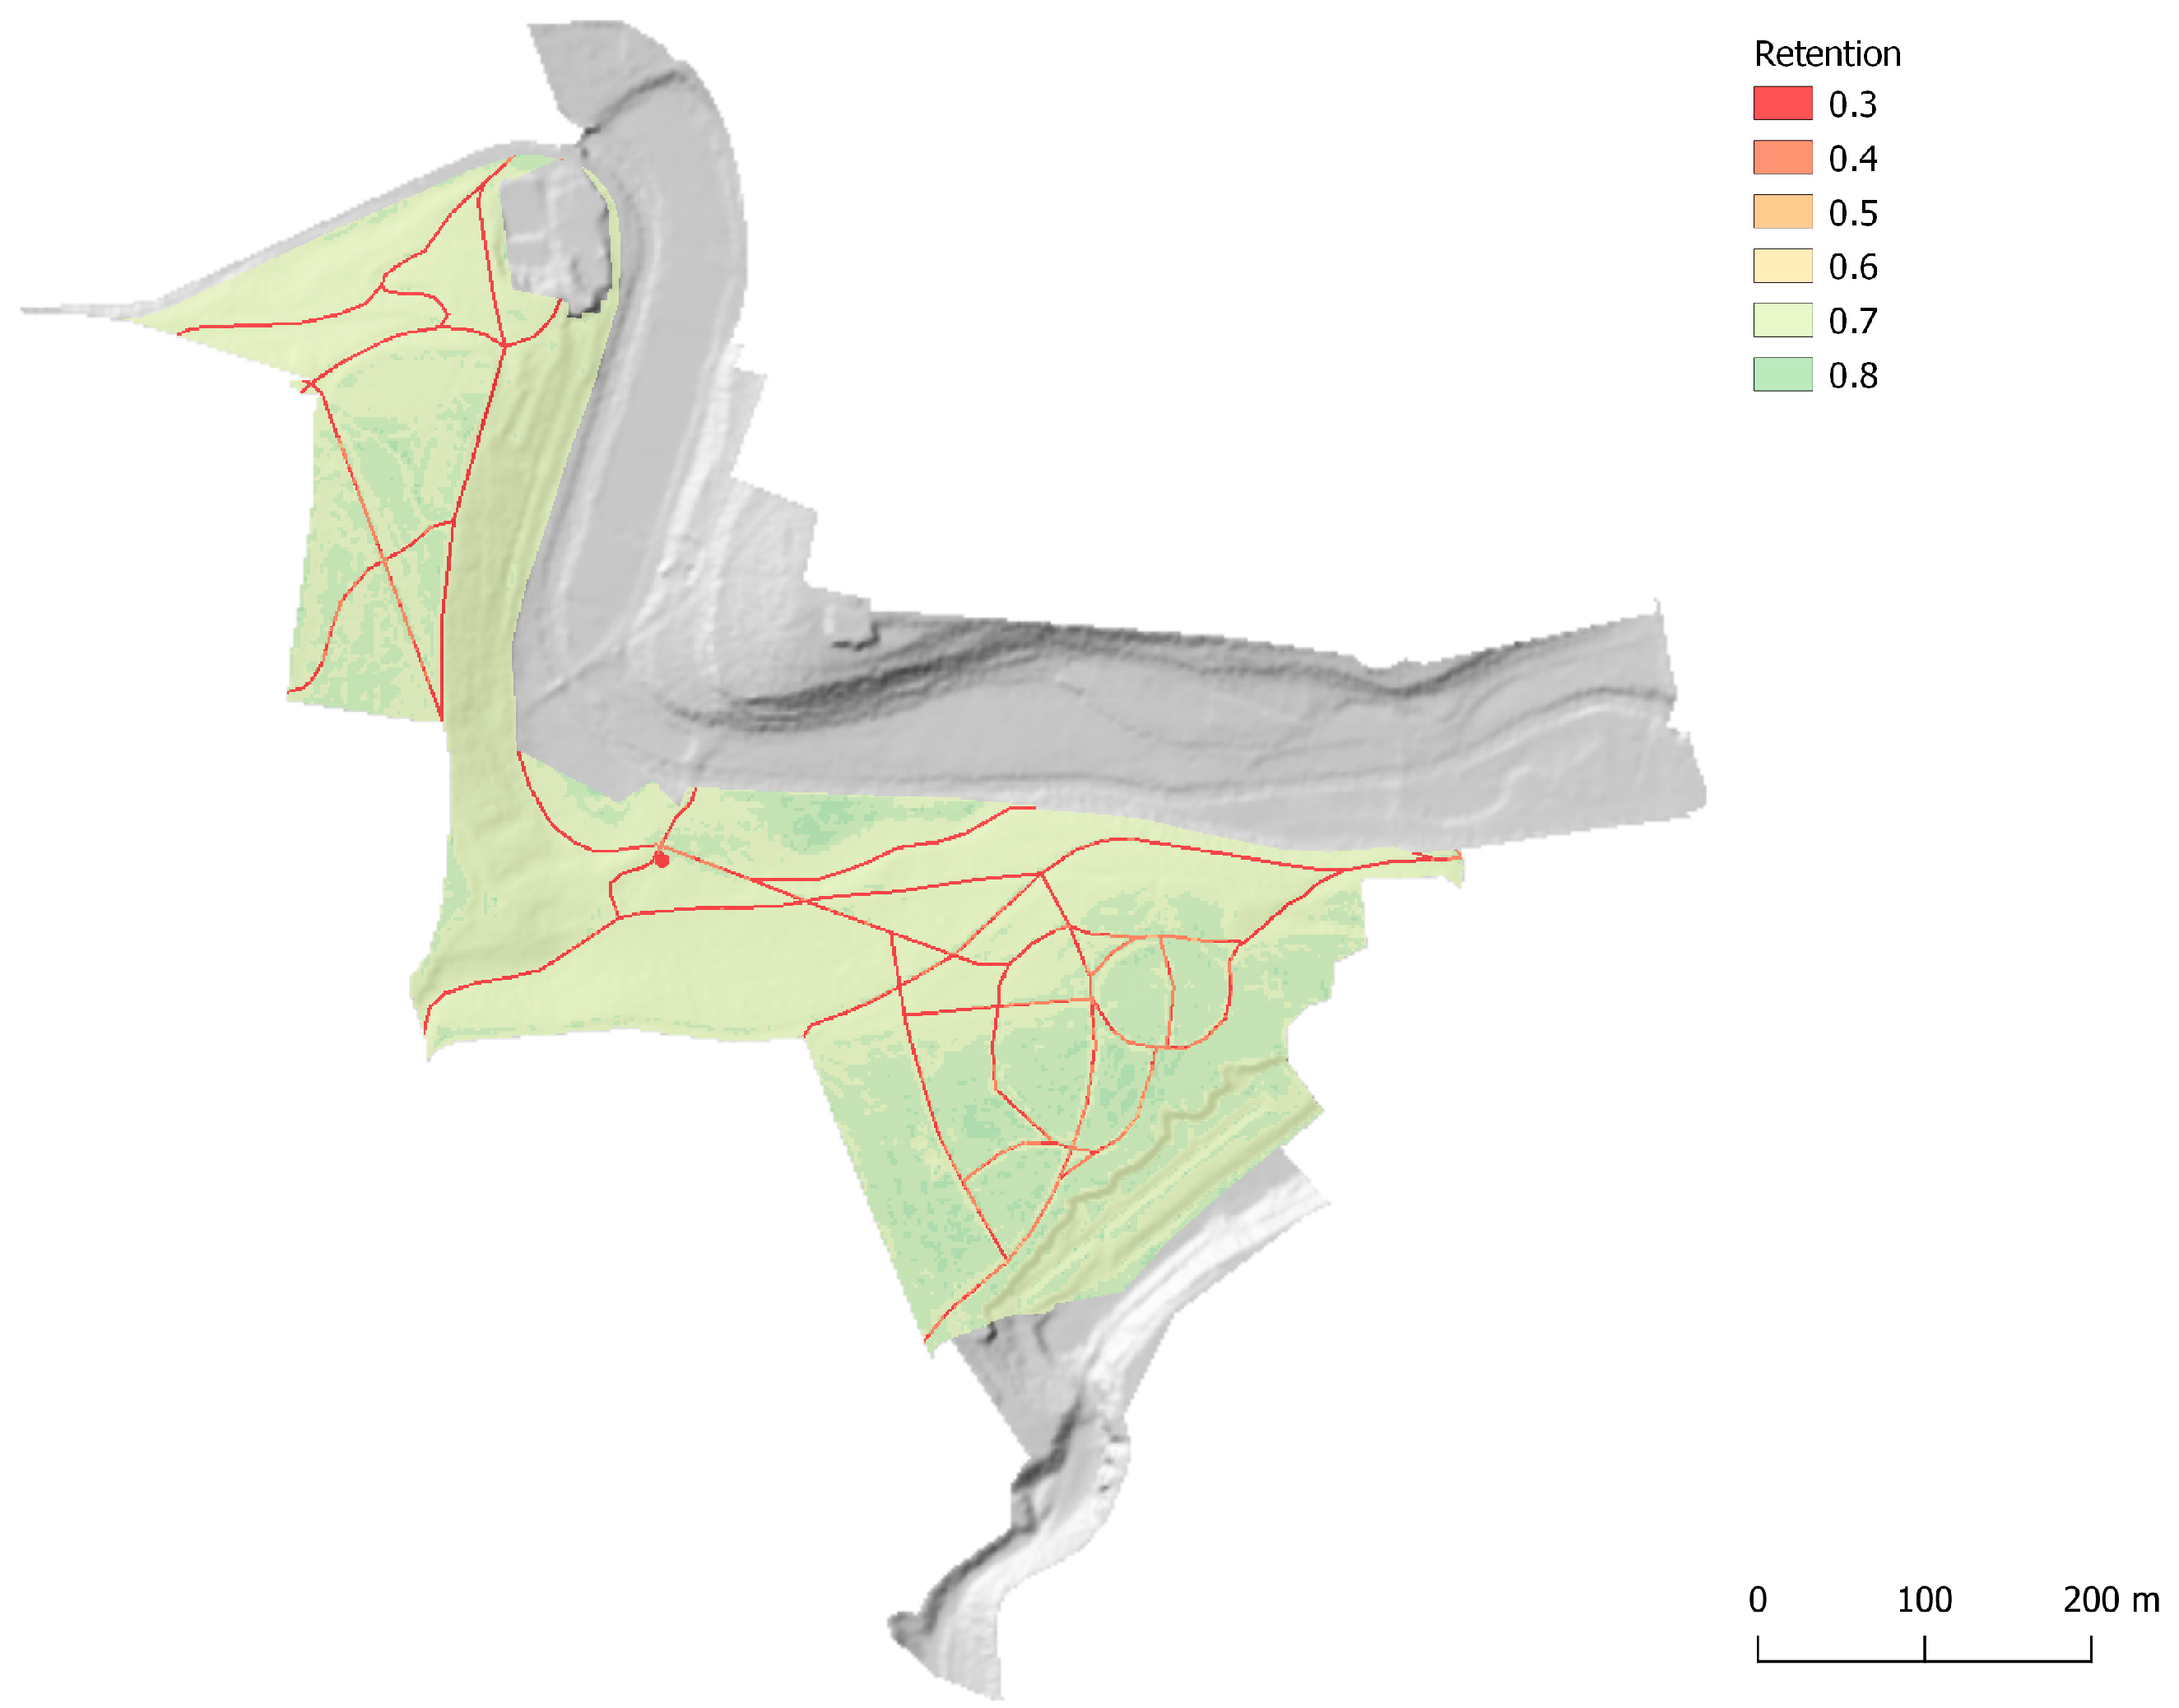
The calculation of the balance was determined as the difference between the amount of water from the causative rain falling on the site and the volume of runoff from the site during that rain—the difference between the rainfall volume (m3) and the runoff volume (m3). In effect, this is the volume of water from the rainfall event that is retained on the site. The calculation of specific runoff characterises the amount of water flowing out of a unit area (l s−1 ha−1).
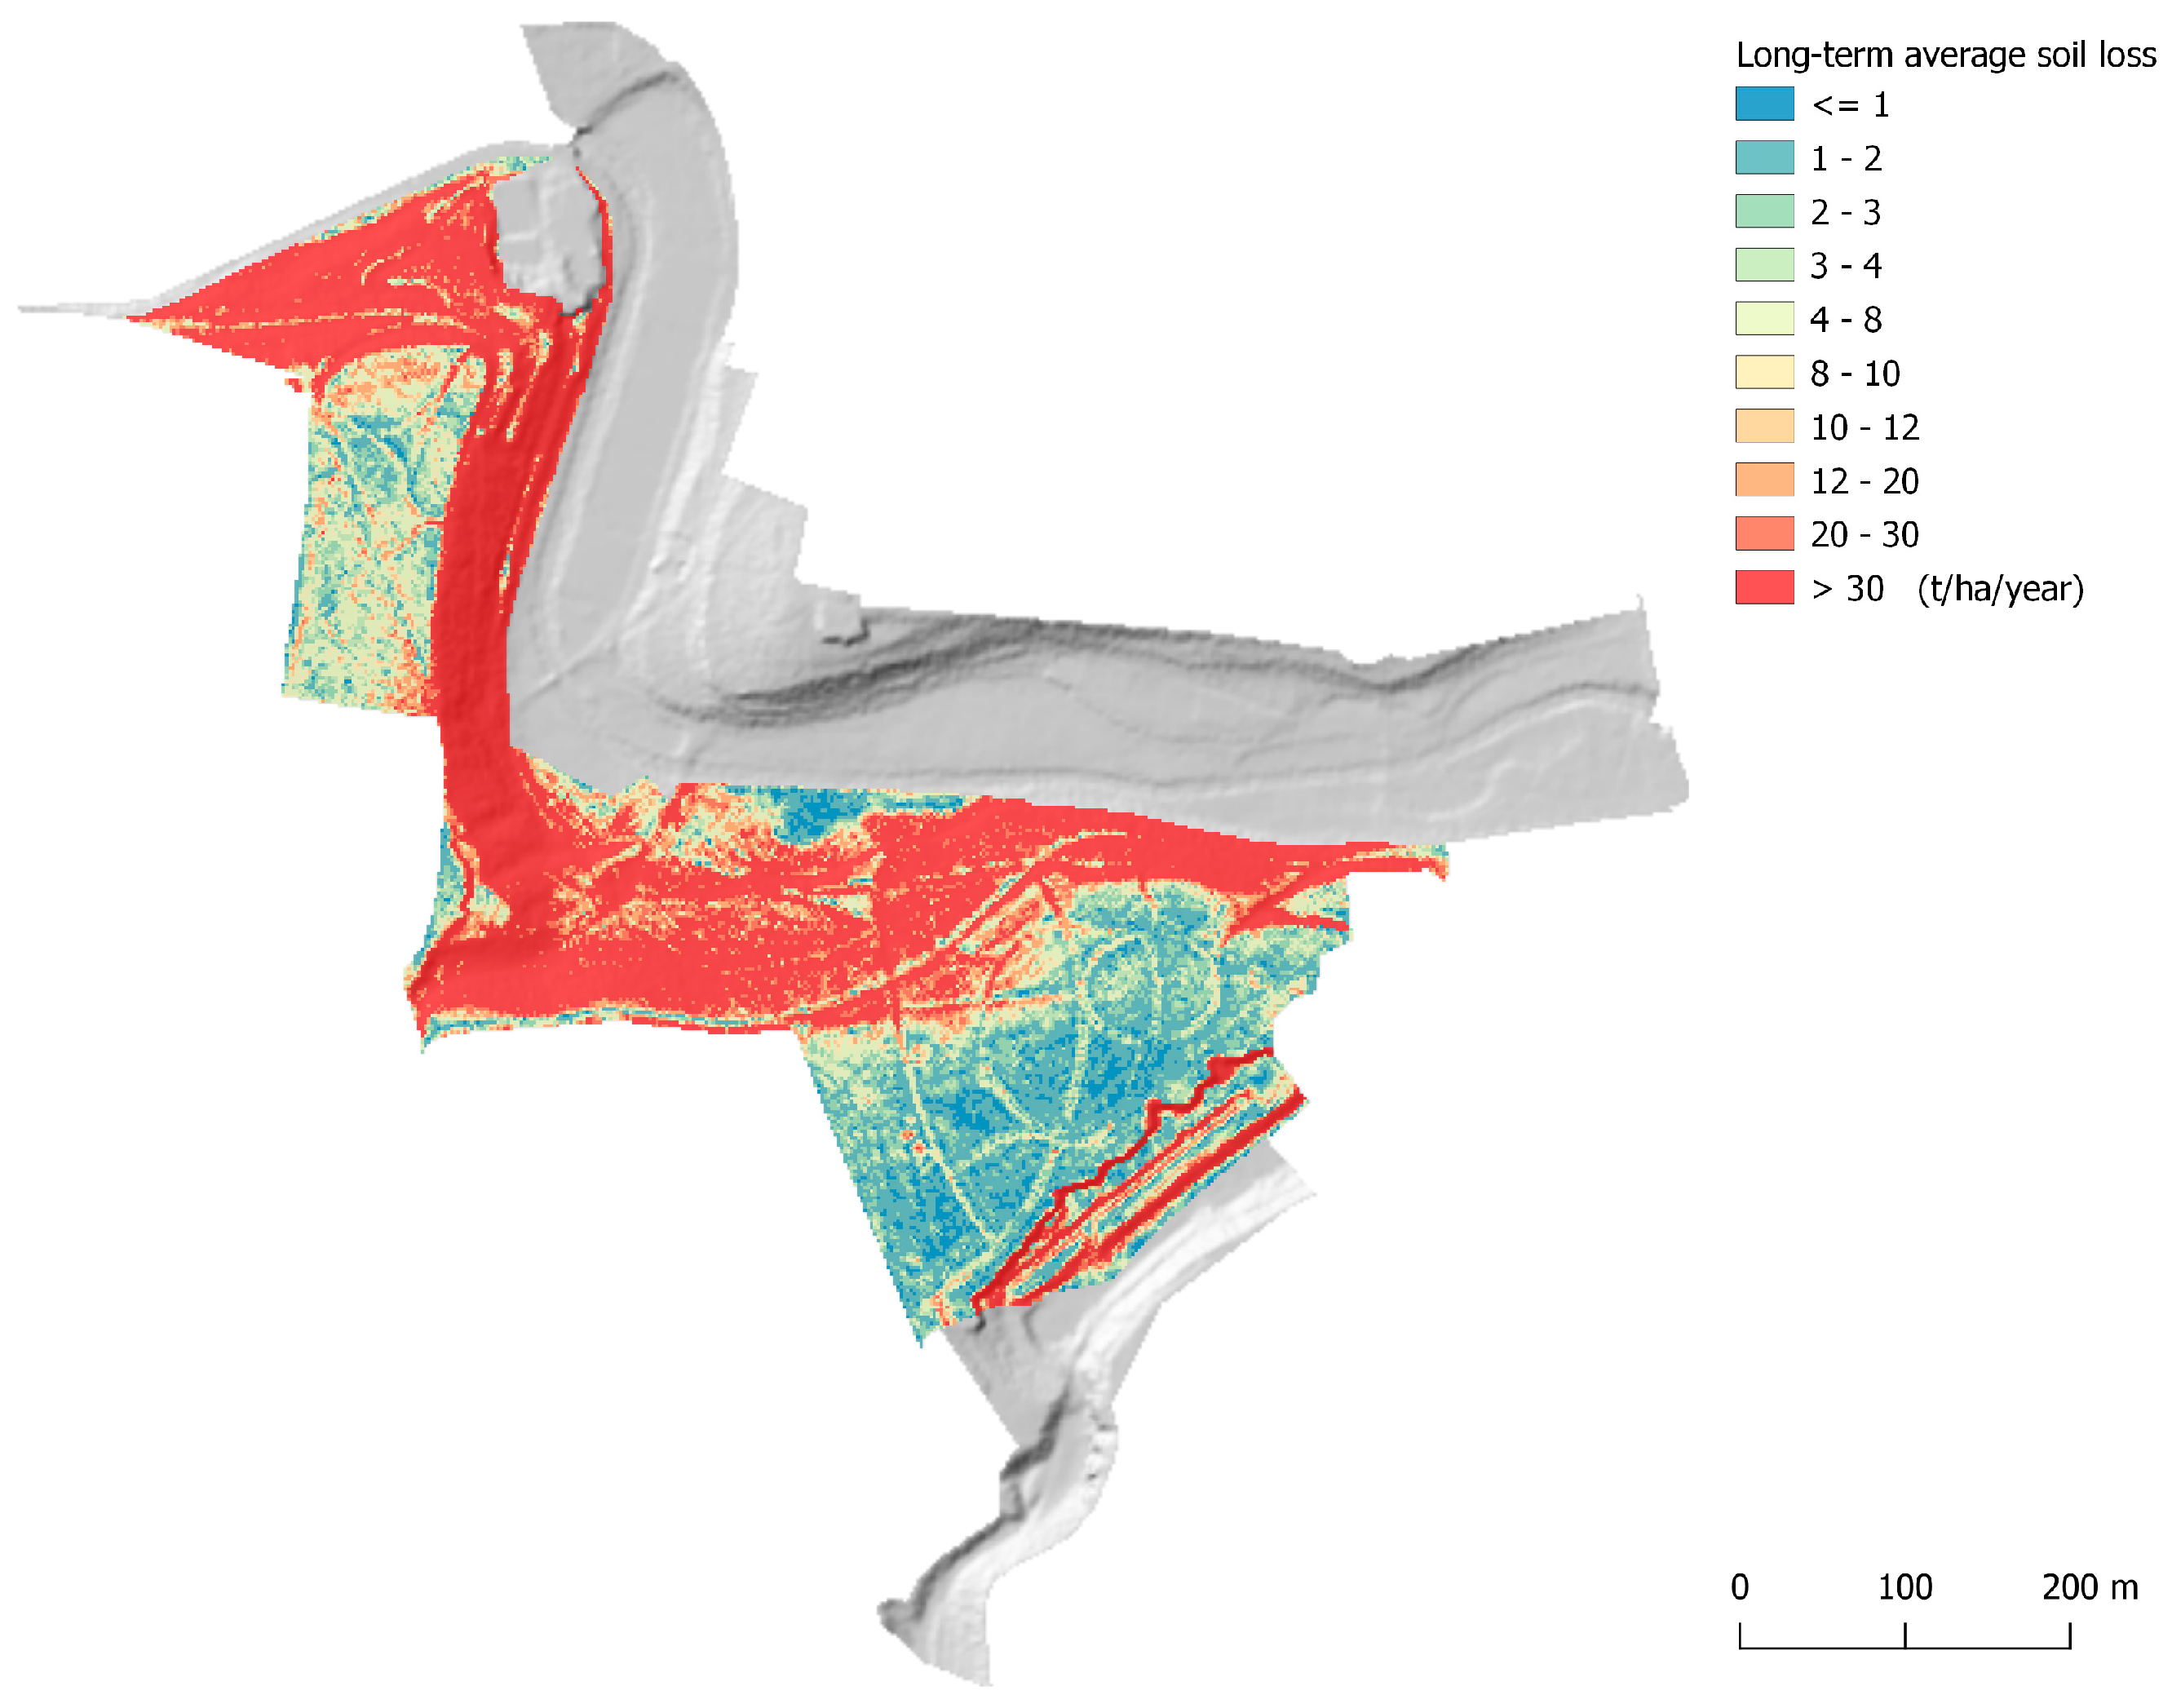
The impact of the destruction of forest cover on a site in relation to the threat of erosion to the site can be expressed simply using the potential soil-loss method (Universal Soil Loss Equation USLE, Wischmeier and Smith, 1978 [
48]). The C (a ratio comparing the soil loss from land under a specific crop and management system) and P (the ratio of soil loss by a support practice) factors are equal to 1 in the calculation, i.e., no protective effect of vegetation is considered on the area after the destruction of forest vegetation and no antierosion measures are present. The input variables were prepared in the form of individual rasters. Raster layers were used, which were recalculated by the raster calculator in QGIS.
Specific methods mentioned above were finally incorporated into the particular methodological steps graphically presented in the scheme in
Figure 3.
4. Discussion and Conclusions
At present, only minimal visible changes to the forest habitat on the site can be observed. If the trends in climate change (rising average annual temperature and thus lengthening of the growing season and changed distribution of precipitation, especially in spring) continue as currently expected, an upward shift of the climatically defined vegetation stages can be expected in the short term. In the case of the Štěpánka Forest Park, this would make it problematic to maintain forest communities, particularly in the oak woodland in the southern part of the area due to the expected vertical shift of vegetational zones upward [
43] when this area could be suitable only for grass communities.
For the purposes of the study, an “average” climate change scenario was chosen. Clearly, if climate change were above these average values, then the results would not be affected.
The model used is essentially standardised and widely accepted, but there may certainly be some differences in local conditions in the results as well as in their interpretation. The authors are aware of this fact, but given the nature of the case study, they consider this level of uncertainty acceptable.
Since the site is in one of the warmest climatic regions of the country [
49], its habitat conditions are appropriate. It is clear that tree vegetation in these conditions is limited by fatal ecological conditions in a number of species. For this reason, it is a basic prerequisite for the maintenance of trees on the site to consider only species with the appropriate ecological valence.
In addition to the above, the following specifics can be defined for individual matrix forest stand communities:
Alder meadow—sites with the greatest potential for sustainability, in contact with the subsurface water of the Klenice River. Here, in principle, there is the least restriction for the introduction of exotic species, park species and compositions.
Hornbeam oak—the basic matrix forest stand species should be winter oak and common hornbeam, natural regeneration and vegetative regeneration can be used, conifers should be completely avoided, with the exception of Scots pine.
Beech oak woodland—when managing and restoring, consider a gradual shift towards hornbeam oak woodland and thus modify the matrix forest stand tree composition. Noble deciduous trees from natural regeneration are not detrimental.
Linden maple—stands on steep slopes significantly threatened by erosion, it is necessary to thin stands so that trees do not grow to higher masses (because of the landslides danger), to make maximum use of natural regeneration, including vegetative regeneration. Only lightweight techniques, ideally manual, without clearing by skidding or dragging the wood across the surface.
The threat of drought to the site stems mainly from the lack of available water in the rhizosphere of the trees forming the forest communities of the site. As has been mentioned several times, the potential lack of water in the rhizosphere of woody plants is a function of two variables, namely the location of the site in one of the warmest climatic regions of the country and global climate change (increase in average annual temperature and thus the lengthening of the growing season and the changed distribution of precipitation, especially in the spring season). This is compounded by the occurrence of some species or genera of tree species that are currently already at the limit of their ecological range (especially conifers of the genera Picea, Abies, Larix and the family Cupressaceae), or are in the senescent stage of maturity with a significantly reduced ability to adapt to changing climatic conditions. If the care of the park’s tree inventory is not given due attention, the potential threat of drought to the park in the medium term (about 30 years) is relatively significant. With adequate care, this threat can be minimised in the context of current predictions of global change parameters.
The basic prerequisite for the sustainable existence of forest cover on the site is the cultivation of matrix forest stands (excluding park and aesthetic species in solitary or group plantations and compositions) corresponding in their ecological constitution to the original forest stands. The emphasis of the restoration should not only be on habitat-appropriate tree species, but should also take into account the potential development of the climate in the following period (the lifetime of the trees), i.e., a minimum of 50 years.
As far as the spatial layout of the forest is concerned, it is absolutely essential to maintain an integrated stand on the site with a lower stem cover (fewer individuals per plot) and a lower regeneration period. These aspects of a growing matrix forest stand will ensure its sustainability, in particular the sustainable water management of the trees in the context of lower water reserves in the rhizosphere and the greater ability of younger individuals to adapt to changes in site conditions (replacement of stress-resistant types by resilient types).
Another important aspect of the sustainability of the matrix forest stands on the site is the good condition of the forest soil, or the condition of the overlying humus as an essential attribute of the retention and subsequent usability of rainwater by the forest stands. The condition of the forest soil is mainly related to the technologies of forest restoration and maintenance. When restoring and maintaining the site’s forest stands, it is essential to avoid repeated passes of machinery over the area and, in particular, to limit the shifting and hauling of timber when carrying out restoration or rehabilitation harvesting. Here, it is advisable to carry out such clearing only on slopes of up to 10% and to use the existing road network consistently for the movement of machinery.
With regard to forest management, all harvesting (apart from necessary rehabilitation harvesting in the event of a threat to health or property) should ideally be carried out in winter on frozen ground, including educational harvesting. It is advisable to commence regeneration harvesting in a timely manner and to replant ideally individually or in groups, but always in such a way as to minimise disturbance to the surrounding vegetation cover. When restoring, it is advisable to nurture underplanting and, in particular, to cultivate natural regeneration stands or individuals, on the assumption that these will adapt better to changing site conditions.
The restoration of the park’s forest cover should essentially be continuous, i.e., a simplified phasing of park restoration is not desirable for the maintenance of the forest cover on the site.
All these recommendations apply to the matrix forest stands of the site. Park stands or individuals with park functions should be approached individually, with the understanding that the further the ecological constitution of the species is from the park habitat, the more additional effort (watering, aftercare) will need to be put into maintaining them on the site.
The runoff conditions of the site and their subparameters are addressed in the study by comparing the current state with the modelled state after the deforestation of the site, e.g., due to drought. This method was chosen mainly because the extent of drought damage to the forest cover on the site cannot be adequately assessed at present.
We note that, in general terms, with the destruction of forest cover on the site, an increase in surface runoff in extreme hydrological conditions and the associated increase in peak flows in the Klenice River in these situations can be expected up to threefold.
The potential impacts on the surrounding area resulting from the absence of the site are crucial in the context of Mladá Boleslav. If we ignore the considerable social significance of the park (its recreational, social, historical, educational and aesthetic value) as well as its other important ecological functions that have not been evaluated in this study (positive impact on the climate of the adjacent urban area, dust and noise reduction, zoo- and phyto-biotic functions), then the park, or rather the park’s other important quantifiable functions, are considered to be important. The park and its forest communities, in particular, have a significant positive impact on their surroundings: water retention (thus ensuring quantitatively balanced runoff from the site and consequently flows in the Klenice River) and soil erosion protection.
It is obvious that, especially due to the slope of the area, the length of the slopes and the erodibility of the soils, the area is significantly threatened by erosion. More than two-thirds of the area fall into erosion hazard categories that are considered unacceptable (the permissible erosion rate is 4 t ha−1 yr−1), and more than one-third of the area is extremely threatened by erosion.
From an economic point of view, it is important how the forest is designed. The production of woody material is one of the many benefits of tree cover. As McPherson et al. [
50] state, in California they have tried to calculate other benefits in monetary terms. In hydrological terms, they calculated that one tree reduced storm-water runoff by 3.2 m
3. The cost of this service was quantified at USD 12.62 per tree. The study also included a calculation of the aesthetic value, air quality improvement, energy conservation benefits and atmospheric CO
2 reduction of trees. On average, they arrived at an amount of USD 55.5 per tree. The study is from 1999, so we can assume that the cost of benefits per tree is now somewhat higher.
Tyrväinen and Miettinen [
25] state that the presence of trees or forest cover affects the price of real estate. Not only the direct view to the green space but also the distance from the green space is reflected in the market price of the property. A view of greenery can increase the price of a property by up to 4.9%. Another estimate claims that a distance of 1 km or more can reduce the value of a similar property by up to 5.9%. If trees are removed, some authors talk about compensation to society [
26]. On the other hand, due to the proximity of the forest to human habitation and the more frequent movement of inhabitants, we can count on higher costs for the maintenance of stands. Trees in poor condition can injure people and damage property by shedding branches or themselves falling [
51,
52].
All the particular results presented in our study contribute to the general message that there are methods that can (used in proper combination) help us to understand how big changes in the physical urban forest functions can be expected as a result of global climate change. We are able not only to quantify these within certain time periods but also to prevent them by applying specific adaptation measures directly to forest stands. These measures are relevant to decision makers at each level of responsibility as well as to managers of specific forests.


