Article

The Value of Trail Corridors for Bold Conservation Planning

1
Sustainability Program, Harvard University, Extension School, Cambridge, MA 01238, USA
2
The Wilderness Society, Bozeman, MT 59715, USA
*
Author to whom correspondence should be addressed.
Land 2022, 11(3), 348; https://doi.org/10.3390/land11030348
Submission received: 31 December 2021 / Revised: 5 February 2022 / Accepted: 17 February 2022 / Published: 27 February 2022
(This article belongs to the Section Land, Biodiversity, and Human Wellbeing)

Abstract

:
Conservationists are calling for bold strategies to connect wildlands and halt extinctions. A growing number of scientists recommend that 50% of all land must be held in a protected area network to maintain biodiversity. We assessed lands adjacent to the Pacific Crest Trail (PCT) and Continental Divide Trail (CDT) as possible wildlife corridors connecting protected areas in the American West. We evaluated the connectivity, wildness, and biodiversity values of the lands of each corridor and determined the conservation and land management status. We found that our corridors connect 95 protected areas creating two linear protected area chains from Mexico to Canada. Both the PCT and CDT corridors follow many of the best corridor routes previously found in the literature and hold high wildland conservation values. The American public already owns the majority of land units around the modeled PCT (88%) and CDT (90%) corridor. Therefore, we recommend further analysis of the lands adjacent to recreational trails as wildlife corridors. Employing our methodology on multiple scales could reveal that other recreational trails should be buffered and conserved for wildlife movement.

1. Introduction

Facilitating movement for wildlife is essential as the climate changes [1] and the human footprint expands [2]. Only 41% of the contiguous United States (U.S., hereafter) is intact enough to allow for species movement [1]. In response, connectivity planning from protected area to protected area has accelerated in recent years [3]. Connectivity from isolated areas, or remnants, can be fostered through the use of wildlife corridors [3].
On a large scale, the Nature Conservancy [4], the U.S. Fish and Wildlife Service, the Wilderness Society [5], and several state institutions are using connectivity analysis to model resilient landscapes and plausible migration routes as the climate changes [6]. With a 2.7° Celsius temperature change, corridors between all-natural areas in the U.S. would allow for 65% of species to move to their new habitats [1]. Additionally, the Landscape Conservation Cooperative Network is designing wildlife corridors, linear protected regions between two or more habitats [7], to create a protected area network [8]. Protected area networks facilitate increased wildlife movement [7].
On a small scale, greenways increase connectivity for wildlife in urban spaces where landscapes are highly fragmented and influenced by the human matrix [3]. Boston’s Emerald Necklace, a greenway designed by Frederick Law Olmsted, adds not only recreational, cultural, and aesthetic value, but also ecological value to Boston’s city parks and urban spaces [9]. When corridors such as greenways are added to cities, landscape resilience is improved even amidst the human-dominated matrix of land. Adding and expanding greenways as corridors facilitates migrations, dispersal, and gene flow for wildlife [3,10]. The benefits of greenways are multi-faceted and have large public appeal, which makes them easier to implement [11,12].
Similar to greenways, recreational trails could offer conservation planners the opportunity to connect habitats while providing people with access to nature-based recreation (i.e., hiking, biking, walking). In 1968, the United States Congress passed the National Trail Systems Act (16 U.S.C. § 1241) to set aside nationally significant recreational trails for their historic, recreational, scenic, and cultural values. According to the act, scenic trails are conserved for human recreation and conservation.
Two of North America’s longest scenic trails are the Pacific Crest Trail (PCT) and the Continental Divide Trail (CDT), which begin on the border of Mexico and extend to the Canadian border in the American West [13]. The PCT follows the Sierra Nevada and Cascade Ranges, and the CDT follows the Rocky Mountain Range. Both trails traverse over 16 degrees of latitudes with diverse topographic gradients. Together they pass through a total of 95 protected areas (85 wilderness areas and 10 national parks).
The PCT, the CDT, and the Appalachian Trail in the American East are called the “Triple Crown of Hiking”, for their long distances (PCT 4265 km and CDT 4873 mi) [13]. However, the PCT allows both hiking and equestrian recreational use [14]. The CDT allows hiking and equestrian recreational use and, in some areas, biking and ATVs/UTVs are allowed [15]. The PCT was designated in 1968 and completed in 1993, while the CDT was designated in 1978 and is unfinished [13]. Around 160 miles (approximately 5%) of the CDT is on dirt or paved roads causing hikers to walk along the road [15]. The Continental Divide Trail Coalition, which works on advocacy for the CDT, is working on re-routing parts of the route away from roads [15]. Due to the multiple states and regions that both the CDT and PCT traverse, the conservation status of the trails and their surrounding landscapes is complicated.
We were interested in the wildland conservation values (i.e., wildness, connectivity, and biodiversity) and conservation status of these popular scenic trails and surrounding landscapes, because we wondered if they could serve as a framework for a protected area network in the American West. A 2 km wildlife corridor width is suggested as a rule of thumb to accommodate megafauna when designing corridors for a protected area network [16]. The trail tread, or physical width of the footpath, of the PCT and the CDT trails 45–121 cm and is managed by U.S. Forest Service [14]. However, the landscape surrounding the trail tread known as the trail corridor [17] is managed by a variety of public agencies and private stakeholders [14].
Using trail corridors or the linear landscapes around recreational trails as wildlife corridors is currently underdeveloped (Figure 1). Connectivity studies have instead focused on the best route for wildlife corridors based on wildness, ecological flows, and climate projections [1,6,18,19]. Trails generally follow areas conducive to important ecological flows: riparian zones that represent hydrological flows and/or within mountain ranges, along which humans and animals migrate [17,18]. Secondly, trails typically traverse landscapes with high scenic and aesthetic values [17,18]. Thirdly, the PCT trail corridor provides a logical wildlife corridor route because it was set aside in 1936 by mountain clubs in the West to preserve a walking path from Canada to Mexico and, over time, protected areas were added to the route [19]. Both the PCT and CDT trails were designed to connect a potential protected area network by Benton MacKaye in 1966 following the establishment of the Wilderness Act [20].
Wildlife corridors linking protected areas could be established around existing trail networks, but to date little work has evaluated the conservation values of lands directly adjacent to iconic trails (but see McKinley et al., 2019). Therefore, we asked two primary questions:
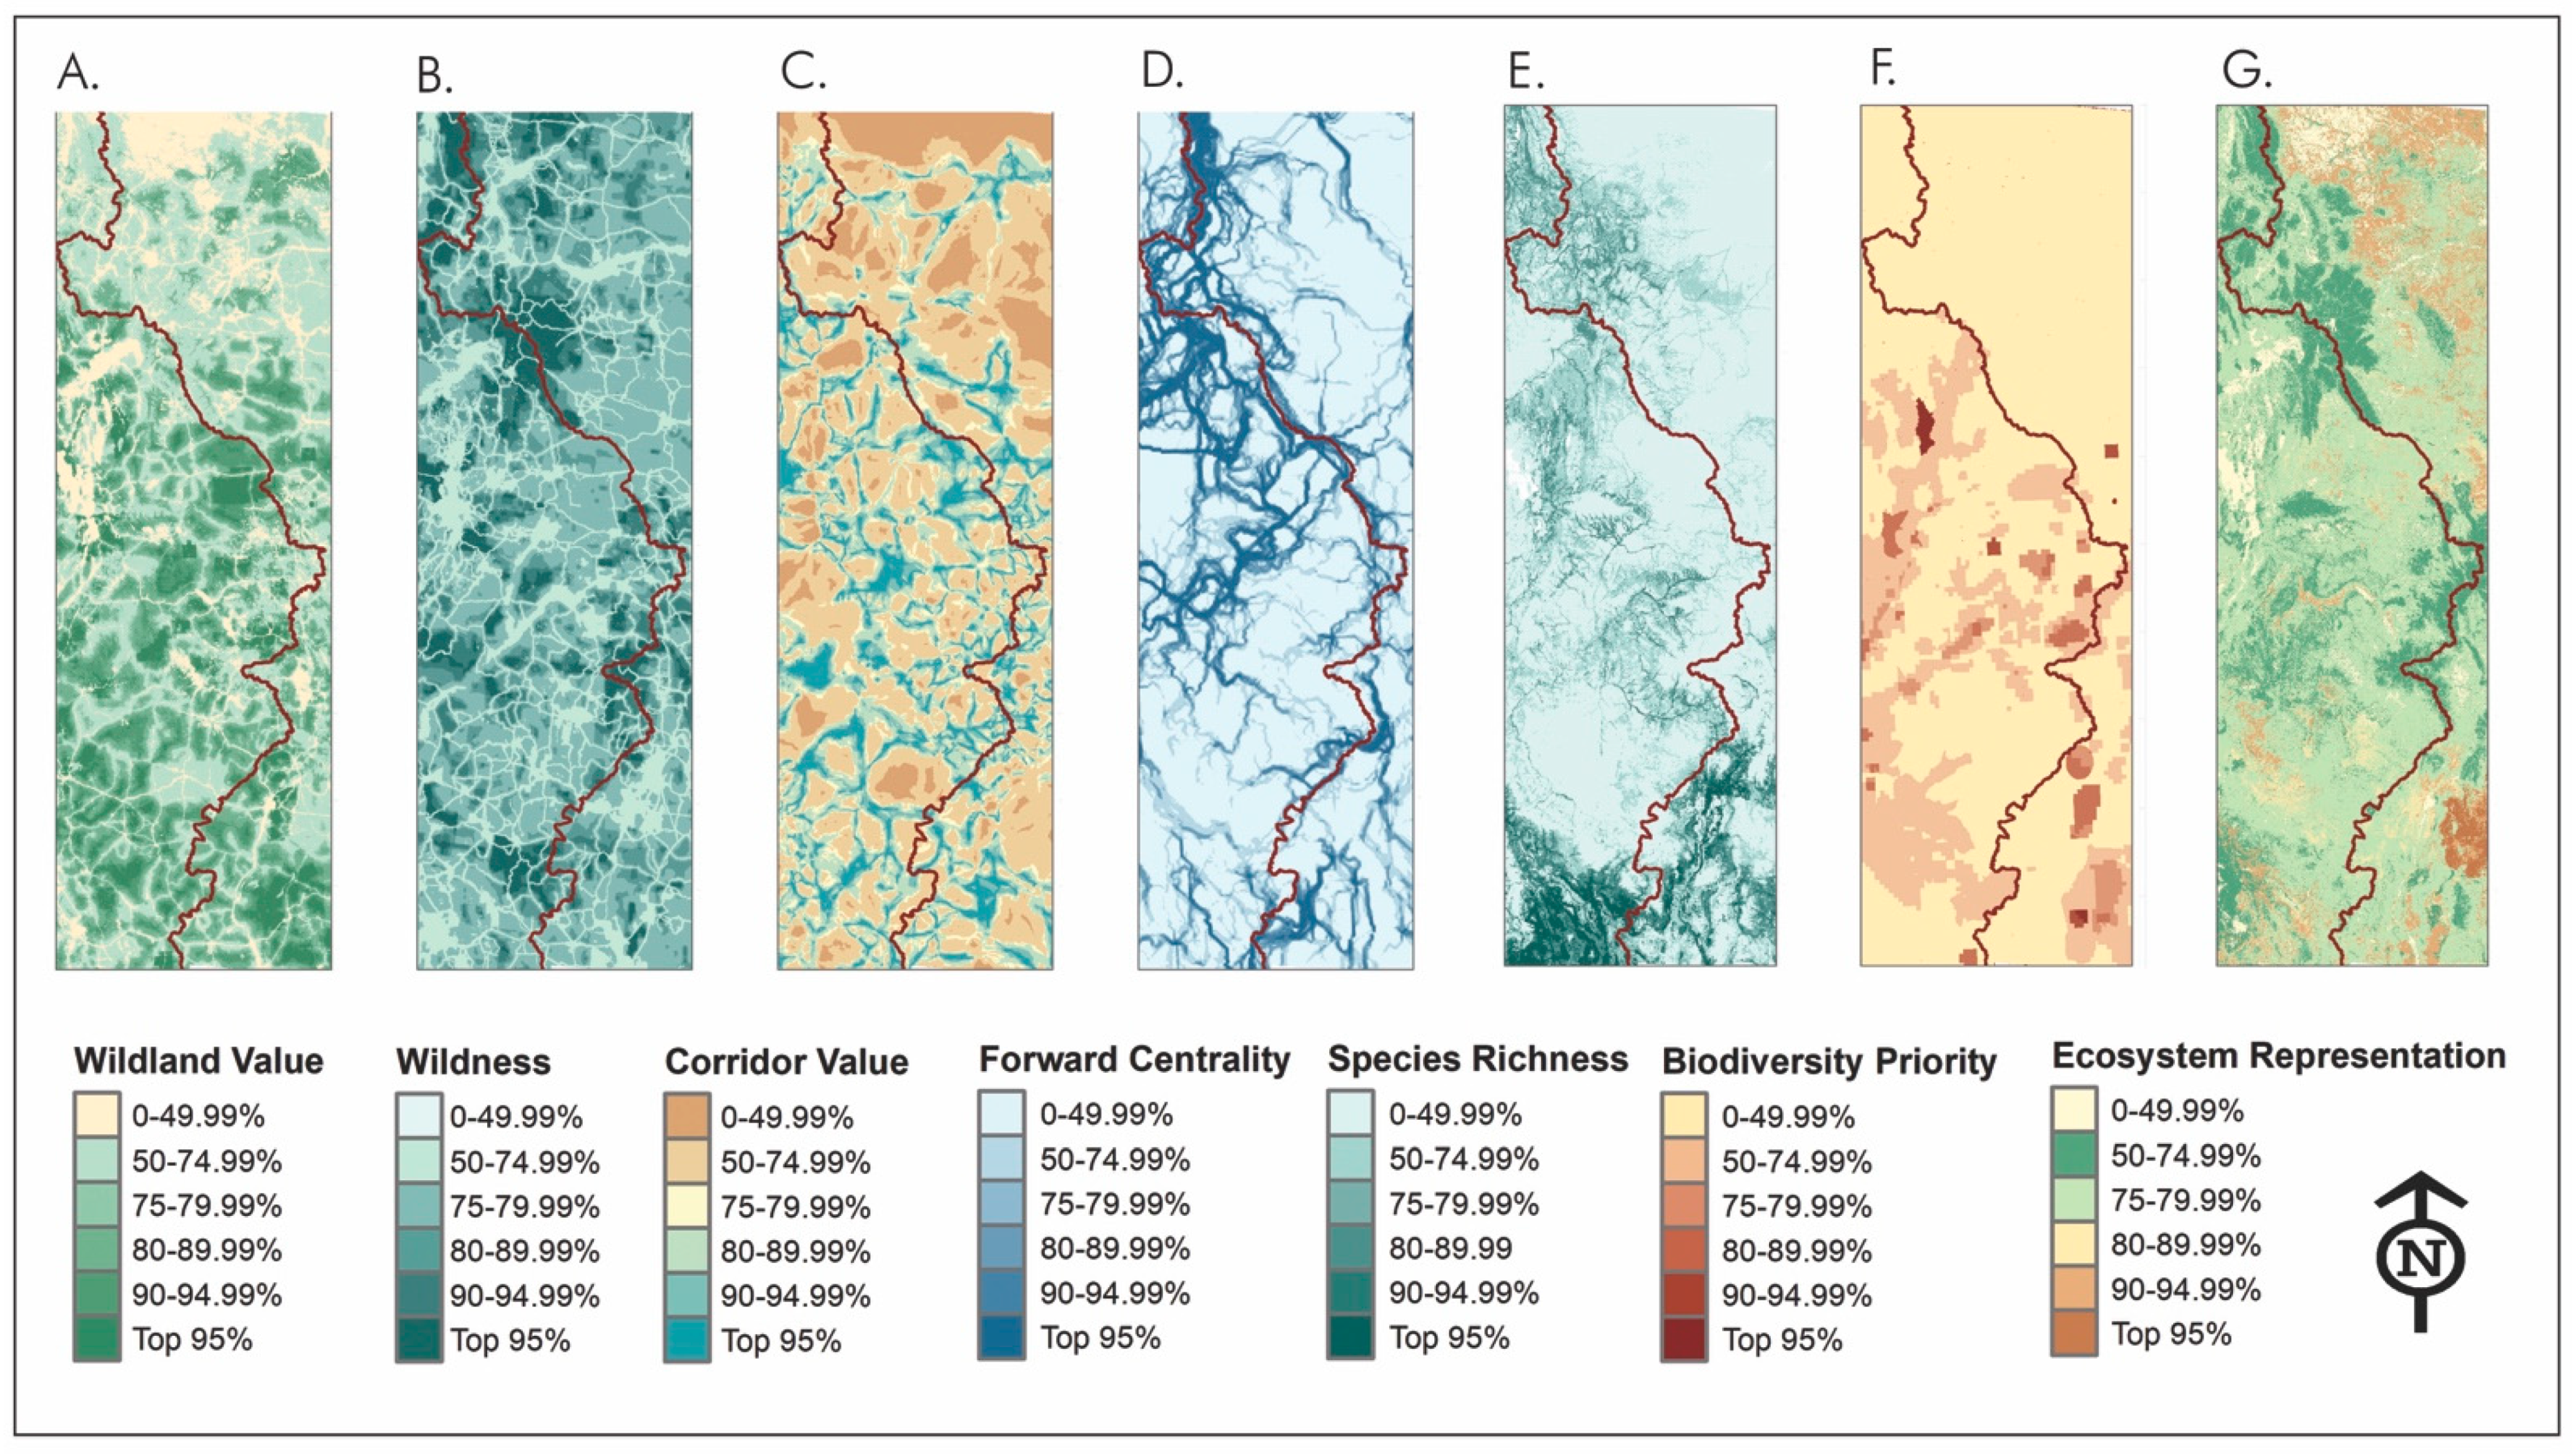
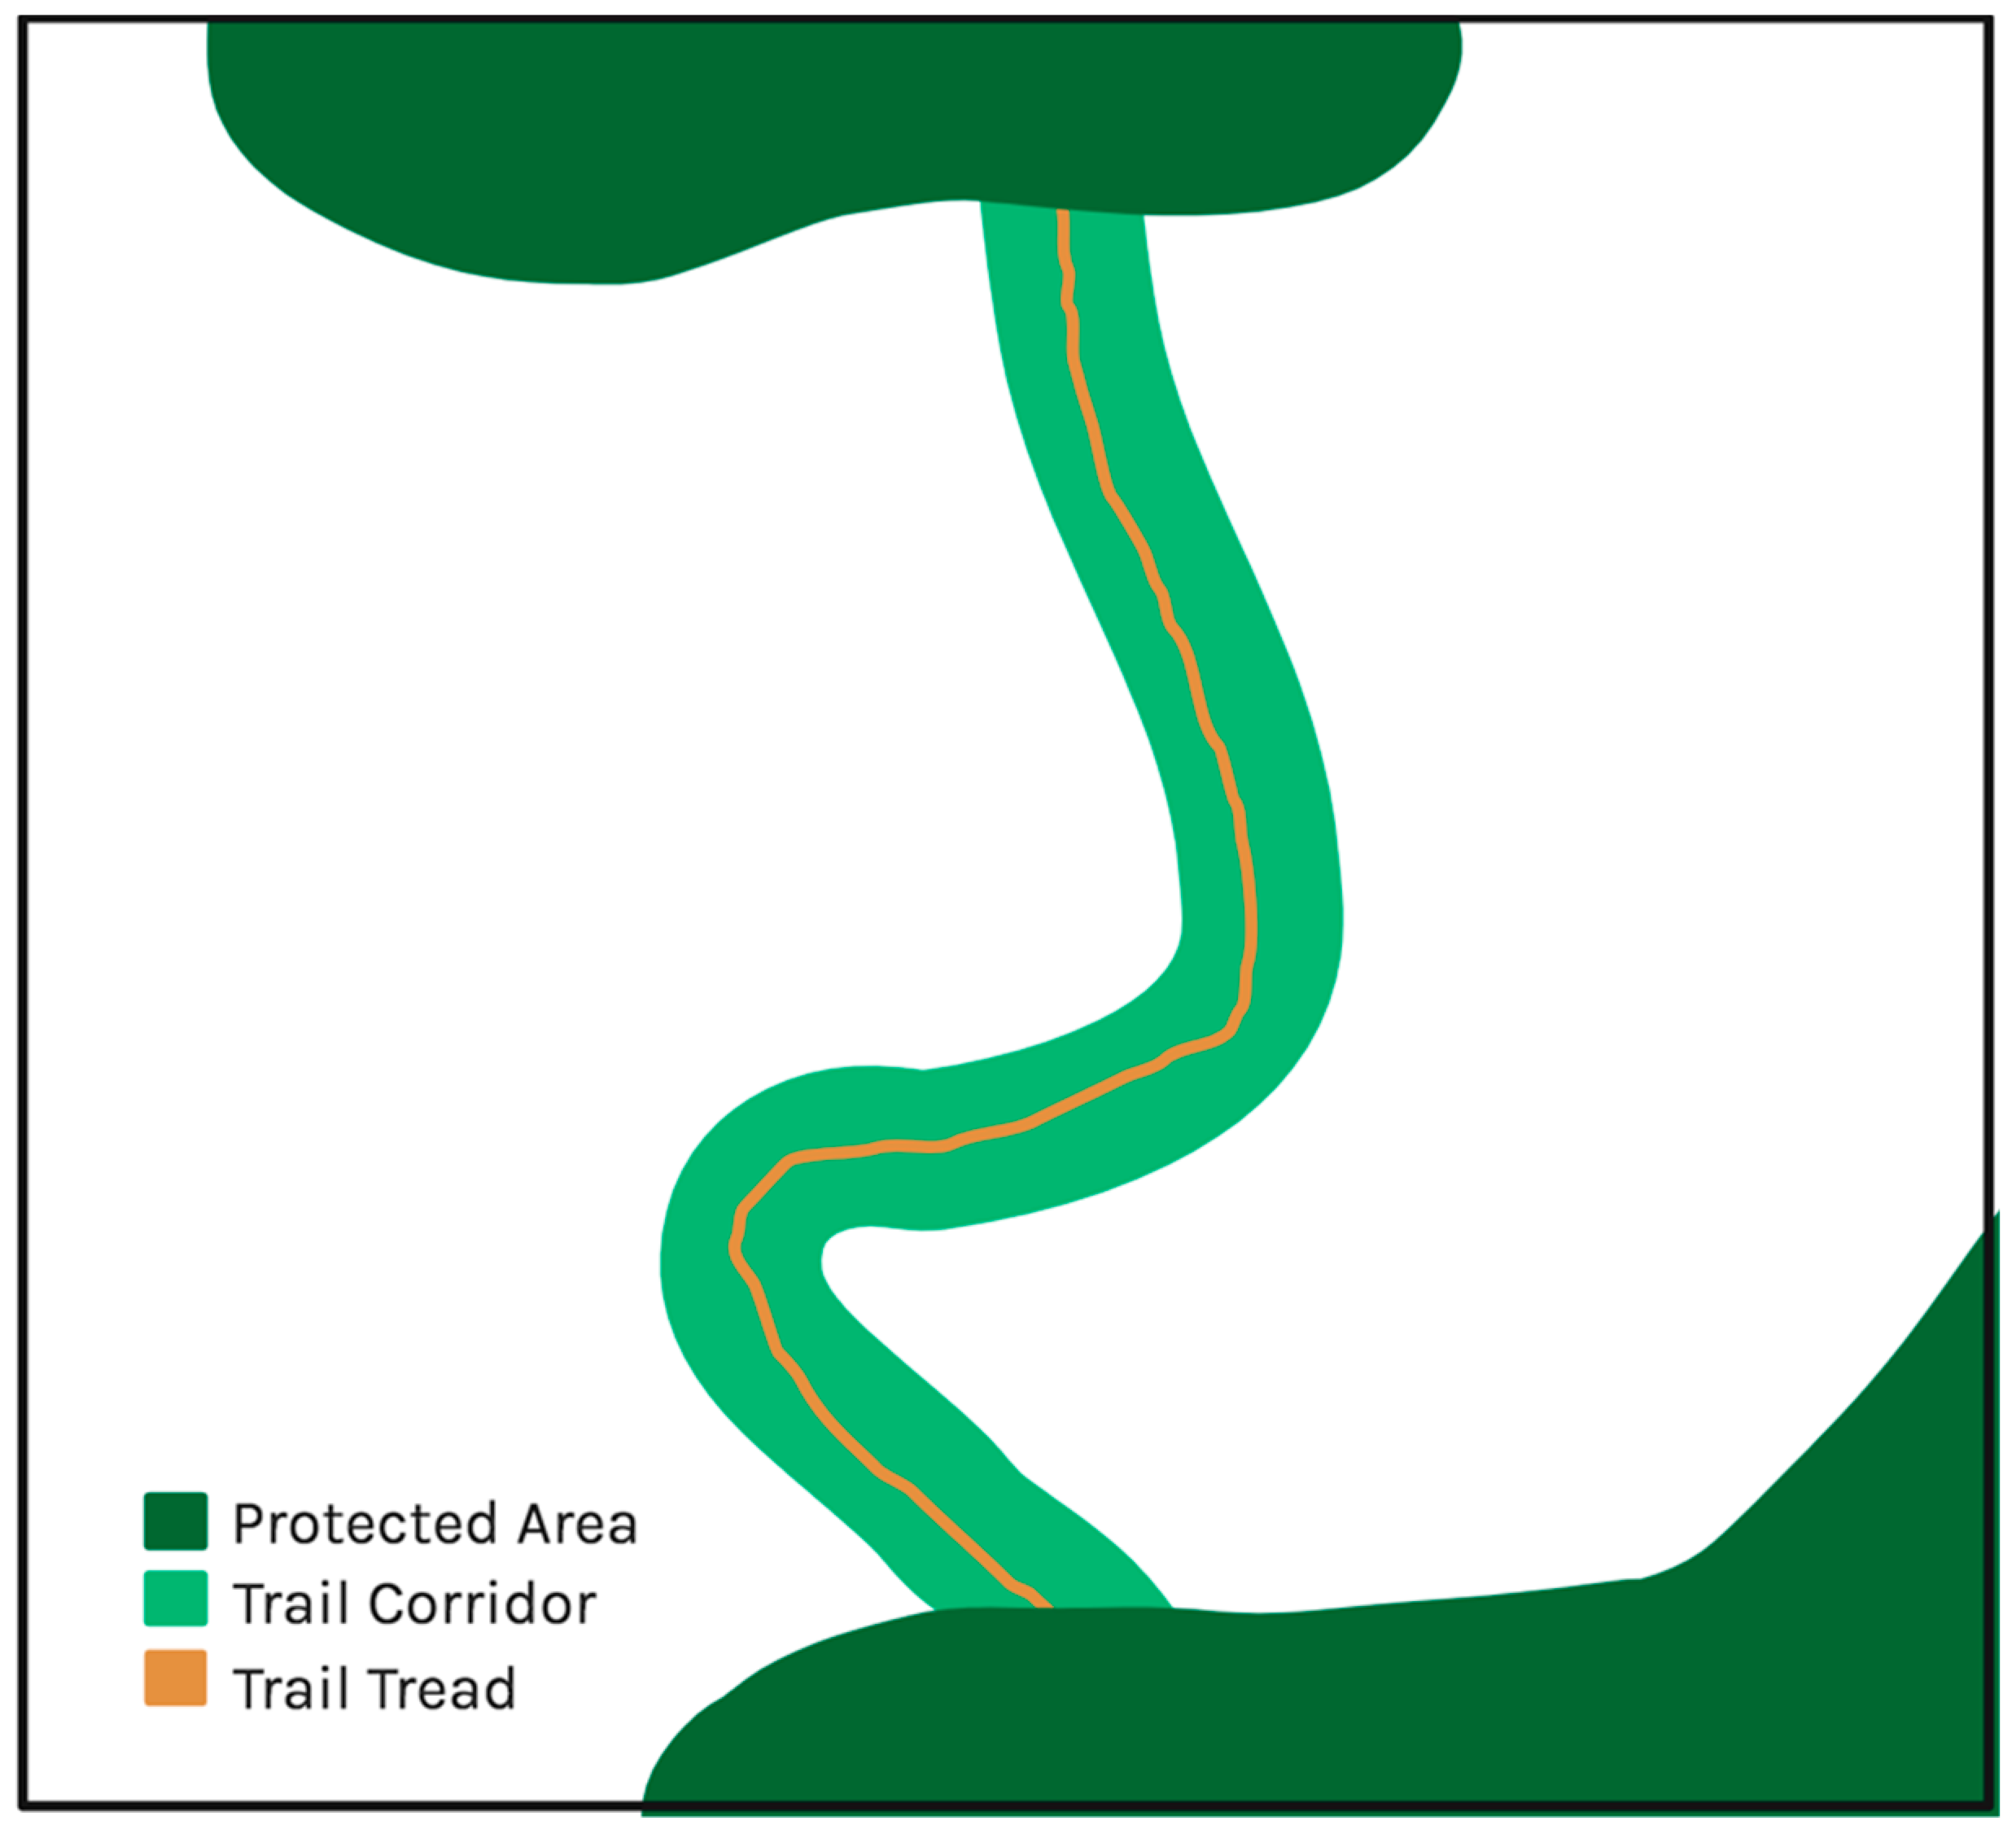
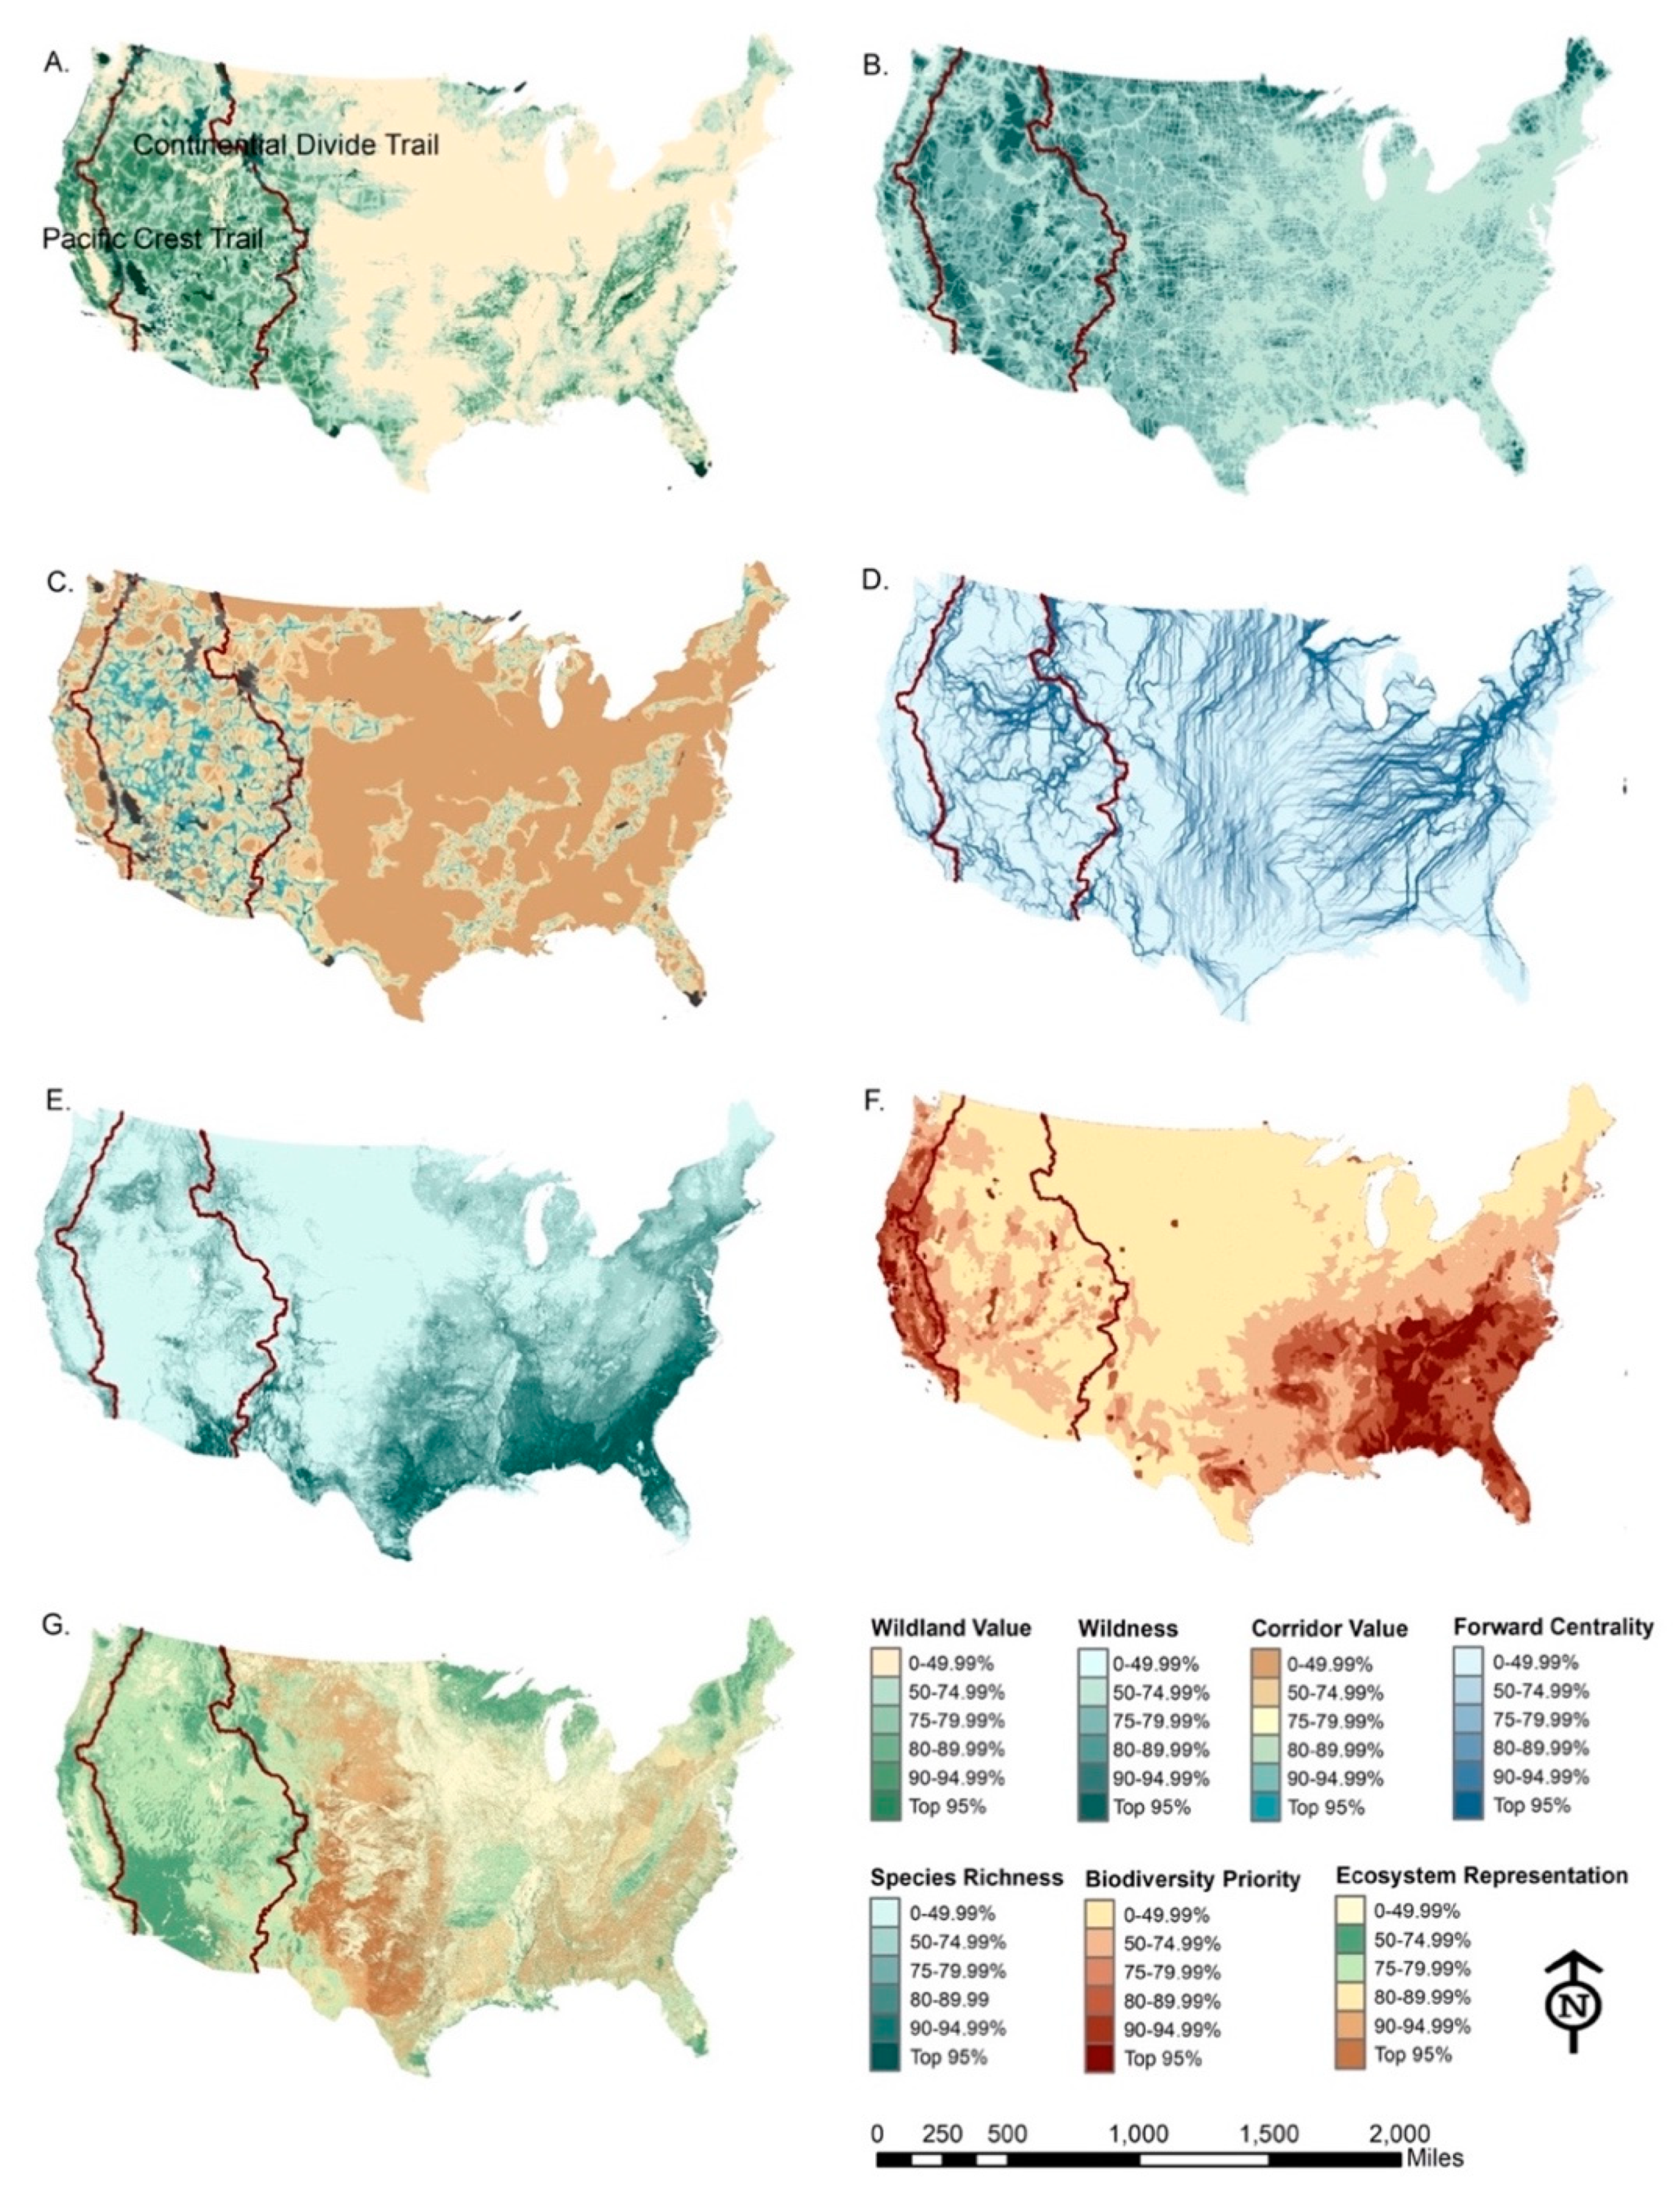
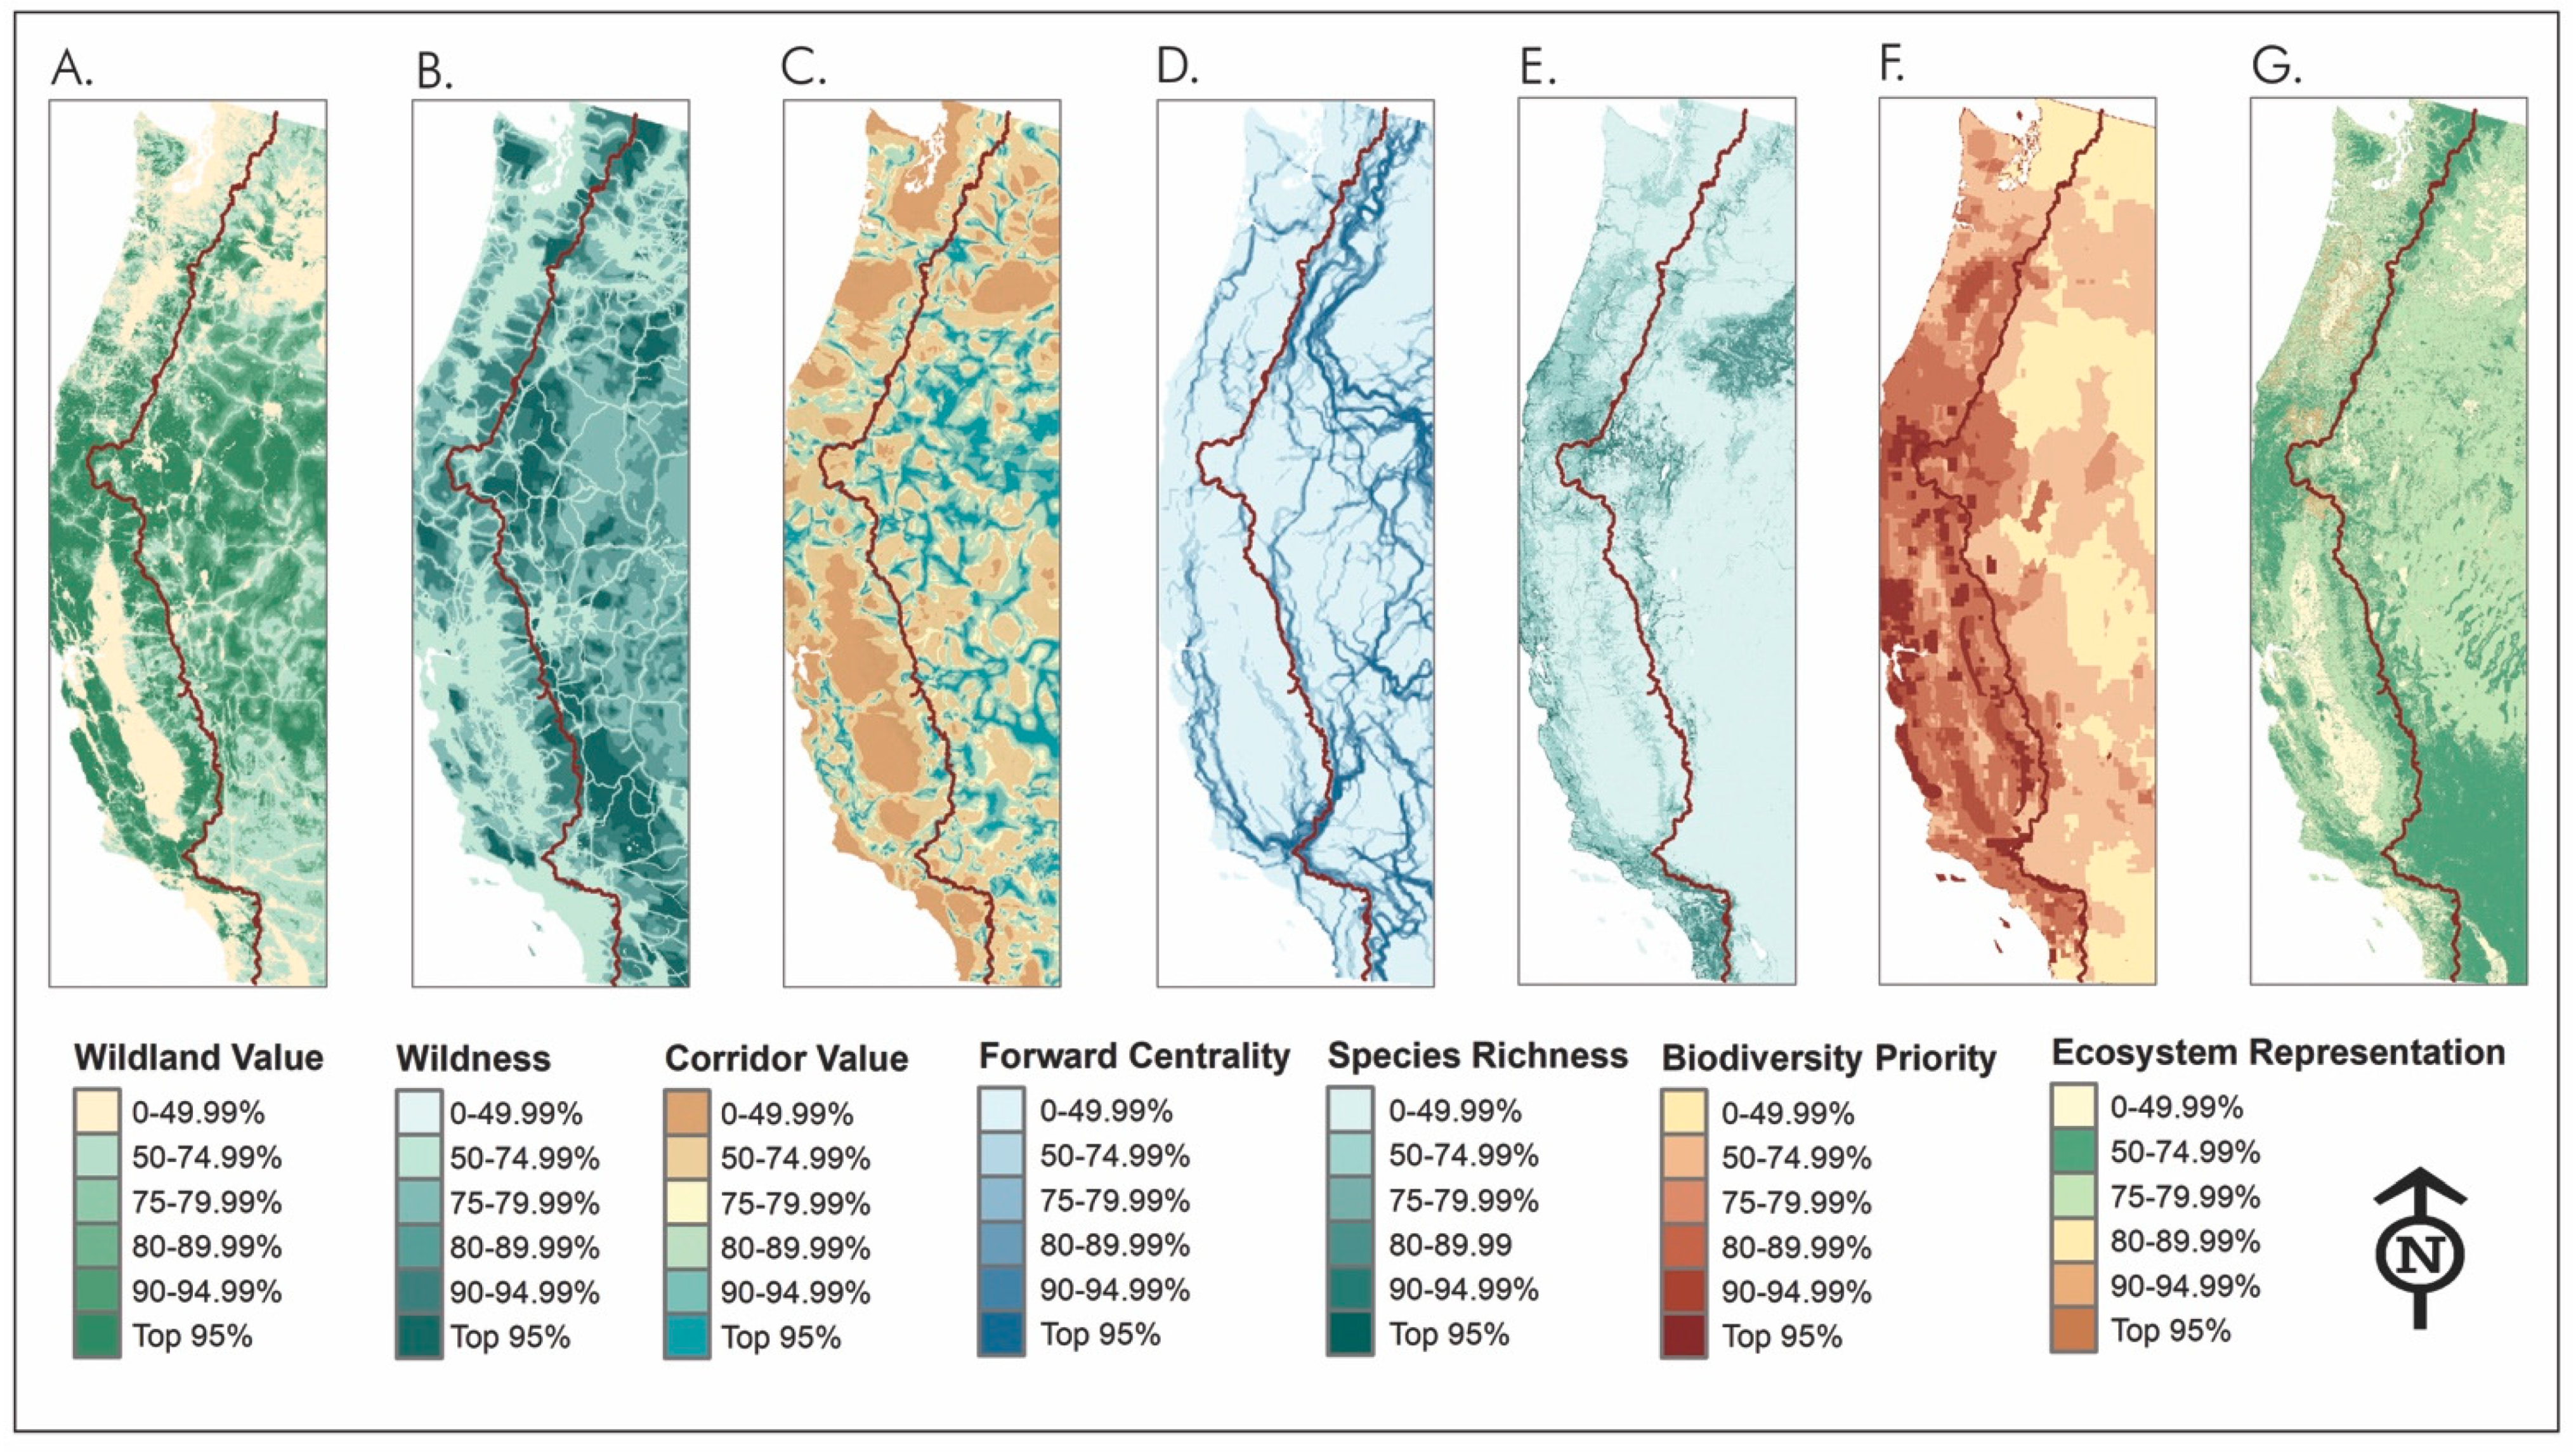
  • Do the adjacent landscapes, 1 km on either side, of the Pacific Crest Trail (PCT) and the Continental Divide Trail (CDT) tread hold high wildland conservation value for wildlife corridors? We used spatial data on human modification (or its additive inverse, “wildness”), connectivity, ecosystem representation priority, and biodiversity to evaluate the landscapes surrounding the PCT and CDT. We predicted that the adjacent landscapes (2 km wide to the PCT and CDT tread) would have high conservation value, since both trails were designated for their aesthetic and scenic value. We expected some values like wildness to be high along the trails. However, no one has quantitatively assessed the national wildland conservation value of these lands.
  • How much of the adjacent landscapes, 1 km on either side, of the PCT and CDT tread occurs on protected land and who manages it? We also evaluated the current conservation and management status of the adjacent landscapes (2 km wide) to the PCT and CDT. Identifying adjacent landscapes with high conservation values (from question 1) that are under-protected could aid in conservation planning of a wildlife corridor along the PCT and CDT.

2. Materials and Methods

Our aim was to model and evaluate the PCT and CDT trail corridors as two potential wildlife corridors for the American West. Using geospatial analysis, in ArcGIS we buffered the PCT and CDT tread routes (45–121 cm wide) with a 1 km buffer on either side of each trail’s centerline to model a 2-km-wide trail corridor. Next, we assessed the trail corridor’s wildlife conservation value as a wildlife corridor. We chose the 2 km width per the Beier recommendation on the width of a wildlife corridor for megafauna [16].
We used the buffered PCT and CDT trail corridor map layers to extract values from seven other map layers to determine their wildland conservation value, conservation status, and management status. The wildland conservation value of the trail corridors was the first priority, because while we assumed the landscapes adjacent to the PCT and CDT were wild, connected, and diverse, there was no quantitative evidence in the literature. Secondly, we were interested in determining the conservation status of the PCT and CDT trail corridors because if the trail corridors were found to have high conservation value, we wondered if they were already protected. Thirdly, were interested in ascertaining the management status of the trail corridors so we could determine the conservation effort needed to conserve these landscapes for wildlife movement.
We projected each map layer (Table 1) to USA contiguous Albers equal area conic projection (USGS) with output raster cells at 1 km using bilinear resampling. We used a 1 km pixel size, because the majority of our datasets were available at this resolution. A finer-scale analysis of sections of each trail corridor should be evaluated next but this was out of the scope of this study. We converted all datasets with floating point data to integers (multiplying by 1000 to preserve significant digits and gradients in each value).

2.1. Question 1

We quantitatively evaluated wildland conservation value [5] using map layers for (1) high wildness [21], (2) high connectivity value for land to serve as a corridor between protected areas [5], (3) high ecosystem representation within protected areas [8], and (4) land that was rich in endemic species that are not well protected in conservation reserves [22].
Then, we also compared the wildness, connectivity priority, and biodiversity separately using six other datasets as map layers in ArcGIS (Table 1). Five of the seven conservation values were previously used to determine the best locations for wildlife corridor routes nationally and the other two were used to evaluate protected areas in the U.S. We evaluated wildness as the complement of the human footprint index to represent wildness rather than human modification [23]. For connectivity priority, we used two datasets: corridor value, a human modification resistance surface with 2084 core protected areas and the least cost paths between them [5], and forward climate velocity centrality, a measure of climate analog displacement paths from the current (1981–2010) to the projected (2071–2100) locations [24]. For biodiversity, we used three datasets: GAP species richness [25], biodiversity priority [22], and ecosystem representation priority [8].
We categorized each of the seven values by binning data into quantiles, including the top 5, 10, 20, 25, and 50% of land in the U.S. for each value. We were interested in analyzing whether the land units in the modeled PCT and CDT trail corridors (PCT and CDT corridor, hereafter) were above the national median and top quantiles of most wild, connected, and diverse landscapes in the U.S. Locations along each trail that are above the 90th percentile for the country were identified and we visually inspected their geographic settings and elevations.

2.2. Question 2

To understand the conservation status and land management of the PCT and CDT corridors we calculated the area of the trail corridor within different GAP status codes by land managers (e.g., US Forest Service, National Park Service). Additionally, we assessed the number of protected areas that the PCT and CDT corridors intersects using the Protected Area Database (PAD) v 1.3 and calculated the percentage of GAP status lands alongside their land manager types using the tabulate intersection tool in ArcGIS. We were interested in determining whether the land within the PCT and CDT corridor is currently protected and who manages each land unit.
Lastly, we combined the protected areas (GAP Status 1 or 2), PCT and CDT trail corridors, and the wildland conservation value map to visualize two potential wildlife corridors and a protected area network in the West.

3. Results

The total area assessed of the Pacific Crest Trail (PCT) corridor was 7045 km2 while the total area and of the Continental Divide Trail (CDT) corridor was 8045 km2. The PCT corridor crossed three states (California, Oregon, and Washington), 58 wilderness areas, and seven national parks (Table S1: Protected areas along the PCT). The CDT corridor traversed five states: Colorado, Idaho, Montana, New Mexico, and Wyoming. The CDT corridor intersected 27 wilderness areas and 3 national parks, including Rocky Mountain, Grand Teton, and Yellowstone (Table S2: Protected areas along the CDT). Both the CDT and the PCT corridors stretch from the border of Mexico to Canada and follow major mountain ranges. Furthermore, both modeled trail corridors show the potential of holding a variety of important wildland conservation values for now and in the future (Figure 2).

3.1. Question 1

Eighty-seven percent of the PCT corridor was in the top 50th percentile of the most valuable wildlands in the U.S. (Table 2, Figure 3). Secondly, 18% of the trail was in the top 5% of wildland conservation value in the country and fifty percent of the trail is in the top 25%. The PCT corridor contained land with high wildness value (23% is in the top 95th percentile) and high corridor value (25% is in the top 95th percentile). Sequoia-Kings Canyon Wilderness (29,845 hectares), Yosemite National Park and Wilderness (46,046 hectares), and Kings Canyon National Park (21,379 hectares) total 13.18% of the trail and since their ecosystems are protected as GAP Status 1 and 2 lands their ecological footprint positively contributed to the PCT’s wildness and corridor values.
The San Bernardino and the Los Angeles Mountain ranges both had high biodiversity along the PCT corridor, despite their close proximity to the human matrix in Southern California. Over 34% of the trail was in the top 50% of the most species-rich places in the contiguous U.S. Though the majority of rare species are in the East, numerous locations in California are of high biodiversity priority. Over half of the PCT corridor was in the top 20% of the landscapes to be conserved for biodiversity and 91% was in the top 50% of biodiverse landscapes. Locations in elevations over 3000 ft in San Bernardino, Los Angeles, Kern, Sierra, and Klamath counties all showed high biodiversity value and were within the top 10% of the most biodiverse places in the country.
Despite its species richness and biodiversity priority, many of the ecosystems within the PCT corridor were already represented in protected areas (Table 2, Figure 2). Twenty-eight percent of the CDT buffer intersects a protected area (8% national park and 20% wilderness). While only about 1.5% of the trail buffer was in the top 95th percentile, 38% was in the top 75th percentile, and 87% was in the top 50th percentile of the most valuable lands based on the composite wildland conservation value (Table 3, Figure 4). Similar to the PCT corridor, the CDT corridor had a high wildness value and 11% was in the top 95th percentile and 75% was in the top 50th percentile. The large footprints of Glacier National Park (4.21%, 35,473 hectares), Bob Marshall Wilderness (2.75%, 23,137 hectares), Bridger Wilderness (2.53%, 21,346 hectares), Yellowstone National Park (2.52%, 21,224 hectares), and Weminuche Wilderness (2.46%, 20,764 hectares) along the CDT all contributed to its wildness value.
Ninety-five percent of the CDT corridor was in the top 50 percent of the most valuable corridor lands. Locations between 36.18 degrees and 45.56 degrees north had the highest corridor values and were in the top 10%.
The CDT corridor exhibits lower biodiversity priorities than the PCT corridor and only 37% was in the 50th percentile of the most species-rich places in the country. In addition, only 22% of the CDT corridor was in the top 50% of the landscapes deemed a biodiversity priority. Similar to the PCT corridor, many of the ecosystems on the CDT corridor were already represented within protected areas and only 37% of the PCT is in the 50th percentile of ecosystems that are still in need of representation.
The lands around the PCT and the CDT exhibited valuable continental corridor values for today and over the next century. Twenty percent of the PCT and twenty-five percent of the CDT was in the 95th percentile of the most valuable corridor landscapes (Table 2 and Table 3). Additionally, as the climate changes, 66% of the PCT was in the top 50th percentile of the most important wildlife corridor routes and 82% of the CDT was in the top 50th percentile. Landscapes near Glacier and Yellowstone National Park as well as land units in Southern California and near Yakima, California, in the North could be valuable land units along the CDT and PCT corridor over the next 100 years.

3.2. Question 2

The PCT corridor was composed of 11% national park and 44% wilderness area. Many of the ecosystems on the PCT and CDT corridors are already represented within protected areas. Fifty percent of the PCT is preserved as GAP Status 1 and 2 lands (Table 4) and 34% CDT is preserved (Table 5). The rest of the PCT trail and surrounding buffer is primarily managed by the U.S. Forest Service as GAP Status 3. Approximately another 2% is managed by the BLM, and a handful of state agencies and regional agencies. In addition, 12% is either known to be GAP Status 4 and to be unmanaged or is uncategorized.
Sixty-six percent of the CDT corridor is currently not protected. Another 56% is GAP Status 3, which is owned by three primary entities, the USFS (47%), BLM (8%), and State lands (1%) (Table 5). The last 12% is either GAP Status 4 or unclassified and none of the land units are owned or managed by a non-governmental conservation organization. In addition, sections of the CDT are along roads or allow for motorized recreational vehicles [15].

4. Discussion

The conservation infrastructure that both the modeled Pacific Crest Trail (PCT) and Continental Divide Trail (CDT) corridors provide for the American West is quite remarkable. Both the PCT and the CDT traverse nationally significant wild lands important for continental connectivity. Multiple governmental agencies and major non-governmental organizations (NGOs) have carried out extensive work to plan and map potential corridors throughout the country. It could be that the PCT and the CDT corridors first set aside by the early conservationists, local hiking clubs [19], holds the highest ecological integrity across the country. Like Olmsted’s Emerald Necklace in Boston, which sought to connect land to land and people to land, the PCT and CDT corridors hold additional wildland conservation values beyond human recreation. Set aside to be the best hiking lands in West (due to their elevational gradients, biodiversity, and continental routes) [19], the PCT and CDT could now be buffered to build corridors for wildlife movement.
Despite their wildness and connectivity value, many of the ecosystems along the PCT and CDT corridors are already highly represented in the American conservation reserve probably due to three reasons. (1) They are at high elevations and therefore less cultivated and used and influenced by the human matrix. (2) Hiking clubs, the first non-governmental organizations (NGOs) to practice conservation, fought to conserve these trails for personal and community recreation before heavy human expansion. (3) Since hiking clubs established their routes first, protected areas and public lands were designated along the trails conserving high-elevation trail landscapes. Early recreationists’ efforts to preserve these places created a valuable ecological anchor in the Anthropocene; landscapes that were once primarily preserved for their recreational value seem to also hold ecological integrity. It could be, as Benton MacKaye surmised in 1966 when he presented his vision of the PCT and the CDT to the Secretary of the Interior, that the trails and protected areas bolster one another [20] (Figure 5). Since many of the ecosystems are already protected, yet the PCT and CDT corridors have gaps in protection, focusing conservation efforts on unprotected landscapes within the trail corridors is warranted.
Protected areas in the West and the East are to be the lynchpin for thousands of species as the climate changes [28]. Interestingly, according to corridor value and forward climate velocity centrality maps (Figure 1), the routes that many species will take from protected area to protected area in the West follow either the PCT or the CDT. Terrestrial taxa could use the lands surrounding these trails to migrate, disperse, and relocate in the Anthropocene, and further analysis of wildlife movement (camera traps and collared data) along these trails is warranted. Additionally, due to extreme elevational change microclimates along the trail, the PCT and CDT could become refugia for a wide variety of species that need to traverse their high elevations to find suitable habitats. Therefore, a deeper analysis of the PCT and CDT corridors’ ecological integrity compared to other potential wildlife corridors in the West is needed, especially at finer scales.
One of the biggest hindrances to creating a continental corridor is the interagency collaboration and the procurement of additional land units. Fortunately, in this case the public already owns ninety percent of the land along these scenic trails. By using Beier’s [16] recommendation of a 2 km buffer (1 km on either side of the trail), a continental corridor for a diverse set of terrestrial species including megafauna could be almost completely protected on public land.
The majority of GAP Status 3–4 lands along our modeled PCT and CDT corridors are managed by the U.S. Forest Service and BLM (Table 4 and Table 5). The U.S. Forest Service manages 2456 sq km along the PCT and 3967 sq km along the CDT, and the BLM manages 90 sq km along the PCT and 676 sq km along the CDT. Congress could designate 2-km-wide swaths of land along the PCT and CDT for a wildlife corridor or these agencies could increase the gap status around these trails to Gap Status 1 or 2 to protect land units for wildlife movement and not just recreation. To put this in perspective, the U.S. Forest Service manages 781,340 km2 and wildlife corridors along the PCT and CDT would need less than 1% of their current reserve (0.31% on the PCT corridor and 0.51% on the CDT corridor). Meanwhile, the BLM manages 243 million acres, and wildlife corridors would need less than 0.08% of their reserve (0.01% for the PCT corridor and 0.07% for the CDT corridor). A further fine-scale analysis of each Forest Service and BLM unit near the trail should be conducted (Table S3: Largest GAP Status 3 land units along the Pacific Crest Trail and Continental Divide Trail corridors).
Additional land units from a few state and regional agencies (134 sq km around the PCT and 246 sq km around the CDT) would need to be preserved and the unknown 10–12% of each trail would need to be researched. These privately held landscapes could be pursued as conservation easements or purchased by conservation NGOs.
Some recreation activities and conservation values may be compatible [29]. In fact, most protected areas have a twofold mission: to preserve and to provide for visitor recreation. However, a systematic global review suggests that human recreation can have a negative effect on a given species population and individual responses [29]. Approximately 40% of the 112 articles concluded that hiking and running can have adverse effects on species [29]. To understand the complexities of human-nature interactions, additional experimental studies specific to a variety of wildlife species along the PCT and CDT and their behavioral responses should occur.

5. Conclusions

The time is now to set aside land for other species and for ourselves. In South America, Chile has made a commitment to expand their national parks, and then connect them through the “Ruta de Parques” [30]. To complete the project, Chile’s President, Michelle Bachelet, partnered with Tompkins Conservation, a private land trust, to procure the largest land donation in history and the protected area network is slated to make the Chilean reserve system the longest in the world [30]. The Ruta de Parques uses existing rural roads, recreational trails (human footpaths), and ferry ways to connect 17 national parks. Capitalizing on existing infrastructure as an anchor for continental connectivity, Ruta de Parques focuses on connecting reserve sites for both human recreation and biodiversity conservation [30]. Unlike the PCT and the CDT, the Ruta de Parques allows motor vehicle travel, which hinders wildlife movement.
Similar to Chile, the original intent of the U.S. park system was for human enjoyment and recreation, and then ecological benefits followed [31]. By conserving adjacent lands to scenic trails in North America, a wild, connected, and diverse continental corridor could diminish the continued loss of species in the Anthropocene. In addition, we could find that green infrastructure, recreational trails, and greenways on multiple scales are a beneficial existing framework from which to build wildlife corridors.
In conclusion, evaluating existing recreational trails and their adjacent landscapes might aid in meeting Wilson’s half-Earth [32] and the Global Deal for Nature [33]. In the U.S. alone, the federal government owns 47% of all land in the West [34]. However, not all 47% of land in the American West is set aside in Gap Status 1 and 2 protected areas. If half of all land in the world [32] is to be preserved in a network, employing lands adjacent to recreational trails to connect protected areas is a sensible place to start. The U.S. was an original leader in land conservation [31]; however, their national parks are too small and disconnected to protect species in the long-term [35]. The climate will continue to shift [36], and projections of the human footprint suggest further expansions [2].
Therefore, contemporary ideas such as building networks out of existing recreational trails on multiple scales could provide a roadmap for reserve systems globally. In evaluating trail corridors around the globe, we could find that the routes for bold wildlife corridors for which we are searching already exist.

Supplementary Materials

The following supporting information can be downloaded at https://www.mdpi.com/article/10.3390/land11030348/s1, Table S1: Protected areas along the PCT, Table S2: Protected areas along the CDT, Table S3: Largest GAP Status 3 land units along the Pacific Crest Trail and Continental Divide Trail corridors.

Author Contributions

Conceptualization, M.B.W.; methodology, R.T.B.; software, M.B.W. and R.T.B.; validation, M.B.W. and R.T.B.; formal analysis, M.B.W.; investigation, M.B.W.; resources, M.B.W.; data curation, M.B.W.; writing—original draft preparation, M.B.W.; writing—review and editing, R.T.B.; visualization, M.B.W.; supervision, R.T.B.; project administration, M.B.W. All authors have read and agreed to the published version of the manuscript.

Funding

This research received no external funding.

Data Availability Statement

Data are available for download at www.melissawilson.net/data, accessed on 20 February 2019.

Acknowledgments

Thank you to Mark Leighton of Harvard University Extension School for his expertise and guidance. Thank you to Kris and Doug Tompkins of Tompkins Conservation for their inspiration. Lastly, thank you as well to Edward Wilson of E.O. Wilson Foundation and Harvard University for his bold vision and encouragement.

Conflicts of Interest

The authors declare no conflict of interest.

References

  1. McGuire, J.L.; Lawler, J.J.; McRae, B.H.; Nuñez, T.A.; Theobald, D.M. Achieving climate connectivity in a fragmented landscape. Proc. Natl. Acad. Sci. USA 2016, 113, 7195–7200. [Google Scholar] [CrossRef] [Green Version]
  2. Martinuzzi, S.; Radeloff, V.C.; Joppa, L.N.; Hamilton, C.M.; Helmers, D.P.; Plantinga, A.J.; Lewis, D.J. Scenarios of future land use change around United States’ protected areas. Biol. Conserv. 2015, 184, 446–455. [Google Scholar] [CrossRef]
  3. Hilty, J.A.; Lidicker, W.Z.; Merenlender, A.M. Corridor Ecology: The Science and Practice of Linking Landscapes for Biodiversity Conservation, 1st ed.; Island Press: Washington, DC, USA, 2006. [Google Scholar]
  4. Anderson, M.G.; Barnett, A.; Clark, M.; Sheldon, A.O.; Prince, J.; Vickery, B. Resilient and Connected Landscapes for Terrestrial Conservation; The Nature Conservancy: Boston, MA, USA, 2016. [Google Scholar]
  5. Belote, R.T.; Dietz, M.S.; McRae, B.H.; Theobald, D.M.; McClure, M.L.; Hugh Irwin, G.; McKinley, P.S.; Gage, J.A.; Aplet, G.H. Identifying corridors among large protected areas in the United States. PLoS ONE 2016, 11, e0154223. [Google Scholar] [CrossRef] [PubMed] [Green Version]
  6. Alagador, D.; Cerdeira, J.O.; Araújo, M.B. Climate change, species range shifts and dispersal corridors: An evaluation of spatial conservation models. Methods Ecol. Evol. 2016, 7, 853–866. [Google Scholar] [CrossRef] [Green Version]
  7. Bond, M. Principles of Wildlife Corridor Design; Center for Biological Diversity: Tucson, AZ, USA, 2003; pp. 1–4. [Google Scholar]
  8. Aycrigg, J.L.; Davidson, A.; Svancara, L.K.; Gergely, K.J.; McKerrow, A.; Scott, J.M. Representation of Ecological Systems within the Protected Areas Network of the Continental United States. PLoS ONE 2013, 8, e54689. [Google Scholar] [CrossRef] [Green Version]
  9. Fábos, J.G.; Ryan, R.L. An introduction to greenway planning around the world. Landsc. Urban Plan. 2006, 76, 1–6. [Google Scholar] [CrossRef]
  10. Williams, J.C.; ReVelle, C.S.; Levin, S.A. Spatial attributes and reserve design models: A review. Environ. Model. Assess. 2005, 10, 163–181. [Google Scholar] [CrossRef]
  11. Emmanuel, R.; Loconsole, A. Green infrastructure as an adaptation approach to tackling urban overheating in the Glasgow Clyde Valley Region, UK. Landsc. Urban Plan. 2015, 138, 71–86. [Google Scholar] [CrossRef] [Green Version]
  12. Foster, J.; Lowe, A.; Winkelman, S. The Value of Green Infrastructure for Urban Climate Adaptation; Center for Clean Air Policy: Washington, DA, USA, 2011. [Google Scholar]
  13. Elkinton, S. The National Trails System: A Grand Experiment; Forgotten Books: London, UK, 2012; p. 50. [Google Scholar]
  14. Service, U.F. Criteria for Location, Design, Signing and User Facilities. Available online: https://www.wbdg.org/ffc/dod/unified-facilities-criteria-ufc/ufc-3-120-012011 (accessed on 20 February 2019).
  15. Hendricks, L. No Title. 2021. [Google Scholar]
  16. Beier, P. A rule of thumb for widths of conservation corridors. Conserv. Biol. 2019, 33, 976–978. [Google Scholar] [CrossRef]
  17. Pacific Crest Trail Association. Strategic Plan 2018–2021. 2018. Available online: https://www.unwomen.org/en/executive-board/documents/strategic-plan-2018-2021 (accessed on 20 February 2019).
  18. Kahn, P. No Title. 2018. [Google Scholar]
  19. Mann, B.S. Where does Pacific Crest Trail Begin? Is it Campo? Manning Park. 2011; 9–10.
  20. Shaeffer, E. Walking with Spring; Appalachian Trail Conservancy, Appalachian Trail Conservancy: Harpers Ferry, WV, USA, 2004. [Google Scholar]
  21. Theobald, D.M.; Gross, J.E.; Piekielek, N.; Olliff, T.; Davis, C.; Monahan, W.B.; Haas, J.; Hansen, A.J.; Running, S.W. Exposure of U.S. National Parks to land use and climate change 1900–2100. Ecol. Appl. 2013, 24, 484–502. [Google Scholar] [CrossRef]
  22. Jenkins, C.N.; Van Houtan, K.S.; Pimm, S.L.; Sexton, J.O. US protected lands mismatch biodiversity priorities. Proc. Natl. Acad. Sci. USA 2015, 112, 5081–5086. [Google Scholar] [CrossRef] [PubMed] [Green Version]
  23. Venter, O.; Sanderson, E.W.; Magrach, A.; Allan, J.R.; Beher, J.; Jones, K.R.; Possingham, H.P.; Laurance, W.F.; Wood, P.; Fekete, B.M.; et al. Sixteen years of change in the global terrestrial human footprint and implications for biodiversity conservation. Nat. Commun. 2016, 7, 12558. [Google Scholar] [CrossRef] [PubMed] [Green Version]
  24. Carroll, C.; Parks, S.A.; Dobrowski, S.Z.; Roberts, D.R. Climatic, topographic, and anthropogenic factors determine connectivity between current and future climate analogs in North America. Glob. Chang. Biol. 2018, 24, 5318–5331. [Google Scholar] [CrossRef] [PubMed] [Green Version]
  25. McKerrow, A.J.; Tarr, N.M.; Rubino, M.J.; Williams, S.G. Patterns of species richness hotspots and estimates of their protection are sensitive to spatial resolution. Divers. Distrib. 2018, 24, 1464–1477. [Google Scholar] [CrossRef] [Green Version]
  26. Belote, R.T.; Dietz, M.S.; Jenkins, C.N.; McKinley, P.S.; Irwin, G.H.; Fullman, T.J.; Leppi, J.C.; Aplet, G.H. Wild, connected, and diverse: Building a more resilient system of protected areas. Ecol. Appl. 2017, 27, 1050–1056. [Google Scholar] [CrossRef]
  27. Venter, O.; Sanderson, E.W.; Magrach, A.; Allan, J.R.; Beher, J.; Jones, K.R.; Possingham, H.P.; Laurance, W.F.; Wood, P.; Fekete, B.M.; et al. Global terrestrial Human Footprint maps for 1993 and 2009. Sci. Data 2016, 3, 160067. [Google Scholar] [CrossRef] [Green Version]
  28. Majka, D. Migrations in Motion. Available online: http://maps.tnc.org/migrations-in-motion/#4/19.00/-78.00 (accessed on 20 February 2019).
  29. Larson, C.L.; Reed, S.E.; Merenlender, A.M.; Crooks, K.R. Effects of Recreation on Animals Revealed as Widespread through a Global Systematic Review. PloS ONE 2016, 11, e0167259. [Google Scholar] [CrossRef] [Green Version]
  30. Bisharat, A. National Geographic. 2017. Available online: https://www.nationalgeographic.co.uk/author/andrew-bisharat (accessed on 20 February 2019).
  31. Brewer, R. Conservancy: The Land Trust Movement in America; Dartmouth College Press: Chicago, IL, USA, 2004. [Google Scholar]
  32. Wilson, E.O. Half-Earth: Our Planet’s Fight for Life; Liveright Publishing Corporation: New York, NY, USA, 2016. [Google Scholar]
  33. Dinerstein, E.; Vynne, C.; Sala, E.; Joshi, A.R.; Fernando, S.; Lovejoy, T.E.; Mayorga, J.; Olson, D.; Asner, G.P.; Baillie, J.E.M.; et al. A Global Deal for Nature: Guiding principles, milestones, and targets. Sci. Adv. 2019, 5, eaaw2869. [Google Scholar] [CrossRef] [Green Version]
  34. Bui, Q.; Sanger-Katz, M. Why the Government Owns So Much Land in the West. New York Times. p. 2016. Available online: https://www.nytimes.com/2016/01/06/upshot/why-the-government-owns-so-much-land-in-the-west.html (accessed on 20 February 2019).
  35. Newmark, W.D. Western North American National Parks Norte América. Conserv. Biol. 1995, 9, 3–6. [Google Scholar] [CrossRef]
  36. Calvo Buendia, E.; Guendehou, S.; Limmeechokchai, B.; Pipatti, R.; Rojas, Y.; Sturgiss, R.; Tanabe, K.; Wirth, T.; Romano, D.; Witi, J.; et al. 2019 Refinement to the 2006 IPCC Guidelines for National Greenhouse Gas Inventories; IPCC: Geneva, Switzerland, 2019; pp. 1–15. [Google Scholar]
Figure 1. Diagram of a trail tread versus a trail corridor.
Land 11 00348 g001
Figure 2. Values of the modeled wildlife corridors along the Pacific Crest Trail and the Continental Divide Trails. (A) Wildland conservation value [26]; (B) wildness [27]; (C) corridor value [5]; (D) forward centrality [24]; (E) species richness [25]; (F) biodiversity priority [22]; (G) ecosystem representation [8].
Land 11 00348 g002
Figure 3. Wildland conservation values of the Pacific Crest Trail corridor. Bar graph to the right of each conservation value indicates the percentage of the trail that is in the top 5%, top 10%, top 20% to 25%, and top 50% of land units in the contiguous U.S. (A) Wildland conservation value [26]; (B) wildness [27]; (C) corridor value [5]; (D) forward centrality [24]; (E) species richness [25]; (F) biodiversity priority [22]; (G) ecosystem representation [8].
Land 11 00348 g003
Figure 4. The conservation values of the Continental Divide Trail corridor. Bar graph to the right of each conservation value indicates the percentage of the trail that is in the top 5%, top 10%, top 20% to 25%, and top 50% of land units in the contiguous U.S. (A) Wildland conservation value [26]; (B) wildness [27]; (C) corridor value [5]; (D) forward centrality [24]; (E) species richness [25]; (F) biodiversity priority [22]; (G) ecosystem representation [8].
Land 11 00348 g004
Figure 5. (a) Modeled potential protected area network by Benton MacKaye in 1966 [20]. (b) Modeled potential area network using the PCT and CDT as wildlife corridors in the American West.
Land 11 00348 g005aLand 11 00348 g005b
Table 1. Datasets for the assessment of Pacific Crest Trail and Continental Divide Trail.
DataSourceWebsite
Protected Area Database
PADUS Gap StatusUSGS Gap Analysis Programhttps://www.usgs.gov/core-science-systems/science-analytics-and-synthesis/gap/science/protected-areas (accessed on 20 February 2019)
National Scenic and Historic Trails
Pacific Crest TrailPacific Crest Trail Association, 2015https://nps.maps.arcgis.com/home/item.html?id=4d59fc03928a4b07b83c84d823321f34 (accessed on 20 February 2019)
Continental Divide Scenic TrailNational Park Service, 2017https://nps.maps.arcgis.com/home/item.html?id=908e9a2442bb4da48a4d979d98e02902 (accessed on 20 February 2019)
Wildland Conservation ValueBelote et al., 2017https://doi.org/10.1002/eap.1527 (accessed on 20 February 2019)
Wild
Human Footprint DatabaseVenter et al., 2016https://doi.org/10.1038/ncomms12558 (accessed on 20 February 2019)
Connected
Corridor ValueBelote et al., 2016https://doi.org/10.1371/journal.pone.0154223 (accessed on 20 February 2019)
Forward Climate Velocity
Shortest Path Centrality
Carroll et al., 2018https://doi.org/10.1111/gcb.14373 (accessed on 20 February 2019)
Diverse
Gap Species RichnessMcKerrow et al., 2018https://doi.org/10.1111/ddi.12779
(accessed on 20 February 2019),
Biodiversity PriorityJenkins et al., 2015https://doi.org/10.1073/pnas.1418034112
(accessed on 20 February 2019),
Ecosystem RepresentationAycrigg et al., 2014https://doi.org/10.5849/jof.15-050 (accessed on 20 February 2019)
Table 2. The conservation values of the Pacific Crest Trail corridor.
Wild, Connected, and DiverseTop 50%Top 25%Top 20%Top 10%Top 5%
Wildland Conservation Value
Square km61233490296819391308
Percentage86.74%49.44%42.05%27.47%18.53%
Wildness
Square km54484530401527471600
Percentage78.63%65.38%57.94%39.64%23.09%
Corridor Value
Square km70604951415924331435
Percentage99.96%70.10%58.88%34.45%20.32%
Forward Centrality
Square km472119611509595285
Percentage66.79%27.74%21.35%8.42%4.03%
Gap Species Richness
Square km243097765010110
Percentage34.39%13.83%9.20%1.43%0.14%
Biodiversity Priority
Square km640846803773993453
Percentage90.70%66.24%53.40%14.06%6.41%
Ecosystem Representation
Square km1310938600
Percentage18.54%1.32%1.22%0.00%0.00%
Table 3. The conservation values of the Continental Divide Trail corridor.
Wild, Connected, and DiverseTop 50%Top 25%Top 20%Top 10%Top 5%
Wildland Conservation Value
Square km734931872243582121
Percentage87.09%37.77%26.58%6.90%1.43%
Wildness
Square km6192569651403713913
Percentage74.78%68.79%62.08%44.84%11.03%
Corridor Value
Square km80156250536733672078
Percentage94.96%74.05%63.59%39.89%24.62%
Forward Climate Velocity
Square km69425337491235952567
Percentage82.19%63.19%58.16%42.56%30.39%
Gap Species Richness
Square km31451025658301185
Percentage37.19%12.12%7.78%3.56%2.19%
Biodiversity Priority
Square km192530121010
Percentage22.78%0.35%0.14%0.12%0.12%
Ecosystem Representation
Square km31452294797
Percentage37.21%2.71%0.56%0.11%0.08%
Table 4. GAP status and land managers of the Pacific Crest Trail corridor.
GAP Status (Square km and Percentage of Trail Corridor)
Manager1234NullTotal
U.S. Forest Service2344.2884.592453.58 4882.46
33.16%1.20%34.70% 69.06%
Bureau of Land Management152.63209.0189.91 451.55
2.16%2.96%1.27% 6.39%
State Lands 87.8525.2065.26 178.31
1.24%0.36%0.92% 2.52%
Regional (City, County, Water) 2.260.5838.65 41.49
0.03%0.01%0.55% 0.59%
Other 2.112.18 4.29
0.00%0.03%0.03% 0.06%
Non-governmental Organization 3.38 0.75 4.12
0.05% 0.01% 0.06%
National Park Service770.130.99 771.12
10.89%0.01% 10.91%
Unknown 736.99736.99
10.42%10.42%
Total Square km3267.05388.082571.37106.83736.997070.32
46.21%5.49%36.37%1.51%10.42%100.00%
GAP status of the PCT corridor (sq km). Rank ordered by GAP 3 and 4 values to visualize potential areas of conservation priority.
Table 5. GAP status and land managers of the Continental Divide Trail corridor.
GAP Status (Square km)
Manager1234NullTotal
U.S. Forest Service1614.4438.853967.47 5620.75
19.09%0.46%46.92% 66.47%
Bureau of Land Management21.47462.03675.88 1159.38
0.25%5.46%7.99% 13.71%
State Lands 19.8596.19148.05 264.09
0.23%1.14%1.75% 3.12%
Regional (City, County, Water) 0.0477 1.935 1.9827
0.00% 0.02% 0.02%
National Park Service624.1161.6222.65 708.39
7.38%0.73%0.27% 8.38%
U.S. Fish and Wildlife 0.09 0.09
0.00% 0.00%
Unknown 701.07701.07
8.29%8.29%
Total Square km2260.02582.494762.20149.99701.078455.77
26.73%6.89%56.32%1.77%8.29%100.00%
GAP status of the CDT corridor (sq km). Rank ordered by GAP 3 and 4 values to visualize potential areas of conservation priority.
Publisher’s Note: MDPI stays neutral with regard to jurisdictional claims in published maps and institutional affiliations.

