Article

Exploring the Role of Agricultural Services in Production Efficiency in Chinese Agriculture: A Case of the Socialized Agricultural Service System

1
School of Economics and Management, Yangtze University, Jingzhou 434023, China
2
Changjiang Economics Belt Research and Development Institute, Yangtze University, Jingzhou 434023, China
3
Institute of Agricultural and Resource Economics, University of Agriculture, Faisalabad 38040, Pakistan
*
Author to whom correspondence should be addressed.
Land 2022, 11(3), 347; https://doi.org/10.3390/land11030347
Submission received: 26 January 2022 / Revised: 22 February 2022 / Accepted: 23 February 2022 / Published: 26 February 2022
(This article belongs to the Section Land Socio-Economic and Political Issues)

Abstract

:
In recent decades, the Chinese government launched a socialized agricultural service system to help smallholders quickly modernize. This system helps farmers adopt modern-day farming operations to meet ever-increasing food and fiber requirements. The present study was conducted to analyze the impacts of this system on agricultural production efficiency. To this end, the Hubei province of China was selected, and the required data were retrieved from the Hubei Statistical Yearbook and Rural Statistical Yearbook for the years 2008 to 2019. The entropy method was applied to measure the extent of the adoption of socialized and individual agricultural services, while a data envelopment analysis (DEA) was used for measuring production efficiency. Grey correlation and regression analyses were carried out to analyze the association between production efficiency and agricultural service availability/uptake and the determinants of the former, respectively. The results illustrate that the agricultural socialized service level has increased. Specifically, the service levels of agricultural mechanization and financial insurance increased most rapidly in terms of individual services with the largest numbers of adopters. Science and technology and material services were found to exhibit the most significant relationships with the production efficiency of farmers. The results indicate a greater role of service provision in moderate-to-high-scale development, leading to land productivity and thereby improving agricultural production efficiency. The results also imply a higher demand for socialized agricultural services among farmers considering the value-added potential of such an integrated system with greater spillover options for achieving self-sufficiency in agriculture and ensuring food security.

1. Introduction

There is a regional difference between rural and urban areas based on differences in structures and functions, particularly in terms of social, economic, and natural characteristics [1] in many countries including China. Moreover, labor has moved from rural areas to urban areas due to rapid industrialization and urbanization in most countries across the globe [2,3]. These industrialization and urbanization processes occurred earlier in developed countries, while in developing countries, they emerged more recently and are ongoing. For instance, due to technological changes, the migration structure in the western United States (US) led to a transformation of the human and land relationship during the 1980s and 1990s [4].
Similarly, changes to rural and urban population characteristics occurred in Australia due to the dominant production goals based on production, consumption, and protection factors [5]. The same changes were observed in the United Kingdom (UK) and New Zealand [6,7]. Subsequently, developing countries began to follow this trend at the same pace (e.g., in the 1980s in Poland and other countries) [8]. The fast development of industrialization and urbanization in China has also led to the rapid displacement of the rural population since the 21st century. Consequently, rural decline has created a global challenge for food production to feed the planet’s growing population [9]. In addition, the country’s agricultural economic status has contracted and the service system has increased due to the movement of labor from rural to urban areas and the restructuring of economic and social systems [10].
On the other hand, the population is increasing. It is anticipated that the global population will expand from 7.2 billion to 10 billion [11,12]. In addition, changes to the climate and overexploitation in agriculture continuously contribute to losses in arable land, resulting in food production, consumption, and distribution imbalances [13,14,15,16,17,18]. This situation demands the better use of land and more efficient crop production. Studies revealed the substantial impact of these changes on farm income due to the impacts on agricultural production. This situation demands better technologies and services, which are crucial to enhance the efficiency of crops and food [19,20,21,22].
According to the existing research, labor migration from rural to urban areas has negatively impacted production, which affects food security [23,24,25]. Agricultural social services and mechanisms are considered very important for agricultural sustainability and food security. This entails the usage of various types of equipment, machinery and services, such as information input, land-preparation harvesting, and other basic processes known as services and mechanisms [25,26,27]. There is currently a trend of moving away from using agricultural mechanisms to improve the techniques and services to help the agricultural system [27]. Evidence shows that, in terms of farm-labor supply and demand, the landscape and profit [28] can improve the economic situation and efficiency of production.
China’s economic development is strongly supported by the agricultural sub-sector through its contributions to industrial raw material provisions, as well as providing functional employment to the peasant population [29,30]. An earlier study revealed that agriculture historically dominated China and succeeded in maintaining food self-sufficiency, especially food grains in the last few decades [31]. Adekola and Alabadan stated that Chinese agriculture could also be understood in terms of an increased quality and quantity of agricultural products, the competitiveness of products on the global market, improved ecological and environmental protection, etc. [32]. Additionally, China’s 14th Five-Year Plan highlights the direction of agricultural and rural development, by promoting rural revitalization and improving agricultural quality and efficiency comprehensively. To continue such performance, modern and commercialized rural services must be built, especially to promote agriculture at the traditional level [33]. Social services are also considered important for improving agriculture and increasing its efficiency [34,35,36].

1.1. Social Services in Agriculture and Public Intervention for Value Co-Production

The Chinese Ministry of Agriculture and Rural Affairs, along with the country’s Ministry of Finance, issued a notice in 2020 on further improving socialized services for agricultural production to promote a healthy and positive association between small farmers and the development of modern agriculture. Socialized agricultural services are classified into different categories, such as agricultural infrastructure, production sources, science and technology, finance, mechanization, and informatization [37]. These services play a crucial role in improving agricultural production efficiency, promoting high-quality rural development, and ensuring food security. The subsidy policy for the purchase of agricultural machinery has also had an extensive impact on the promotion and development of agricultural mechanization. Wang et al. [38] argued that agricultural machinery services are an important source of effective farm mechanization via the provision of farm-machinery-purchase subsidy policies to improve the level of agricultural mechanization. A sound subsidy policy for the purchase of agricultural machinery has a positive effect on farmers’ income [39] and, at the same time, is conducive to increasing the number of customized farm machinery units, as well as the level and extent of modernization in agricultural mechanization [40].
Postner [41] calculated the promotion effect of socialized services on agricultural production using secondary data from 1967 to 1977 alongside input–output variables among Canadian farmers, revealing a positive association. Li and Liu [42] analyzed the correlation between socialized services and agriculture and revealed that China’s production service system is relatively underdeveloped, thereby hindering the development of agriculture. Shuqi et al. [43] identified gaps in agricultural development in China, although there has been considerable progress. Ming [44] used linear and power function curve methods to estimate the correlation between agriculture and producer services and illustrated a spatial synergy between them. Another study used the grey correlation model to measure the correlation between socialized agricultural services and agricultural production efficiency [45]. The result of their study indicated that the correlation between agricultural machinery services and agricultural production efficiency was significantly positive. Ji et al. [46] conducted a study on socialized services, labor force, and land fragmentation in the agricultural sector using survey data. In their research, the authors found that socialized agricultural services are conducive to alleviating the adverse impact of the rural aging population and feminization on agricultural production.
Moreover, previous research revealed that purchasing socialized agricultural services is crucial to improving agricultural production efficiency [47]. Additionally, agricultural machinery operation services can significantly enhance agrarian production efficiency. Likewise, Yang et al. [48] illustrated the role of socialized agricultural services in improving agricultural production efficiency in the following three ways: the division of labor, substitution, and technology. Moreover, social services in farming have been garnering attention due to their significant impact on the agricultural sector. According to data from Shandong province, the improvement of socialized services could effectively provide upgrades to agricultural and industrial structures [45]. These upgrades would indirectly play a significant role in enhancing the efficiency of agricultural production. Similarly, another study was conducted by Lu et al. [49], who analyzed the impact of socialized services in different links on agricultural technical efficiency based on the degree of land fragmentation. The authors applied microdata and beyond logarithm stochastic frontier models to estimate the results.

1.2. Need for Socialized Agricultural Services and Scope of Sustainable Agriculture

China plays a vital role in agricultural production by feeding not only its huge population but also that of other countries. Hubei province is the leading grain-producing province in China and plays an essential role in realizing the “rise of central China,” which is vital not only for the national economy but also for people’s livelihoods [50]. However, this province is under pressure from significant uncertainties. For example, extreme climate events, urban migration, old-age labor at farms, and shortages of rural labor are becoming increasingly serious [51]. These issues affect the development of modern agriculture. It is, therefore, an urgent task for the province to comprehensively promote rural revitalization and modern agricultural development. Agricultural socialized services are a healthy way to associate small farmers with agricultural modernization [52]. Previous studies focused on social farming in terms of a lack of capital, but in this study, we considered socialized services related to labor migration and climate change. This aspect is quite novel in terms of the prevailing issues of rural–urban migration and cities’ concentration. Looking at the efficiency vis à vis a publicly facilitated service provision provides further insights for effective policy formulation. In contrast, as shown by [53,54,55], service availability, its use and dynamics can either complement or promote rural–urban migration with little focus on various aspects of efficiency—allocative as well as technical ones. The work at hand goes beyond these injunctions, as we show how socialized service delivery can improve farmers’ efficiency and reduce their search and procurement costs. Nevertheless, given the nature of scale operations and input costs, more and more smallholder farmers have begun to choose outsourced agricultural machinery services [38,56]. Another motive behind the uptake of this topic for research is that investment in agricultural machinery is a relatively large expenditure for smallholders, and the sunk costs of machinery are relatively high. Therefore, small-scale farmers usually have no incentive to purchase self-owned machinery [39,57]. To manage agricultural production more efficiently, smallholders are more inclined to outsource labor-intensive production processes [58,59]. On the other hand, Ref. [60] explicitly reveal the implications of rural–urban migration for structural transformation of rural society, taking Sub-Saharan Africa as an example. Such an outcome has a wide-ranging impact on land-ownership as well as its profitable or at least sustainable use [61]. Given this scenario, socialized service provision has its own potential for initiation, but the evaluating its impact on farm-level operations and output results makes a strong case for further study.
Hence, this study sought to determine whether socialized agricultural services influence production efficiency and whether there is any correlation between the agricultural sector and socialized agricultural services. For this purpose, it is essential to understand the socialized service demand for agriculture and the correlation between agriculture and socialized services. Therefore, the present study objectively investigated the impact of socialized services on production efficiency in the agriculture sector. This work also analyzed the correlation between socialized agricultural services and agricultural production efficiency and contributes to the existing literature by providing new insights in terms of variables and methodology. Because problems of rural population outflow, population aging, land abandonment, and rural labor shortages are becoming increasingly serious, the role of interventions such as socialized agricultural services needs to be explored. The findings of this study provide improved benchmarking of the targets, tipping points, and hotspots for greater efficacy, leading to sustainable agriculture. In addition, the type of intervention introduced in the study area can provide valuable insights in terms of research findings as to which effects and dynamics are linked with the program if implemented elsewhere in the world. This reasoning explains the interest of international readers in the topic of this work.

2. Methodology

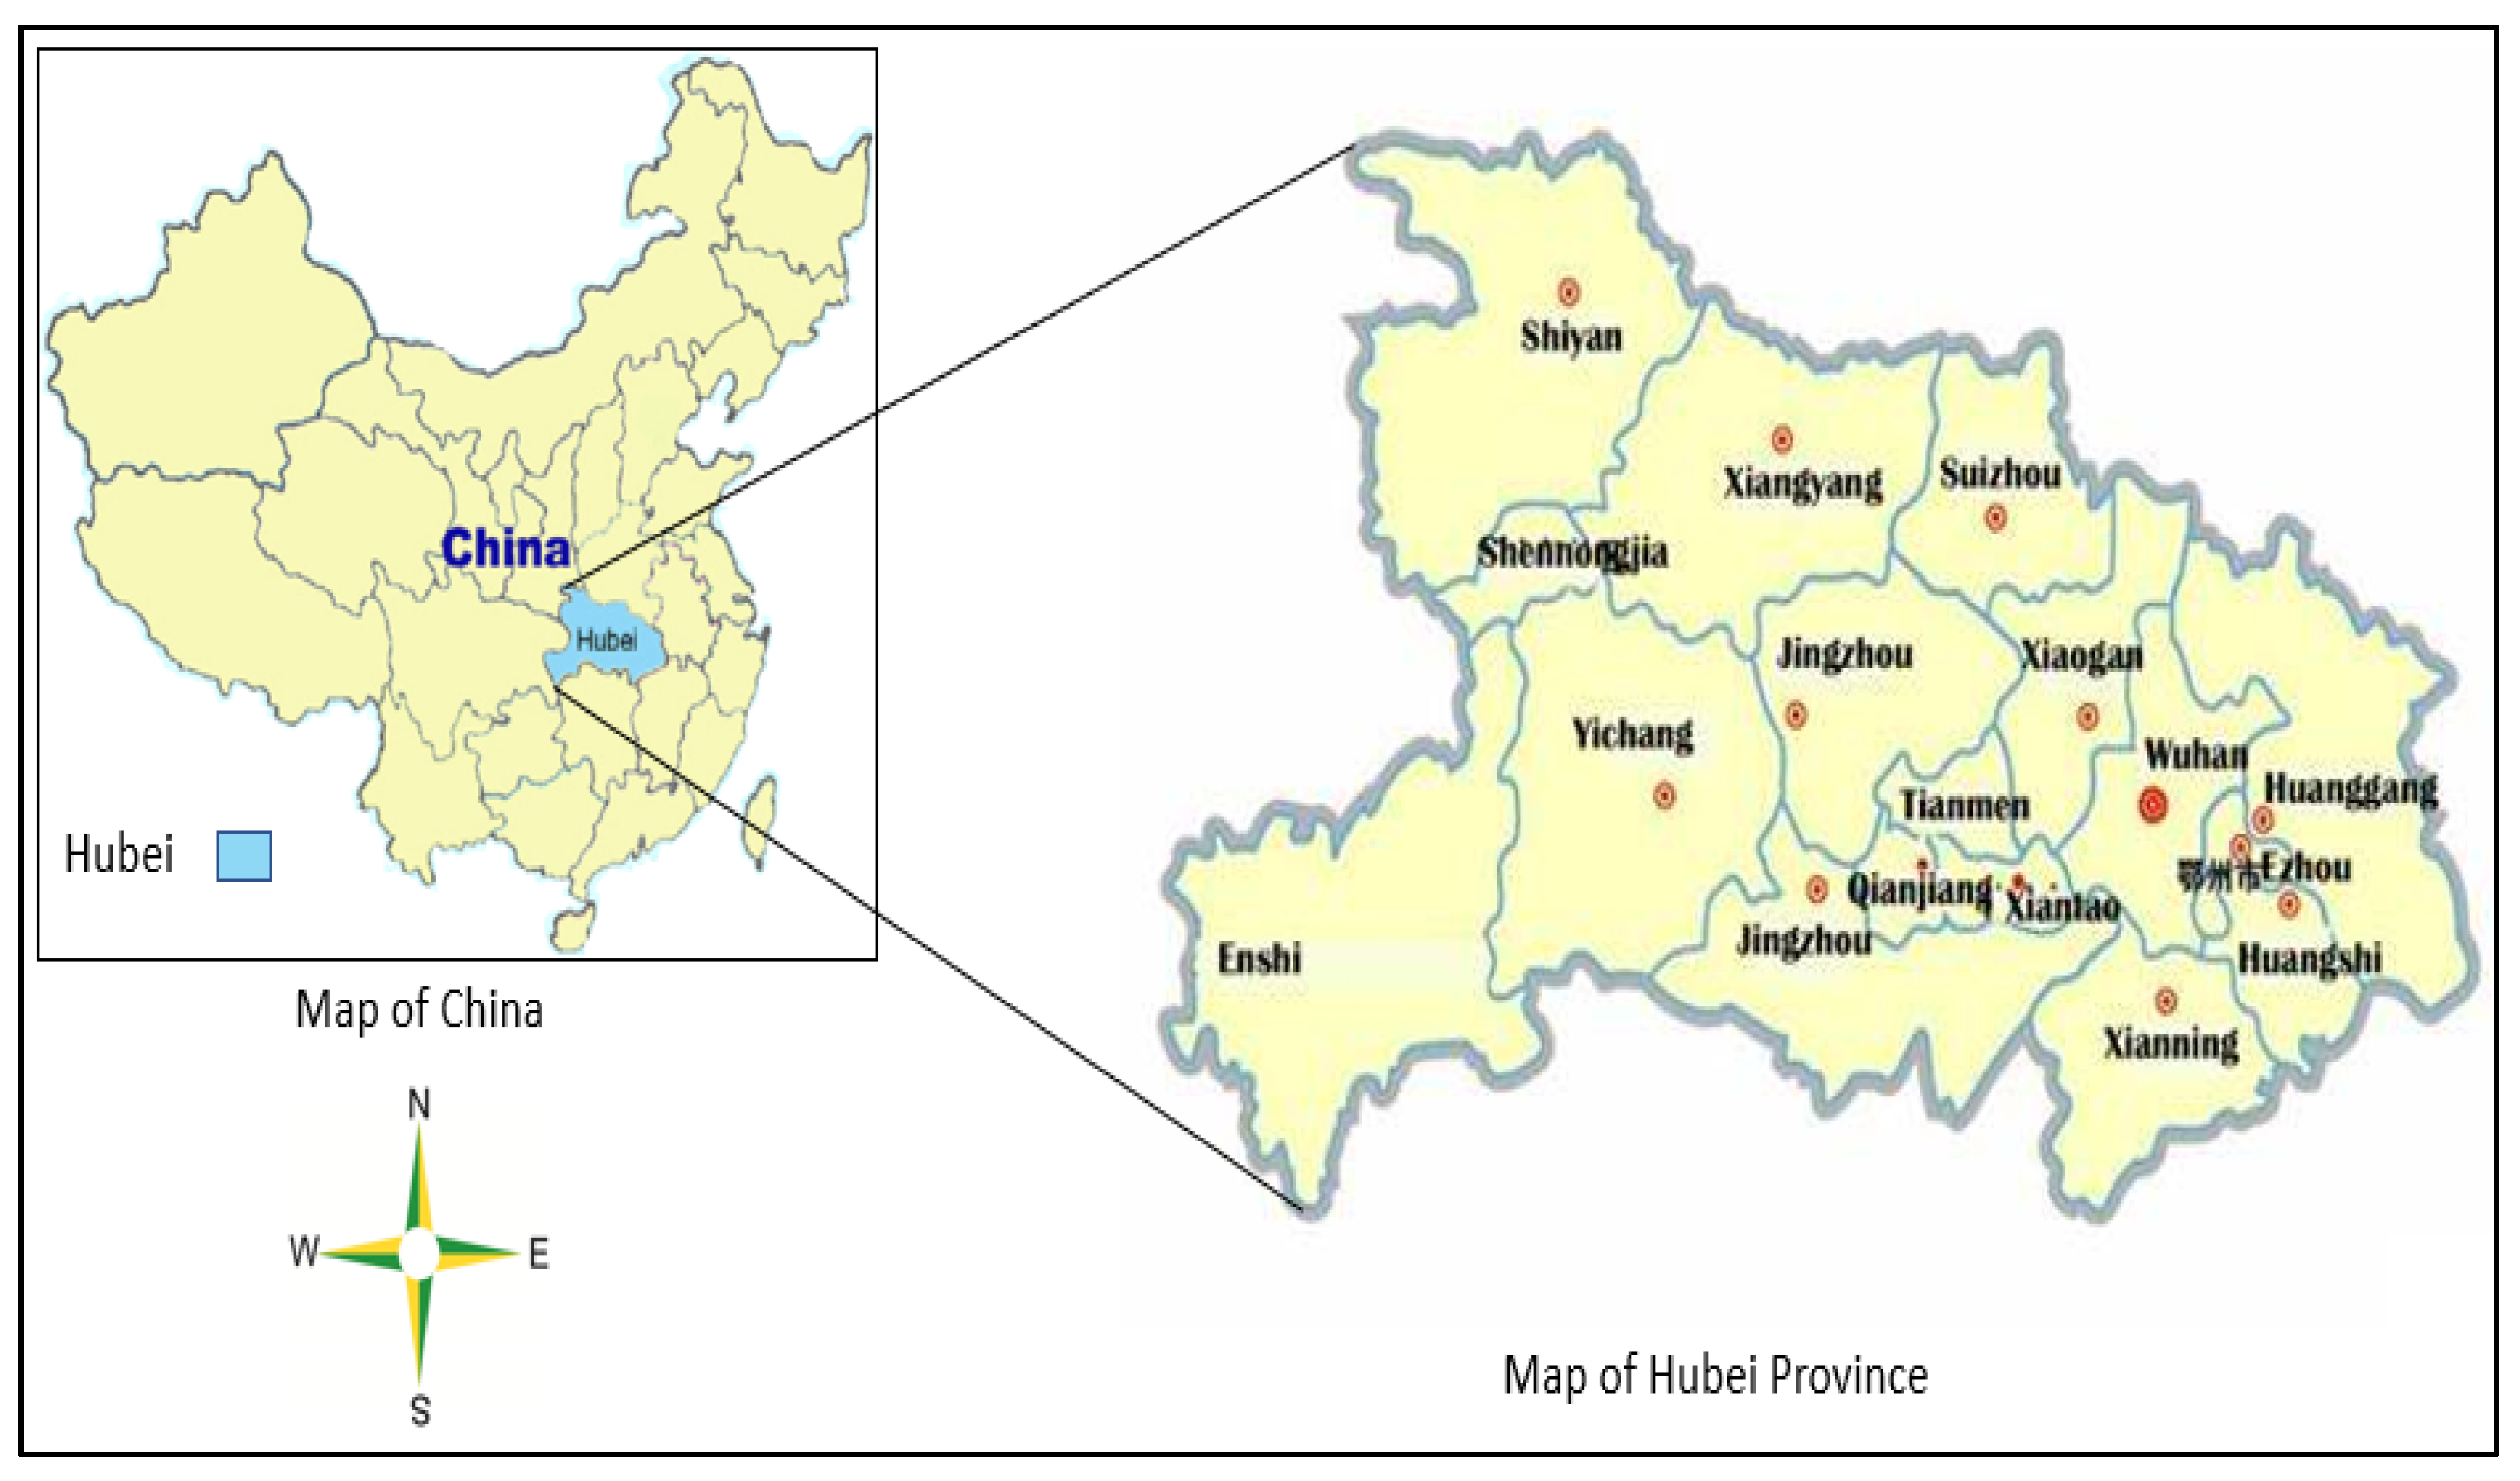
2.1. Study Area Selection

Figure 1 shows a map of the study area. The data used for the present study were taken from Hubei province in China. Hubei province lies in the heart of the country and a part of the middle basin of the Yangtze River, situated at 108′21″–116′07″ east longitudinally and 29′05″–33′20″ north latitudinally. Moreover, this province is located between wheat- and rice-growing zones and is considered a transition region of the agricultural sector. This province plays a vital role in agriculture due to its flat terrain and fertile soil, which are convenient for mechanized farming. It is also the leading grain-producing province in the country and plays an essential role in realizing the “rise of central China”. Consequently, Hubei is very important for the national economy and people’s livelihoods [50]. This province, however, faces numerous uncertainties and challenges, such as rural-to-urban migration, old-age labor for agricultural production, land, and a rural labor shortage. As the Chinese Government launched agricultural services, it is an urgent matter to comprehensively promote rural revitalization and modern agricultural development in the province. These are factors that affect the development of modern agriculture in the province. Agricultural socialized services provide a healthy way to associate small farmers with agricultural modernization in this province. Another reason for selecting this province was that plastic film is used in the region to achieve better production under weather uncertainties. Hence, in this work, we analyzed the impact of the socialized service level on agricultural productivity in Hubei, as this province is crucial for the agricultural sector in terms of food security and socialized service mechanisms applied by small farmers.
The study was divided into four parts. In the first section, the entropy method was used to measure the socialized agricultural service level. Previous research categorized socialized agricultural services into seven categories and analyzed 24 specific variables. In the second part, the data envelopment analysis (DEA) model was applied to measure agricultural production, as well as technical and scale efficiencies. In the third part, grey correlation analysis was used to evaluate the linkages between the single service level and agricultural production efficiency, and in the fourth part, factors were used to determine production efficiency.

2.2. Model Setting

2.2.1. Measurement of Socialized Agricultural Services and Data

Various researchers have adopted different classification methods of socialized agricultural services. For instance, Wenhui [62] divided socialized agricultural services into six types according to farmers’ needs; this study analyzed the supply of agricultural materials, machinery, technology, processes, information, and financial insurance. Moreover, Lu et al. [49] examined animal and plant disease prevention and control services, quality supervision, and agricultural product circulation services. The authors linked three dimensions of service content with industry. Similarly, another study divided socialized services into three categories, namely, public welfare, quasi-public welfare, and operational services, and then subdivided these three categories into 12 services [52].
Hence, to elaborate on the existing literature, the present study categorized socialized agricultural services into the seven following themes: (i) agricultural materials, (ii) financial and insurance, (iii) science and technology, (iv) information, (v) mechanization, (vi) infrastructure, and (vii) social public service levels. Several variables were selected for each category, and data were obtained from the Hubei Statistical Yearbook and Hubei Rural Statistical Yearbook from 2009 to 2020. After selecting the index, we used the entropy method [49,52,63,64] to measure the agricultural socialized service level.
Entropy is a mathematical approach that is used to analyze the probabilities for given outcomes of variables. The method is widely used in impact assessments of interventions involving temporal as well as interval-based actions [65,66]. The entropy method is considered a highly powerful tool in cross-efficiency evaluation for a range of options involving a set of decision-making units [67]. However, the use of the entropy method in conjunction with Data Envelopment Analysis (DEA) is justified due to the latter’s shortcoming of total weight flexibility, which can treat many decision-making units (DMUs) as DEA-efficient, thereby failing to discriminate whether all are deemed efficient or otherwise [40]. In fact, optimal weights yielding from a DEA model are often arbitrary, although depending on the data, compelling to generate cross-efficiency scores [68]. To address such discrepancy and to solve the problem, Doyle and Green [69] proposed a set of different secondary models that can be divided into benevolent and aggressive formulations, representing two opposite strategies diametrically. The idea behind these two models is to identify optimal weights that not only maximise the efficiency of the DMU under consideration but also maximise or minimize the average efficiency of other DMUs. In a similar vein, Liang et al. [70,71] offered different secondary objective functions to extend both (aggressive and benevolent) models, whereby each secondary objective function represents an efficiency evaluation method. Using these models, one can obtain and compare the efficiency scores from multiple/different perspectives. Hence, in our study, the entropy method was used to calculate the dispersion degree of an index along with the DEA method to complement findings and obtain better insights. Under the entropy method, the greater the degree of dispersion, the more significant the impact of the index on the comprehensive assessment. In this study, first, n samples and m indicators were chosen, where X i j denotes the index and i is the value of jth sample (decision unit). Second, we described the variables, i.e., the homogenization of heterogeneous variables. The measurement units of the various indexes are not unified in our study but must be standardized before use in comprehensive calculations. Moreover, the absolute value of the index should be transformed into a relative value to become X i j = | X i j | . Hence,
X i j = X i j min ( x 1 j , x 2 j , x n j ) max ( x 1 j , x 1 j , x 2 j , x n j ) min ( x 1 j , x 2 j , x n j ) + 0.01 ,
where i = 1 ,   2 ,   3 ,   , n and j = 1 ,   2 ,   3 , , m .
X i j = min ( x 1 j , x 2 j , x n j ) x i j max ( x 1 j , x 1 j , x 2 j , x n j ) min ( x 1 j , x 2 j , x n j ) + 0.01
where i = 1 ,   2 ,   3 ,   , n and j = 1 ,   2 ,   3 , ,   m , and the proportion of sample i under index j is given by p i j
p i j = x i j i = 1 n x i j ,   where   i = 1 ,   2 ,   3 ,   , n   and   j = 1 ,   2 ,   3 , ,   m .
The entropy of index j is e j
e j = k i = 1 n p i j ln ( p i j ) ,   where   k = 1 / ln ( n ) ,   and   e j     0 .
Information entropy redundancy is
d j = 1 e j ,   where i = 1 ,   2 ,   3 ,   , n   and   j = 1 ,   2 ,   3 , ,   m .
The weight of each index is
w i j = d j j = 1 m d j ,   where   i = 1 ,   2 ,   3 ,   , n   and   j = 1 ,   2 ,   3 , ,   m .
The comprehensive score of various services is given by s i as follows
s i = j = 1 m w j · p i j ,   i = 1 ,   2 ,   3 ,   , n   and   j = 1 ,   2 ,   3 , , m .
Table 1 outlines the factors and variables used for the investigations in this study, and explanations are given for each factor/variable, where i denotes the index layer represented by x1, x2, x3, …, x24 in the second column of the table, and j denotes the criterion layer represented by c1, c2, …. c7, as shown in the first column of Table 1. This table presents the criterion layer, index layer, and units in the columns.

2.2.2. Measurement of Agricultural Production Efficiency

The data envelopment analysis (DEA) model evaluates multiple decision-making units (DMUs) with multiple inputs and outputs. The use of the DEA method has been widely cited for a range of efficiency-related studies due to its advantage of benchmarking the efficiency measure, although with some discrepancies of treating all DMUs as efficient and as falling within the cut-point values, although they may not be [40,72,73]. The study uses a combination of both entropy and DEA methods to evade any sort of misspecification. Hence, this study constructed a DEA model to estimate the agricultural production efficiency, where two aspect variables, i.e., input and output, were used, along with two models. The BCC model measures the technical and scale efficiency of decision-making units under the condition of variable scale compensation. The CCR model measures the production efficiency of the decision-making unit under the condition of a constant return to scale. Agricultural production efficiency is the proportion of the actual output and target output under the condition of a certain amount of input. By taking land, workforce, and capital as input variables, the specific input variables were the sowing area of crops (in 1000 hectares), agricultural employees (in 10,000 people), the amount of applied chemical fertilizer (in 10,000 tons), the amount of pesticides used (in 10,000 tons), the amount of agricultural plastic film used (in 10,000 tons), and the total power of the agricultural machinery (in 10,000 kW). The agricultural output value was taken as the output index (in CNY 100 million).
The model settings under the DEA were as follows:
min θ θ
min   [ θ v Σ S + S ]
s . t   { j = 1 k γ j x j + S = θ v X 0 j = 1 k γ j x j S + = Y 0 j = 1 k γ j = 1
where γ j 0 , j = 1 ,   2 , ,   k and S + 0 ; S 0 . where θ represents/measures the DMU efficiency; x j and y j denote the input and output of the jth DMU, respectively; γ j denotes the weight of the DMU; S+ and S are the degrees of freedom. X0 and Y0 represent the projection of the decision-making unit corresponding to the relative efficiency surface of DEA.
If θ < 1, then the DMU is inefficient; if θ = 1, and S+ or S is not equal to 0, the DMU is weakly effective; if θ = 1, and both S+ and S are equal to 0, the DMU is effective.

2.2.3. Correlation between Agricultural Production Services and Production Efficiency

The grey correlation degree model was applied to estimate the correlation between single services and agricultural production efficiency [74]. Grey correlation analysis requires the selection of reference and comparison sequences. This study used materials, information, mechanization, science and technology, infrastructure, social capital, and financial insurance services regarding agriculture as the comparison sequence. The agricultural production efficiency, technology, and scale efficiencies were used as the reference sequence. The specific operational steps were as follows:
Set sequence expression: x i = { x i ( k ) | i = 1 ,   2 , ,   10 ,   k = 1 ,   2 , ,   12 } and dimensionless x i = x i ( k ) min x i ( k ) max x i ( k ) min x i ( k ) , i = 1, 2,   ,   10 .
To find the maximum (M) and minimum (m) sequence differences, we used the following equations:
Δ i ( k ) = | x i m ( k ) x i n ( k ) | ,   ( i m = 8 , 9 , 10 ; i n = 1 , 2 , , 7 ) .
Next, we calculated the correlation coefficient and correlation degree. The correlation degree is explained as follows:
δ i ( k ) = m + ρ M Δ i ( k ) + ρ M , which is the arithmetic mean of the correlation coefficient. Here, ρ is the determinant of the coefficient, where the ρ value is generally taken as 0.5. When the correlation coefficient is more significant than 0.6, the correlation is considered significant.

2.2.4. Regression Model

A regression technique is used to analyze the impact of the independent variable(s) on the dependent variable. In this study, the ordinary least squares (OLS) regression model was applied to analyze the impact of criterion layers on the output to achieve the objective here, and we developed the following three models:
A P t = α 0 i n f t + α 1 s c i t + u t + ε t  
A P t = β 0 i n f t + β 1 m a t t + β 1 s c i t + u t + ε t  
A P t = γ 0 m e c t + γ 1 p u b t + γ 1 s c i t + u t + ε t  
where A P t is agricultural production efficiency, i n f t represents agricultural infrastructure, m a t t denotes agricultural materials, s c i t denotes science and technology services, m e c t represents agricultural mechanisms, and p u b t denotes social and public services. α, β, and γ are parameters to be estimated; ε is the random error term; and u is the random fixed effect.

3. Model Results and Analysis

3.1. Analysis of the Agricultural Socialized Service Level

The results for the overall and individual service levels of agricultural socialization from 2008 to 2019 are shown in Table 2. Figure 2 illustrates the changing trends for the total service and sub-service levels of agricultural socialization. The results revealed that the overall service level of agricultural socialization in Hubei province experienced an upward trend from 2008 to 2019. This value increased by 244%, i.e., from 0.2668 in 2008 to 0.9189 in 2019. From the perspective of individual agricultural service levels in the agricultural socialized service system, over the last 12 years, the agricultural information, mechanization, infrastructure, social public, and finance and insurance service levels experienced an increasing trend. In contrast, the agricultural mechanization and agricultural science and technology service levels first experienced an increasing trend and then a decreasing trend.
The trends shown in Figure 2 can be attributed to the following reasons. First, these results were due to the subsidy policy for purchasing agricultural machines and tools and the comprehensive promotion of agricultural mechanization. Previous studies found that agricultural machinery services played a prominent and positive role in improving agricultural production efficiency [42,47,48,49,50,51,52,53,54,55,56,57,58,59,60,61,62,63,64,65,66,67,68,69,70,71,72,73,74,75], thereby increasing farmers’ income and promoting rural revitalization. Second, agriculture is the primary sector that impacts the stability of the country’s national economy. In recent years, the state has rectified and built a financial market system and guided funds for investing in agricultural infrastructure. Third, the technical level of agricultural production in Hubei province is high, and the government is paying increasingly more attention to agricultural production. However, the service levels of farming materials and agricultural science and technology trends were found to decline, possibly due to the influence of national policies. For instance, there remains a weak diffusion rate of research results between scientific researchers and farmers because farmers are more willing to believe their own practical experience, which hinders the process of agricultural modernization in the country to a certain extent.

3.2. Analysis of Agricultural Production Efficiency

The results for agricultural production efficiency are provided in Table 3. The results revealed that agricultural production efficiency experienced an upward trend, where the value increased from 0.703 in 2008 to 1.000 in 2019. We found that technical efficiency remained at a high level, despite a slight changing trend. This result showed that the technical level of agriculture in the Hubei province was relatively mature. Moreover, the agricultural science and technology extension mechanism was relatively strong, and the technology renewal speed was fast.
Similarly, the scale efficiency also revealed an increasing trend over time. The results indicated increasing returns to scale during the 12 years under analysis. Thus, Hubei may benefit from the promotion of agricultural mechanization and the support of land-transfer policies, which may gradually reduce the degree of fragmentation at an agricultural-land scale. The rising trend of scale and technical efficiencies was found to be almost without deviation. Therefore, the growth of scale efficiency was found to be the main reason for the observed improvements in agricultural production efficiency.

3.3. Grey Correlation Analysis of Socialized Agriculture Service and Production Efficiency

The service levels of agricultural socialization are taken here as a comparison sequence, while agricultural production and technical and scale efficiencies are the reference sequence. The correlation degree between each service level and efficiency was obtained by applying the calculation steps of the grey correlation model, as illustrated in Table 4. The results demonstrated that the correlation value between each agricultural service and agricultural production efficiency remained at around 0.85, which is greater than 0.6. This result showed that the correlation between every single service and agricultural production efficiency was vital. Among those, agricultural science and technology, agricultural materials, and financial insurance service levels were closely related to agricultural production efficiency and agricultural scale efficiency.
In contrast, agricultural information service was ranked last, indicating that science and technology played an essential role in the process of agricultural modernization. Regardless of whether the application of agricultural scientific research achievements or an increase in agricultural science and technology personnel can drive the core strength of agriculture, such advancements can help farmers plant their crops scientifically and better understand the laws of production to improve the efficiency of their agricultural output. In addition, the results revealed that agricultural material services were the most fundamental source of production. Perfect agricultural material services can provide good external conditions for agricultural production. Moreover, agricultural financial and insurance services offer substantial financial support to farmers and guarantee agricultural production. Thus, farmers are encouraged to produce more and are guaranteed to expand their planting scale, in addition to reducing planting costs and improving farmers’ enthusiasm for agricultural production.
In addition, the ranking of the correlation degree between individual services and agricultural technical efficiency indicated significant changes. In the ranking of the correlation degree, the top three factors were financial and insurance, agricultural infrastructure, and agricultural information service levels, while the social public service level was ranked last. Furthermore, financial and insurance services provided farmers with resources and funds and encouraged them to improve their production technology. While infrastructure services laid a good foundation for agricultural production, agricultural information services can provide better information to help farmers integrate their resources and improve their technical levels.

3.4. Regression Results

To determine the relationship between agricultural socialization services and agricultural production efficiency more accurately and to avoid multicollinearity, variables with high correlation were removed. We then constructed three models (see Table 5). The results revealed that agricultural infrastructure services, financial insurance services, and agricultural mechanization levels have a significantly positive impact on agricultural production efficiency. First, agricultural infrastructure provided convenient conditions for agricultural production. The construction and improvement of infrastructure, such as irrigation and water conservancy, the circulation of agricultural products, and the extension of agricultural technology, played positive roles in improving agricultural production efficiency and promoting the sustainable development of agriculture. Second, agricultural finance and insurance services provided strong financial support and agricultural guarantees to help farmers carry out agricultural production, accelerate the promotion of provincial financial subsidy projects, rationally use central and provincial financial funds, and place equal emphasis on project management and fund management. In this way, farmers were more willing to produce due to assured production. Third, agricultural mechanization was of strategic significance to promoting the construction of modern agriculture and the new socialist countryside. With agricultural machinery as the carrier, China has promoted the application of new technologies, such as deep tillage and deep sowing, the deep application of chemical fertilizers, water-saving irrigation, and precision sowing, thereby surpassing the limits of productivity beyond natural human and animal forces, improving agricultural production conditions, and raising production efficiency.

4. Discussion

This study calculated production technology and scale efficiency and explored the impact of socialized services on production efficiency, as well as the correlation between these factors. Determinants of production efficiency were also analyzed. This study found that, in general, the service level of agricultural socialization from 2008 to 2019 experienced a growing trend, and the continuous improvement of agricultural socialization services had a catalytic effect on improving the efficiency of agricultural production. Previous studies explored the impact of the development of productive agricultural services in various regions of China in terms of improvements in agricultural total factor productivity. These services were also shown to have a positive spatial spillover effect, which supports the present study’s results [45,76]. For instance, Ref. [48] demonstrated that agricultural machinery services represent an important way to enhance agricultural production, while subsidies for purchasing agricultural machinery can improve agricultural mechanization. Another study determined that machinery has a positive impact on production [77]. Li and Liu [42] further analyzed production efficiency using the DEA model, determining that the ratio of net profit would enhance production efficiency in the agriculture sector. Ma et al. [78] reported that the production efficiency in the southwestern regions is very low, while that in the eastern plain area of China is high.
In contrast, another study showed that different socialized service models have significant differences in agricultural technical efficiency. The vertical collaboration model of socialized service organizations was found to reduce farmers’ profitability, with no increases observed in farmers’ income [45]. In addition, the results showed that agricultural informatization, mechanization, infrastructure, social public, and agricultural financial insurance service levels experienced an upward trend. A previous study showed that the correlation between the household head’s characteristics and low-income cities has a positive and increasing trend in agricultural production [76]. Another study determined that infrastructure has a significantly positive effect on production efficiency [42]. In contrast, agricultural mechanization, financial insurance, and infrastructure service levels showed a rapid downward trend. In earlier research, scholars explored how different socioeconomic factors affect production efficiency in the agricultural sector. For instance, it was demonstrated that the infrastructure and subsidies provided by the government to service providers are significantly positive in African countries [78]. The presence of smaller farms and further division of farm sizes under new generations of households were also found to negatively impact the agriculture sector’s mechanisms [79]. Moreover, according to the FAO, better allocations and policies will yield the highest possible output in terms of financial services [24].
The results of this study revealed that improving agricultural production by utilizing socialized services in the agriculture sector played a significant role in enhancing farmers’ output, improving the quality of agricultural products, increasing income, and ultimately improving the living standards of farmers. The previous literature supports our study results. For instance, ref. [39] noted that socialized services have a positive effect on increasing farmers’ income and, at the same time, are conducive to increasing the number of agricultural machines and the level of agricultural mechanization [40], thereby realizing the effectiveness of small farmers and modern agriculture convergence.
The results showed that production efficiency experienced an increasing trend, indicating that technical efficiency in the study area matured. Although labor migration trends were found to be higher in Hubei province, due to socialized services, production efficiency increased. Previous literature has shown that regions experiencing labor migration to urban areas are less efficient in agricultural production [77,80,81]. Moreover, Li et al. calculated production efficiency using the DEA model and determined that there is a difference in production efficiency in the western and eastern parts of China [82].
This model will help to improve the country’s economy, enhance the adoption of new technology, and modernize the agriculture sector. The results of this study showed that socialized agricultural services played a pivotal role in agricultural production. A previous study demonstrated that mechanical resources could enhance agricultural efficiency among Chinese farmers [42]. It was also found that machinery services and maintenance have a significant positive impact, which supports our study. In addition, ref. [47] found that the over-usage of machines is more common than labor, particularly on small farms. The authors also observed allocative efficiency among rice farmers in China. Another study revealed that machinery usage has a significantly positive impact on efficiency among Pakistani rice farmers [77].

5. Conclusions, Policy Recommendations, and Limitations

5.1. Conclusions

This study used time-series data from 2008 to 2019 obtained from the Hubei Statistical Yearbook and Hubei Rural Statistical Yearbook. We analyzed the socialized and individual agricultural service level impacts on agricultural production. The production, technical, and scale efficiencies were also calculated, and the correlation between socialized agricultural services and agricultural production efficiency was analyzed. The correlation between technical and scale efficiencies was also analyzed and recorded. The regression model was also applied to the determinants of agricultural production. The results demonstrated that the service level of agricultural socialization continuously improved from 2008 to 2019. Moreover, we found that agricultural mechanization and finance and insurance service levels among single service levels, increased rapidly. The agricultural production and scale efficiencies increased over time, and the growth rate was found to be largely consistent. The continuous increase in scale efficiency was due to an increase in agricultural production efficiency.
Furthermore, agricultural technical efficiency maintained a high level over the 12 years analyzed. The highest degree of correlation with agricultural production and scale efficiency was found for science and technology, materials, and financial insurance service levels. Financial insurance services had the highest degree of correlation with technical efficiency in agriculture. The appropriate large-scale development of land scale can improve agricultural production efficiency and, at the same time, stimulate demand for socialized agricultural services. Financial, insurance, agricultural science and technology services were found to be closely related to agricultural production efficiency, but the level of correlation between the two categories showed a downward trend. According to the regression results, agricultural infrastructure, financial insurance, and agricultural mechanization service levels had a positively significant impact on production efficiency.
The work also makes significant contributions on the theoretical front using the perspective of community-based services and their role in the productivity of agriculture. It is evident from the findings that provision of farm services would theoretically equip farm households with a leverage to aim for added investment in the farm of non-service inputs such as seed, fertilizer and chemicals that would indirectly mediate the increase in productive efficiency of the farmers participating in the program. The socialized services are deemed to theoretically improve economies of scale as well as can lead to demonstration effect on those who are not part of such programs. On international front, many developing countries as well as developed one can benefit from the findings of this study to focus of provision of such services instead of concentrating the direct payment of subsidies. The study confirms that there is a potential benefit by participating in the commonly provided farm-based services—at least farm machinery—instead of completely relying on outsourced or rented services. Agricultural socialized services (ASS) have progressed at a fair pace in most parts of China, for which, the findings of this study provide valuable insights for international benchmarking on such moves. However, there are potential options for the piloting of ASS in many African and South Asian countries chiefly dependent on arable agriculture and often constrained by availability and affordability issues linked with farm services, particularly farm-related machinery.

5.2. Policy Recommendations

Considering the study results, the following policies are recommended.
Agricultural financial and insurance services should be improved and strengthened and credit support should be increased for agricultural development. Stakeholders and policymakers should devote their full attention to the leading role played by large national and commercial banks in supporting the agriculture sector. For instance, the number of bank outlets in township areas should be increased, and the quality of services should be improved. In addition, the interest rates of agricultural loans should be reduced, the small agricultural loan system should be improved, and farmers should be encouraged to obtain good credit services. Moreover, agricultural insurance needs to be publicized and its types should be increased to reduce risk in agricultural production.
Moreover, the transformation of agricultural scientific and technological achievements should be accelerated, and a cooperative scientific research system should be established between farmers and academia to create a professional agricultural development model. These provisions will help to enhance agricultural production through the application of agricultural scientific research achievements and promote the process of agricultural modernization. Ultimately, the agricultural socialized service industry is a knowledge-intensive industry that required high-quality and highly skilled professionals to provide complete services to farmers and improve production efficiency.
Policymakers and stakeholders should promote an appropriate scale of rural land and encourage innovative land transfer. As urbanization continues to accelerate, resulting in land wastage, a land transfer policy should also be developed. Large-scale rural land could help stimulate farmers’ demands for socialized agricultural services and promote continuous improvement in the sector. At the same time, these measures would reduce farmers’ production costs, improve scale and production efficiency, and alleviate the problems caused by the reduction in the rural population.
This study provides insight into the socialized mechanisms in use among farmers in China and the impacts of these mechanisms on agricultural output efficiency. Although each country has its policies and resources, the findings of the present study may help other countries and regions to adopt this system and similar models. These results and policy recommendations may be especially helpful for other countries that have small farming systems and high urban migration rates.

5.3. Limitations

Although this study covered different aspects of the topic, the following limitations remain. This study did not consider data on precipitation, which is important for production in terms of environmental impacts. Moreover, agricultural plastic film and subsidy policies for agriculture variables were not calculated in this analysis; therefore, future research should consider these variables. Furthermore, household socio-economic variables, such as the number of households, education, and dependent children, were unaccounted for. Thus, future studies should consider integrating a primary survey with the present study’s factors to more deeply understand aspects that influence production efficiency.

Author Contributions

Conceptualization, T.C. and M.R.; methodology, T.C. and M.R.; software, T.C.; validation, A.A. and M.R.; formal analysis, T.C.; investigation, T.C.; resources, M.R. and T.C.; data curation, A.A.; writing—original draft preparation, T.C.; writing—review and editing, M.R. and A.A.; visualization, A.A.; supervision, M.R.; funding acquisition, T.C. All authors have read and agreed to the published version of the manuscript.

Funding

This research was supported by Hubei Provincial Government Project Nos. HBZZ-2018-18 and HBZZ-2019-10, as well as the Doctor Initiative Fund, Yangtze University.

Institutional Review Board Statement

Not applicable.

Informed Consent Statement

Informed consent was obtained from all subjects involved in the study.

Data Availability Statement

Data will be available from the first author on demand.

Acknowledgments

We appreciate the four anonymous reviewers of this journal for their valuable comments to improve this study. We are also thankful to Gama Rivas Dahro for helping with managing the publishing process according to the journal requirements and instructions.

Conflicts of Interest

The authors declare no conflict of interest.

References

  1. Liu, Y.; Zhou, Y.; Li, Y. Rural regional system and rural revitalization strategy in China. Acta Geogr. Sin. 2019, 74, 2511–2528. [Google Scholar]
  2. Liu, Y. Research on the geography of rural revitalization in the new era. Geogr. Res. 2019, 38, 461–466. [Google Scholar]
  3. Liu, Y.; Li, Y. Revitalize the world’s countryside. Nature 2017, 548, 275–277. [Google Scholar] [CrossRef]
  4. Nelson, P.B. Rural restructuring in the AmericanWest: Land use, family and class discourses. J. Rural Stud. 2001, 17, 395–407. [Google Scholar] [CrossRef]
  5. Holmes, J. Impulses towards a multifunctional transition in rural Australia: Gaps in the research agenda. J. Rural Stud. 2006, 22, 142–160. [Google Scholar] [CrossRef]
  6. Wilson, O.J. Rural restructuring and agriculture-rural economy linkages: A New Zealand study. J. Rural Stud. 1995, 11, 417–431. [Google Scholar] [CrossRef]
  7. Lobley, M.; Potter, C. Agricultural change and restructuring: Recent evidence from a survey of agricultural households in England. J. Rural Stud. 2004, 20, 499–510. [Google Scholar] [CrossRef]
  8. Bañski, J.; Stola, W. Transformation of the spatial and functional structure of rural areas in Poland. J. Rural Stud. 2002, 3, 13. [Google Scholar]
  9. Liu, Y. Introduction to land use and rural sustainability in China. Land Use Policy 2018, 74, 1–4. [Google Scholar] [CrossRef]
  10. Long, H. Land consolidation and rural spatial restructuring. Acta Geogr. Sin. 2013, 68, 1019–1028. [Google Scholar]
  11. FAO. Food and Agricultural Organisation, Data Base Results; Retrieved June; FAO: Rome, Italy, 2015. [Google Scholar]
  12. Dolgonosov, B.M. Knowledge production and world population dynamics. Technol. Forecast. Soc. Chang. 2016, 103, 127–141. [Google Scholar] [CrossRef]
  13. Foley, J.A.; DeFries, R.; Asner, G.P.; Barford, C.; Bonan, G.; Carpenter, S.R.; Chapin, F.S.; Coe, M.T.; Daily, G.C.; Gibbs, H.K.; et al. Global consequences of land use. Science 2005, 309, 570–574. [Google Scholar] [CrossRef] [PubMed] [Green Version]
  14. Guerra, C.A.; Metzger, M.J.; Maes, J.; Pinto-Correia, T. Policy impacts on regulating ecosystem services: Looking at the implications of 60 years of landscape change on soil erosion prevention in a Mediterranean silvo-pastoral system. Landsc. Ecol. 2016, 31, 271–290. [Google Scholar] [CrossRef]
  15. Li, P.; Wu, J.; Qian, H. Regulation of secondary soil salinization in semi-arid regions: A simulation research in the Nanshantaizi area along the Silk Road, northwest China. Environ. Earth Sci. 2016, 75, 1–12. [Google Scholar] [CrossRef]
  16. Saina, K.; Murgor, K.; Murgor, C. Climate change and food security. In Environmental Change and Sustainability, 1st ed.; Silvern, S., Young, S., Eds.; InTechOpen: London, UK, 2013; pp. 235–257. [Google Scholar]
  17. Prosdocimi, M.; Burguet, M.; Di Prima, S.; Sofia, G.; Terol, E.; Comino, J.R.; Cerdà, A.; Tarolli, P. Rainfall simulation and Structure-from-Motion photogrammetry for the analysis of soil water erosion in Mediterranean vineyards. Sci. Total Environ. 2017, 574, 204–215. [Google Scholar] [CrossRef] [Green Version]
  18. Yang, F.; An, F.; Ma, H.; Wang, Z.; Zhou, X.; Liu, Z. Variations on soil salinity and sodicity and its driving factors analysis under microtopography in different hydrological conditions. Water 2016, 8, 227. [Google Scholar] [CrossRef] [Green Version]
  19. Amjath-Babu, T.S.; Krupnik, T.J.; Aravindakshan, S.; Arshad, M.; Kaechele, H. Climate change and indicators of probable shifts in the consumption portfolios of dryland farmers in Sub-Saharan Africa: Implications for policy. Ecol. Indic. 2016, 67, 830–838. [Google Scholar] [CrossRef]
  20. Graveline, N. Economic calibrated models for water allocation in agricultural production: A review. Environ. Model. Softw. 2016, 81, 12–25. [Google Scholar] [CrossRef]
  21. Grundy, M.J.; Bryan, B.A.; Nolan, M.; Battaglia, M.; Hatfield-Dodds, S.; Connor, J.D.; Keating, B.A. Scenarios for Australian agricultural production and land use to 2050. Agric. Syst. 2016, 142, 70–83. [Google Scholar] [CrossRef]
  22. Zhang, Q.; Sun, Z.; Wu, F.; Deng, X. Understanding rural restructuring in China: The impact of changes in labor and capital productivity on domestic agricultural production and trade. J. Rural. Stud. 2016, 47, 552–562. [Google Scholar] [CrossRef]
  23. United Nations Industrial Development Organization. Agricultural Mechanization in Africa … Time for Action: Planning Investment for Enhanced Agricultural Productivity; Food and Agriculture Organization of the United Nationsrome: Rome, Italy, 2008. [Google Scholar]
  24. FAO. Agricultural Mechanization in Mali and Ghana: Strategies, Experiences and Lessons for Sustained Impacts; FAO: Rome, Italy, 2010. [Google Scholar]
  25. Manta, I.H.; Aduba, J.J. Mechanization practice: A tool for agricultural development in nigeria: A case study of Ifelodun local government area of Kwara State. Int. J. Basic Appl. Sci. 2013, 2, 98–106. [Google Scholar]
  26. Akinbamowo, R.O. A review of government policy on agricultural mechanization in Nigeria. J. Agric. Ext. Rural. Dev. 2013, 5, 146–153. [Google Scholar] [CrossRef]
  27. Mrema, G.; Soni, P.; Rolle, R.S. A Regional Strategy for Sustainable Agricultural Mechanization: Sustainable Mechanization across Agri-Food Chains in Asia and the Pacific Region; RAP Publication: Bangkok, Thailand, 2014. [Google Scholar]
  28. Schmitz, A.; Moss, C. Mechanized agriculture: Machine adoption, farm size, and labor displacement. AgBioForum 2015, 18, 278–296. [Google Scholar]
  29. Ma, L.; Long, H.; Zhang, Y.; Tu, S.; Ge, D.; Tu, X. Agricultural labor changes and agricultural economic development in China and their implications for rural vitalization. J. Geogr. Sci. 2019, 29, 163–179. [Google Scholar] [CrossRef] [Green Version]
  30. Yu, J.; Wu, J. The Sustainability of Agricultural Development in China: The Agriculture–Environment Nexus. Sustainability 2018, 10, 1776. [Google Scholar] [CrossRef] [Green Version]
  31. Li, Y.; Zhang, W.; Ma, L.; Wu, L.; Shen, J.; Davies, W.J.; Oenema, O.; Zhang, F.; Dou, Z. An analysis of China’s grain production: Looking back and looking forward. Food Energy Secur. 2014, 3, 19–32. [Google Scholar] [CrossRef]
  32. Adekola, K.A.; Alabadan, B.A. China Agricultural Mechanization Development Experience for Developing Countries. J. Agric. Innov. Res. 2014, 3, 654–658. [Google Scholar]
  33. Chen, W. Challenges and Opportunities for Chinese Agriculture the Environmentz: Feeding Many While Protecting Environment; Palgrave Macmillan: New York, NY, USA, 2020; ISBN 9789811535352. [Google Scholar]
  34. Di Iacovo, F.; O’Connor, D. Supporting Policies for Social Farming in Europe. Progressing Multifunctionality in Responsive Rural Areas; ARSIA: Firenze, Italy, 2009. [Google Scholar]
  35. Renting, H.; Rossing, W.A.H.; Groot, J.C.J.; Van der Ploeg, J.D.; Laurent, C.; Perraud, D.; Stobbelaar, D.J.; Van Ittersum, M.K. Exploring multifunctional agriculture. A review of conceptual approaches and prospects for an integrative transitional framework. J. Environ. Manag. 2009, 90, S112–S123. [Google Scholar] [CrossRef] [PubMed]
  36. Van Huylenbroeck, G.; Vandermeulen, V.; Mettepenningen, E.; Verspecht, A. Multifunctionality of agriculture: A review of definitions, evidence and instruments. Living Rev. Landsc. Res. 2007, 1, 1–43. [Google Scholar] [CrossRef]
  37. Geng, S.; Ren, T.; Wang, M. Technology and Infrastructure Considerations for E-Commerce in Chinese Agriculture. Agric. Sci. China 2007, 6, 1–10. [Google Scholar] [CrossRef]
  38. Wang, S.J.; Ma, J.K.; Li, N. How does the scale of farmland management affect farmers’ choice of agricultural mechanization? Rural Econ. 2021, 4, 111–118. [Google Scholar]
  39. Zhou, X.; Ma, W.; Li, G.; Qiu, H. Farm machinery use and maize yields in China: An analysis accounting for selection bias and heterogeneity. Aust. J. Agric. Resour. Econ. 2020, 64, 1282–1307. [Google Scholar] [CrossRef]
  40. Wang, Y.M.; Chin, K.S.; Jiang, P. Weight determination in the cross-efficiency evaluation. Comput. Ind. Eng. 2011, 61, 497–502. [Google Scholar] [CrossRef]
  41. Postner, H.H. Factor Content of Canadian International Trade: An Input-Output Analysis. J. Int. Econ. 1977, 2, 209–211. [Google Scholar]
  42. Li, Z.; Liu, X. The Effects of Rural Infrastructure Development on Agricultural Production Technical Efficiency: Evidence from the Data of Second National Agricultural Census of China. Technology 2009, 2009, 1–19. [Google Scholar] [CrossRef]
  43. Shuqi, S.; Jiasheng, W.; Dongwei, W. Development of Agricultural Mechanization in China and Its Current Strategic Focus. Agric. Mach. Technol. 2019, 13, 4–7. [Google Scholar] [CrossRef]
  44. Ming, H. Study on the synergistic development effect of producer services and agriculture in China. Agric. Econ. Issues 2013, 34, 25–30+110. [Google Scholar]
  45. Zhang, K. Grey correlation analysis of agricultural socialized service and agricultural production efficiency—Taking Xinjiang as an example. Pract. Underst. Math. 2021, 51, 52–62. [Google Scholar]
  46. Ji, Y.; Wang, X.; Lu, W. Characteristics of agricultural labor force, land fragmentation and socialized service of agricultural machinery. Res. Agric. Mod. 2016, 37, 910–916. [Google Scholar]
  47. Shi, M.; Paudel, K.P.; Chen, F. Mechanization and efficiency in rice production in China. J. Integr. Agric. 2021, 20, 1996–2008. [Google Scholar] [CrossRef]
  48. Yang, Z.; Zhang, J.Z.P. Can agricultural socialized services promote small farmers to connect with agricultural modernization—from the perspective of technical efficiency. Agric. Technol. Econ. 2019, 6, 16–26. [Google Scholar]
  49. Hua, L.; Hao, H.G.X. Impact of agricultural socialized service on agricultural technical efficiency. J. Cent. South Univ. Econ. Law 2020, 69, 159–160. [Google Scholar]
  50. Zhang, D.; Wang, H.; Lou, S.; Zhong, S. Research on grain production efficiency in China’s main grain producing areas from the perspective of financial support. PLoS ONE 2021, 16, e0247610. [Google Scholar] [CrossRef] [PubMed]
  51. Qian, L.; Xiao, R.Y.G. Evaluation of agricultural production efficiency in Anhui Province Based on DEA model. Ind. Technol. Econ. 2010, 29, 121–126. [Google Scholar]
  52. Zhong, L.; Jinjie, T.; Shubin, Z.K.X. Measurement of agricultural socialized service level and Deconstruction of restrictive factors in Jiangxi Province. Guangdong Agric. Sci. 2014, 41, 199–204. [Google Scholar]
  53. Qain, L.; Lu, H.; Gao, Q.; Lu, H. Household-owned farm machinery vs. outsourced machinery services: The impact of agricultural mechanization on the land leasing behavior of relatively large-scale farmers in China. Land Use Policy 2022, 115, 106008. [Google Scholar] [CrossRef]
  54. Chen, Q.; Hu, R.; Sun, Y.; Zhang, C. How Does Rural–Urban Migration Experience Affect Arable Land Use? Evidence from 2293 Farmers in China. Land 2020, 9, 400. [Google Scholar] [CrossRef]
  55. Cai, B.; Shi, F.; Huang, Y.; Abatechanie, M. The Impact of Agricultural Socialized Services to Promote the Farmland Scale Management Behavior of Smallholder Farmers: Empirical Evidence from the Rice-Growing Region of Southern China. Sustainability 2022, 14, 316. [Google Scholar] [CrossRef]
  56. Paudel, G.P.; Kc, D.B.; Khanal, N.P.; Justice, S.E.; McDonald, A.J. Smallholder farmers’ willingness to pay for scale-appropriate farm mechanization: Evidence from the mid-hills of Nepal. Technol. Soc. 2019, 59, 101196. [Google Scholar] [CrossRef] [PubMed]
  57. Zheng, H.; Ma, W.; Guo, Y.; Zhou, X. Interactive relationship between non-farm employment and mechanization service expenditure in rural China. China Agric. Econ. Rev. 2021. [Google Scholar] [CrossRef]
  58. Belton, B.; Win, M.T.; Zhang, X.; Filipski, M. The rapid rise of agricultural mechanization in Myanmar. Food Policy 2021, 101, 102095. [Google Scholar] [CrossRef]
  59. Qiu, T.; Luo, B. Do small farms prefer agricultural mechanization services? Evidence from wheat production in China. Appl. Econ. 2021, 53, 2962–2973. [Google Scholar] [CrossRef]
  60. De Brauw, A.; Mueller, V.; Lee, H.L. The Role of Rural-Urban Migration in the Structural Transformation of Sub-Saharan Africa. World Dev. 2014, 63, 33–42. [Google Scholar] [CrossRef]
  61. Hazell, P.; Poulton, C.; Wiggins, S.; Dorward, A. The Future of Small Farms: Trajectories and Policy Priorities. World Dev. 2010, 38, 1349–1361. [Google Scholar] [CrossRef]
  62. Wenhui, Z. Study on the impact of agricultural socialized services on agricultural industrial structure in Shandong Province. Shandong Univ. Technol. 2020, 3, 157–168. [Google Scholar]
  63. Sun, X. Green city and regional environmental economic evaluation based on entropy method and GIS. Environ. Technol. Innov. 2021, 23, 101667. [Google Scholar] [CrossRef]
  64. Jianbo, R.; Xiaohong, L.; Jingfeng, Y.L.Y. Enlightenment of domestic and foreign experience in the construction of agricultural socialized service system to Guangxi. Trop. Agric. Sci. 2021, 41, 125–130. [Google Scholar]
  65. Wu, J.; Sun, J.; Liang, L.; Zha, Y. Determination of weights for ultimate cross efficiency using Shannon entropy. Expert Syst. Appl. 2011, 38, 5162–5165. [Google Scholar] [CrossRef]
  66. Wu, J.; Sun, J.; Liang, L. DEA cross-efficiency aggregationmethod based upon Shannon entropy. Int. J. Prod. Res. 2012, 50, 6726–6736. [Google Scholar] [CrossRef]
  67. Su, C.-H.; Lu, T. An Entropy-Based Cross-Efficiency under Variable Returns to Scale. Entropy 2019, 21, 1205. [Google Scholar] [CrossRef] [Green Version]
  68. Despotis, D.K. Improving the discriminating power of DEA: Focus on globally efficient units. J. Oper. Res. Soc. 2002, 53, 314–323. [Google Scholar] [CrossRef]
  69. Doyle, J.; Green, R. Efficiency and cross-efficiency in DEA: Derivations, meanings and uses. J. Oper. Res. Soc. 1994, 45, 567–578. [Google Scholar] [CrossRef]
  70. Liang, L.; Wu, J.; Cook, W.D.; Zhu, J. Alternative secondary goals in DEA cross-efficiency evaluation. Int. J. Prod. Econ. 2008, 113, 1025–1030. [Google Scholar] [CrossRef]
  71. Liang, L.; Wu, J.; Cook, W.D.; Zhu, J. The DEA game cross-efficiency model and its Nash equilibrium. Oper. Res. 2008, 56, 1278–1288. [Google Scholar] [CrossRef] [Green Version]
  72. Hou, Q.; Wang, M.; Zhou, X. Improved DEA Cross Efficiency Evaluation Method Based on Ideal and Anti-Ideal Points. Discret. Dyn. Nat. Soc. 2018, 2018, 1604298. [Google Scholar] [CrossRef] [Green Version]
  73. Lim, S.; Zhu, J. DEA cross-efciency evaluation under variable returns to scale. J. Oper. Res. Soc. 2015, 66, 476–487. [Google Scholar] [CrossRef]
  74. Qin, D.; Shao, H.; Zhao, D. Situation analysis of agricultural internal structure optimization based on grey correlation analysis model. Stat. Decis. Mak. 2015, 2015, 104–107. [Google Scholar]
  75. Rizwan, M.; Ping, Q.; Saboor, A.; Ahmed, U.I.; Zhang, D.; Deyi, Z.; Teng, L. Measuring rice farmers’ risk perceptions and attitude: Evidence from Pakistan. Hum. Ecol. Risk Assess. 2019, 26, 1832–1847. [Google Scholar] [CrossRef]
  76. Guo, B.; He, D.; Zhao, X.; Zhang, Z.; Dong, Y. Analysis on the spatiotemporal patterns and driving mechanisms of China’s agricultural production efficiency from 2000 to 2015. Phys. Chem. Earth Parts A/B/C 2020, 120, 102909. [Google Scholar] [CrossRef]
  77. Rizwan, M.; Qing, P.; Saboor, A.; Iqbal, M.A.; Nazir, A. Production risk and competency among categorized rice peasants: Cross-sectional evidence from an emerging country. Sustainability 2020, 12, 3770. [Google Scholar] [CrossRef]
  78. Ma, L.; Long, H.; Tang, L.; Tu, S.; Zhang, Y.; Qu, Y. Analysis of the spatial variations of determinants of agricultural production efficiency in China. Comput. Electron. Agric. 2021, 180, 105890. [Google Scholar] [CrossRef]
  79. Kokieva, G.E.; Voinash, S.A.; Sokolova, V.A.; Gogolevski, A.S. Livestock Machinery Maintenance Efficiency. Sci. Inf. Database 2009, 11, 39. [Google Scholar] [CrossRef]
  80. Fei, R.; Lin, Z.; Chunga, J. How land transfer affects agricultural land use efficiency: Evidence from China’s agricultural sector. Land Use Policy 2021, 103, 105300. [Google Scholar] [CrossRef]
  81. Yunju, L.; Kahrl, F.; Jianjun, P.; Roland-Holst, D.; Yufang, S.; Wilkes, A.; Jianchu, X. Fertilizer use patterns in Yunnan Province, China: Implications for agricultural and environmental policy. Agric. Syst. 2012, 110, 78–89. [Google Scholar] [CrossRef]
  82. Li, N.; Jiang, Y.; Mu, H.; Yu, Z. Efficiency evaluation and improvement potential for the Chinese agricultural sector at the provincial level based on data envelopment analysis (DEA). Energy 2018, 164, 1145–1160. [Google Scholar] [CrossRef]
Figure 1. Map of the study area.
Land 11 00347 g001
Figure 2. The historical growth of the agricultural socialized service levels in the study area.
Land 11 00347 g002
Table 1. Comprehensive evaluation index system of agricultural socialization.
Criterion LayerIndex LayerUnits Used
The service level of agricultural materials (c1)The price index of agricultural means of production (x1)Billion kWh
Rural power consumption (x2)10,000 tons
The application rate of agricultural chemical fertilizer (x3)Ton
Pesticide usage (x4)Ton
Consumption of agricultural plastic film (x5)Ton
Financial and insurance service level (c2)Agricultural loan balance (x6)RMB/100 million
Agricultural insurance (x7)Million CNY
Agricultural science and technology service level (c3)Agricultural technician (x8)People
The proportion of agricultural technicians (x9)%
Personnel with national professional qualification certificates in the grain industry (x10)People
Grain yield per unit area (x11)kg/ha
Agricultural informatization service level (c4)Mobile phone ownership (x12)Department
Color TV ownership (x13)Platform
Home computer ownership (x14)Platform
The service level of agricultural mechanization (c5)Total power of agricultural machinery (x15)10,000 kW
Agricultural diesel consumption (x16)10,000 tons
The net value of agricultural machinery (x17)10,000 kW
Agricultural infrastructure service level (c6)Total reservoir capacity (x18)Billion cubic meters
Effective irrigation area (x19)Hectares
Power generation equipment capacity at the end of the year (x20)Kilowatt
Social public service level (c7)Water and soil loss control area (x21)Hectares
Agriculture, forestry, and water affairs (x22)RMB 100 million
Grain recovery loss (x23)10,000 tons
Total investments in primary industry (x24)RMB 100 million
Table 2. Entropy model measurement results for agricultural socialized service levels.
YearAgricultural Material Service LevelAgricultural Informatization Service LevelAgricultural Mechanization Service LevelAgricultural Science and Technology Service LevelAgricultural Infrastructure Service LevelSocial Public Service LevelFinancial and Insurance Service LevelTotal Service Level
20080.11440.00130.00140.09920.00360.04260.00420.2668
20090.04260.01560.01830.09930.00880.04870.00880.2421
20100.07180.03150.04420.06070.01290.06570.01110.2978
20110.10720.07080.06360.05910.02130.05790.02140.4013
20120.09550.08460.07210.10560.03350.08630.05110.5287
20130.08660.09500.09430.11620.10820.08800.06680.6551
20140.08600.10300.10950.10200.12160.09050.06890.6816
20150.09710.10540.11330.11870.13230.10310.05880.7287
20160.08510.11090.11010.07060.13460.10630.09410.7117
20170.07940.11610.11990.07160.13830.09980.13040.7555
20180.07080.13070.12380.05210.14030.10360.19040.8118
20190.06350.13510.12950.04490.14450.10750.29400.9189
Table 3. Measurement of agricultural production efficiency.
YearAgricultural Production EfficiencyAgricultural Technical EfficiencyAgricultural Scale EfficiencyReturn to Scale
20080.7031.0000.703IRS
20090.6960.9950.700IRS
20100.8031.0000.803IRS
20110.9071.0000.907IRS
20120.9301.0000.930IRS
20130.9641.0000.964IRS
20140.9570.9910.966IRS
20150.9270.9870.940IRS
20160.9821.0000.982IRS
20170.9620.9870.975IRS
20180.9650.9880.977IRS
20191.0001.0001.000-
Table 4. Grey correlation between socialized agricultural services and agricultural production efficiency.
Agricultural Service TypesProduction EfficiencyTechnical EfficiencyScale Efficiency
CorrelationRankingCorrelationRankingCorrelationRanking
Resources 0.855620.850560.85552
Information 0.852370.850930.85217
Mechanization 0.852460.850840.85226
Science and technology0.856410.850550.85631
Infrastructure0.852450.851520.85225
Social public0.853640.850470.85354
Financial insurance0.853830.853310.85373
Table 5. Regression results for agricultural socialized services and agricultural production efficiency.
(1)(2)(3)
Agricultural ProductivityAgricultural ProductivityAgricultural Productivity
Agricultural infrastructure service level1.417 **
(4.35)
Financial insurance service level 1.057 *
(2.91)
Agricultural material service level 1.802
(1.31)
Agricultural mechanization service level 2.590 *
(2.36)
Total public services level −0.520
(−0.26)
Agricultural science and technology service level−0.462
(−0.61)
0.598
(0.51)
0.0353
(0.07)
cons0.820 ***0.612 **0.724 ***
(11.01)(3.78)(8.41)
N121212
Note: *, **, and *** indicate significance levels at 10%, 5%, and 1%, respectively.
Publisher’s Note: MDPI stays neutral with regard to jurisdictional claims in published maps and institutional affiliations.

