Article

Performance Analysis of Dairy Farms Transitioning to Environmentally Friendly Grazing Practices: The Case Study of Santa Catarina, Brazil

by
Andréa Castelo Branco Brasileiro-Assing
1,*,
Jini Kades
2,
Paulo Antônio de Almeida Sinisgalli
1,
Joshua Farley
3 and
Abdon Schmitt-Filho
4
1
Graduate Environmental Science Program (PROCAM), University of São Paulo (USP), Estrada Geral Rio dos Índios, 01, Santa Rosa de Lima 88763-000, Brazil
2
Department of Community Development & Applied Economics, University of Vermont, 510 N St. SW, Washington, DC 20024, USA
3
Community Development and Applied Economics, University of Vermont, 205 B Morrill Hall, Burlington, VT 05405, USA
4
Silvopastoril Systems and Ecological Restoration Lab (LASSre), Agroecosystem Program at University of Santa Catarina (PGA/UFSC), Rodovia Admar Gonzaga, 1346, Cx. P 476, Floriaoópolis 88034-000, Brazil
*
Author to whom correspondence should be addressed.
Land 2022, 11(2), 294; https://doi.org/10.3390/land11020294
Submission received: 15 January 2022 / Revised: 9 February 2022 / Accepted: 11 February 2022 / Published: 15 February 2022
(This article belongs to the Special Issue Sustainable Management of Natural Resources in Livestock System)

Abstract

:
The conflict between food production and environmental conservation demands alternative agriculture practices to maintain or increase food production, protect and restore critical ecosystem processes, and reduce dependence on non-renewable agricultural inputs. Deforestation in Brazil’s Atlantic Forest, for which agriculture has been a primary driver, already threatens the biome’s impressive biodiversity and the ecosystem services it helps sustain. Many small family farmers in Santa Catarina—located in the South of Brazil—have adopted the Voisin Rational Grazing System (VRG) as an alternative to conventional and environmentally detrimental dairy activities. This article presents the results of a research project designed to analyze the economic, social, and ecological VRG impacts based on farmers’ perceptions and economic accounts. We compare farmer profitability and critical social and environmental aspects of both systems using detailed interviews and monthly accounting of revenues and expenditures on VRG and conventional farms. We found that VRG is more profitable than the conventional dairy system in Santa Rosa de Lima. However, most farmers combine VRG with some conventional practices, affecting profitability and potential ecological benefits. The adoption of VRG in Santa Rosa de Lima nonetheless correlates with reduced use of environmentally harmful inputs, compatible with a gradual transition to a more ecologically-friendly and sustainable system.

1. Introduction

Agriculture, which occupies nearly 38% of the Earth’s land surface area [1], is among the leading threats to global ecosystems and the life-sustaining ecosystem services they generate [2]. Within agriculture, cattle production is among the worst threats to the environment, accounting for more than half of all agricultural land and nearly half of greenhouse gas emissions [1]. The FAO estimates that we will need to increase agricultural output by 70% to feed a growing population with a growing demand for animal protein [3]. Agriculture’s current ecological impacts already threaten the ecosystem services upon which agriculture depends [4], and with current technologies, impacts will only worsen as we increase output [5].
Addressing this dilemma requires agricultural systems that can “increase food production from existing farmland in ways that place far less pressure on the environment and that do not undermine our capacity to continue producing food in the future” [6] (p. 33). Sustainable intensification, ecological intensification, sustainable agriculture, organic agriculture, permaculture, biodynamic agriculture, and agroecology are all related sciences, movements, or practices that accept this basic necessity. United Nations’ reports on the right to food have called for a global switch to environmentally friendly practices [7,8].
The Voisin Rational Grazing System (VRG), also known as management intensive grazing (MIG), is an environmentally friendly grazing practice approach to dairy and meat production, which obeys four laws: rest, occupation, maximum yield, and regular yield [9,10]. These laws advocate managing the pasture and herd in a way that respects the recovery time of the grass, avoids overgrazing, and respects the different nutritional requirements of the animals [11]. In this system, hydraulic systems provide water for the animals, which graze in paddocks for a short period of time and are then rotated to a new paddock [12]. The optimal rest period for the grazed paddock is determined by the sigmoid curve of grass re-growth (Figure 1), in which an early period of slow growth is followed by a period of rapid growth and a final period of slow growth. The optimum rest period maximizes the quantity and quality of grass production per hectare. In short, VRG controls pasture and grazing intensity in order to improve the pasture-based feed systems [13], which includes the management of cattle, pasture, and soil [9].
Increasing the quantity and quality of grass without increasing pasture area can be an alternative for economies in which cattle activity is pre-dominantly pasture-based and is relevant for the country’s income, which is the case in Brazil, the second largest beef and the sixth largest milk producer in the world [14].
With 32% of its land in agriculture production, Brazil is the fourth highest emitter of greenhouse gasses (GHGs) from agriculture in the world [1]. Cattle production is responsible for 90.5% of all emissions from Brazilian agriculture activities, and permanent pasture occupies 23.45% of Brazilian territory [1].
Braga [15] and Campos [16] refer to the three main dairy-farm feeding systems practiced in Brazil as extensive, semi-intensive, and intensive. Extensive dairy farming is solely pasture-based, semi-intensive systems supplement pasture with protein and energy-rich feed, and intensive dairy management is a confinement system relying entirely on protein and energy supplements [15,16]. There is little consensus in the literature on definitions of dairy systems, especially for ones based on pasture [17,18,19,20,21]. To emphasize technique over diet, we will refer to these three systems as pasture-based, semi pasture-based, and non-pasture-based, respectively. The most common practice in Brazil for dairy activity has been the pasture-based system, representing 58.61% of all farms, followed by semi pasture-based systems, which represent 40.42% of all farms [15].
In Santa Catarina, Brazil, about 70% of the farms utilize pasture-based systems, and the rest use semi pasture-based [15]. During the late 1990s, VRG gained popularity on family dairy farms through a project developed by the Federal University of Santa Catarina (UFSC) and The State Agricultural Research and Extension Agency (EPAGRI) [22].
VRG offers a variety of ecological and economic advantages over other production systems. Economic advantages include lower operating costs and fewer off-farm inputs (hence reduced risk), reduced labor requirements, and improved animal health, resulting in higher net returns per unit of milk produced or per cow [12,19,20,21,23]. Reported environmental benefits include the recovery of natural pasture, water retention, decreased erosion, increased biodiversity, improved soil fertility and porosity, natural pest control, carbon sequestration, water regulation, and nutrient cycling [9,11,13,20,24,25,26,27,28,29]. In short, VRG offers a sustainable alternative to conventional cattle production that can improve family farmer livelihoods while reducing or even reversing ecological degradation [29].
Santa Catarina is located in the Brazilian Atlantic Forest Biome, which is among the most biologically rich and most threatened ecosystems on the planet, making it an international hotspot for conservation priorities [22,29,30,31]. A total of eighty-eight percent of farms in Santa Catarina are classified as small family farms. Family farmers provide 60% of all milk consumed in Brazil [32]. Brazil is the sixth largest milk producer in the world, and Santa Catarina is the fourth largest state for milk production in the country [33], accounting for 9.6% of all Brazilian milk production [34]. Milk production is also important for the state economy, ranking second in gross production value among all state agricultural activities in Santa Catarina [34]. Dairy represents 80% of the total monetary value of livestock activity [35] and is present on 45% of all Santa Catarina’s farms [36].
Despite the advantages of VRG, it is still not used by all farmers in the region. One likely obstacle to increased diffusion is a lack of knowledge about the system [37]; we found no detailed studies quantifying its economic costs and benefits in the region. We found research that calculates the costs of implementation of the system [38,39,40,41], but none that assesses the annual production costs in farms already applying the system. The goal of this research is to provide a detailed economic assessment and comparison of dairy farmers adopting VRG and farmers not adopting VRG, supplemented by an analysis of their social and environmental impacts based on farmers perception, in the small-farmer dairying region of Santa Rosa de Lima- SC, in which 45% of dairy farmers in this region have already adopted VRG [42]. We hypothesize that VRG farms will have higher stocking rates, higher milk production per hectare and per animal unit, and lower input costs, resulting in improved farmer livelihoods, reduced risk, and more profitability.
The paper is organized as follows: Section 2 presents the case study, sampling technique, and data collection and analysis; Section 3 presents the results and analysis based on interviews and the accounting project conducted with farmers; Section 4 discusses the results; and Section 5 wraps up with conclusions, suggestions for future investigations, and possible next steps for Santa Rosa de Lima to continue its transformation to a mature, environmentally friendly dairy system.

2. Methods

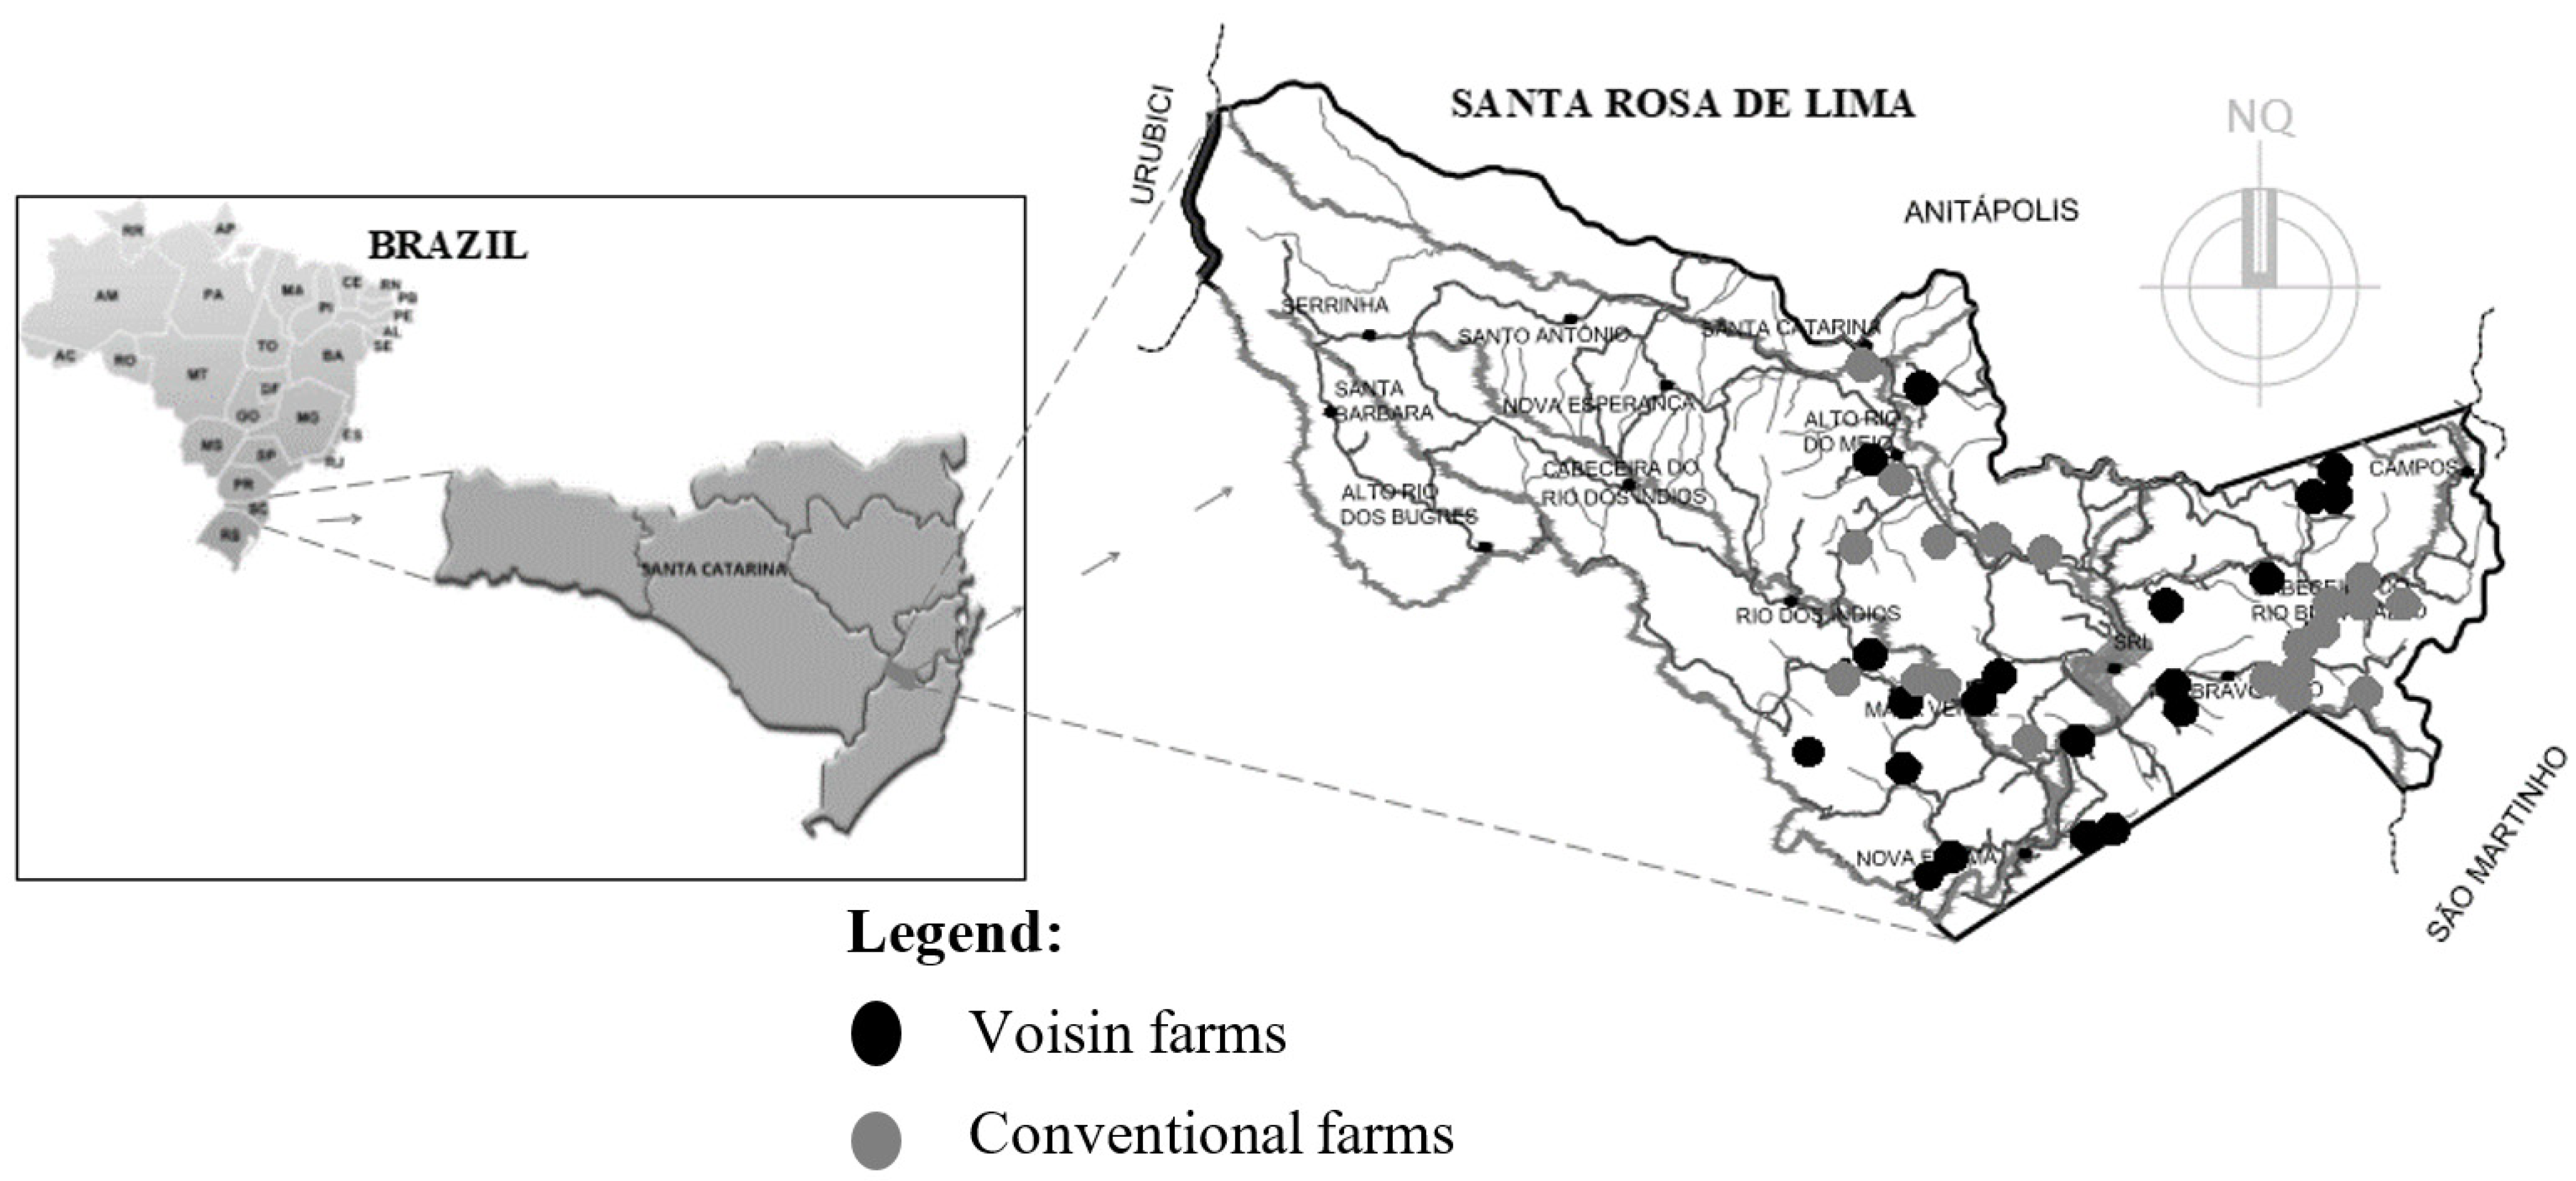
2.1. Case Study and Sample

Santa Rosa de Lima (SRL) is a small municipality located in the coastal mountain range of Santa Catarina, a Brazilian state located in the southern region of the country. Of SRL’s 2065 inhabitants, three-quarters live in rural areas [43]. A large part of its population works in agroecological activities, giving the city the title of the Agroecological Capital of Santa Catarina [42]. The project presented here is part of a larger project developed by the Federal University of Santa Catarina (UFSC) to encourage dairy farmers to use agroecological and environmentally friendly practices in the state.
We selected 40 farms in Santa Rosa de Lima for this study, 20 farms utilizing traditional pasture management (pasture- and semi pasture-based without VRG techniques), and 20 utilizing VRG. To facilitate interviews and subsequent monthly visits, we chose farms that were relatively close to each other. Participation was, of course, voluntary, but otherwise, the sample was random. Farm distribution is shown in Figure 2.
The grey dots in Figure 2 represent conventional farms and the black dots, Voisin farms. According to Santa Rosa de Lima City Hall, there are 199 dairy farms in the municipality, of which 53 use VRG, and 66 use conventional systems [42]. Although our sample seems relatively small for statistical analysis, it represents 34% of all dairy farms in the municipality, and 38% and 30% of the Voisin and conventional farms, respectively. Resource limitations precluded a larger sample size. All farmers that had their pasture divided into paddocks and rotated their animals daily were considered to be operating Voisin farms. Conventional farmers are all those that applied other systems.

2.2. Data Collection

Data for this study were collected in two separate phases. The first phase, consisting of personal interviews on 40 family farms, took place between 1 April and 10 May 2013. The questionnaire for the interview was developed based on Meurer [24], Francisco [45], Alvez [17], Jeremias [46], and Longo [47]. The questionnaire consisted of 176 questions regarding the characteristics of the farm and family, management and zootechnical characteristics, technical assistance, characterizations and management of VRG, organic production, milk production, pasture conditions, animal behavior, animal feed, herd health, economic indicators, ecosystem services, willingness to take part in payments for ecosystem service programs, and environmental law. The objective of these interviews was to document the family farmers’ perceptions on economic, social, environmental, and legal issues related to their activity and property. In this article, we only used a subset of the questions.
The second phase of data collection consisted of gathering detailed annual accounting data based on farmer recollection of dairy-related production, costs, income, and sales. Farmers were asked to account for dairy-related expenditures and revenues for the course of one year, between August 2013 and July 2014. From 40 farmers (our initial sample), 35 agreed to participate. However, during the project, three farmers withdrew, four more were excluded from the sample due to incomplete information, and one more was excluded because the income from animals’ sales exceeded income from the sale of milk, resulting in a final sample size of 27 farms, 15 using VRG and 12 using conventional methods.
Accounting data were collected through monthly visits to each participating farm. Taking advantage of farm visits, we implemented an associated extension project to help family farms learn how to monitor their financial activity and assess farm profitability, which we called the “Dairy Production Accounting Project of Santa Rosa de Lima”. We also organized one workshop in which farmers were informed about the background of the project and taught how to record the necessary data. Accounting systems have been shown to affect profits because farmers who record and monitor their activities are better able to identify and reduce cost inefficiencies [23]. Furthermore, participation in extension activities and the use of extension agents are positively associated with dairy farm financial performance [23]. So, the objective of this extension work was to collect data accurately and instruct family farms in accounting practices. In November of 2015, each farmer received the accounting report of their dairy activity, and the general performance of the dairy activity in the municipality was presented to them in a workshop.

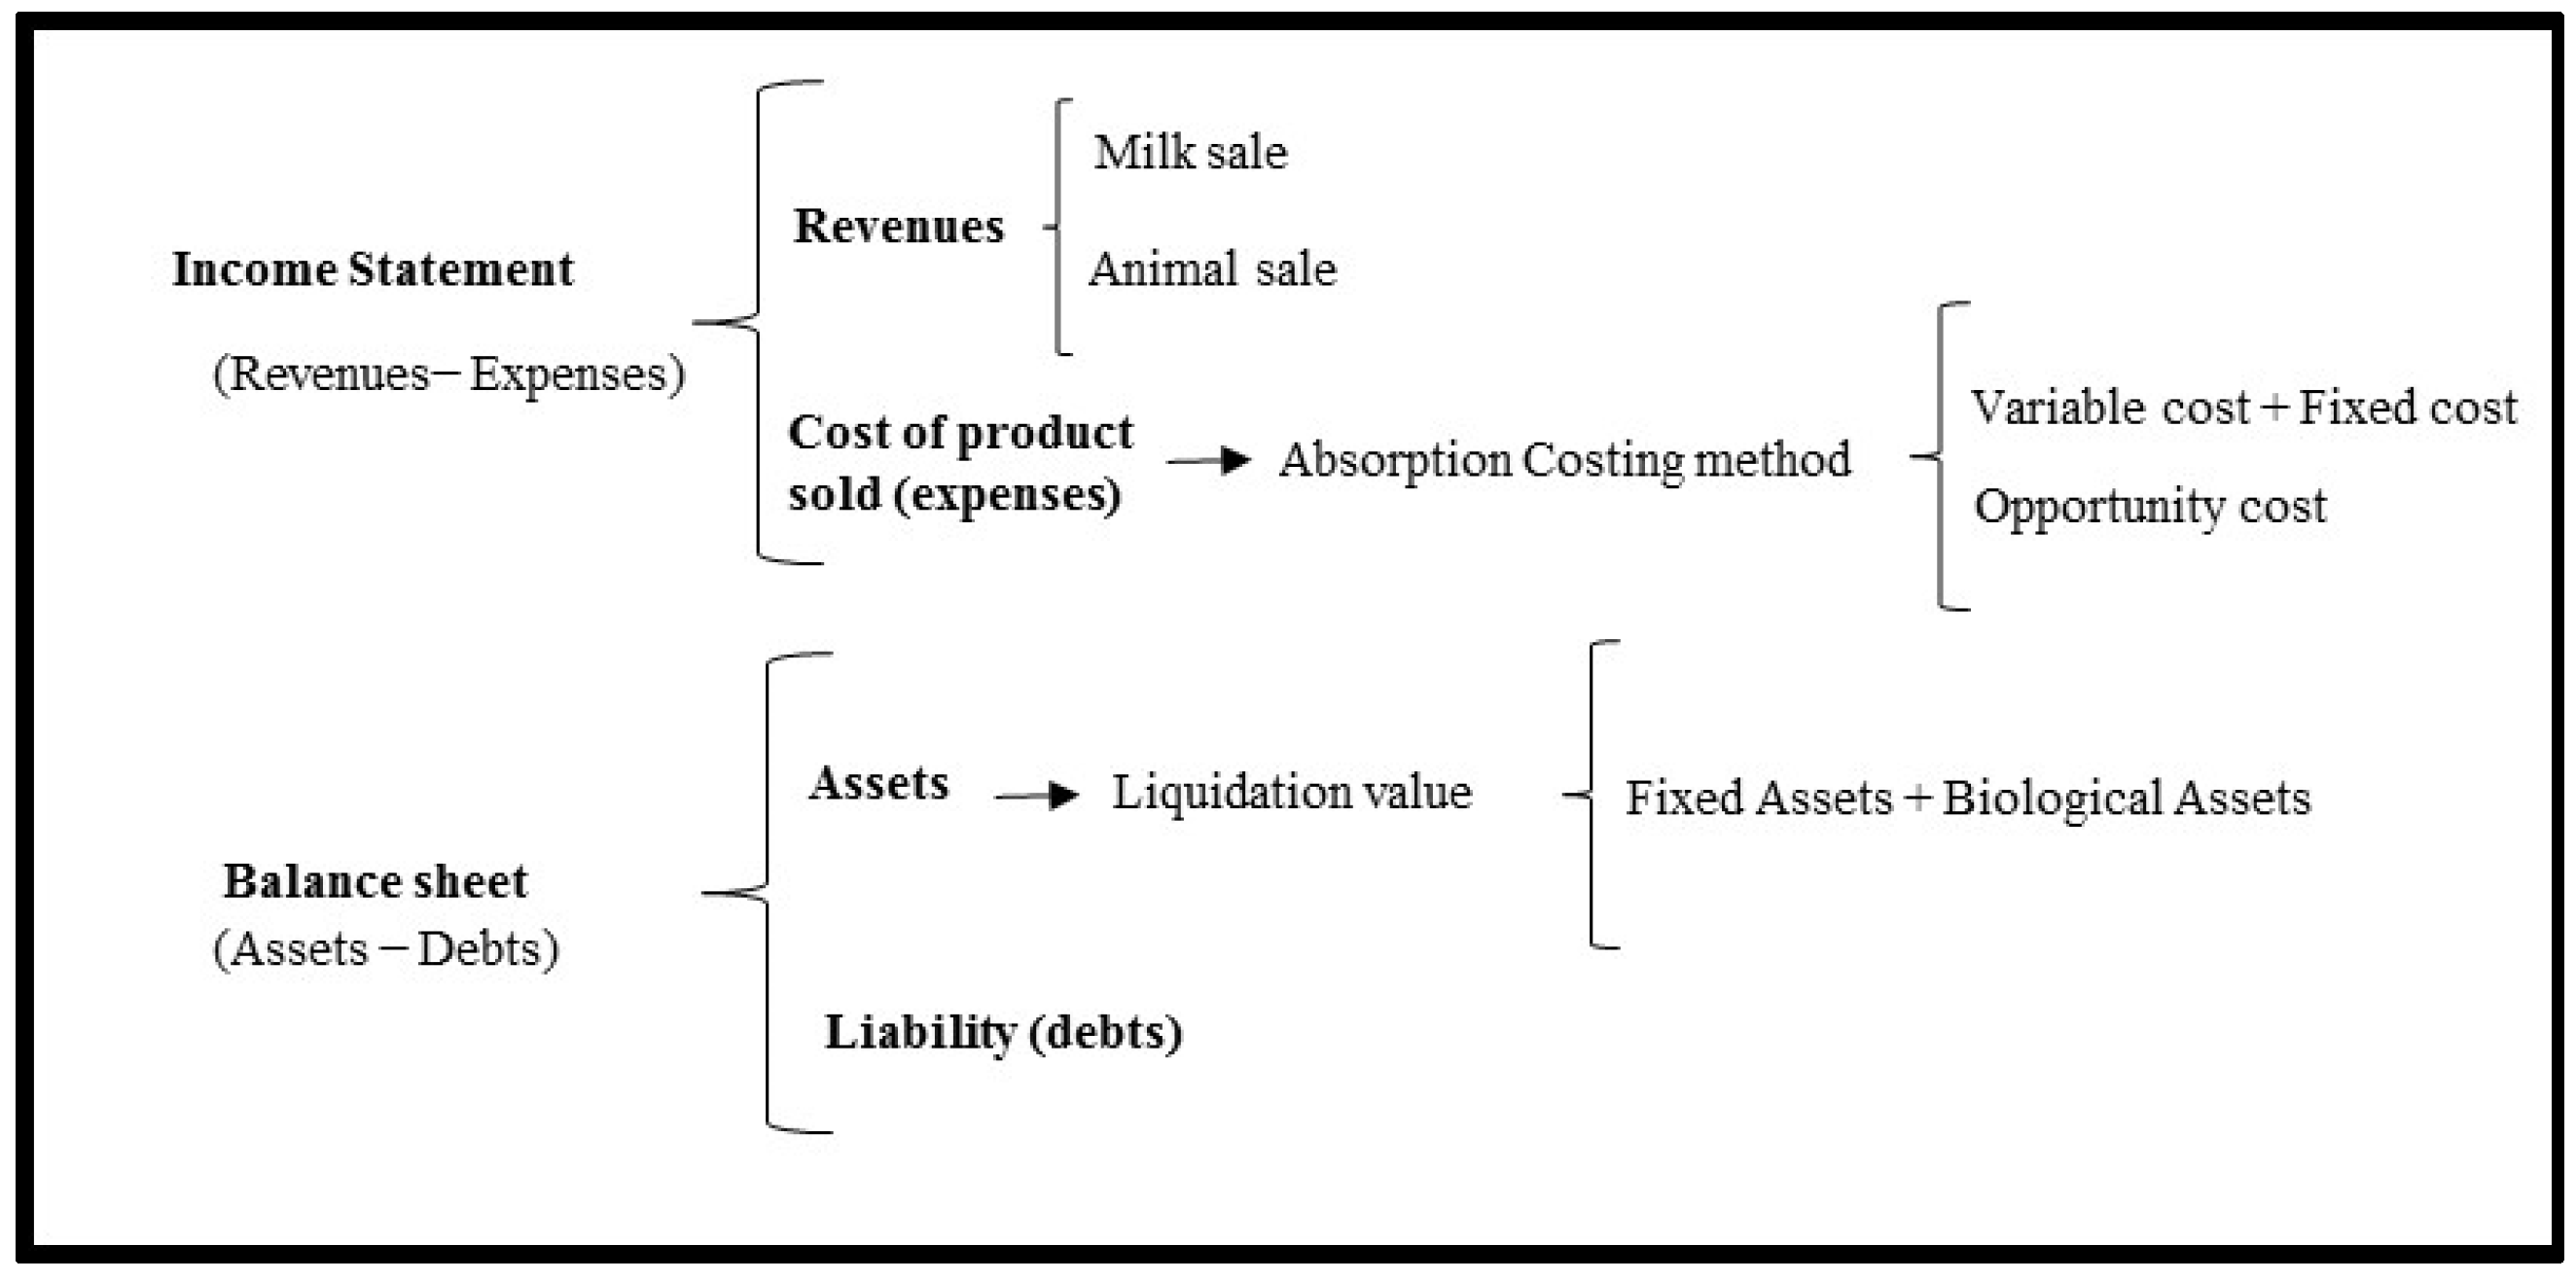
2.3. Accounting Method

Because our objective was to analyze just the economic activity of dairy farming, only data regarding milk and cattle production were recorded, rather than the economic activities of the entire farm.
The spreadsheets were developed based on the International Accounting Standards Board (IASB) rules [48]. For the income analysis, information on costs and revenues was recorded. Specifically, for production cost calculations, we applied cost definitions based on the cost accounting approach. We applied the absorption costing method, which considers the average total cost (variable plus fixed costs) as the unit production cost [49]. Farmers completed a spreadsheet with information on their variable, fixed, and opportunity costs. Variable costs are those expenses that vary with production, and fixed costs are expenses unaffected by the amount produced in the short-run [50]. Fixed costs must be paid even if production drops to zero. Fixed costs only occur in the short run, by definition, because the long run is defined as the period in which all costs are variables.
Production cost, cost of sales, and other expenses include animal feed (crop and supplements), veterinary costs, insemination, electricity, fertilizer, herbicide, grass seedlings and seeds, crop seedlings and seeds for silage, maintenance of machines and buildings, taxes (annual tax on rural property and annual car registration), insurance (car insurance), machine rental, fuel, and labor.
Opportunity costs represent forgone income rather than actual expenditures [50]. The main opportunity costs for farmers include wages that could be earned by working off-farm and income that could be generated from renting out land rather than farming it. We valued all dairy-related farm labor at RHD 8.75/h, the expected payment per rural labor hour in Santa Rosa de Lima municipality. We did not include opportunity costs from land rental because farms for VRG and conventional had similar pasture areas, hence similar potential for rental income, which would not affect our comparison. Additionally, the practice of renting land is uncommon in the case study area and may not represent a real opportunity cost.
Other examples of opportunity costs identified were the on-farm use of raw materials harvested, for example, using wood for fences in lieu of timber sales. Additionally, we accounted for interest income farmers could have made by depositing their financial capital in a savings account rather than investing it in the production process (6.16% registered for the accounting year, according to the “citizen calculator” of the Central Brazilian Bank website). Our objective was to calculate the opportunity cost of the production investment, not the opportunity cost of the total investment in fixed assets (building, machines, equipment, and tools). To analyze differences related to investment in fixed assets, we considered it most interesting to calculate the Return on Assets.
Concerning family labor, Voisin and Conventional farmers stated similar time dedicated to animal management, which includes feeding the animal in the barn, milking cows, and leading animals to the pasture area and the barn. The daily average time of family labor for both systems was very similar, 7.62 h/day and 6.71 h/day for Voisin and Conventional farms, respectively. Furthermore, stated hours of labor varied little with herd size, which seemed implausible. However, there are well-known problems when data collection is based on recall rather than precise measurements—for example, when people are asked to recall their food intake, over 60% state implausibly low levels of calorie consumption [51]. In contrast, we use the farmers’ recalled labor contribution. In our analysis, we believe there is reason to doubt its accuracy.
The income statement analysis recorded the sales from dairy activity. Milk sales were considered the main product, and animal sales were considered the sub-product of the dairy activity.
For the balance sheet analysis, the assets and liabilities were recorded and compared to understand the financial solvency of the activity. Only assets used in the dairy activity were considered. Money which farmers had in a checking or savings account was not recorded, in part because we assumed that farmers would not feel comfortable sharing this information. Assets included land (for pasture and crops of animal feed), machines (milking machines, milk coolers, forage crushers, weed whackers, and chainsaws), tools (shovels and wheelbarrows), buildings (barns, manure compost dumps, and warehouses), transports (cars or motorcycles), and herd (cows, heifer, calves, and bulls). Some of the machines and modes of transports were also used for activities other than dairy production on the farm; however, these activities represented a small percentage of the farm income and were thus ignored. We used the value of liquidation stated by the farmer for asset value. We ignored depreciation for three reasons: (1) the liquidation price already assumes depreciation of the past years; (2) 80% of asset values were from assets with negligible depreciation or even rising values due to market dynamics (for example, land and biological assets); and (3) information about the purchase price and date were not available.
Figure 3 below summarizes the framework used for the accounting analysis for dairy activity.

2.4. Economic Analysis

In order to conduct the economic analysis, some conventional indicators were calculated, such as Gross Profit, Net Profit, Return on Assets (ROA), and the Benefit–Cost Ratio (BCR).
The Gross Profit, here, is a farm’s revenue minus the direct costs of production, i.e., a farm’s expenditures. The Net Profit, also known as net income or economic profits (Equation (2)), is gross profit minus indirect expenses, such as opportunity costs of labor and capital, depreciation, debt payments, and taxes. Gross profit is the income farmers actually receive, while net profits subtract opportunity costs. In theory, an economically rational farmer would only keep farming if Net Profits are positive. As farmers are known for self-exploitation or undervaluing their own labor [52], the difference between gross and net profit can be significant. Both measures are conventionally presented in the income statement [53]. The opportunity costs are not usually recorded in the income statement, but they are costs that should be considered in making decisions [54] and were therefore included in our analysis. The payments of principal on debts are not included in the income statement but are presented in the balance sheet together with interest payments. Distinguishing between interest and principal on debts was not possible because some farmers did not know the interest rate they were paying.
Gross Profit = (revenue) − (direct expenditures)
Net Profit = (revenue) − (direct expenditures) − (opportunity costs)
We also calculated the Return on Assets (Equation (3)) and the Benefit–Cost Ratio (Equation (4)), as mentioned before. The ROA is a measure of profitability that is calculated as gross or net profit divided by asset values. BCR is conventionally calculated as the ratio between the net present value (NPV) of income and the NPV of costs, which is appropriate when analyzing investments with immediate costs and future benefits, for example, if conventional farmers were considering investing in VRG. Because our study was focused on a single year of data with negligible new investments, our BCR used current period income and costs.
Gross (or Net) ROA = Gross Profit (or Net Profit)/Assets
Gross (or Net) BCR = Income/Expenditures (or Total Costs)
We calculated two values for both ROA and BCR, one ignoring opportunity costs (Gross BCR) and the other including them (Net BCR). Both indicators measure how efficiently assets and investments are managed to generate earnings.

2.5. Statistical Analyses

We divided the total value of all variables related to costs, profit, and revenue by liter, hectare, and animal unit (AU), in order to evaluate these variables through the economic, ecological, and animal efficiency lenses, respectively. To calculate animal unit, we used the equivalences based on Embrapa’s suggestion [55] and assumed that: 1 adult bull or ox = 1.25 AU; 1 cow = 1 AU; 1 heifer = 0.75 AU; and a calf or younger heifer = 0.25 AU.
To analyze the differences between farm characteristics of the two groups (Voisin and non-Voisin farmers, hereafter Voisinistas and conventional farmers, respectively), we used t-tests for data that were normally distributed and the Mann–Whitney U test for data that were identified as nonparametric. Analyses were conducted using IBM Statistical Package for Social Sciences (SPSS) Version 24.
To evaluate the real significance of the t-test and U test results, effect size tests were conducted for the variables that showed significance equal to or higher than 0.10 (p ≥ 0.10). “Estimates of effect size are useful for determining the practical or theoretical importance of an effect, the relative contribution of different factors or the same factor in different circumstances, and the power of an analysis” [56] (p. 2).
The primary effect size test used was the Cohen’s d effect size. For data identified as parametric, we used the online effect size calculator of the University of Colorado. “The larger an effect size, the bigger the impact the experimental variable is having, and the more important the discovery of its contribution is” [56] (p. 14). The effect size d ≤ 0.2 is considered as a small effect; if 0.2 < d < 0.8, the effect is considered medium; and if it is ≥0.8, the effect size is considered to be large [56,57].
For nonparametric data, Cohen’s effect size was calculated by the division of the standard score, z (obtained from the U test) by the square root of the total sample size ( N ), as suggested by Fritz [56]. See Equation (5):
r = z N
The large, medium, and small effect sizes for non-parametric data are defined by: r ≤ 3 = small, 3 < r < 5 = medium, and r ≥ 5 = large.
To better understand the effect size d results, we utilized the probability of superiority (P.S.) correspondent to the effect size result according to the Fritz [56]. Table on the associated d, r, and P.S. values. According to the authors, “P.S. gives the percentage of occasions when a randomly sampled member of the distribution with the higher mean will have a higher score than a randomly sampled member of the other distribution” [56] (p. 14). For example, the P.S. for a d of 0.8 is 71%. Therefore, if you sampled items randomly, one from each distribution, the one selected from the distribution with the higher mean would be greater than that from the other distribution 71% of the time.

3. Results

The results are presented in sequence: the environmental, social, and economic aspects of the observed dairy activity. The environmental and social aspects are comprised of results from analysis of data collected in the first interview, based on farmers’ perceptions. Environmental aspects include soil biodiversity, animal health, soil quality, use of chemicals, and pasture conditions. The economic aspects present the analysis of the data collected through the accounting project. This includes general farm system characteristics, income statements, and balance sheet results.

3.1. Based on Farmer’s Perceptions

3.1.1. Environmental Aspects

As previously mentioned, VRG has numerous environmental advantages when compared with other dairy systems; some directly benefit farmers, while others take the form of positive externalities, i.e., benefits to society for which farmers receive no compensation. Our results are based on farmer perceptions, not biophysical measurements. Table 1 shows these results.
Voisin farms showed better performance for soil porosity and moisture. A total of 75% and 85% of all Voisinistas, respectively, stated that these indicators of soil quality had improved in the last ten years, compared to 15% and 20% of conventional farmers. The large effect size and P.S. confirm the significance of these results (see Table 1). Voisinistas perceived better animal health and also perceived greater improvements in soil biodiversity in pasture areas over the last ten years, though statistical significance for this last result is questionable and effect size fairly small.
Surprisingly and perhaps paradoxically, a higher percentage of Voisinistas reported using herbicides and fertilizer, though the difference was statistically significant only for fertilizer use. These numbers, however, contradict those found in the accounting project and will be discussed below.
In the overall sample, we identified 15 varieties of grasses and four leguminous plants, all of which could be found on Voisin farms, compared to nine types of grasses and three types of leguminous plants on the conventional farms. On average, Voisinistas have 55% more varieties of grasses and 35% more varieties of leguminous plants than conventional farms (see Table 2). The variety of grasses and leguminous plants presented large effect sizes and P.S., confirming, therefore, the significance of the differences between the systems. Primary productivity in more diverse plant communities appears to be more resistant to drought, with more rapid recovery [58], suggesting that Voisinistas will prove more resilient to extreme climate events due to global warming.

3.1.2. Social Aspects

Although many authors have found that the Voisin system requires less family labor than other systems [17,22,29,59], in the current study, we unexpectedly found that only 10% of the Voisinistas stated that their workload had decreased over the last ten years, compared to 50% of conventional farmers. While Alvez asked if workloads fell after adopting VRG and found significant reductions, we asked more generally if workloads had decreased in the last ten years, as this was the average time of Voisin adoption in the municipality. The smaller perceived reduction in workloads for Voisinistas than for their conventional farmer counterparts should take into consideration the Voisinistas’ greater efforts at pasture improvement, as previously discussed. No statistically significant difference was found between the two systems with regards to the number of family members that receive other sources of income (see Table 3).

3.2. Based on Accounting Project Information

3.2.1. General Farm System Characteristics

The animal diets in the dairy systems found in Santa Rosa de Lima are comprised mainly of pasture, corn silage, forage, and rations (wheat bran, corn bran, soybean bran, and a mix of assorted cereals), which classifies Voisinistas and conventional farmers alike as using semi pasture-based systems. All farmers leave the animals in the pasture all day and then feed them in the barn twice a day while they are being milked.
Although Voisinistas feed cows and heifers 1.65 kg of rations (purchased feed) per day, which is 57% more than the conventional farmers (1.05 kg/day), the statistical significance of this difference was low (Table 4). In contrast, conventional farmers feed cows and heifers significantly more silage than Voisinistas do.
The farm characteristics seen in Table 5 show the total areas of the farms dedicated to dairy activity, the number of animals, the number of cows, animal units, and the stocking rates.
The size of the average Voisin farm was greater than the average conventional farm, though the difference was not statistically significant for pasture area or cropped land when treated individually. The herd size, total animal units (AU), and the number of cows were all greater on the Voisin farms, with large effect sizes and P.S., but various measures of stocking rates (e.g., AU/ha and animals/ha) were not statistically different between the samples.

3.2.2. Income Statement and Balance Sheet Results

As mentioned before, all variables related to the cost, income, and profit were divided by hectare, liter, and AU, in order to analyze these variables according to ecological, economic, and animal efficiency aspects, respectively.
The cost calculations were not statistically different between Voisin and conventional systems, except for total costs divided by liters. This difference was confirmed by the medium effect size and P.S. (d = 0.67 and P.S. = 68); see Table 6.
The largest component of expenditures was purchased feed (rations), representing 47% and 34% of the Voisin and conventional farmers’ expenditure totals, respectively. Voisinistas spent more money on rations than the conventional farmers. However, this difference was significant just for the cost of rations divided by animal unit, which was 76% higher for Voisinistas. The effect size was very close to being classified as large (d = 0.79), and the P.S. of 70 confirms the significance of this difference.
Although 90% of the Voisinistas stated in their first interview that after the adoption of the Voisin system, their total workload had either not changed or had increased, the value of family (unpaid) labor, when divided per liter, was significantly smaller for Voisinistas, and the significance of this difference was confirmed by its effect size and P.S., which were 0.79 and 70, respectively. This is expected, as milk production is higher for Voisinistas due to the combination of greater dairy farm areas, stocking rates (Table 5), and liters per cow (Table 7), even though some of the differences are not statistically significant when viewed alone. This finding is also reflected in the opportunity cost divided by liters (60% higher for conventional farmers), because unpaid labor was the main component of the opportunity cost for both systems (42% and 57% of the Voisin and conventional total costs, respectively), and again, the Voisinistas have greater milk production. For the opportunity cost divided by liters, the significance of the difference between the two farming systems was also confirmed by the large d and P.S. (0.81 and 71, respectively).
Although the initial survey found 80% of Voisinistas used chemical fertilizers in the pasture area, compared to just 35% of the conventional farmers, during the accounting project, all farmers were found to use chemical fertilizers with the exception of one Voisin farmer that used manure from his pig farm. Furthermore, the accounting project also found that Voisinistas had lower total fertilizer expenditures per liter, AU, and hectare, though the difference was only significantly different for expenditures per liter (d = 0.92 and P.S. = 74).
The initial survey also found evidence that a higher percentage of Voisinistas use herbicides (88% vs. 35%), though this difference was not statistically significant. The accounting project found that all but one farmer (conventional) used herbicides.
These results raise concerns both about the validity of the data and the possibly greater use of off-farm inputs by Voisinistas, which environmentally friendly grazing practices seek to avoid. We suggest three possible explanations for differences between the survey and accounting project: (a) different periods for data collection (the first one was in April of 2013, and the second during August 2013 through July 2014); (b) differences in the wording of questions, with the first interview asking about chemical use on pastures, and the accounting project asking about the total dairy area, including crops; and (c) a reluctance to admit to chemical use in the interview. The accounting project did not ask directly about chemical use but rather about production costs.
Concerning chemical use by Voisinistas—whom we assumed would have healthy pastures without chemicals—farmers are widely known to apply more fertilizer than plants can use [60], which can actually reduce nitrogen fixation by legumes [61]. Farmers are also known to apply more pesticides than required to maximize profit [62]. Furthermore, we found that all Voisinistas practice pasture improvement (overseeding and other techniques of planting grasses and leguminous plants), and 95% practice overseeding (the sowing of one type of grass into another already existing grass). While among conventional farmers, these percentages were 65% and 10%, respectively (see Table 2), Voisinistas are significantly more likely to improve their pastures and may view fertilizers and pesticides as additional improvements. Finally, we know that agro-industry and government extension agents visit farmers regularly and suspect that they pressure farmers to purchase these external inputs.
Although the initial survey showed that Voisinistas perceived they had healthier animals (Table 1), the accounting project found no significant difference in spending on medications between the two systems (Table 6).
We measure farm outputs by: liters of milk per lactating cow, estimated at 70% of the total cows (cow productivity) and per hectare; revenue per hectare and per animal unit; milk sales; animal sales; and the coefficient of milk production variation (Table 7). The coefficient of milk production variation is the standard deviation of milk production divided by its average, in other words, the relative average variation of milk production.
Although the higher average productivity per cow reported by Voisinistas was not statistically significant, the more relevant measure of milk production (liters per hectare) was 80% higher for Voisinistas, and the difference was significant. Similarly, revenues per hectare and per AU were higher for Voisinistas, though only the former was statistically significant. However, this significance was not considered very high, as it showed a p-value of 0.096, a medium effect size (d = 0.68), and consequently, a P.S. of 68, see Table 7.
The coefficient of milk production variation was 24% higher for conventional farmers than for Voisinistas. This was expected as the Voisinistas reported more pasture improvement practices, an influential factor in the use of animal feed and consequently in milk production. However, this difference was not statistically significant (see Table 7).
The assets are shown to be 26% higher for the Voisinistas than for conventional farmers, but Voisinistas have debts 466% higher than the conventional farmers, confirmed by medium and large effect sizes, respectively. The balance between the assets and debts shows that both systems have good solvency, or in other words, similar capacity to comply with their liabilities using their assets (see Table 8).
Table 9 presents the profitability measures described in Section 2.4, but to facilitate comparisons between farms, shows profitability per hectare, liter, and animal unit (AU).
Although there were differences found in the average profitability between the two systems, these differences were only significant for gross profits per hectare. For these calculations, Voisinistas earned greater profits than conventional farmers. The calculated effect size determined that the significance of this difference is classified as medium (see Table 9).
The returns on assets (ROA) were higher for Voisinistas, with a medium effect size. However, in both systems, returns were not competitive with the interest rates on savings accounts in Brazil for the period (0.0616/year, or 6.16%/year), except for the gross ROA for Voisinistas, which was 0.10.
The gross benefit–cost ratio (BCR; based on expenditures) exceeded interest rates on savings accounts for both systems. However, net BCR (based on total costs) exceeded interest rates on savings only for Voisinistas. Comparing the two systems, the BCR was not significantly different for any method of calculation (see Table 9). To be more attractive than the compensation interest rate on savings, gross BCR must be more than 1.0616, and net BCR must be more than 1.0 because it already includes a 6% return as an opportunity cost.

4. Discussion of the Results

The Voisin system, in the case study of Santa Rosa de Lima, showed better performance when compared with other pasture-based systems in the municipality for most economic variables. Perhaps most important from the farmers’ perspective, Voisinistas had higher gross profits and returns on investment. Some of this can be attributed to more land for dairy production and more cows, but Voisinistas produced 80% more milk/hectare than conventional farmers. Voisinistas also had more assets, though this was counterbalanced by more debt than their conventional counterparts. However, the fact that revenue per hectare and milk production per hectare were both higher on Voisin farms strongly suggests better performance from a purely economic perspective, aside from any ecological or social benefits.
In terms of perceived animal health, Voisin farms also outperform their counterparts. This may be because the Voisin system interrupts cattle parasites’ reproductive cycles. However, both systems have similar expenditures on medicine. The results of perception analysis and expenditures on medicine collected through the accounting project bring attention to the need for a more detailed analysis on the type of medicine purchased (prevention or treatment). If the costs for treatment are equal, then the farmers’ perceptions are misguided.
Other findings were counterintuitive, such as the near-universal use of chemical fertilizers by Voisinistas. Surprisingly, according to the accounting data, 93% of the Voisinistas use chemical fertilizer. Many proponents of rotational grazing claim that the VRG implementation, assuming farmers correctly apply the four laws of VRG, will reduce fertilizer needs [63]. Voisinistas may nonetheless apply fertilizer if: (a) they believe it will increase grass production; (b) they are unaware that chemical fertilizers may reduce soil health over the long term; and/or (c) they are anxious for the fastest results with regards to grass growth. André Voisin does not reject the advantages of fertilizer use and acknowledges its positive impacts on growth rates and productivity [11]. Although the author considers the potential benefits of fertilizer use, he brings attention to the fears around the penetration of fertilizer into the pasture. VRG should be expected to reduce the use of chemical fertilizer but not necessarily eliminate it entirely. In fact, Voisinistas were found to have lower fertilizer expenditures per hectare, though the difference was not significant.
Voisinistas’ greater expenditures per hectare on herbicides were also surprising, though the Voisin system protocol does not mention herbicides. One explanation could be the region’s cultural belief that weeds in pasture areas are a sign of farmer laziness. Voisinistas, in general, engaged in more intensive pasture management than conventional farmers, as measured by overseeding and the use of leguminous plants. Another is that agrochemical salesmen meet with farmers far more often than environmentally friendly extension practitioners and may pressure them to purchase chemical inputs [62]. Although Voisinistas could manage weeds using environment-friendly principles, they may lack knowledge of the necessary practices, be unaware of the negative impacts of herbicides on the environment, cattle, and humans, and be anxious for quick results. Voisinistas nonetheless perceived greater soil biodiversity than conventional farmers, suggesting their greater use of herbicides was probably for crop areas and did not eliminate the ecological benefits of VRG in pasture areas.
Greater spending on feed concentrates was particularly unexpected, because the whole premise of VRG is that it ensures sufficient pasture availability, therefore eliminating the need for supplements. Poor pasture management would justify greater use of supplements [21], and field observations revealed that not all Voisinistas applied all the Voisin laws—for example, just two Voisinistas applied the maximum yield law, which dictates that animals with greater nutritional demand (e.g., lactating cows) should graze a paddock first to achieve the highest quality forage before admitting those with lesser nutritional requirements (e.g., calves). Field observations also showed that some Voisin pastures appeared under-grazed, with abundant forage on farms that were purchasing supplements. Perhaps the best explanation, suggested by evidence that most farmers did not carefully track expenditures and revenues prior to this study, is that farmers were more interested in maximizing output than in maximizing profits, and purchased additional feed to achieve this; productivist ideology is common in agriculture [64].
The finding that Voisinistas used less silage per heifer or cow than conventional farmers was not surprising, especially considering their greater use of feed supplements. Though silage is produced on the farm, it requires more external inputs—such as corn seed, chemical fertilizers, and herbicides—than pasture. However, silage production still reduces the need for external inputs relative to feed concentrates. From an environmentally friendly practices perspective, if it is necessary to complement the animal diet, it is preferable to do so with silage and, if at all possible, without using agrochemicals.
It is also important to note that, although the ROI was higher for Voisinistas, it was still less than the interest rate on savings, a conservative measure of opportunity cost. The average farmer in this study would earn more by liquidating assets, investing the money in a savings account, and finding another job. One explanation is that farmers simply enjoy their work and can sustain themselves on it, so maximizing monetary returns is not their main goal. Farmers are well known for self-exploitation [52]. However, if land values are increasing rapidly, then maintaining land ownership is economically rational: there is considerable evidence that, worldwide, demand for land is based more on the expectation of price increases than on the annual flow of income it provides [65]. Figure 4 shows the price evolution of one hectare of land in Santa Rosa de Lima, according to [66], for the category of land for agriculture. Prices increased by 1888% in the municipality between 1997 and 2015, much greater than returns on a saving account for the same period (407%), calculated with the “citizen calculator” of the Central Brazilian Bank. The price’s evolution does not include the inflation rate for the period. The inflation rate for the period (1997–2015) was about 356% (idem), which still makes the alternative of maintaining land ownership preferable. Accounting for rising land prices, farming is economically rational.
Finally, considering the continued existence of non-Voisin farmers and the use of chemicals by Voisin and non-Voisin farmers alike, it seems that Santa Rosa de Lima’s dairy system has not yet reached a mature level of sustainability, however they are in a process of transformation, as shown by [37]. The farmers are still in the transition phase to environmentally friendly grazing practices.

5. Conclusions

Although the study found that VRG is more economically viable than conventional dairy, there appears to be considerable room for both ecological and economic improvement by reducing reliance on off-farm inputs, a core principle of environmentally friendly practices.
VRG is an important step in the process of transforming conventional dairy into a more sustainable system. Dividing pasture area into paddocks using electric fences, pumping water for the animals, and improving their pastures with overseeding and legumes has improved soil quality and pasture cover, while reducing production costs per liter of milk. Future work with Voisinistas can help them reduce the use of costly, scarce, and environmentally damaging inputs. The same extension agents that helped the farmers adopt VRG are now working with them to develop high biodiversity silvopastoral systems and multi-function riparian zones, environmentally friendly practices intended to simultaneously improve farmer livelihoods and ecosystem health. Financial incentives and the improved dissemination of innovations would help promote wider adoption of silvopastoral VRG. The government, scientists, and technicians all have an important role in this transition. VRG is just a first step in the transition towards an economically and ecologically robust agricultural system.
For advances on the topic, we suggest for future investigations to increase the sample size, conduct analysis of soil, water, and biodiversity inventory in pasture areas for the two systems, and to compare these results with farmer’s perceptions for a more complete and accurate analysis, as sole reliance on farmers’ perceptions has been shown to be insufficient.

Author Contributions

Conceptualization, A.C.B.B.-A., P.A.d.A.S. and J.F.; Formal analysis, A.C.B.B.-A. and J.K.; Funding acquisition, P.A.d.A.S., J.F. and A.S.-F.; Investigation, A.C.B.B.-A.; Methodology, A.C.B.B.-A. and P.A.d.A.S.; Project administration, P.A.d.A.S., J.F. and A.S.-F.; Resources, A.C.B.B.-A., P.A.d.A.S., J.F. and A.S.-F.; Supervision, P.A.d.A.S. and J.F.; Validation, P.A.d.A.S. and J.F.; Visualization, A.S.-F.; Writing—original draft, A.C.B.B.-A. and J.K.; Writing—review & editing A.C.B.B.-A., J.K., P.A.d.A.S. and J.F. All authors have read and agreed to the published version of the manuscript.

Funding

A.C.B.B.-A. was funded by CiVi.net project (contract number 282750 within the 7th Framework Programme of the European Commission), Brazilian Science Council (CNPq), and Brazilian Coordinating Agency for Advanced Training of Graduate Personnel (CAPES).

Informed Consent Statement

Informed consent was obtained from all subjects involved in the study.

Data Availability Statement

The data presented in this study are available on request from the corresponding author. The data are not publicly available due to privacy.

Acknowledgments

The authors thank the reviewers for their valuable contributions. The authors are also very thankful for funds received from the Civi.net project (7th Framework Programme of the European Commission), Brazilian Science Council (CNPq), and Brazilian Coordinating Agency for Advanced Training of Graduate Personnel (CAPES), which allowed us to conduct the fieldwork and supported research. The authors thank Bryan O’Connor and Jennifer Porter for helping with statistical tests. Special thanks to all involved stakeholders in the Santa Rosa de Lima community for participating in the data collection and interviews, and for sharing their valuable knowledge and experience with us.

Conflicts of Interest

The authors declare no conflict of interest.

References

  1. FAOSTAT. Data on Agriculture, Land Use and Emissions for 2015 and 2016. Available online: http://www.fao.org/faostat/en/#data (accessed on 12 August 2018).
  2. Steffen, W.; Richardson, K.; Rockström, J.; Cornell, S.E.; Fetzer, I.; Bennett, E.M.; Biggs, R.; Carpenter, S.R.; de Vries, W.; de Wit, C.A.; et al. Planetary boundaries: Guiding human development on a changing planet. Science 2015, 347, 6223. [Google Scholar] [CrossRef] [PubMed] [Green Version]
  3. Food and Agriculture Organization of the United Nations—FAO. How to Feed the World in 2050. Available online: http://www.scp-knowledge.eu/sites/default/files/knowledge/attachments/How%20to%20Feed%20the%20World%20in%202050.pdf (accessed on 12 November 2016).
  4. Handmer, J.; Honda, Y.; Kundzewicz, Z.W.; Arnell, N.; Benito, G.; Hatfield, J.; Yamano, H. Changes in impacts of climate extremes: Human systems and ecosystems. In Managing the Risks of Extreme Events and Disasters to Advance Climate Change Adaptation: Special Report of the Intergovernmental Panel on Climate Change; Cambridge University Press: Cambridge, UK, 2012; pp. 231–290. [Google Scholar]
  5. Mariconda, P.R. Technological Risks, Transgenic Agriculture and Alternatives. Sci. Stud. 2014, 12, 75–104. [Google Scholar] [CrossRef] [Green Version]
  6. Garnett, T.; Appleby, M.; Balmford, A. Sustainable intensification in agriculture: Premises and policies. Science 2013, 341, 33–34. [Google Scholar] [CrossRef] [PubMed]
  7. De Schutter, O. Report of the Special Rapporteur on the Right to Food, Olivier de Schutter (Final Report): The Transformative Potential of the Right to Food. Available online: https://digitallibrary.un.org/record/766914 (accessed on 9 February 2022).
  8. U.N. Human Rights Council. Report of the Special Rapporteur on the Right to Food A/HRC/34/48. United Nations, 2017. Available online: http://www.refworld.org/docid/58ad94584.html (accessed on 25 September 2017).
  9. Machado, L.C.P. Pastoreio Racional Voisin: Tecnologia Agroecológica Para o Terceiro Milênio, 2nd ed.; Expressão Popular: São Paulo, Brasil, 2010. [Google Scholar]
  10. Melado, J. Pastoreio Racional Voisin: Fundamentos, Aplicações e Projetos; Aprenda Fácil: Viçosa-MG, Brasil, 2003. [Google Scholar]
  11. Voisin, A. Grass Productivity, 2nd ed.; Island Press: Washington, DC, USA, 1988. [Google Scholar]
  12. Winsten, J.; Parsons, R.L.; Hanson, G.D. A profitability analysis of dairy feeding systems in the northeast. Agric. Resour. Econ. Rev. 2000, 29, 220–228. [Google Scholar] [CrossRef] [Green Version]
  13. Murphy, B. Greener Pastures on Your Side of the Fence: Better Farming with Voisin Management Intensive Grazing, 3rd ed.; Arriba Publishing: Colchester, UK, 1994. [Google Scholar]
  14. Federação da Indústria do Estado do Tocantins. Carne Bovina: Plano Estratégico Para as Cadeias Produtivas do Agronegócio no Estado do Tocantins 2018–2027. 2018. Available online: File:///C:/Users/ANDREA/Downloads/FietoCadeiasProdutivasCarneBovina.pdf (accessed on 17 January 2022).
  15. Braga, G.B. Caracterização dos Sistemas de Criação de Bovinos com Atividade Reprodutiva e Estimativa de Prevalência da Brucelose Bovina na Região Centro-Sul do Brasil. Master Dissertation, Medicina Veterinária e Zootecnia, Universidade de São Paulo, São Paulo, Brasil, 2010. [Google Scholar]
  16. De Campos, A.T. Agronegócio do Leite. Available online: http://www.agencia.cnptia.embrapa.br/Agencia8/AG01/arvore/AG01_153_21720039244.html (accessed on 22 August 2018).
  17. Alvez, J.P.; Luiz, A.; Fo, S.; Farley, J.C.; Erickson, J.D. Agroecology and sustainable food systems transition from semi-confinement to pasture-based dairy in Brazil: Farmers’ view of economic and environmental performances. Agroecol. Sustain. Food Syst. 2013, 2015, 37–41. [Google Scholar]
  18. Dartt, B.A.; Lloyd, J.W.; Radke, B.R.; Black, J.R.; Kaneene, J.B. A comparison of profitability and economic efficiencies between management-intensive grazing and conventionally managed dairies in Michigan. J. Dairy Sci. 1999, 82, 2412–2420. [Google Scholar] [CrossRef]
  19. Gillespie, J.; Nehring, R.; Hallahan, C.; Sandretto, C. Pasture-based dairy systems: Who are the producers and are their operations more profitable than conventional dairies? Aust. J. Agric. Resour. Econ. 2009, 34, 412–427. [Google Scholar]
  20. Hanson, J.C.; Johnson, D.M.; Lichtenberg, E.; Minegishi, K. Competitiveness of management-intensive grazing dairies in the Mid-Atlantic Region from 1995 To 2009. J. Dairy Sci. 2013, 96, 1894–1904. [Google Scholar] [CrossRef]
  21. Parker, J.; Muller, L.D.; Buckmaster, D.R. Management and economic implications of intensive grazing on dairy farms in the northeastern states. J. Dairy Sci. 1992, 75, 2578–2597. [Google Scholar] [CrossRef]
  22. Alvez, J.P. Livestock Management, Ecosystem Services, and Sustainable Livelihoods. Ph.D. Dissertation, Natural Resource, University of Vermont, Burlington, VT, USA, 2012. [Google Scholar]
  23. Tauer, L.W.; Mishra, A.K. Dairy farm cost efficiency. J. Dairy Sci. 2006, 89, 4937–4943. [Google Scholar] [CrossRef] [Green Version]
  24. Meurer, F.G. Percepção dos Produtores de Leite a Respeito dos Serviços Ambientais Resultantes da Adoção do Pastoreio Voisin. Undergraduate Thesis, Ciências Agronômicas, Universidade Federal de Santa Catarina, Santa Catarina, Brazil, 2008. [Google Scholar]
  25. Bauer, E. Produção de Leite na Grande Florianópolis: Percepção dos Agricultores Familiares Sobre a Transição do Semi-confinamento Tradicional Para o Pastoreio Voisin. Undergraduate Thesis, Ciências Agronômicas, Universidade Federal de Santa Catarina, Florianópolis-SC, Brazil, 2009. [Google Scholar]
  26. Bolland, M.D.A.; Guthridge, I.F.; Blincow, G. Response of intensively grazed ryegrass dairy pastures to fertilizer phosphorus and potassium. Nutr. Cycling Agroecosyst. 2011, 90, 281–298. [Google Scholar] [CrossRef]
  27. DeRamus, H.A.; Clement, T.C.; Giampola, D.D.; Dickison, P.C. Methane emissions of beef cattle on forages: Efficiency of grazing management systems. J. Environ. Qual. 2003, 32, 269–277. [Google Scholar] [CrossRef]
  28. Goulding, K.; Jarvis, S.; Whitmore, A. Optimizing nutrient management for farm systems. Philos. Trans. R. Soc. B Biol. Sci. 2008, 363, 667–680. [Google Scholar] [CrossRef] [PubMed] [Green Version]
  29. Farley, J.; Schmitt, F.A.; Alvez, J.; De Freitas, N.R., Jr. How valuing nature can transform agriculture. Solut. Sustain. Desirable Future 2012, 2, 64–73. [Google Scholar]
  30. Myers, N.; Mittermeier, R.A.; Mittermeier, C.G.; da Fonseca, G.A.B.; Kent, J. Biodiversity hotspots for conservation priorities. Nature 2000, 403, 853–858. [Google Scholar] [CrossRef] [PubMed]
  31. Joly, C.A.; Metzger, J.P.; Tabarelli, M. Tansley review experiences from the Brazilian Atlantic Forest: Ecological findings and conservation initiatives. New Phytol. 2014, 204, 459–473. [Google Scholar] [CrossRef] [Green Version]
  32. EPAGRI/CEPA. Síntese Anual da Agricultura de Santa Catarina 2013–2014. Available online: http://docweb.epagri.sc.gov.br/website_cepa/publicacoes/Sintese_2014.pdf (accessed on 12 November 2014).
  33. Worldatlas. Economics. Available online: https://www.worldatlas.com/economics/ (accessed on 25 August 2018).
  34. EPAGRI/CEPA. Tabelas de Produção. Available online: http://www.epagri.sc.gov.br/?page_id=2623 (accessed on 15 January 2018).
  35. Instituto Brasileiro De Geografia E Estatística—IBGE. Pecuária 2013—Santa Catarina. Available online: http://www.ibge.gov.br/estadosat/temas.php?sigla=sc&tema=pecuaria2013 (accessed on 13 March 2018).
  36. Instituto Brasileiro De Geografia E Estatística—IBGE. Censo Agropecuário de 2006. Available online: https://biblioteca.ibge.gov.br/visualizacao/periodicos/51/agro_2006.pdf (accessed on 28 March 2018).
  37. Brasileiro-Assing, A.C.B.; Sattler, C.; Schröter, B.; Alvez, J.P.; Sinisgalli, P.A.d.A.; Schmitt Filho, A. Social-Ecological System Transformation and Learning: The case of Santa Rosa de Lima’s dairy system, Brazil. Ambient. Soc. 2021, 24, 1–23. [Google Scholar]
  38. Brugnara, D. Estudo de Viabilidade Econômica na Implantação do Pastoreio Racional Vosin no Sítio Santa Lúcia—SC. Undergraduate Thesis, Centro de Ciências Agrárias, Universidade Federal de Santa Catarina, Florianópolis-SC, Brazil, 2015. [Google Scholar]
  39. Dias, A.H. Planejamento, Implantação e Avaliação de um Sistema de Pastoreio Racional Voisin com Gado de Leite Orientado à Agricultura Familiar. Undergraduate Thesis, Ciências Rurais, Universidade Federal de Santa Catarina, Curitibanos-SC, Brazil, 2014. [Google Scholar]
  40. Machado, L.C.P. Jeito de ganhar mais: Pastoreio Racional Voisin. Cultivar. Bovinos. 2004, 5, 26–27. [Google Scholar]
  41. Hoffmann, V.; Probst, K.; Christinck, A. Farmers and researchers: How can collaborative advantages be created in participatory research and technology development? Agric. Hum. Values 2007, 24, 355–368. [Google Scholar] [CrossRef]
  42. Rech, L.M.; City Hall, Santa Rosa de Lima-S.C, Brazil. Personal communication, 2013.
  43. Instituto Brasileiro De Geografia E Estatística—IBGE. Desenvolvimento Sustentável Brasil. 2010. Available online: http://www.ibge.gov.br/home/geociencias/recursosnaturais/ids/ids2010.pdf (accessed on 28 March 2018).
  44. Brasileiro-Assing, A.C.B. Agroecology: A Proposal for Livelihood, Ecosystem Services Provision and Biodiversity Conservation for Small Dairy Farms in Santa Catarina. Ph.D. Thesis, Instituto de Energia e Ambiente, Universidade de São Paulo, São Paulo, Brazil, 2018. [Google Scholar]
  45. Francisco, F. Pagamento por Serviços Ecossistêmicos Para os Custos do Cumprimento da Legislação Ambiental em Pequenas Propriedades Familiares do Entorno do Parque Estadual Serra do Tabuleiro-SC. Undergraduate Thesis, Ciências Agronômica, Universidade Federal de Santa Catarina, Florianópolis-SC, Brazil, 2012. [Google Scholar]
  46. Jeremias, V. Success Factors and Constrains of Community Based Ecosystem Management: A Case Study of the Voisin Rotation Grazing System in a Rural Community in Brazil. Master’s Thesis, Environmental Systems Analysis, Wageningen University, Wageningen, The Netherlands, 2012. [Google Scholar]
  47. Longo, C.; Schmitt Filho, A.L.; Hotzel, M.J.; Farley, J. A visão dos produtores dos Laticínios do Sul de Santa Catarina sobre a transição para o sistema de pastoreio Voisin. Cad. De Agroecol. 2013, 8, 1–6. [Google Scholar]
  48. Comitê de Pronunciamentos Contábeis—CPC. Pronunciamentos Técnicos Contábeis. Available online: http://www.cpc.org.br/CPC/Documentos-Emitidos/Pronunciamentos (accessed on 22 August 2018).
  49. Garrison, R.H.; Noreen, E.W.; Brewer, P.C. Managerial Accounting, 14th ed.; McGraw-Hill: New York, NY, USA, 2011. [Google Scholar]
  50. Martins, E. Contabilidade de Custos, 11th ed.; Atlas: São Paulo, Brazil, 2015. [Google Scholar]
  51. Archer, E.; Pavela, G.; Lavie, C.J. The inadmissibility of what we eat in America and NHANES dietary data in nutrition and obesity research and the scientific formulation of national dietary guidelines. Mayo Clin. Proc. 2015, 90, 911–926. [Google Scholar] [CrossRef] [PubMed] [Green Version]
  52. Galt, R.E. The moral economy is a double-edged sword: Explaining farmers’ earnings and self-exploitation in community-supported agriculture. Econ. Geogr. 2013, 89, 341–365. [Google Scholar] [CrossRef]
  53. Averkamp, H. Net Income. Available online: http://www.accountingcoach.com/blog/what-is-net-income (accessed on 15 April 2016).
  54. Averkamp, H. Opportunity Cost. Available online: http://www.accountingcoach.com/terms/O/opportunity-cost (accessed on 1 January 2016).
  55. Embrapa. Gado de Corte. 2018. Available online: https://cloud.cnpgc.embrapa.br/sac/2012/09/14/como-faco-para-calcular-quantos-ua%c2%b4sha-ou-lotacao-animal/#:~:text=Para%20calcular%20quantas%20UAs%20tem,vaca%20seca%20de%20450%20kg (accessed on 30 January 2022).
  56. Fritz, C.O.; Morris, P.E.; Richler, J.J. Effect size estimates: Current use, calculations, and interpretation. J. Exp. Psychol. Gen. 2012, 141, 2–18. [Google Scholar] [CrossRef] [PubMed] [Green Version]
  57. Lindenau, J.D.-R.; Guimarães, L.S.P. Calculando o tamanho de efeito no SPSS. Rev. HCPA 2012, 32, 363–381. [Google Scholar]
  58. Tilman, D.; Downing, J.A. Biodiversity and stability in grasslands. Nature 1994, 367, 363–365. [Google Scholar] [CrossRef]
  59. Soder, K.J.; Rotz, C.A. Economic and environmental impact of four levels of concentrate supplementation in grazing dairy herds. J. Dairy Sci. 2001, 84, 2560–2572. [Google Scholar] [CrossRef]
  60. Sheriff, G. Efficient waste? why farmers over-apply nutrients and the implications for policy design. Appl. Econ. Perspect. Policy 2005, 27, 542–557. [Google Scholar] [CrossRef]
  61. Ledgard, S.F.; Penno, J.W.; Sprosen, M.S. Nitrogen inputs and losses from clover/grass pastures grazed by dairy cows, as affected by nitrogen fertilizer application. J. Agric. Sci. 1999, 132, 215–225. [Google Scholar] [CrossRef]
  62. Lechenet, M.; Dessaint, F.; Py, G.; Makowski, D.; Munier-Jolain, N. Reducing pesticide use while preserving crop productivity and profitability on arable farms. Nat. Plants 2017, 3, 17008. [Google Scholar] [CrossRef]
  63. Undersander, D.J.; Albert, B.; Cosgrove, D.; Johnson, D.; Peterson, P. Pastures for Profit: A guide to Rotational Grazing; Cooperative Extensiton Publications, University of Wisconsin-Extension: Madison, WI, USA, 2002. [Google Scholar]
  64. Capellesso, A.J.; Cazella, A.A.; Schmitt Filho, A.L.; Farley, J.; Martins, D.A. Economic and environmental impacts of production intensification in agriculture: Comparing transgenic, conventional and agroecological maize crops. Agroecol. Sustain. Food Syst. 2015, 40, 215–236. [Google Scholar] [CrossRef]
  65. Bezemer, D.; Hudson, M. Finance is not the economy: Reviving the conceptual distinction. J. Econ. Issues 2016, 50, 745–768. [Google Scholar] [CrossRef] [Green Version]
  66. EPAGRI/CEPA. Preço Terra. 2016. Available online: https://cepa.epagri.sc.gov.br/index.php/produtos/mercado-agricola/precos-de-terra-agricola/ (accessed on 18 October 2016).
Figure 1. The curve of re–growth in the grass. Source: Adapted from [11].
Land 11 00294 g001
Figure 2. Farmers’ Sample Location. Source: [44].
Land 11 00294 g002
Figure 3. Accounting Analysis framework for Dairy Activity.
Land 11 00294 g003
Figure 4. Price evolution of one rural hectare in Santa Rosa de Lima. Source: [66].
Land 11 00294 g004
Table 1. Percentage of farmers that use agrochemicals and perceived improvement of soil quality, biodiversity, and animal health during the ten years prior to the interview.
VariablesVoisin (n = 15)Conventional (n = 12)p-ValueEffect Size
PercentagePercentage r1PS 2 (%)
Use of chemical fertilizer on pasture area80%35%0.004 0.4576
Use of herbicides50%25%0.107
Farmers that perceived improvement of soil porosity 75%15%<0.0001 0.6790
Farmers that perceived improvement of soil moisture85%20%<0.0001 0.7091
Farmers that perceived improvement of soil biodiversity 55%35%0.064 0.2966
Farmers that perceived improvement of animal health95%40%<0.0001 0.6689
1 Cohen’s effect size for non-parametric data. r ≤ 3 = small, 3 < r < 5 = medium, and r ≥ 5 = large effect size. 2 Probability of Superiority. Denotes significance at α = 0.10.
Table 2. Percentage of farmers that use pasture improvement techniques and a variety of grasses and leguminous plants in the pasture area.
VariablesVoisin (n = 15)Conventional (n = 12)p-ValueEffect Size
Percentage/AveragePercentage/Average r1d2PS 3 (%)
Winter overseeding95%10%<0.0001 0.84 98
Improvement of pasture100%65%0.004 0.45 76
Variety of grasses3.582.30.008 0.9475
Variety of leguminous plants1.761.30.026 0.7269
1 Cohen’s effect size for non-parametric data. r ≤ 3 = small, 3 < r < 5 = medium, and r ≥ 5 = large effect size. 2 Cohen’s effect size for parametric data. d ≤ 0.2 = small, 0.2 < d < 0.8 = medium, and d ≥ 0.8 = large effect size. 3 Probability of Superiority. Denotes significance at α = 0.10.
Table 3. Percentage of farmers that perceived decreased workload during ten years prior to the interview, and the average of family members receiving income from sources other than dairy activity.
VariablesVoisin (n = 15)Conventional (n = 12)p-ValueEffect Size
Percentage/AveragePercentage/Average r1PS 2
Decrease of workload10%50%0.074 0.2865
Income from other sources0.951.40.151
1 Cohen’s effect size for non-parametric data. r ≤ 3 = small, 3 < r < 5 = medium, and r ≥ 5 = large effect size. 2 Probability of Superiority. Denotes significance at α = 0.10.
Table 4. Average rations and silage used per cow and heifer per day.
VariablesVoisin (n = 15)Conventional (n = 12)p-ValueEffect Size
AverageSD 3AverageSD d1PS 2
Rations (Kg/cow and heifer/day)1.651.241.050.960.181
Silage (Kg/cow and heifer/day)6.493.728.842.270.067 0.7670
1 Cohen’s effect size for parametric data. d ≤ 0.2 = small, 0.2 < d < 0.8 = medium, and d ≥ 0.8 = large effect size. 2 Probability of Superiority. 3 Standard deviation. Denotes significance at α = 0.10.
Table 5. Farm Characteristics.
VariablesVoisin (n = 15)Conventional (n = 12)p-ValueEffect Size
AverageSD 1AverageSD d2PS 3
Dairy farm area (Ha)15.855.8812.293.920.084 0.7169
Pasture area (Ha)11.455.828.752.670.126
Cropped land (Ha)4.43.23.541.740.411
Number of animals (cows, heifers, steers, calves, and bulls)48.4714.8932.7514.350.010 1.0778
Total animal units (AU)35.912.1125.2213.440.040 0.8372
Number of cows23.339.5812.925.990.003 1.3082
Stocking rate of pasture area (animal/ha)4.922.163.541.740.196
Stocking rate of pasture area (AU/ha)3.631.773.142.020.508
Stocking rate of dairy farm area (animal/ha)3.361.542.871.370.392
Stocking rate of dairy farm area (AU/ha)2.491.322.271.490.692
1 Standard deviation. 2 Cohen’s effect size for parametric data. d ≤ 0.2 = small, 0.2 < d < 0.8 = medium, and d ≥ 0.8 = large effect size. 3 Probability of Superiority. Denotes significance at α = 0.10.
Table 6. Monthly farm inputs divided per hectare, animal unit (AU), and hectare.
VariablesVoisin (n = 15)Conventional (n = 12)p-ValueEffect Size
AverageSD 1AverageSD d2PS 3
Expenditures 4 (USD/hectare/month)89.9371.4255.4730.590.132
Expenditures (USD liter/month)0.210.040.250.080.181
Expenditures (USD/AU/month)34.3915.7926.6710.690.160
Total costs 5 (USD/hectare/month)186.71103.77142.5054.100.194
Total costs (USD/liter/month)0.510.240.700.310.089 0.6768
Total costs (USD/AU/month)75.4320.5575.5736.640.990
Unpaid labor (USD/hectare/month)72.3329.8775.4527.080.781
Unpaid labor (USD/liter/month)0.240.190.380.170.053 0.7970
Unpaid labor (USD/AU/month)31.2512.2541.5220.440.144
Paid labor (USD/hectare/month)0.340.350.310.550.880
Paid labor (USD/liter/month)0.000.000.000.000.952
Paid labor (USD/AU/month)0.160.180.100.140.358
Rations (USD/hectare/month)49.5858.8721.6916.030.125
Rations (USD/liter/month)0.100.040.090.050.590
Rations (USD/AU/month)17.4611.789.906.410.057 0.7970
Fertilizer (USD/hectare/month)7.103.879.639.600.406
Fertilizer (USD/liter/month)0.020.010.040.020.039 0.9274
Fertilizer (USD/AU/month)3.131.843.652.560.355
Herbicides (USD/hectare/month)1.330.940.710.610.058 0.7870
Herbicides (USD/liter/month)0.000.000.000.000.934
Herbicides (USD/AU/month)0.530.210.420.470.495
Total feed (USD/hectare/month)80.4066.1250.6229.310.161
Total feed (USD/liter/month)0.180.040.220.090.190
Total feed (USD/AU/month)30.6514.9224.2311.140.227
Medication costs (USD/hectare/month)3.925.331.560.890.113
Medication costs (USD/liter/month)0.010.010.010.000.893
Medication costs (USD/AU/month)1.542.220.870.630.323
Opportunity costs (USD/hectare/month)78.9732.2180.3929.620.907
Opportunity costs (USD/liter/month)0.250.190.410.170.046 0.8171
Opportunity costs (USD/AU/month)33.8912.0243.9221.040.160
1 Standard deviation. 2 Cohen’s effect size for parametric data. d ≤ 0.2 = small, 0.2 < d < 0.8 = medium, and d ≥ 0.8 = large effect size. 3 Probability of Superiority. 4 Direct costs. 5 Direct plus indirect expenses. Denotes significance at α = 0.10.
Table 7. Cow and land productivity, revenue per hectare and animal unit (AU), percentage of revenue from milk and animal sales on total sales, and coefficient of milk production variation.
VariablesVoisin (n = 15)Conventional (n = 12)p-ValueEffect Size
AverageSD 1AverageSD d2PS 3
Cow productivity (liter/cow/day)12.384.4310.062.800.128
Milk(liter)/hectare426.78303.20237.24172.310.066 0.7670
Revenue (USD/hectare/month)198.55132.30123.8477.930.096 0.6868
Revenue (USD/AU/month)78.0531.0960.5226.130.131
Milk sales (% of total sales)0.940.080.860.180.149
Animal sales (% of total sales)0.060.080.140.180.149
Coefficient of milk production variation0.1960.0790.2430.0840.146
1 Standard deviation. 2 Cohen’s effect size for parametric data. d ≤ 0.2 = small, 0.2 < d < 0.8 = medium, and d ≥ 0.8 = large effect size. 3 Probability of Superiority. Denotes significance at α = 0.10.
Table 8. Farm assets and debts.
VariablesVoisin (n = 15)Conventional (n = 12)p-ValueEffect Size
AverageSD 1AverageSD d2PS 3
Assets (USD)194,676.7057,435.24154,310.2755,685.420.078 0.7169
Debts (USD)24,887.3820,655.614398.256911.960.002 1.3382
Balance (assets − debts) (USD)169,789.3260,169.21149,912.0256,320.330.389
1 Standard deviation. 2 Cohen’s effect size for parametric data. d ≤ 0.2 = small, 0.2 < d < 0.8 = medium, and d ≥ 0.8 = large effect size. 3 Probability of Superiority. Denotes significance at α = 0.10.
Table 9. Profitability measures.
VariablesVoisin (n = 15)Conventional (n = 12)p-ValueEffect Size
AverageSD 1AverageSD d2PS 3
Gross Profit (USD/hectare/month)108.6264.0168.3654.540.096 0.6768
Gross Profit (USD/liter/month)0.270.060.290.160.537
Gross Profit (USD/AU/month)43.6618.1033.8423.460.231
Net Profit (USD/hectare/month)11.8355.41−18.6763.360.194
Net Profit (USD/liter/month)−0.040.23−0.160.340.292
Net Profit (USD/AU/month)2.6226.00−15.0539.100.172
Gross ROA0.100.070.060.040.081 0.7269
Net ROA0.010.05−0.020.060.068 0.7369
Gross BCR2.380.672.400.900.946
Net BCR1.060.350.910.430.356
1 Standard deviation. 2 Cohen’s effect size for parametric data. d ≤ 0.2 = small, 0.2 < d < 0.8 = medium, and d ≥ 0.8 = large effect size. 3 Probability of Superiority. Denotes significance at α = 0.10.
Publisher’s Note: MDPI stays neutral with regard to jurisdictional claims in published maps and institutional affiliations.

