Abstract
Collusive bidding is a severe unethical and illegal practice in urban construction projects. This practice has been identified as the primary inhibitor of sustainable urban development. Collusive bidding is formed and can be profoundly impacted by the urban environment. Identifying the transmission routes of the impacts of the urban environment on collusive bidding is conducive to urban governors formulating collusive governance countermeasures to create a healthy pace of urbanization. Therefore, this study adopts the bootstrap method to empirically analyze the influence paths from the urban environment to bidders’ collusive willingness. The data come from 675 collusion cases in China’s urban construction projects and city environmental data. The research concludes that the urban environment affects collusive willingness mainly through indirect pathways. The number of collusive companies is the most critical mediating variable in the indirect path. Besides, when the collusive project and leading colluder are in the same province, little indirect utility can also be transmitted through the project profitability. These findings extend the body of knowledge on collusion-related studies in urban research. The study also offers practical implications, suggesting that urban governors and owners should take countermeasures to increase the difficulty of bidders to form a collusion team, thereby inhibiting collusive bidding.
1. Introduction
The world is undergoing the largest wave of urban growth in history. About 56.2% of the global population now live in cities, and this number will increase to about 70% by 2050 [1]. This continuing growth of urban populations has positive effects on the pace of urbanization. Urbanization is a process of social and economic transformation [2,3,4,5]. It includes not only the decrease in the agricultural population, the continuous increase of the urban population, and the expansion of urban land to the suburbs, but also the process of urban social, economic, and technological changes entering the countryside [3]. This practice is becoming the most important human social change in the world, especially in developing countries [3,5,6].
As one of the largest developing countries in the world, China has been experiencing rapid urbanization and has initiated a large number of construction projects to satisfy the need of urban development since the 1980s [2]. This rapid development has witnessed the rise of frequent collusive bidding cases in urban construction projects [7,8,9]. For example, the Chinese police exposed construction company collusion with bidders in 78 projects through a unified quotation method from 2015 to 2018 [10]. Besides, many international scholars also show collusive bidding frequently in their countries’ construction projects (i.e., the Netherlands, the United States, Japan, South Africa, Nigeria, Norway, and Australia) [11,12,13,14,15,16,17]. It follows that China has been facing an overwhelming challenge in preventing collusive bidding in urban construction projects [7]. Collusive bidding is probably the most serious practical threat to sustainable urbanization.
In a collusive bidding scheme, a cartel bidder is allowed by other cartel bidders to win a particular bid and obtain the most significant possible benefit from it [17,18,19]. It is proven in practice that collusive projects are always accompanied by chaotic management, serious safety risks, and quality problems, threatening society’s public safety [20,21]. For example, the Chinese police seized a collusive bidding case involving more than 700 million yuan and tested the project it was building, and found that the project had serious quality problems [22]. Besides, previous studies have verified that the offer made during collusive bidding is higher than during non-collusive bidding [17,23,24]. Moreover, collusion among cartel bidders creates a non-competitive bidding environment [18], seriously disrupting the urban market order and leading to the failure of market resource allocation [25].
Contingency theory points out that behavioral decision-making results from individual characteristics and the external environment [26]. It is inferred that collusive bidding will be impacted by the urban environment [27]. First, collusive willingness is affected by the fluctuations of the socio-economic environment [28]. Second, with an increase in industrial competition intensity, bidders’ survival pressure is enhanced, resulting in some companies colluding to obtain projects to avoid being eliminated by the market [28]. Dorée [29] verified that the higher the industrial competition intensity, the more collusive bidding there is in the market. Third, collusion in the same area has always been the focus of collusion governance. This social phenomenon reveals that the geographical environment is one of the critical factors affecting collusive willingness. These studies reveal that socio-economic, industrial, and geographical factors in the urban environment significantly impact collusive willingness.
However, the effect of socio-economic, industrial, and geographical factors on the transmission routes of collusive willingness is rarely mentioned. This is surprising as there are obvious policy implications from identifying the transmission routes of the impact of urban environment on collusive willingness. Therefore, the study uses socio-economic, industrial, and geographical factors to represent the urban environment and adopts the empirical analysis method to verify the influence path from the urban environment to bidders’ collusive willingness. The results will help urban governors to understand the mediation of the influence of the urban environment on collusive willingness, in order to propose collusion governance measures from the perspective of blocking the intermediary.
2. Theoretical Background and Hypotheses
Collusive bidding is a pervasive problem in urban construction projects, especially in public projects [9,17]. In practice, this unethical behavior is influenced by various urban environmental factors [30]. As Gupta [23] stated, bidders behave within competitive rules when the economy is strong, and the gains of not colluding become larger during economic expansions. Collusion is often linked to theories about oligopolies. Thus, industrial competition is seen as an important urban environmental factor in collusion [31]. Albano et al. [32] verified that collusive bidding is more likely to emerge in a predictable and transparent industry environment. Roux and Thöni [33] found that the bidder’s determination to collude erodes as competition intensity ascends. Besides, due to the colluders considering the transportation costs of participating in the project before making a decision, Padhi and Mohapatra [34] pointed out that the distance of a project site from the enterprise location is a crucial urban environmental factor of bidders’ collusive decisions. For example, further distances and greater transportation expenses may increase the bidder’s collusive cost, reducing their collusive willingness. Accordingly, we propose the following hypothesis:
Hypothesis 1 (H1).
The urban environment has a significant influence on collusive willingness.
The economic theory of crime suggests that a firm joins a collusion if the expected net gain is positive [12]. Wang et al. [28] implied that the lower the industrial competition intensity, the higher the winning bid price by the colluders and the higher the collusive profit. The above research shows that the urban environment has a non-negligible effect on colluders’ interest pursuit [35]. In a study of the relationship between collusive profit and collusive willingness, Fonseca and Normann [36] indicated that whether the colluders initiate a collusion is mainly due to whether the economic benefits brought by the collusion are greater than their economic costs. Bolotova et al. [24] displayed that bid riggers are more intent on colluding if the external environment is supportive of them gaining sufficient profits from initiating such illegal competition. Besides, cost–benefit analysis on collusion also implies that bidders are more intent in colluding with one another if the external environment is supportive of them earning profits from initiating such illegal competition [24]. Accordingly, we propose the following hypothesis:
Hypothesis 2 (H2).
The influence of the urban environment on collusive willingness will be intermediated by project profitability.
Porter and Zona [37] argued that the influx of collusive companies into a regional market is enslaved to the prosperity of economic conditions. This is due to the leading collusive bidder’s need to pay more collusion costs to collusive team members in the economic development zones. Besides, the higher the competition intensity, the more the survival pressure companies have. Consequently, there will be more collusive companies in the market if competition for regular business keeps intensifying [31]. These studies indicate that the urban environment has a significant influence on the number of collusive companies. Besides, Fonseca and Normann [36] found that the formation of cartels depends on the number of collusive companies. The greater the number of collusive companies, the more chances there are to win collusive projects and the higher the willingness of bidders to launch a collusion. Therefore, we propose the following hypothesis:
Hypothesis 3 (H3).
The influence of the urban environment on collusive willingness will be intermediated by the number of collusive companies.
In the collusive process, bidders’ collusive decisions must follow a sequence. First, bidders will measure the profitability of a collusive project and evaluate the benefits provided by the collusive project [36]. According to utility theory, the bidders are willing to collude only when they believe that the project can provide them with benefits. It is inferred that project profitability is an essential factor in the bidder’s collusive willingness. After that, the colluders contract other bidders to form a collusion team, and the team’s number will have a significant impact on collusive willingness [36]. When colluders decide whether to initiate a collusion, if the collusion project can provide them with benefits and colluders can contact more collusive companies to participate in their collusive team, it will inevitably increase their collusive willingness. The influence of the urban environment on collusive willingness will inevitably be mixed into this series of decisions. Therefore, we propose the following hypothesis:
Hypothesis 4 (H4).
The influence of the urban environment on collusive willingness will be dually intermediated by project profitability and the number of collusive companies.
Based on H1, H2, H3, and H4, the conceptual model developed in this study is shown in Figure 1.
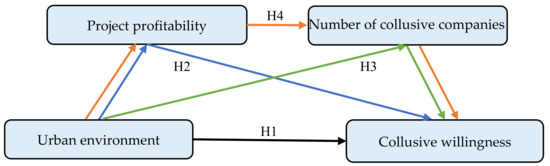
Figure 1.
Conceptual model.
3. Methodology
The research process is shown in Figure 2. First, the theoretical hypotheses are put forward based on the literature review. Second, the research data are collected. Third, the path analysis method is used to verify the significance of the conduction path’s total effect, direct effect, and indirect effect, and the effect value is calculated. Fourth, every indirect conduction path is identified and every indirect conduction path’s effect value is calculated. Finally, the hypotheses are tested and the results are discussed.
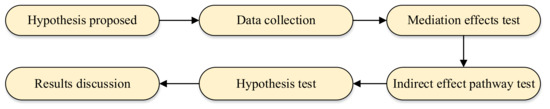
Figure 2.
Research process.
3.1. Bootstrap Approach
The bootstrap approach was introduced in the late 1970s by Hartigan [38] as a statistical inference technique that essentially consists of a computational resampling procedure capable of estimating parameters and obtaining the confidence interval of random variables with an unknown probability distribution from limited available data [39]. This method is not only used to test whether relationships between adjacent constructs (i.e., direct relationships) are statistically significant, but also to offer much more beyond the assessment of this, such as testing the significance of both non-direct effects and the coefficient of determination, as well as a formal comparison of effects [40]. Therefore, this study selects the bootstrap method to test the direct, indirect, and total effects of the urban environment on collusive willingness. The bootstrap approach checks whether each path is significant by calculating the confidence interval of the product of path coefficients. If the 95% confidence interval of the tested path coefficient product does not include the number 0, then the path is significant; if the 95% confidence interval of the path coefficient product consists of the number 0, the path is not significant.
3.2. Variables
3.2.1. Dependent Variable
Collusive willingness (CW): the number of collusions formed by a bidder reflects the strength of the bidder’s willingness to collude. The more the number of collusions, the more the willingness to launch a collusion. Therefore, the number of collusions was used to quantify the bidder’s collusive willingness.
3.2.2. Mediating Variables
Number of collusive companies (NCB): the bidder’s incentives to form a collusion depend on the number of collusive companies (NCB) [41,42]. NCB quantifies the total number of collusive companies in collusive cases.
Winning bid price (WBP): The larger the winning bid price, the larger the project scale and the higher the profit [28]. Therefore, the research selects the WBP as a quantitative indicator of project profitability.
3.2.3. Independent Variables
This study’s urban environment is measured by three urban environmental factors, including socio-economic development, industrial competitive environment, and geographical characteristic. The three independent variables are described below.
Socio-economic development: this variable is quantified using the indicators of per capita gross domestic product (PGDP) [35,42,43] and average wage in society (AW) [44].
Industrial competitive environment: the study selects five variables: the number of construction companies (NB), the gross construction output value (GCOV), floor space of building under construction (FSBC), the total construction profit (TP), and the average wages in construction (CWG) to represent the construction industrial competitive environment [7,28,45].
Geographical characteristic: Bajari and Ye [46] show that the distance from the bidder’s address to the project location is important because it affects the operation cost of the company. Oo et al. [47] revealed that bidders might make different bidding decisions in different regions. Bai et al. [48] believe that all business–government interactions occur at the provincial government level. Thus, the distance (DI), region, and whether the leading colluder and the project are in the same province (SP) are used to quantify the geographical environment. DI is the shortest distance from the lead colluder to the project site, as recommended by Price [49]. Region is defined by the eastern, central, and western regions, with the eastern region being the most economically developed region in China, followed by the central and western regions [7].
3.3. Data
3.3.1. Data Collection and Descriptive Statistics
The research data is mainly obtained through the following three steps. First, from the website China Judgment Online, we extracted collusive bidding cases. China Judgment Online was established by The Supreme People’s Court of China and uniformly publishes judgment documents of people’s court cases at all levels. The collusion cases published on this website are highly reliable, ensuring the authenticity of the collected data [7]. Afterward, the research was based on the data collected in criminal cases to obtain data related to the socio-economic development and industrial competition environment from the China Statistical Yearbooks [28]. In addition, we also used China’s Baidu Map to obtain the shortest distance between collusive project and lead colluder, to quantify the geographic characteristic [49]. Finally, we acquired 675 collusive projects, spanning the period from 2010 to 2019. These collusive projects are distributed in different provinces across China (Figure 3). Table 1 provides the descriptive statistics and definitions of the relevant variables in this study.
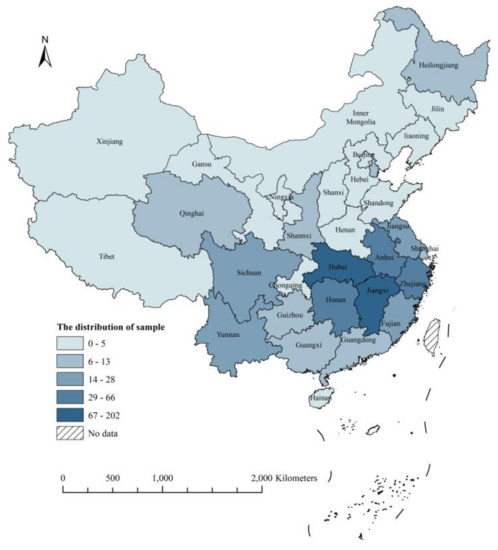
Figure 3.
The distribution of samples.

Table 1.
Descriptive statistics and Definitions.
3.3.2. Industrial Competitive Environment Dimensionality Reduction
This study uses five variables to represent the industrial competitive environment. However, these five variables have an extremely high correlation to each other (Table 2), which affects the accuracy of regression results. Therefore, the research uses principal component analysis to reduce the dimensions of the five variables—NB, GCOV, FSBC, TP, and CWG—on industrial competition environment, thereby eliminating the influence of multi-collinearity on the models.
Table 2.
Correlation Matrix.
Before the principal component analysis, the Kaiser–Meyer–Olkin (KMO) value of the variables needed to be tested. The KMO value of the final extraction result was 0.872 > 0.8, and the significance was 0, indicating that it was very suitable for principal component analysis (Table 3).
Table 3.
KMO and Bartlett’s Test.
Table 4 shows the factors extracted by principal component analysis according to the feature value of 1. It can be seen from the Table 4 that one factor is extracted, the factor variance percentage is 72.67%, and the characteristic value is 3.634. Figure 4 shows the gravel diagram of the extracted factors. It can be seen from Figure 4 that there is only one factor with a characteristic value greater than 1. Therefore, the study selected component 1 to represent the industrial competition environment. Table 5 shows the correlation component matrix of component 1.
Table 4.
Total Variance Explained.
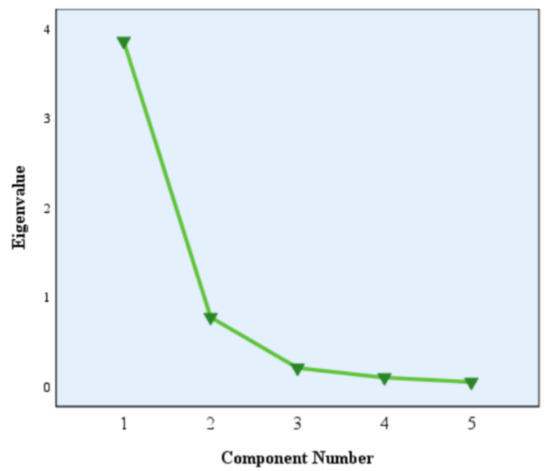
Figure 4.
Principal component extraction lithotriptic map of industry competitive environment.
Table 5.
Component Matrix.
According to mathematical statistics, the mathematical relationship between the principal component load matrix U, the factor load matrix A, and the eigenvalue λ is obtained by the formula: . The value of the eigenvector U is show in Table 6. It was obtained by the above formula and the relevant data in Table 4 and Table 5.
Table 6.
Principal component load matrix U.
Finally, the expression of principal component 1 is as follows:
ICE = 0.49 × NF + 0.50 × GPCI + 0.49 × SGMD + 0.48 × PF + 0.18 × CWG
ICE represents the industrial competition environment after dimensionality reduction.
4. Results
4.1. Influence Paths of the Urban Environment on Collusive Willingness
Table 7 shows the significance and the effect values of the direct path, indirect path, and total path of the influences of the urban environment on collusive willingness. In the socio-economic dimension, the direct effect value of social development level (WG) on collusive willingness is 2.346, accounting for 27%, and the indirect effect value is 6.399, accounting for 73%. However, the CI value of the direct effect is [LLCI, ULCI] = [−0.706, 5.397], and this interval contains 0, indicating that the direct effect is not significant. This result shows that the influence of WG on collusive willingness is wholly transmitted through the indirect paths. The direct effect value of economic development level (PGDP) on collusive willingness is −4.595, accounting for 52%, and the indirect effect value is −4.194, accounting for 48%. The CI value does not include 0, indicating the influence of PGDP on collusive willingness’s direct and indirect effects is significant.
Table 7.
Mediation effects testing using bootstrap.
In the industrial competition environment (ICE), the variable ICE on collusive willingness’s direct effect value is 0.235, accounting for 33%, and the indirect effect value is 0.475, accounting for 67%. The CI value of the direct effect of ICE is [LLCI, ULCI] = [−0.113, 0.583], and this interval contains a value of 0, which means that the direct effect of ICE on collusive willingness is not significant. The result displays that the influence of ICE on collusive willingness is wholly transmitted through indirect paths.
In the geographical characteristic, the variable of whether a leading colluder and collusive project are in the same province (SP) has a direct effect value of 1.818, accounting for 27%, and an indirect effect value of 5.001, accounting for 73%. The CI value of the direct effect is [LLCI, ULCI] = [−0.686, 4.322] and the interval contains the value of 0, and the CI value of the indirect effect is [LLCI, ULCI] = [3.630, 6.381], and the interval does not contain 0. This result means that the influence of SP on collusive willingness is wholly transmitted through indirect pathways. The direct effect of distance (DI) on collusive willingness is 0.152, accounting for 44%; the indirect effect is 0.538, accounting for 56%. The CI values of this variable’s direct path and indirect path do not contain a value of 0, indicating that 44% of the impact of DI on collusive willingness is achieved through the direct path and 56% through the indirect path. Compared with the eastern region, the central region (CR) has a direct effect value of 0.689, accounting for 41%, and an indirect effect value of 0.981, accounting for 59%. The CI value of the direct effect in the central region is [LLCI, ULCI] = [−0.792, 2.170]. The interval contains a value of 0, indicating that the direct effect is not significant. The direct effect value of the western region (WR) on collusive willingness is −4.355, accounting for 64%, and the indirect effect value is −2.472, accounting for 34%. Both effect values are significant.
4.2. Indirect Influence Paths of the Urban Environment on Collusive Willingness
Table 8 shows the indirect influence paths of the urban environment on collusive willingness. The results display that the influence of socio-economic development on collusive willingness is mainly transmitted through the number of collusive companies. Among them, the path of WG → NCB → NC is positive and significant, and the effect value is 5.983; the path of PGDP → NCB → NC is negative and significant, with an effect value of −4.356, and other paths are not significant. Among the indirect paths that industrial competition environment affects collusive willingness, only the path of ICE → NCB → NC is significant, with an effect value of 0.540. This result displays that the influence of industrial competition environment on collusive willingness is wholly transmitted through the number of collusive companies. In the dimension of geographic characteristic, the effect values of the four paths—SP → NCB → NC, DI → NCB → NC, CR → NCB → NC, and WR → NCB → NC—are 4.123, 0.826, 1.720, and −2.890, respectively. That is, all variables of geographic characteristics affect collusive willingness through the number of collusive companies. Besides, SP → WBP → NC and CR → WBP → NC effect values are 0.958 and −0.807, respectively, and both are significant. It is the influence of SP and CR on collusive willingness that will also be transmitted through the project profitability, but both effect values are very small.
Table 8.
Indirect paths of the influence of the urban environment on collusive willingness.
5. Hypotheses Testing and Discussion
The study empirically analyzes the influence paths from the urban environment to collusive willingness. The results in Table 7 and Table 8 verify that regarding the four hypotheses, H1, H2, and H3 are supported, and H4 is not supported (Figure 5). Urban environment can affect collusive willingness through direct and indirect paths, but it is mainly influenced by indirect pathways. In the indirect influence paths, the number of collusive companies is the most critical mediating variable. Besides, when the collusive project and lead colluder are in the same province, little indirect utility also can be transmitted through the project profitability. The results contribute to urban governors recognizing the important mediating variables that promote collusion and then proposing collusion governance measures from the perspective of blocking the transmission path. The following is a further discussion of each hypothesis.
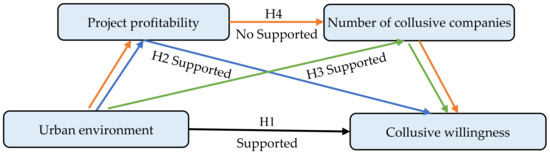
Figure 5.
Hypothesis verification results.
Urban environment impacts collusive willingness (H1). In the socio-economic dimension, social development level has a positive influence on collusive willingness, and economic development level has a negative impact on collusive willingness. The direct effect value of social development level and economic development level are 2.346 and −4.595, respectively. The negative effect value of economic development level is greater than the positive effect value of economic development level. Therefore, increasing the level of socio-economic development can restrain collusive willingness. The main reason for this result is that the higher the economic development level, the more business opportunities, thereby prompting bidders to reduce the pursuit of collusion [28]. When social development level increases, the collusive willingness increase. This may be due to the fact that when the social development level increases, the illegal collusion organizers can obtain more profits, which encourages the illegal collusion organizers to assist the bidders to build a collusion team, accordingly increasing the bidder’s collusive willingness. Lau et al. [50] explored the relationship between economic development and corruption and found that economic development is negatively correlated with corruption. This study’s finding is consistent with the above result. Besides, our research also found that social development level has a positive impact on collusive willingness, and this result broadens the current collusion research in urban construction projects.
The influence of the urban environment on collusive willingness is transmitted through project profitability (H2). However, this is only the case when the collusive companies and collusive project are in the same province and the central region’s influence on collusive willingness is transmitted through this path, though the effect value of this path is extremely low compared with other paths. The reason may be that the urban environment will affect colluder decision-making, but it has a small impact on project profitability. Therefore, the influence of project profitability on collusive willingness is weak. When the collusive enterprise and the collusive project are in the same province, it is easy for colluders to form a collusion team, which encourages colluders to increase their collusive willingness due to project profitability. This finding broadens the research findings of Ishii [51]; that is, collusive bidding is more likely to occur in the same area. This is because it is easier to establish a collusion organization in the same area [28]. The study suggests that the urban governor should strengthen the key governance of collusive bidding in the same area.
The influence of urban environment on collusive willingness is mainly transmitted through the number of collusive companies (H3). This may be due to the fact that the greater the number of collusive companies, the greater the probability of collusion success [32]. Whether a colluder can contact a number of collusive companies is different for different urban environmental characteristics. For example, Wang et.al [7] found that as the economic development level increases, the higher the punishment faced by the colluders. The increased punishment may affect the number of collusive companies. Therefore, the colluders will first consider if they can contact a number of collusive companies, according to their economic ability, and then decide whether to initiate a collusion [28]. This result shows that the number of collusive companies is the most important mediating variable from the urban environment to collusive willingness. This finding provides administrators with the inspiration to put forward governance countermeasures from the perspective of the colluders forming a collusion team. This helps to cut off the collusive willingness from the source, thereby reducing the occurrence of collusive bidding.
6. Conclusions
Collusive bidding has always been a stubborn disease in urban construction projects. Current studies have found that different urban environments have different effects on bidders’ collusive willingness. The study collects real collusive bidding data from collusion cases in urban construction projects and uses the bootstrap method to empirically analyze the influence path of urban environment on collusive willingness. The results show that socio-economic development, industrial competitive environment, and geographic characteristics affect collusive willingness mainly through the number of collusive companies. Besides, when the collusive project and lead colluder are in the same province, the colluders will increase their collusive willingness because of the project profitability.
Although the research data was collected from China, the study is believed to be beneficial to other countries’ sustainable urban development, especially in developing countries. First, the findings indicate that urban governors and owners should take countermeasures to increase the difficulty for bidders to form a collusion team, thereby inhibiting bidders’ willingness to collude. Existing research shows that the collusive bidding rules of different countries are not very different, so this governance strategy is also applicable to the urban governance of other countries. Second, the results also imply that urban governors should know that collusion in the same area has always been the focus of collusive governance. Third, this study proposes a new research perspective on the influence paths of the external environment on collusive willingness, which helps collusion researchers in other countries use this method to explore collusion problems in their countries.
Despite these achievements, this study was limited by urban environmental factors. Current research is based on the availability of data and the importance of factors and reveals the influence paths of urban environmental factors—in the three dimensions of socio-economic, industrial competition environment, and geographic characteristic—on collusive willingness. However, the urban environment is highly complex and contains various factors. Future studies are recommended to improve the investigation of the urban environment in more dimensions and more complex situations.
Author Contributions
Conceptualization, X.W. and Y.Y.; methodology, X.W.; software, W.L.; validation, X.W. and W.L.; formal analysis, M.S.; resources, X.W.; data curation, M.S.; writing—original draft preparation, X.W.; writing—review and editing, Y.Y.; visualization, W.L.; supervision, Y.Y.; funding acquisition, Y.Y. and X.W. All authors have read and agreed to the published version of the manuscript.
Funding
This research was funded by the Start-up Found for RAPs under the Strategic Hiring Scheme [Grant Number: P0035121], and the Science and Technology Research Program of Chongqing Municipal Education Commission (Grant Number: KJQN202001311).
Institutional Review Board Statement
Not applicable.
Informed Consent Statement
Not applicable.
Data Availability Statement
The original data was obtained from collusive cases, statistical yearbooks and China’ Baidu Map. The collusive cases was available at https://wenshu.court.gov.cn/ (accessed on 10 January 2021). The statistical yearbooks was available at http://www.stats.gov.cn/ (accessed on 10 January 2021). The China Baidu Map was available at https://map.baidu.com (accessed on 10 January 2021).
Acknowledgments
The authors sincerely thank the editors and the anonymous reviewers for their constructive suggestions for this manuscript.
Conflicts of Interest
The authors declare no conflict of interest.
References
- Word Economic Forum. How Has the World’s Urban Population Changed from 1950 to Today? Available online: https://www.weforum.org/agenda/2020/11/global-continent-urban-population-urbanisation-percent/ (accessed on 4 November 2020).
- Chen, M.; Ye, C.; Lu, D.; Sui, Y.; Guo, S. Cognition and construction of the theoretical connotations of new urbanization with Chinese characteristics. J. Geogr. Sci. 2019, 29, 1681–1698. [Google Scholar] [CrossRef]
- Sun, C.; Zhang, S.; Song, C.; Xu, J.; Fan, F. Investigation of Dynamic Coupling Coordination between Urbanization and the Eco-Environment—A Case Study in the Pearl River Delta Area. Land 2021, 10, 190. [Google Scholar] [CrossRef]
- Owusu, E.K.; Chan, A.P.C.; Yang, J.; Pärn, E. Towards corruption-free cities: Measuring the effectiveness of anti-corruption measures in infrastructure project procurement and management in Hong Kong. Cities 2020, 96, 102435. [Google Scholar] [CrossRef]
- Gu, C. Urbanization: Processes and driving forces. Sci. China Earth Sci. 2019, 62, 1351–1360. [Google Scholar] [CrossRef]
- Qu, W.; Zhao, S.; Sun, Y. Spatiotemporal patterns of urbanization over the past three decades: A comparison between two large cities in Southwest China. Urban Ecosyst. 2014, 17, 723–739. [Google Scholar] [CrossRef]
- Wang, X.; Ye, K.; Arditi, D. Embodied cost of collusive bidding: Evidence from China’s construction industry. J. Constr. Eng. Manag. 2021, 147, 04021037. [Google Scholar] [CrossRef]
- Shan, M.; Le, Y.; Yiu, K.T.W.; Chan, A.P.C.; Hu, Y. Investigating the Underlying Factors of Corruption in the Public Construction Sector: Evidence from China. Sci. Eng. Ethics 2017, 23, 1643–1666. [Google Scholar] [CrossRef]
- Zhang, B.; Le, Y.; Xia, B.; Skitmore, M. Causes of Business-to-Government Corruption in the Tendering Process in China. J. Manag. Eng. 2017, 33, 05016022. [Google Scholar] [CrossRef]
- News-sina, N. Twenty-Four People Have Been Indicated in 78 Cases of Collusive Bidding Involving More Than 700 Million Yuan. Available online: http://news.sina.com.cn/c/2019-08-23/doc-ihytcitn1229385.shtml (accessed on 23 August 2019).
- Aarhaug, J.; Fearnley, N.; Gregersen, F.A.; Norseng, R.B. 20 years of competitive tendering in the Norwegian bus industry—An analysis of bidders and winning bids. Res. Transp. Econ. 2018, 69, 97–105. [Google Scholar] [CrossRef]
- Allain, M.-L.; Boyer, M.; Kotchoni, R.; Ponssard, J.-P. Are cartel fines optimal? Theory and evidence from the European Union. Int. Rev. Law Econ. 2015, 42, 38–47. [Google Scholar] [CrossRef]
- Anderson, E.J.; Cau, T.D.H. Implicit collusion and individual market power in electricity markets. Eur. J. Oper. Res. 2011, 211, 403–414. [Google Scholar] [CrossRef]
- Bowen, P.A.; Edwards, P.J.; Cattell, K. Corruption in the South African construction industry: A thematic analysis of verbatim comments from survey participants. Constr. Manag. Econ. 2012, 30, 885–901. [Google Scholar] [CrossRef]
- Alutu, O.E. Unethical Practices in Nigerian Construction Industry: Prospective Engineers’ Viewpoint. J. Prof. Issues Eng. Educ. Pract. 2007, 133, 84–88. [Google Scholar] [CrossRef]
- Bergeijk, P.A.G.V. On the Allegedly Invisible Dutch Construction Sector Cartel. J. Compet. Law Econ. Lett. 2008, 4, 115–128. [Google Scholar] [CrossRef]
- Chotibhongs, R.; Arditi, D. Detection of Collusive Behavior. J. Constr. Eng. Manag. 2012, 138, 1251–1258. [Google Scholar] [CrossRef]
- Chotibhongs, R.; Arditi, D. Analysis of collusive bidding behaviour. Constr. Manag. Econ. 2012, 30, 221–231. [Google Scholar] [CrossRef]
- Wang, X.; Liu, R.; Ye, K.; Tekka, R.S. Modelling the cost of collusion in the construction industry: A case of China. In Proceedings of the 36th Annual ARCOM Conference, Leeds, UK, 7–8 September 2020; pp. 115–124. [Google Scholar]
- Oke, A.; Aigbavboa, C.; Mangena, Z. Prevention of Collusion for Innovative Construction. Procedia Eng. 2017, 196, 491–497. [Google Scholar] [CrossRef]
- Tabish, S.Z.S.; Jha, K.N. Analyses and evaluation of irregularities in public procurement in India. Constr. Manag. Econ. 2011, 29, 261–274. [Google Scholar] [CrossRef]
- People, N. Zhejiang Wuyi: 24 People Were Prosecuted in a Bid Collusion Case Involving More Than 700 Million Yuan. Available online: https://baijiahao.baidu.com/s?id=1642619929193485493&wfr=spider&for=pc (accessed on 23 August 2019).
- Gupta, S. Competition and collusion in a government procurement auction market. Atlantic Econ. J. 2002, 30, 13–25. [Google Scholar] [CrossRef]
- Bolotova, Y.; Connor, J.M.; Miller, D.J. The impact of collusion on price behavior: Empirical results from two recent cases. Int. J. Ind. Organ. 2008, 26, 1290–1307. [Google Scholar] [CrossRef]
- Padhi, S.S.; Wagner, S.M.; Mohapatra, P.K.J. Design of Auction Parameters to Reduce the Effect of Collusion. Decis. Sci. 2016, 47, 1016–1047. [Google Scholar] [CrossRef]
- Ashenbaum, B.; Blair, C.W.; Brewer, B. The influence of the competitive landscape on cross-functional interactions between procurement and engineering. J. Purch. Supply Manag. 2020, 26, 100595. [Google Scholar] [CrossRef]
- Lee, W.; Kim, H.; Choi, H.M.; Heo, S.; Fong, K.C.; Yang, J.; Park, C.; Kim, H.; Bell, M.L. Urban environments and COVID-19 in three Eastern states of the United States. Sci. Total Environ. 2021, 779, 146334. [Google Scholar] [CrossRef] [PubMed]
- Wang, X.; Ye, K.; Chen, M.; Yao, Z. A Conceptual Framework for the Inclusion of Exogenous Factors into Collusive Bidding Price Decisions. J. Manag. Eng. 2021b, 37, 04021071. [Google Scholar] [CrossRef]
- Dorée, A.G. Collusion in the Dutch construction industry: An industrial organization perspective. Build. Res. Inf. 2004, 32, 146–156. [Google Scholar] [CrossRef]
- Zarkada-Fraser, A. A Classification of Factors Influencing Participating in Collusive Tendering Agreements. J. Bus. Ethics 2000, 23, 269–282. [Google Scholar] [CrossRef]
- Bhattacharjea, A.; Sinha, U.B. Multi-market collusion with territorial allocation. Int. J. Ind. Organ. 2015, 41, 42–50. [Google Scholar] [CrossRef][Green Version]
- Albano, G.L.; Buccirossi, P.; Spagnolo, G.; Zanza, M. Preventing Collusion in Procurement: A Primer. In Handbook of Procurement; Dimitri, N., Piga, G., Spagnolo, G., Eds.; Cambridge University Press: New York, NY, USA, 2006; pp. 347–380. [Google Scholar]
- Roux, C.; Thöni, C. Collusion among many firms: The disciplinary power of targeted punishment. J. Econ. Behav. Organ. 2015, 116, 83–93. [Google Scholar] [CrossRef]
- Padhi, S.S.; Mohapatra, P.K.J. Detection of collusion in government procurement auctions. J. Purch. Supply Manag. 2011, 17, 207–221. [Google Scholar] [CrossRef]
- Gupta, S. The Effect of Bid Rigging on Prices: A Study of the Highway Construction Industry. Rev. Ind. Organ. 2001, 19, 453–467. [Google Scholar] [CrossRef]
- Fonseca, M.A.; Normann, H.-T. Endogenous cartel formation: Experimental evidence. Econ. Lett. 2014, 125, 223–225. [Google Scholar] [CrossRef]
- Porter, R.H.; Zona, J.D. Detection of Bid Rigging in Procurement Auctions. J. Polit. Econ. 1993, 101, 518–538. [Google Scholar] [CrossRef]
- Hartigan, J.A. Bootstrap Methods for Standard Errors, Confidence Intervals, and Other Measures of Statistical Accuracy. J. Stat. Sci. 1986, 1, 75–77. [Google Scholar] [CrossRef]
- Silva, E.; Magluta, C.; Roitman, N.; Filho, L.A. Development of a structural identification methodology with uncertainty quantification through the SSI and bootstrap techniques. Mech. Syst. Signal Process. 2022, 165, 108290. [Google Scholar] [CrossRef]
- Streukens, S.; Leroi-Werelds, S. Bootstrapping and PLS-SEM: A step-by-step guide to get more out of your bootstrap results. Eur. Manag. J. 2016, 34, 618–632. [Google Scholar] [CrossRef]
- Jaspers, J.D. Business cartels and organised crime: Exclusive and inclusive systems of collusion. Trends Organ. Crime 2018, 22, 414–432. [Google Scholar] [CrossRef]
- Ma, W.; Wang, Q.; Yang, H.; Zhang, A.; Zhang, Y. Effects of Beijing-Shanghai high-speed rail on air travel: Passenger types, airline groups and tacit collusion. Res. Transp. Econ. 2019, 74, 64–76. [Google Scholar] [CrossRef]
- Jung, E.Y.; Lee, J.D. Effects of regulation and economic environment on the electricity industry׳s competitiveness: A study based on OECD countries. Energy Policy 2014, 72, 120–128. [Google Scholar] [CrossRef]
- Michele, H.; Christopher, F. It Takes a Village: A Test of the Creative Class, Social Capital, and Human Capital Theories. Urban Aff. Rev. 2009, 44, 311–333. [Google Scholar] [CrossRef]
- Ye, K.; Zhu, W.; Shan, Y.; Li, S. Effects of Market Competition on the Sustainability Performance of the Construction Industry: China Case. J. Constr. Eng. Manag. 2015, 141, 04015025. [Google Scholar] [CrossRef]
- Bajari, P.; Ye, L. Deciding between Competition and Collusion. Rev. Econ. Stat. 2003, 85, 971–989. [Google Scholar] [CrossRef]
- Oo, B.L.; Drew, D.S.; Lo, H.-P. A comparison of contractors’ decision to bid behaviour according to different market environments. Int. J. Proj. Manag. 2008, 26, 439–447. [Google Scholar] [CrossRef]
- Bai, J.; Jayachandran, S.; Malesky, E.J.; Olken, B.A. Firm Growth and Corruption: Empirical Evidence from Vietnam. Econ. J. 2017, 129, 651–677. [Google Scholar] [CrossRef]
- Price, M.K. Using the spatial distribution of bidders to detect collusion in the marketplace: Evidence timber auctions. J. Reg. Sci. 2008, 48, 399–417. [Google Scholar] [CrossRef]
- Lau, C.K.M.; Demir, E.; Bilgin, M.H. Experience-based corporate corruption and stock market volatility: Evidence from emerging markets. Emerg. Mark. Rev. 2013, 17, 1–13. [Google Scholar] [CrossRef]
- Ishii, R. Favor exchange in collusion: Empirical study of repeated procurement auctions in Japan. Int. J. Ind. Organ. 2009, 27, 137–144. [Google Scholar] [CrossRef]


Publisher’s Note: MDPI stays neutral with regard to jurisdictional claims in published maps and institutional affiliations. |
© 2022 by the authors. Licensee MDPI, Basel, Switzerland. This article is an open access article distributed under the terms and conditions of the Creative Commons Attribution (CC BY) license (https://creativecommons.org/licenses/by/4.0/).