Article

The Structure and Evolution of the Tourism Economic Network of the Tibetan Plateau and Its Driving Factors

1
State Key Laboratory of Desert and Oasis Ecology, Xinjiang Institute of Ecology and Geography, Chinese Academy of Sciences, Urumqi 830000, China
2
University of Chinese Academy of Sciences, Beijing 100101, China
3
Institute of Geographic Sciences and Natural Resources Research, Chinese Academy of Sciences, Beijing 100049, China
*
Author to whom correspondence should be addressed.
Land 2022, 11(2), 241; https://doi.org/10.3390/land11020241
Submission received: 27 December 2021 / Revised: 23 January 2022 / Accepted: 3 February 2022 / Published: 6 February 2022
(This article belongs to the Section Urban Contexts and Urban-Rural Interactions)

Abstract

:
Tourism is one of the core industries driving the economy on the Tibetan Plateau towards green development. Adopting the improved gravity model, social network analysis, and quadratic assignment procedure, this paper explores the structure and evolution characteristics of the tourism economic network on the Tibetan Plateau from 2015 to 2019. The results are as follows: (1) the tourism economic strength increased over time, but it was generally higher in Qinghai Province and lower in Tibet. (2) The network density exhibited an upwards trend overall. (3) The structure of the tourism economic network presented a significant core–periphery distribution pattern. Xining, Haixi, and Lhasa acted as a bridge between the spatial network structure of the tourism economy and had a structural hole advantage. However, some remote cities, such as Ali, Naqu, and Guoluo, had low network centricity. (4) The quadratic assignment procedure regression analysis showed that the A-level attractions and star-rated hotels significantly advanced the formation of the spatial association. This study concludes with recommendations for promoting tourism economic associations for policy-makers.

1. Introduction

Along with the rapid development of tourism, tourism links between destinations are getting closer, gradually forming a tourism economic network. The tourism network helps destinations function in a complex and competitive world, which acts as a system to organize and integrate destinations for the participating tourism companies and to improve the performance and quality of destinations [1,2,3]. Moreover, tourism economic connections could promote the coordinated development of the regional tourism economy and provide a basis for scientifically formulating regional tourism coordinated development policies [4]. Studies have focused on the characteristics, impact, and influencing factors of attraction and destination networks [5,6,7]. However, few studies have evaluated and discussed the evolution of the spatial network structure of the tourism economy in tourism destinations. Therefore, examining the tourism economic network structure in tourism destinations is significant to tourism scholars.
The Tibetan Plateau is extremely rich in tourism resources, such as a variety of landscapes and special ethnic flavors, which attract a large number of visitors every year [8]. Since 2000, the number of tourists on the Tibetan Plateau has been on the rise. In 2019, the total tourism revenue of Qinghai and Tibet was equivalent to 22.94% and 38.29% of GDP, respectively, and tourism has become a pillar industry in the economy of the Tibetan Plateau region. The development of the tourism economy plays an increasingly important role in promoting regional economic development. However, cities still lack a range and in-depth level of tourism economic interactions. The study of urban tourism networks on the Tibetan Plateau is of great significance.

1.1. Network Analysis in Tourism

In recent years, social network analysis in tourism research has witnessed an increasing number of studies. The research streams mainly focus on interorganizational relations, virtual networks, and the networks of attractions and destinations [6].
From the perspective of interorganizational relations, research applying network analysis has focused on stakeholders’ collaborations and network dynamics. Tran et al. [9] analyzed the pattern of the network between tour operators and travel agencies, as well as between tour operators. Kim and Scott [10] attempted to trace the evolution of the organization of tourism stakeholders.
From the virtual networks perspective, the research focuses on the influence of particular users or stakeholders in social media. Scott et al. [11] took the island of Elba as an example to compare the communication network of tourist organizations and the virtual network formed by the websites of these organizations.
Tourism destinations are composed of different types and levels of tourism suppliers and tourism organizations [5]. From a tourist demand perspective, research has been conducted on the network of attractions [4,12,13], the formation mechanism of network relationships [14], and the structure and retrieval paths of destination image [15]. Wang et al. [13] studied the structure of tourism economic networks in national parks in central China and modified the gravity model using the total revenue of the national parks. Liu et al. [14] used social network analysis to explore the mechanisms of tourist attraction network informed by tourist flows. From the supply perspective, the existing literature generally concentrates on the characteristics of the network [16], the influence of network structure, and the influencing factors of the network [7]. Wang et al. [17] explored the spatial network characteristics of the tourism economy of 15 cities in Xinjiang by combining the modified gravity model with the comprehensive tourism quality assessment index. Based on the modified gravity model and QAP analysis, Wang and Xia [18] visualized the structural morphological characteristics of the spatial network of China’s provincial tourism economy and analyzed the influencing factors. Yang et al. [19] used the gravity model and social network analysis to analyze the spatial structure of the tourism economy in the Beijing–Tianjin–Hebei–Xiong region in 2013 and 2016. In conclusion, research on social networks has shifted from focusing on the analysis and description of network structures to exploring the formation, development, and effects of relational networks.

1.2. Network Analysis in the Tourism Economic Network

The tourism economic network is a point-line-surface interwoven tourism spatial structure based on the regional space, tourism activities, and other elements, such as tourism passenger flow and tourism goods flowing among tourism destinations [20], which is the core category of the tourism destination network. Tourism economic linkages are a comprehensive reflection of the flow of tourism factors and to a certain extent reflect the spatial structure of regional urban tourism. Cities with development advantages can exemplify the development of tourism economies in other cities, thus creating a radiating effect of tourism [21]. The spatial network structure of the tourism economy can facilitate the spatial integration between tourism destinations and promote the development of the tourism industry [22]. In terms of the research perspective, the main focus is on economically developed urban zones and urban agglomerations [4,23]. To date, there are two general approaches to the study of urban economic linkages: (1) the combination of gravity model and social network analysis [24] and (2) the use of various factor flows data to reflect urban economic linkages; Mou et al. [25] found that online travel diaries can accurately reflect the spatial characteristics of tourism flow. Matsumoto and Domae [26] assessed the competitive relationship between Eurasian cities based on data on air passenger and cargo traffic. Monzon et al. [27] discussed that new high-speed rail lines significantly increase the level of accessibility of Spaniards to most destinations. However, the gravity model has the advantages of easy access to data, comprehensiveness and wide applicability [28], and is therefore widely used. In addition, the depth and breadth of research on urban networks from a tourism perspective is progressively advancing, but mostly on intercity hierarchical ranking while lacking in the exploration of the mechanisms driving urban tourism economic networks. Social networks enable a deeper understanding of urban tourism networks from a dynamic, evolutionary perspective. In addition, there are few studies on the network space of the tourism economy in underdeveloped areas [13]. However, research on Tibetan Plateau cities with great potential for tourism development has not been conducted.

1.3. Tourism Development in the Tibetan Plateau

The Tibetan Plateau is one of the key areas for the construction of ecological civilization in China and an important cultural preservation site of Chinese national characteristics. The Chinese government attaches importance to the exploration of the Tibetan Plateau for tourism development. Since 2010, the Communist Party of China (CPC) Central Committee’s Tibet Work Symposium has attached importance to the development strategy of making Tibet a world tourism destination [29]. Tourism development is also important to poverty alleviation among farmers and herders in the Tibetan Plateau region. Tourism is a way to alleviate poverty through income and employment generation, especially for rural areas in developing countries [30]. By integrating tourism more closely into the local economy and thus promoting other businesses, linkages can be enhanced [31]. Tibet’s tourism industry has helped 32,000 poor people out of poverty, including rural tourism income of RMB 1.2 billion. Tourism is a green way of poverty alleviation for the Tibetan Plateau, in line with regional economic positioning and green development goals, but attention should be paid to scientific planning and rational development [32].
Highland tourism has received extensive attention from scholars, and research on the Tibetan Plateau has mainly focused on tourists and tourism resources. In the tourist context, studies focus on tourists’ travel constraints and revisit intention [33], and spatiotemporal behavior [34]. From the resource and economic perspective, tourism resource spatial patterns [35] and the impact of climate change on tourism [36] have been discussed. In a study evaluating the potential for ecotourism development on the Tibetan Plateau, Zhang et al. [37] found that although the region within the Tibetan Plateau is extremely rich in tourism resources, it is limited by infrastructure and other constraints, and there is thus a divide between tourists and destinations. However, the tourism economic network in cities on the Tibetan Plateau has not been explored. Therefore, this study takes the main cities on the Tibetan Plateau as the case study, and we first built a modified gravity model to identify the tourism economic association from a network perspective. Second, we explore the dynamic evolution of tourism economic connections and cooperation between cities, and analyze the influencing factors by quadratic assignment procedure (QAP) methods. Finally, this study aims to provide a theoretical and practical scientific reference for enhancing tourism economic connections and development.
This paper has been divided into five parts. Following the introduction and literature review, the second part introduces the study area and a rigorous description of the methods employed. The third part presents the empirical results of the study, in which we describe the tourism economic network structure of the Tibetan Plateau. The fourth part discusses the findings, while the last part concludes the analysis and presents practical implications.

2. Materials and Methods
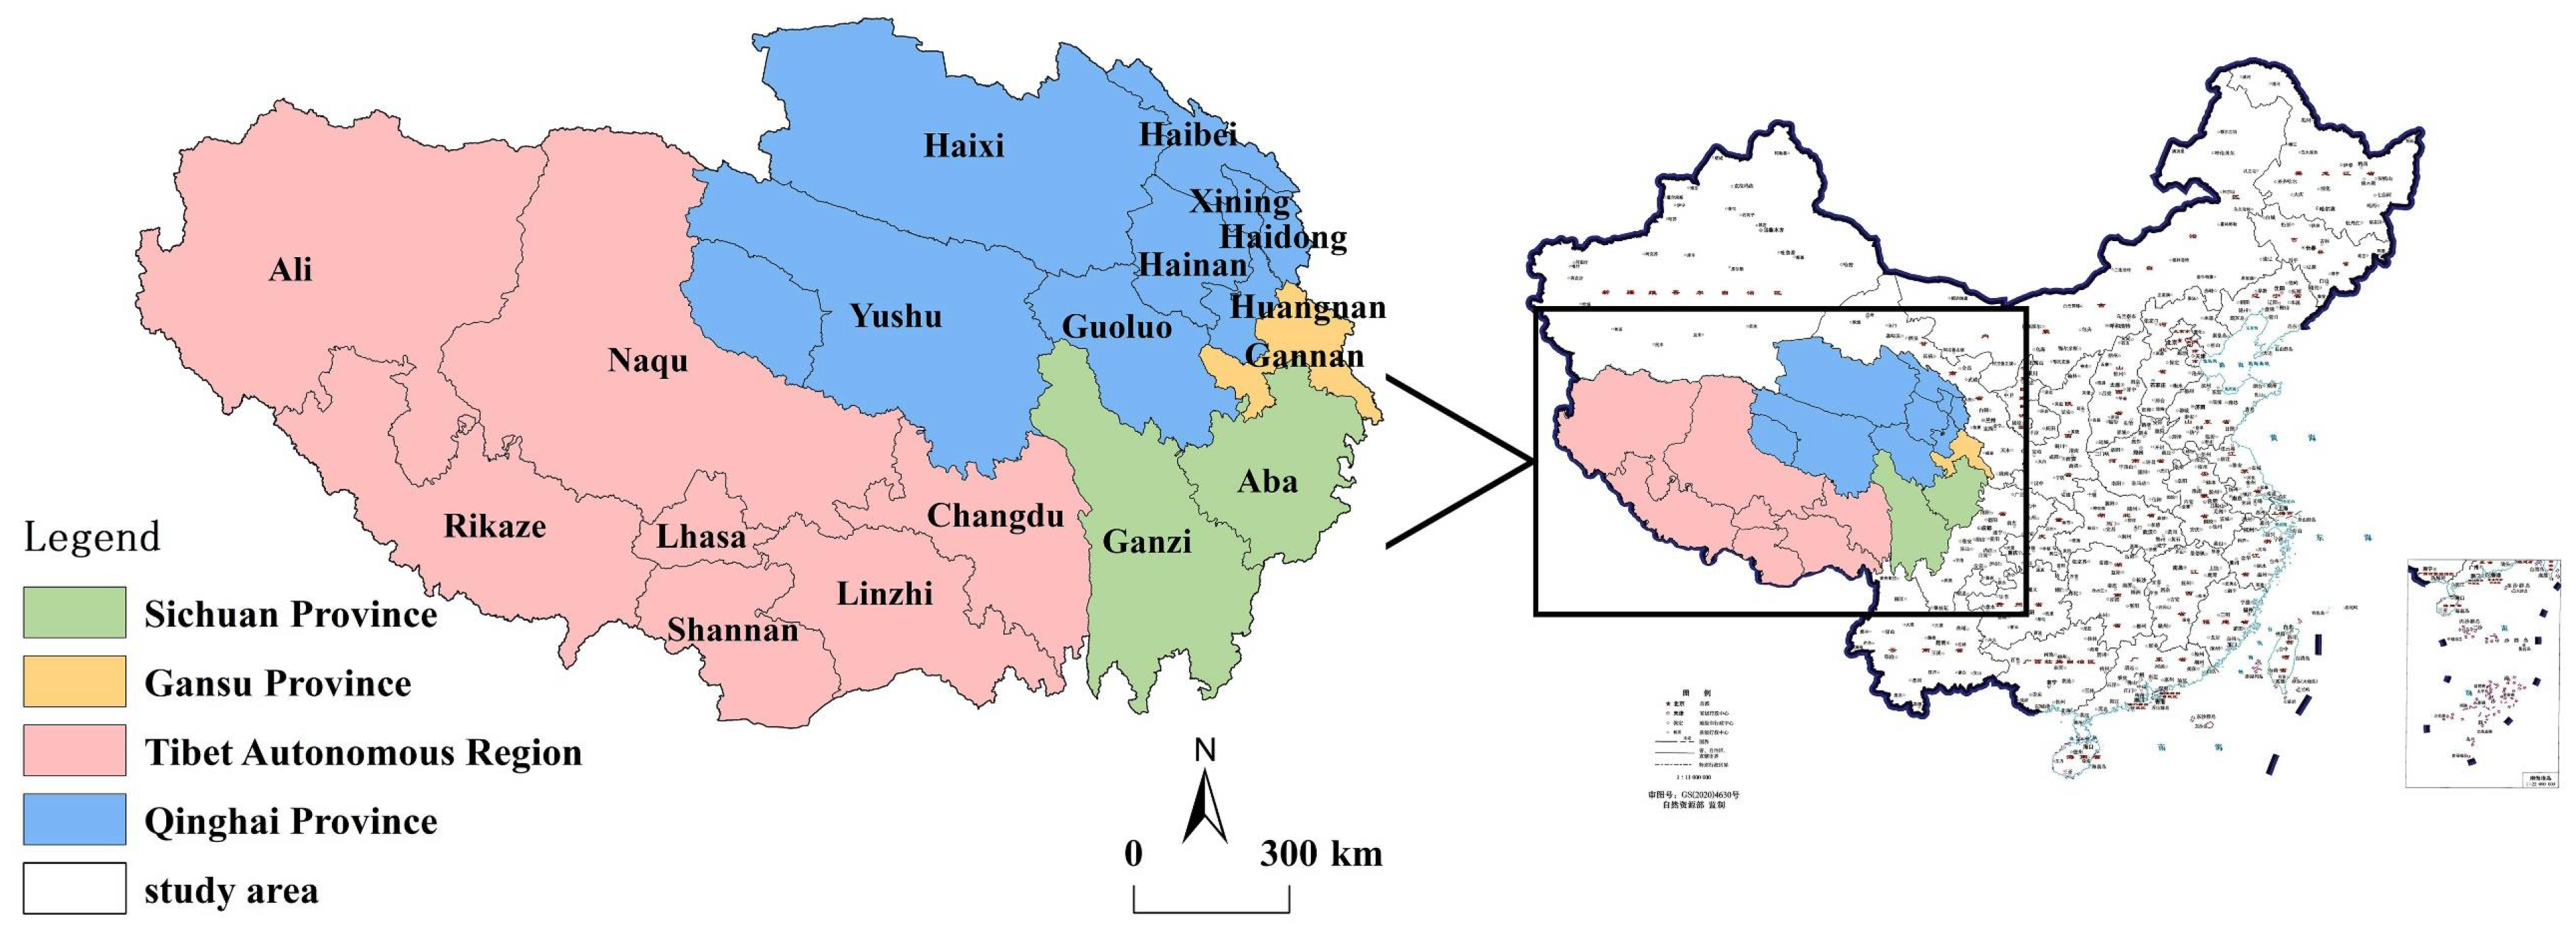
2.1. Study Area

The Tibetan Plateau is located among the Kunlun Mountains, Qilian Mountains, Hengduan Mountains, and Himalayas, with an average altitude of more than 4000 m. The Tibetan Plateau has a unique climate and natural environment with not only a magnificent natural landscape, but also a unique ethnic culture [38]. The parts distributed in China include Tibet in the southwest, western Sichuan Province, parts of north-western Yunnan Province, and most parts of Qinghai Province in the northeast, known as the Earth’s third pole. The Tibetan Plateau is famous for its tourism resources, such as mountains and lakes, Tibetan Buddhist culture, ancient tea horse road, and ancient Tang Fan Road. This study includes 7 cities in Tibet, 2 in Sichuan Province, 8 in Qinghai Province, and 1 in Gansu Province, as shown in Figure 1 (90% or more of the area belongs to the Tibetan Plateau). In the study area, there are 3 world natural heritage sites (Hoh Xil, Jiuzhaigou, and Huanglong), 1 world cultural heritage site (the Potala Palace historical building), the source of the Three Parallel Rivers national protected area, and 425 national A-level tourist attractions (according to the “Classification and Evaluation of Quality Levels of Tourist Attractions” (GB/T17775-2003), there are 5 levels of tourist attractions from “1A” to “5A”).

2.2. Data Source and Processing

This paper takes 18 cities on the Tibetan Plateau as the spatial units to examine the spatial network structure of the tourism economy, for the period from 2005 to 2015. In this study, we used a modified gravity model to determine the spatial association. The required data are mainly total tourism income, number of visitors, and geographical distances between cities. These data come from the experiencing “Gansu Statistical Yearbook (2015–2019)”, the “Qinghai Statistical Yearbook (2015–2019)”, the “Sichuan Statistical Yearbook (2015–2019)”, and the “Tibet Statistical Yearbook (2015–2019)”. The shortest geographical distance between cities was retrieved using a Gaode map (https://ditu.amap.com/, accessed on 2 October 2021). Lists of attractions and star-rated hotels were obtained from the official website of the Ministry of Culture and tourism of China (https://www.mct.gov.cn/, accessed on 18 October 2021).

2.3. Research Methods

2.3.1. Tourism Economic Gravity Model

Zipf [39] derived the original gravity model through research, and further research by Taaffe [40] found that economic connectedness was proportional to the product of their populations and inversely proportional to the square of the distance between them. Dejean [24] argued that the law of retail gravitation could be used to explore economic linkages between cities, while Crampon [41] introduced the gravity model into tourism research to measure tourism flows between two places, resulting in the gravity model of tourism economic linkages. Then, the economic gravity model was iteratively modified to suit various studies [42,43]. Among the studies on the strength of regional tourism economic linkages, the principle of the model is that the strength of the spatial connection between two regions is proportional to their mass and inversely proportional to their distance, which has become one of the practical ways to study economic problems between cities [4,24].
The objectives of this paper in choosing the gravity model to measure inter-city spatial relationships are the following: (1) the gravity model can portray the dynamic evolutionary trends in the structure of tourism economic linkage networks; and (2) the method integrates the effects of total tourism data and geographical distance on the overall network structure. This paper converts the attribute data into relational data with the help of an improved gravity model, which not only considers tourism arrivals and spatial distances, but also corrects them through tourism revenues. The strength of tourism economic linkage reflects the degree of interaction between the tourism economies of different cities.
This research takes cities as network nodes, and the line between two nodes in the associated network is defined as the spatial correlation of the tourism economy between cities. Therefore, the characterization of the city’s quality should focus on measuring the level of tourism economic development. Considering that tourists are the main component of tourism economic activities, the number of tourists and tourism revenue should be critical indicators to measure the “quality” of the city’s economy. According to the above research, this study believes that the tourism economic links between cities on the Tibetan Plateau are related to the number of tourists, total tourism revenue, and the distance between cities. To highlight the differences in tourism economic links between cities, this paper uses the ratio of tourism income to total tourism income of the two cities to modify the empirical constant K. The ratio of the shortest road distance between cities to the GDP difference is the economic distance. The modified model is as follows:
F i j = K i j P i G i P j G j D i j 2   where   D i j = d i j g i g j ,   K i j = P i P i + P j
where i and j denote Tibetan Plateau cities i and j, respectively; Fij is the strength of the tourism economic link between city i and city j; P denotes the total tourism revenue; G denotes the number of tourist visits; Dij is the economic distance; dij represents the shortest road distance between cities i and j; g represents the GDP of the city; and Kij is the empirical constant, which is the rate of tourism economic connection between the two cities. The matrices of tourism economic connection strength between the cities from 2015 to 2019 were calculated by Equation (1), and the data were binarized. The strength of tourism economic connections Ci is the sum of the tourism economic connections of city i and all other cities in the region. The formula is as follows:
C i = F i j

2.3.2. Social Network Analysis

Social network analysis is a method used to study social network members and their relationships, and has been widely used in various research fields [14,44]. This research uses UCINET6.0 software to analyze the structural evolution of the overall network and individual network of the tourism economy of the Tibetan Plateau cities from 2015 to 2019 [45].
Table 1 presents these formulas:
Network density is one of the critical indicators of overall network analysis and reflects the degree of connection between nodes in the network [46,47]. The value ranges from 0 to 1. The closer the value is to 1, the closer the associations between nodes in the network. The number of association relations refers to the actual number of tourism economic connections in the network, namely, the number of edges.
This study adopted three indicators to indicate the centrality of each node: degree centrality, closeness centrality, and betweenness centrality. The degree centrality reflects the degree of the central position of the cities in the tourism economic network of the Tibetan Plateau [48]. If the city’s degree centrality is higher, the stronger the tourism economic relationship between the city and other cities will be, indicating that the city is at the center of the network. The closeness centrality is the reciprocal of the sum of the shortest distances between cities, which refers to the degree to which each city is not controlled by other cities in the overall network [49]. The betweenness centrality reflects how a city controls the association between other cities [50]. If a city is on several of the shortest paths of other nodes, the city has greater intermediate centrality and a stronger ability to control the association between other cities.
Structural holes represent the nonredundant connections [51,52]. The structural hole indicator can effectively identify the nodes with advantages in the network. By calculating Burt’s four structural hole indices, the effective size of the network, efficiency, constraint, and hierarchy [53], the degree of homogeneity competition among different nodes in the overall network is analyzed. The effective size is the number of alters that the ego has minus the average number of connections that each alter has to others. Efficiency regulates the effective size of the ego network through its actual size. Constraint is a summative measure that takes advantage of the degree of connection between the ego and others. Hierarchy presents the nature of the constraint on the ego.
Core–periphery structures have been widely explored in the analysis of social networks [54]. The network core is usually a centralized and tightly connected set of network nodes, while the network periphery is a sparsely connected and usually noncentral set of nodes that are connected to the core [55,56]. In this study, the core–periphery model is used to reflect the relative position of each city in the urban network of the Tibetan Plateau and to divide the core area and the peripheral area.

2.3.3. Quadratic Assignment Procedure

The QAP is an effective analytical method that takes relational data as the object of study [46,47]. This method is a nonparametric test that considers statistical bias caused by the correlation of observations and thus can largely circumvent the problem [45,57]. Therefore, this study adopts QAP to explore the relational influencing factors of the tourism economic network and models our relationship through Double-Dekker Semi-Partialing. The QAP has usually been carried out in two steps: QAP correlation analysis and regression analysis.
QAP correlation analysis is used to investigate whether two relationship matrices are related to each other or whether there is a relationship between an attribute and another relationship. QAP regression is an analysis method to study the relationship between multiple matrices and a single matrix, and to evaluate the significance of regression coefficients. The specific calculation includes two steps. The first is to perform standard multiple regression analysis on the corresponding elements of the independent variable and the dependent variable matrix. The second is to perform standard multiple regression analysis on the dependent variable. Randomly replace each row and column, calculate the regression again, save the coefficient value and R2, and repeat this step hundreds of times to obtain the standard error of the statistic.

3. Results

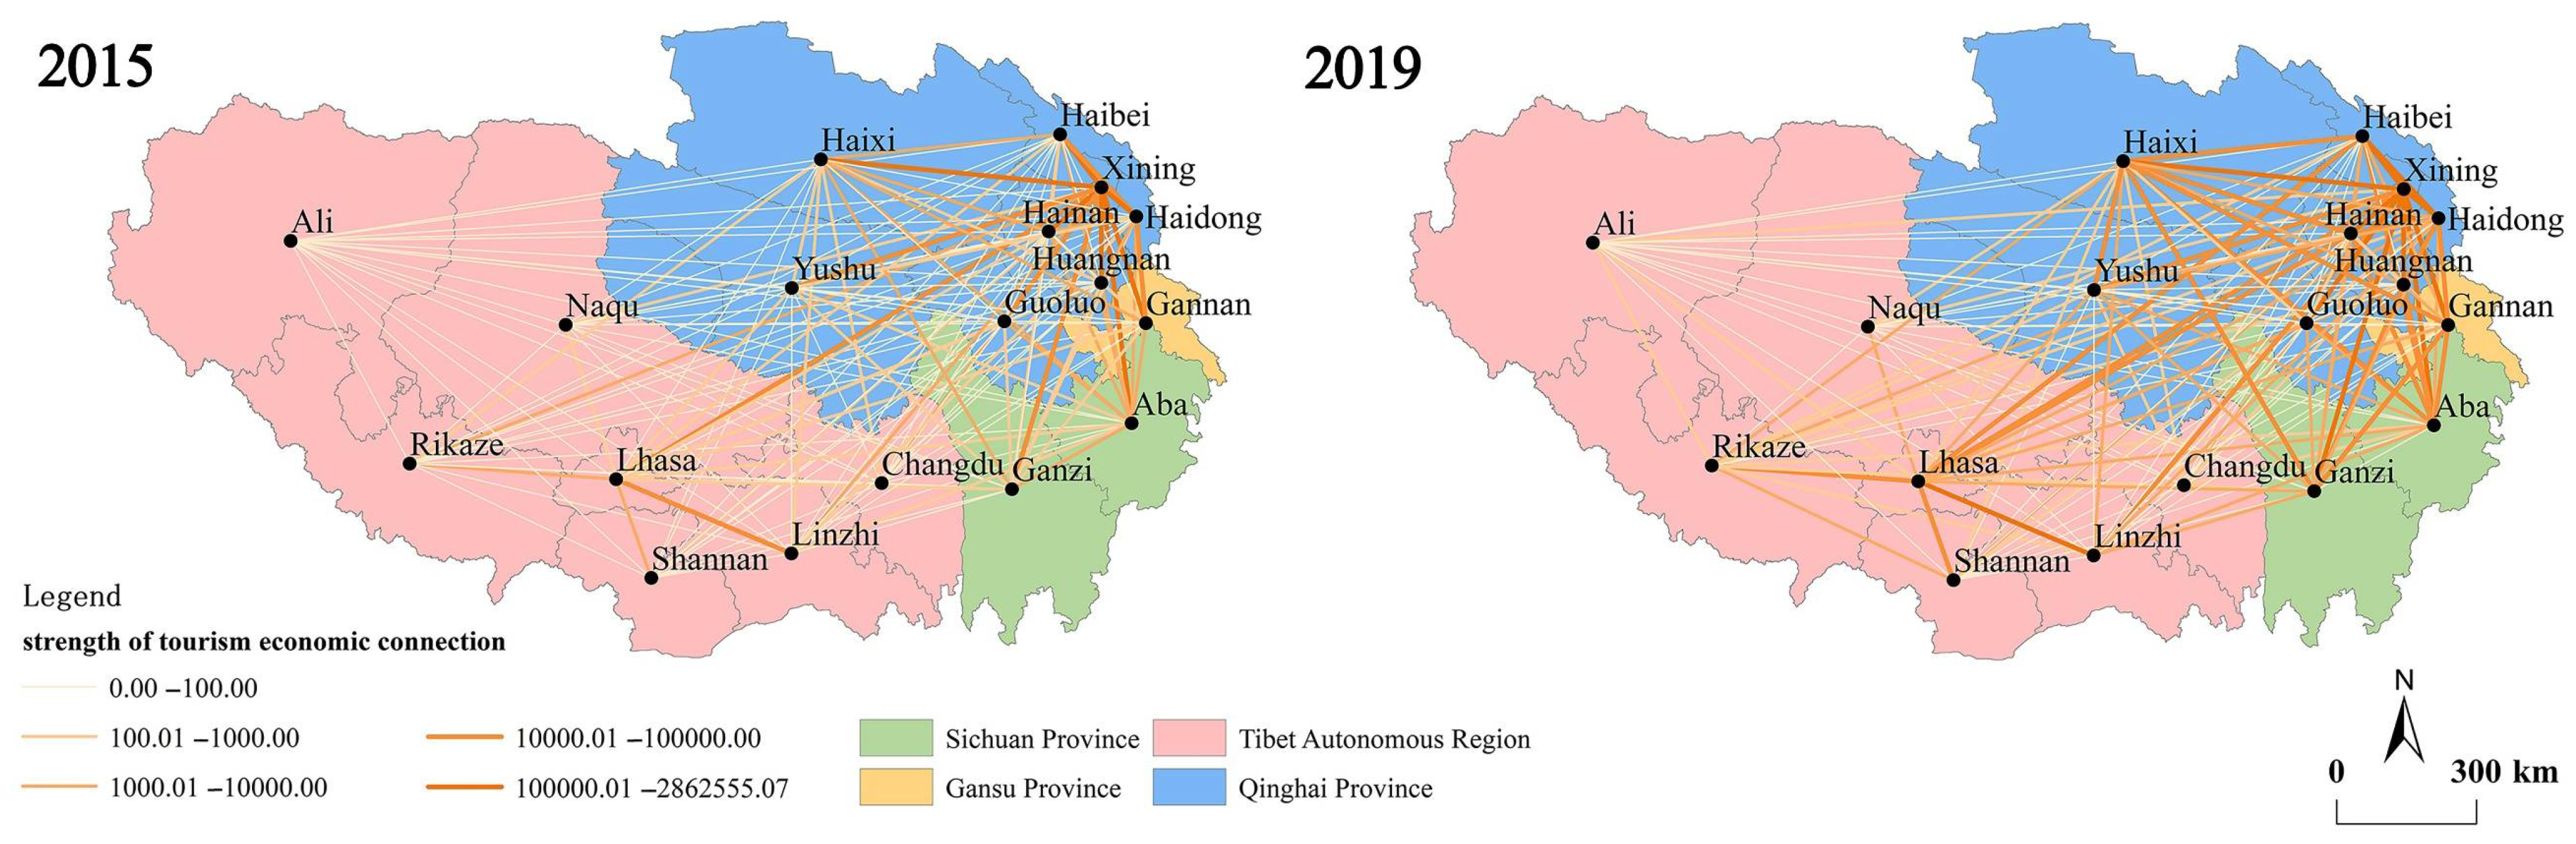
3.1. Strength of the Tourism Economic Connection

Following the modified gravity model, this paper calculated the strength of tourism economic connections among the 18 major cities on the Tibetan Plateau during 2015 and 2019 (Table 2). Figure 2 shows that each node indicates one city, and the connecting line presents the interaction between two cities. The width of the connecting line indicates the degree of interaction.
In 2015, the top 3 cities in terms of tourism economic connections were Xining, Haidong, and Hainan, which together accounted for 79.31% of the total tourism economy. The bottom 3 cities, Changdu, Naqu, and Ali, had weak tourism economic ties with other cities. In 2019, although the number of economic connections to cities generally improved, there was little change in city rankings. In recent years, the development of tourism routes, such as the Sichuan–Tibet route and the Qinghai–Tibet route, has led to the development of tourism in cities along the route and promoted overall Tibetan Plateau tourism development.
At the provincial level, Qinghai Province had the highest tourism economic corporations among cities. This is because Qinghai Province has rich tourism resources and convenient transportation facilities. The 13th Five-Year Plan for Tourism Development in Qinghai Province proposes to systematically plan the province as a large scenic area and enhance the overall concept. The tourism economic connection in Tibet is the lowest, which is related to the low level of economic development and traffic accessibility.

3.2. Tourism Economic Network Structural Characteristics

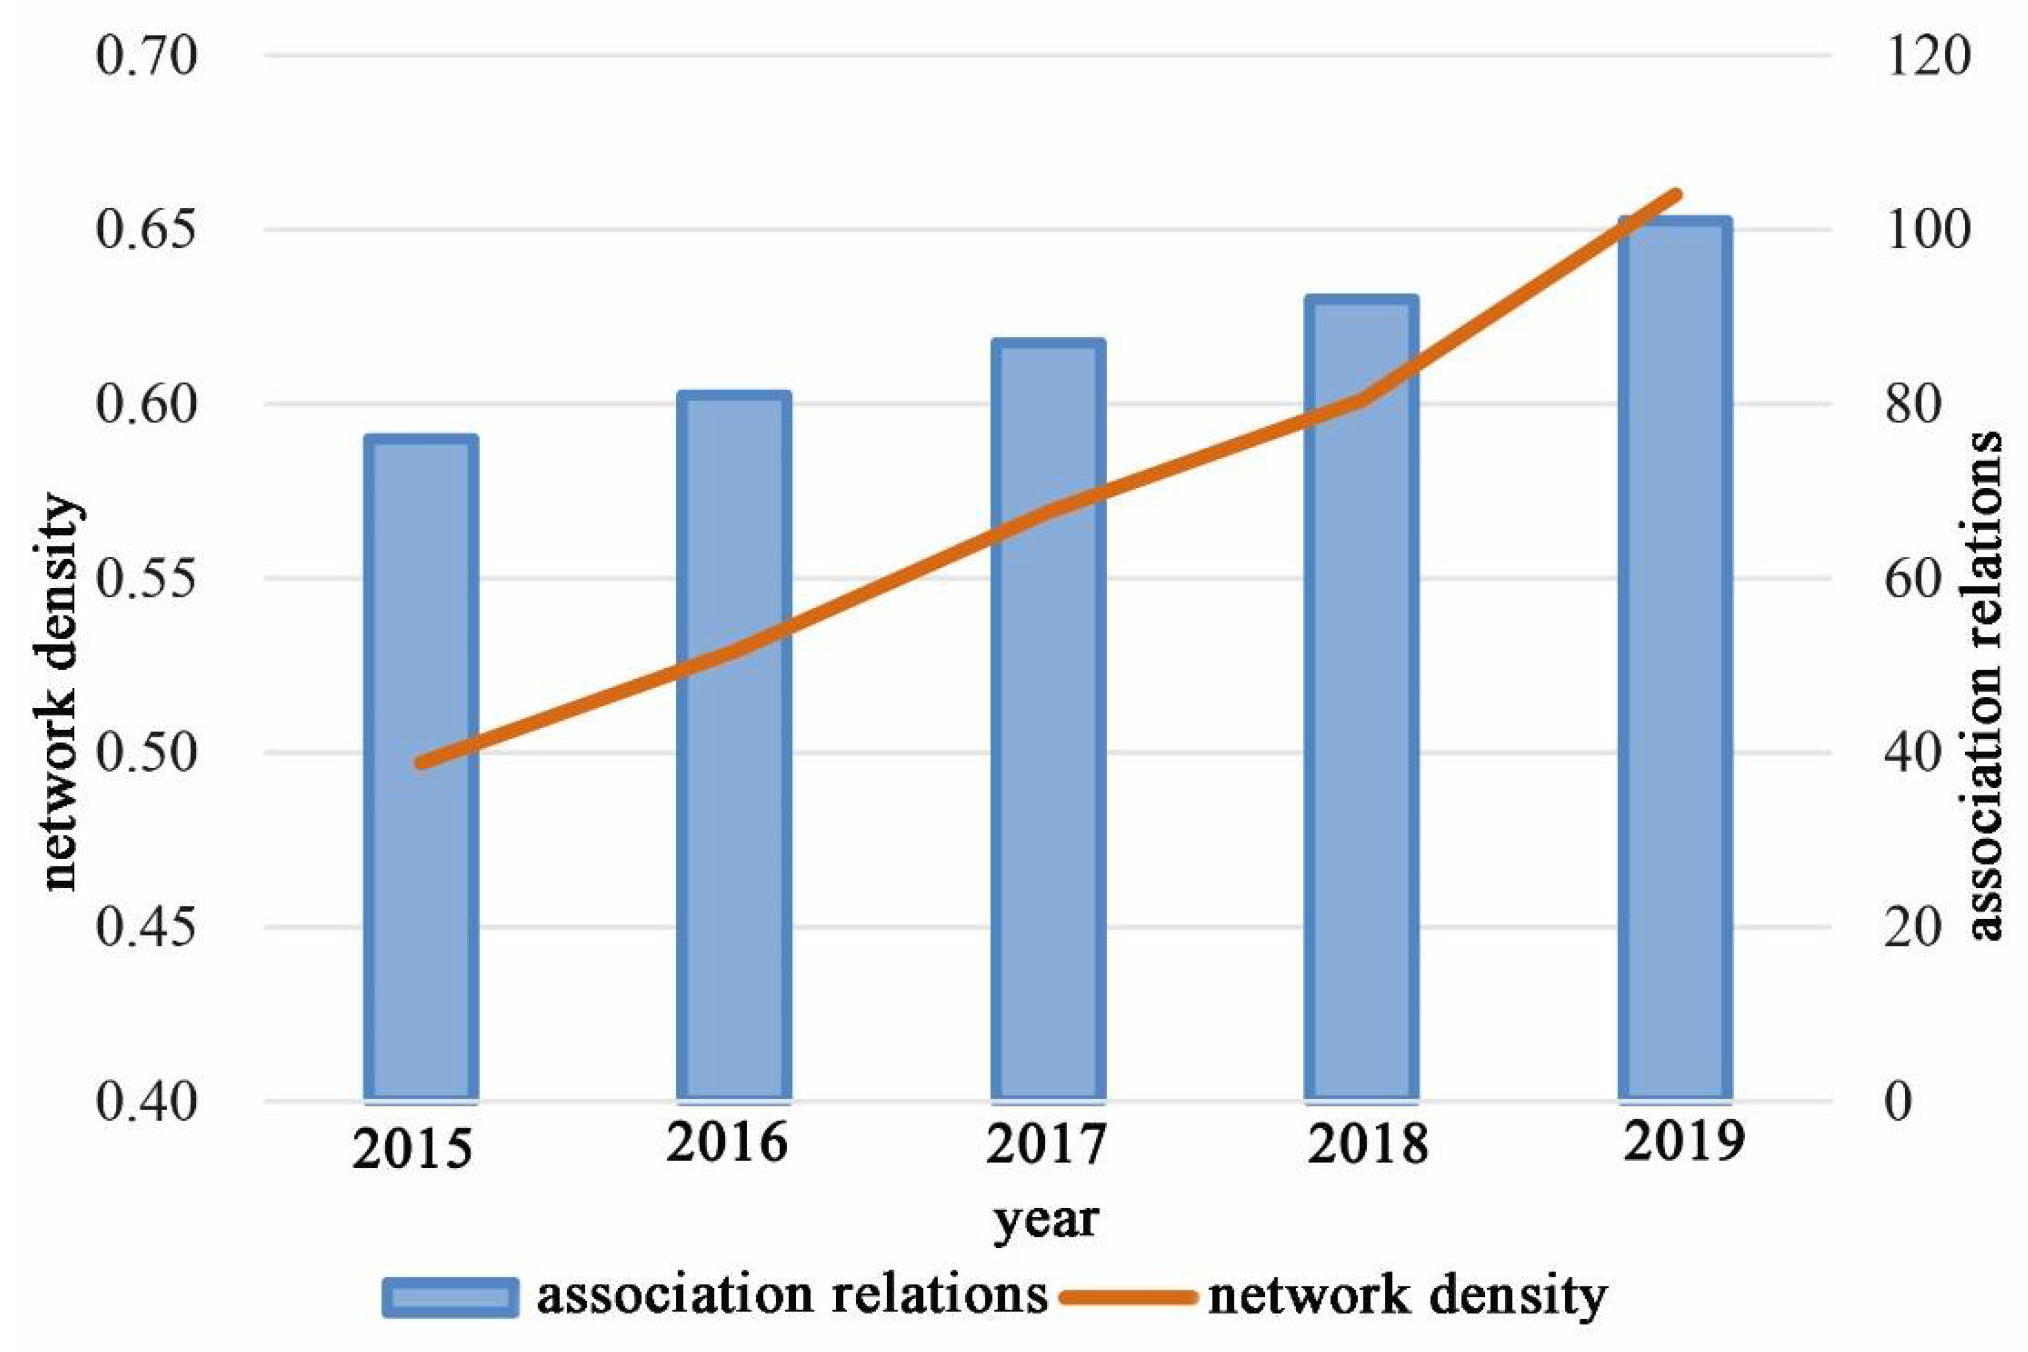
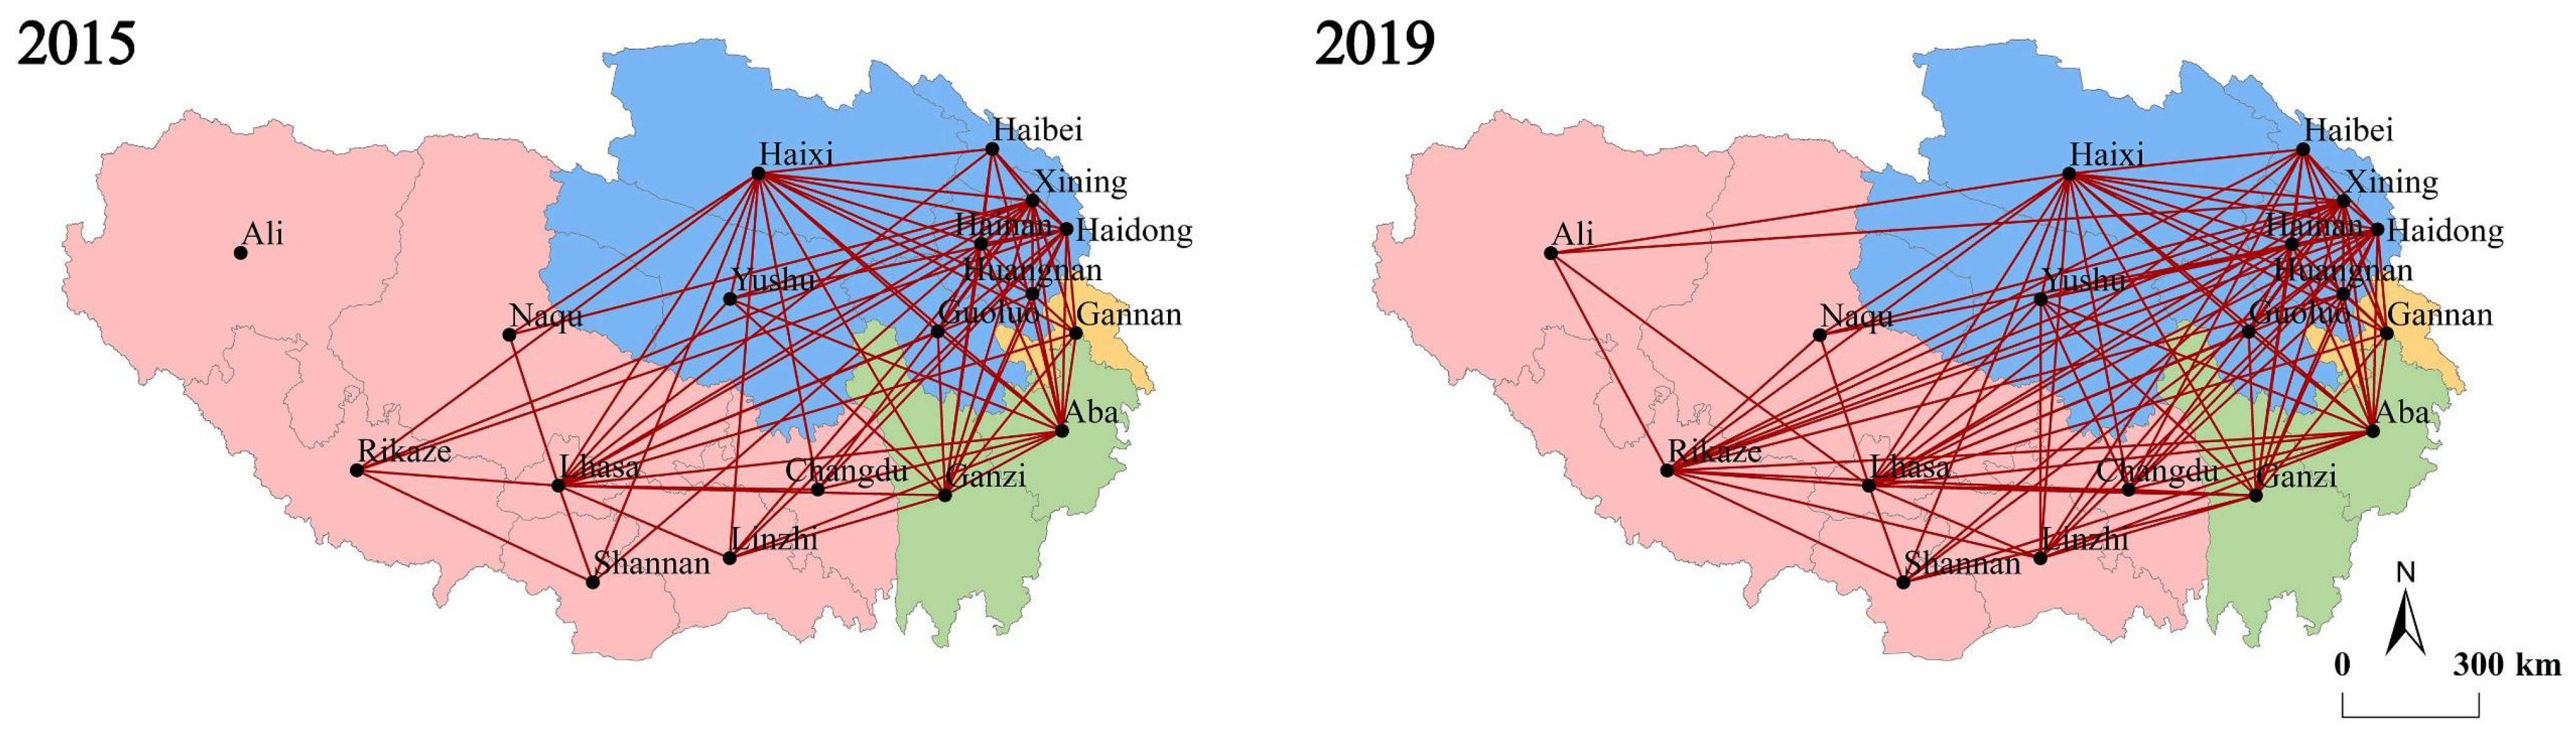
3.2.1. Structural Characteristics and Evolutionary Trend of the Overall Network

This study identified the tourism economic network structure of Tibetan Plateau cities and established a relation matrix. Figure 3 plots the evolutionary trends of the network density and association relations of the tourism economic network from 2015 to 2019, which shows that the network density exhibited an upwards trend overall. We used ArcGIS 10.5 to visualize the structure of the spatial association network in 2015 and 2019, as shown in Figure 4. The network density and the number of association relations in 2019 increased by 32.80% and 32.89%, respectively, compared with the data in 2015. In summary, these results showed a marked improvement in the regional tourism economic connections between cities.

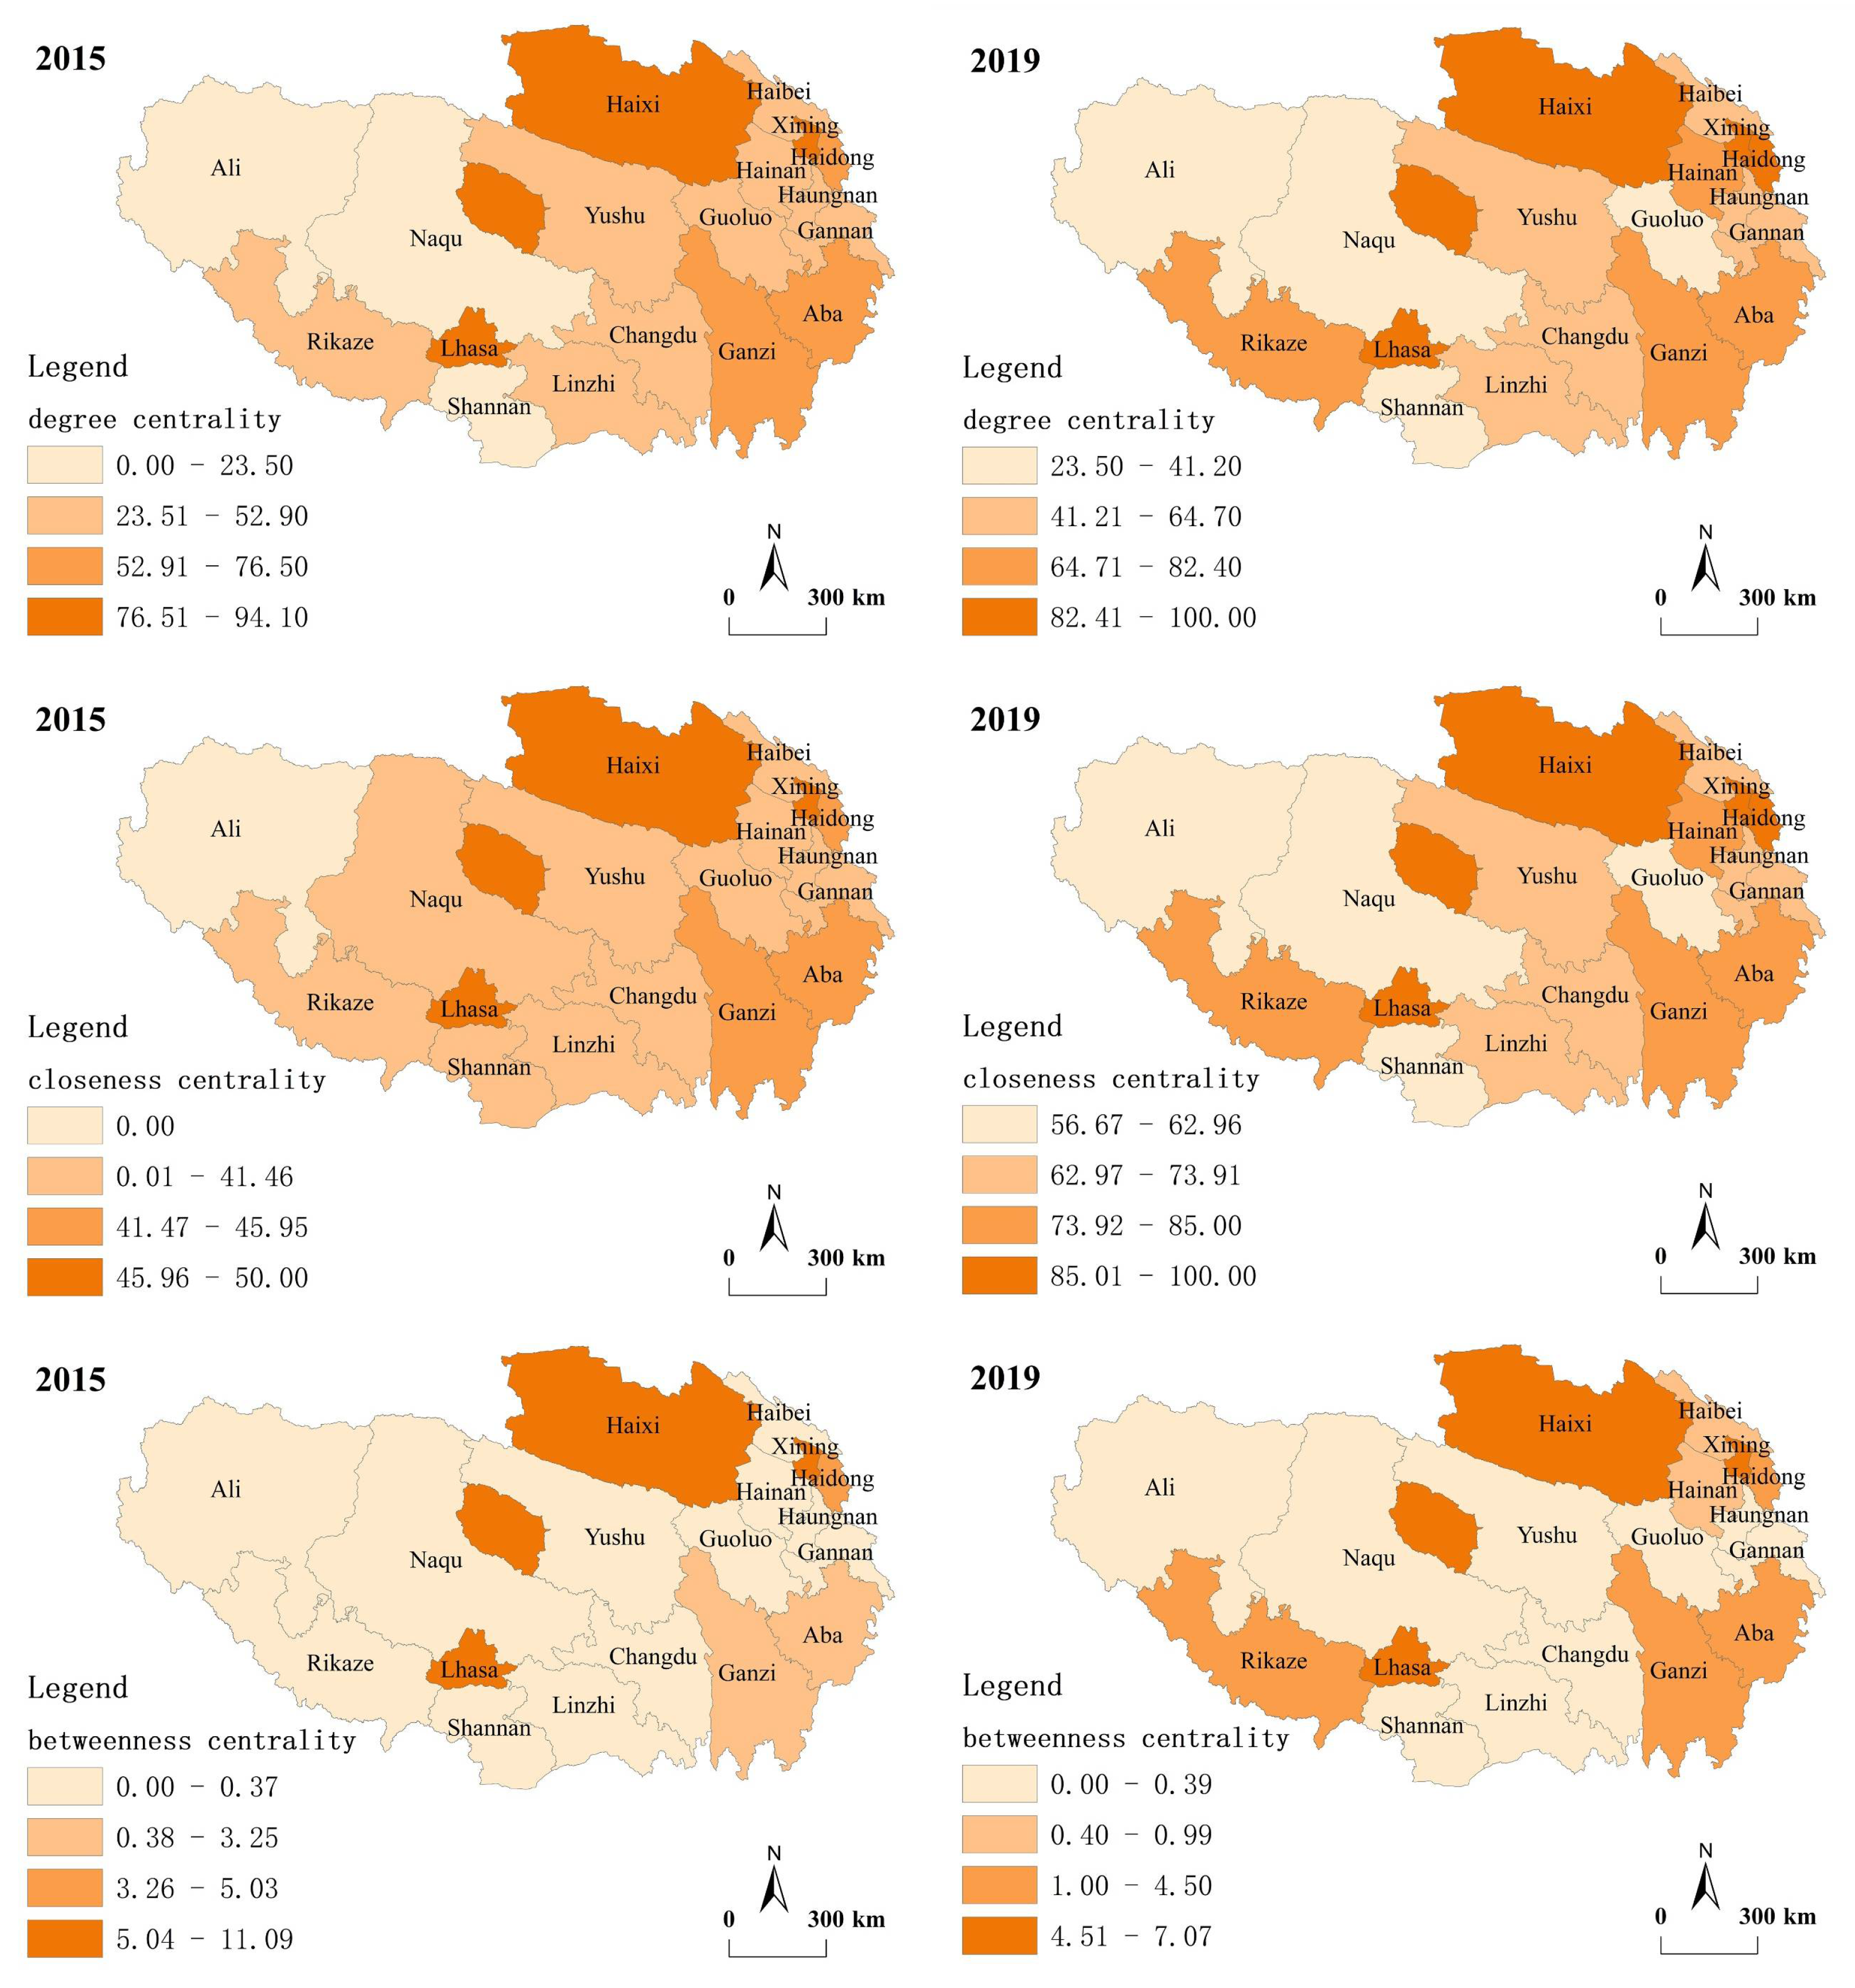
3.2.2. Evolutionary Trend of the Centrality

This study used the data from 2015 and 2019 to calculate the degree, betweenness, and closeness of the tourism economic network of the Tibetan Plateau. The spatial distributions of degree, betweenness, and closeness centrality are shown in Figure 5.
The degree centrality index showed that 7 cities were above the mean value (49.67) in 2015; the highest value was Xining, followed by Haixi, Lhasa, Aba, Haidong, Ganzi, and Hainan, suggesting that the 7 cities had more economic tourism connections between the surrounding cities. In contrast, Naqu and Ali ranked in the last two, suggesting that these cities had a low connection with other cities. The overall degree centrality value showed a distribution characteristic of “high in the east and low in the west”, which indicates that the tourism connection to Tibet is still in the initial development stage and that the connection with other regions is weak. In 2019, in addition to the 7 cities mentioned above, the centrality of Rikaze was larger than the average (66.01). Overall, although the degree centrality of tourism connections on the Tibetan Plateau still exhibited the characteristics of the east being stronger than the west, the mean value of the degree centrality in 2019 increased by 32.89% compared to 2015, indicating that the imbalance tends to moderate with the enhancement of the radiation effect.
In terms of the closeness centrality index, 11 cities were above the mean value (39.54) in 2015, and the top 3 cities were Xining, Haixi, and Lhasa, suggesting that these cities had a high level of control over other cities in the tourism economic network. In 2019, the average closeness degree increased to 11.08, while the top three cities remained the same. This shows that the three cities had a stronger ability to gain tourism economic factors than other cities. Figure 5 shows that the closeness of Tibetan cities is generally low, and they are marginalized in tourism economic connections from 2015 to 2019.
The betweenness centrality index showed that 5 cities were above the mean value (2.45) in 2015, followed by Xining, Haixi, Lhasa, Haidong, and Aba, suggesting that the control power of these cities was stronger than that of other cities on the Tibetan Plateau and acted as a bridge in the spatial network of the tourism economy. The regional network of tourism links was overly dependent on these cities, with a low intermediate centrality of other municipalities, weak controllability of other cities, and an imbalance in the development of the entire tourism network. Naqu, Ali, and Shannan ranked in the last 3, with a betweenness centrality value of 0, indicating that 3 cities had weak controllability for other cities. In 2019, the mean value of betweenness centrality decreased to 2.12, and the value of Rikaze was significantly higher, while the value of Ali and Naqu remained at 0. Figure 5 shows that Xining, Haixi, and Lhasa still ranked in the top three, suggesting that these cities regulated the tourism economic connections in the Tibetan Plateau.

3.2.3. Structural Holes

In the tourism economic connection network, the cities with a high level of structural holes can connect the cities that are not directly connected, representing the degree of homogeneous competition.
Table 3 shows that in 2015, Lhasa, Xining, and Haixi had a large effective size and high efficiency, lower constraints, and a high level of structural holes in the tourism economic network. These cities can promote communication between different groups in the overall network, such as tourists and economic flow. However, Naqu, Shannan, Haibei, Guoluo, and Gannan have a relatively low effective size and efficiency and a higher constraint, which indicates that these cities lack competitive advantages.
In 2019, the level of structural holes in the Tibetan Plateau urban network generally decreased, indicating that the network structure is becoming more complex. The advantages in Lhasa, Xining, and Haixi were still obvious. The effective size and efficiency of Rikaze, Ganzi, and Yushu significantly improved, indicating that their ties with other cities have been strengthened and can conveniently obtain more information from other cities. Ali and Naqu still had the lowest level of structural holes. They should strengthen cooperation with the surrounding cities in an advantageous position, such as Lhasa and Rikaze.

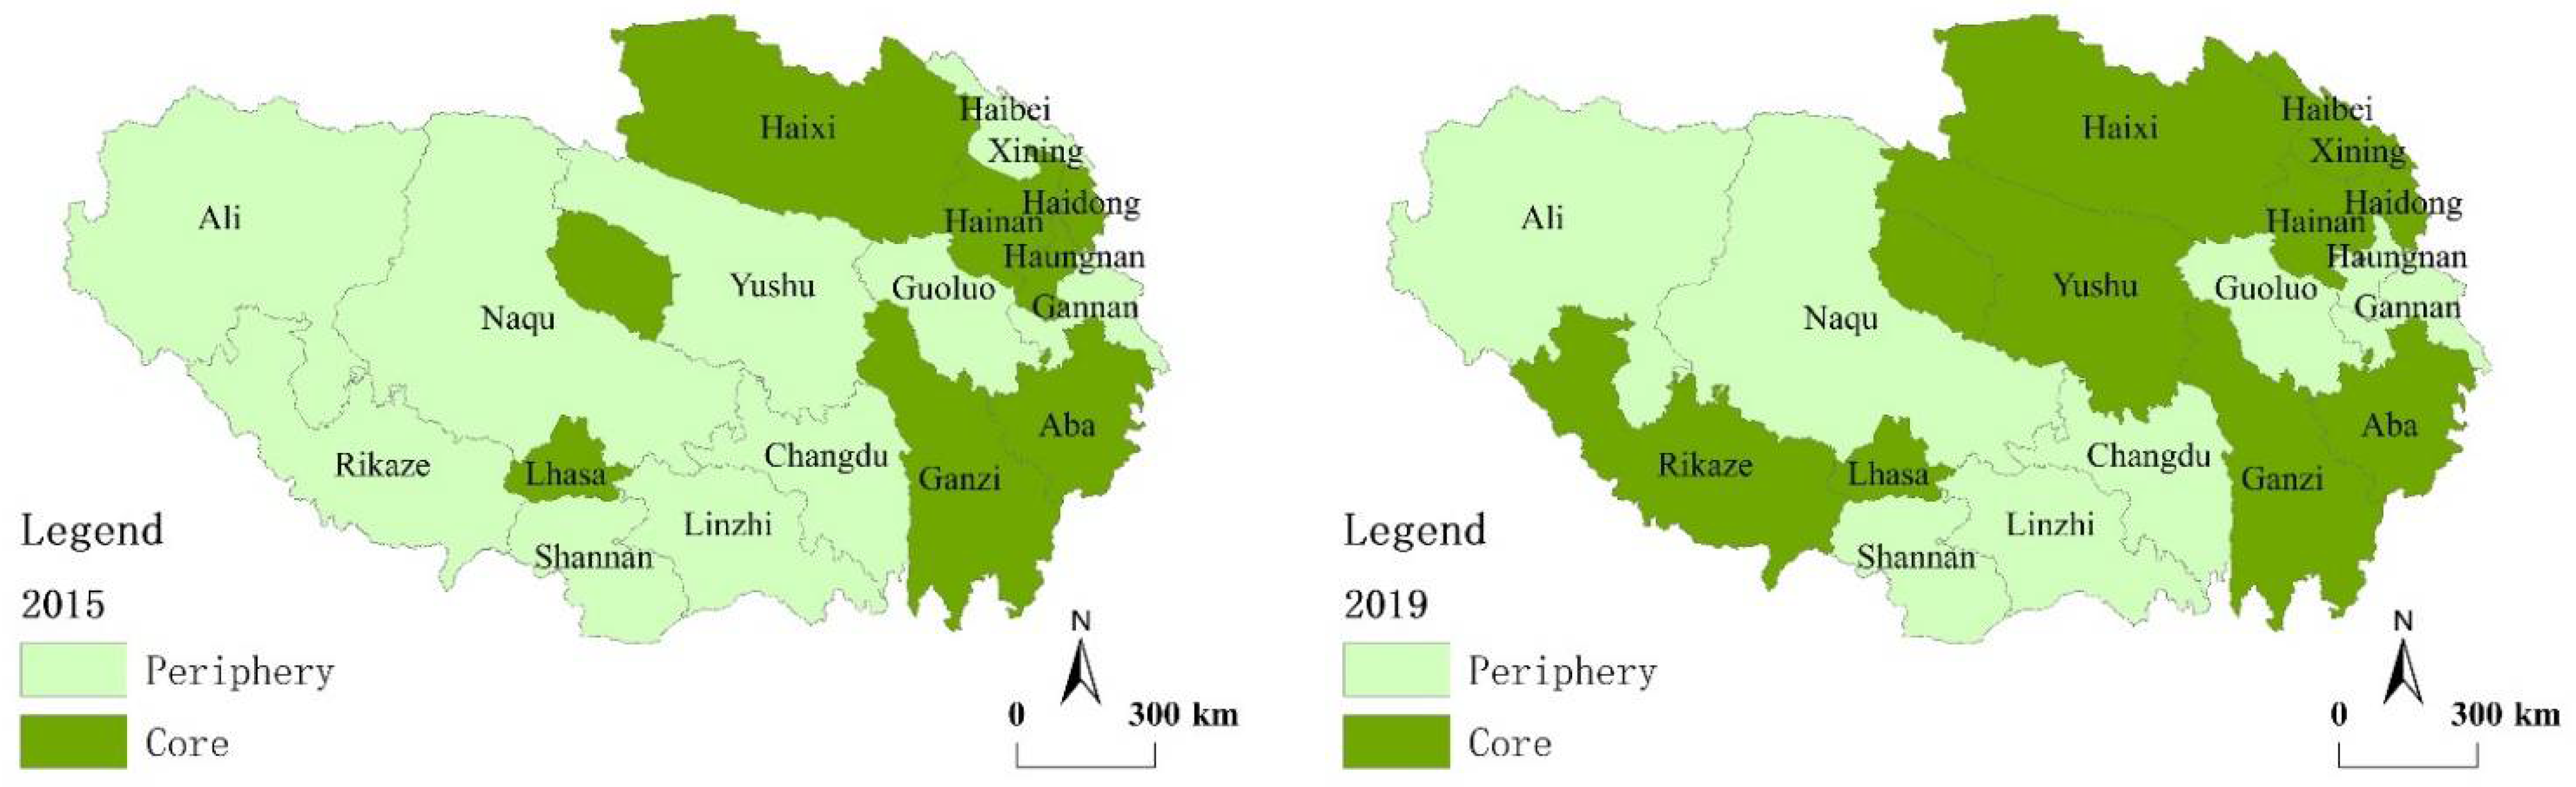
3.2.4. Core–Periphery Model

Through the analysis of the core–periphery structure of urban tourism economic ties on the Tibetan Plateau (Table 4 and Figure 6), it can be seen that the overall tourism economic network on the Tibetan Plateau presented a significant core–periphery distribution pattern.
In 2015, the overall network structure developed unevenly, showing a spatial pattern of the “western part is higher than the eastern part”. Except for the isolated core Lhasa, the southeast and northeast cities, such as Haixi, Xining, Aba, and Ganzi, were at the network’s core. In contrast, remote cities, such as Ali, Rikaze, and Naqu, were marginalized. These core cities had more spatial associations with other regions and contributed to the whole tourism association of the Tibetan Plateau.
In 2019, the number of cities located in the core grew to 10, of which Haibei, Yushu, and Rikaze became new core areas and Huangnan became marginal areas. The layout of the core area shows the distribution of two areas: the Qinghai–Sichuan area and the Lhasa–Rikaze area. On the whole, the degree of tourism economic connection is gradually rising, and the cities in the marginal areas gradually join the core structure. Lhasa, Xining, Ganzi, and Aba have always been at the core of the tourism economic network. Ali and Naqu have weak tourism economic connections with other cities and states on the Tibetan Plateau. On the one hand, they have fewer tourism attraction resources. On the other hand, they are far away from the tourist source market, and the high altitude also limits the physical condition of regional tourists. As a result, it has formed the periphery of the tourism economic network with relatively weak attractiveness.

3.3. Factors Influencing the Tourism Economic Network

The previous analysis addressed the centrality of cities in the urban tourism economic network of the Tibetan Plateau as well as the core–edge structure. Next, the factors that influence the spatial association network were discussed. First, the dependent variable is the spatial association, i.e., the spatial association matrix obtained above for 2019. Second, the following seven relationship variables were selected to examine the factors influencing spatial association: (i) the A-level attractions—expressed by the sum value matrix of the number of A-level attractions between cities; (ii) the difference in elevation—expressed by the absolute value matrix of the difference in the elevation between cities; (iii) the star-rated hotels—expressed by the sum value matrix of the number of star-rated hotels between cities; (iv) the percentage of total tourism revenue in GDP—expressed by the sum value matrix of the percentage of total tourism revenue in GDP between cities; (v) road density—expressed by the sum value matrix of the road density between cities; (vi) geographical adjacency—if two cities are geographically adjacent, then the matrix element is assigned with 1, otherwise, it is 0; and (vii) the administrative connection—if two cities belong to the same province, then the matrix element is assigned with 1, otherwise, it is 0.
The direction of spatial association was not considered in this study. We used the absolute values of the differences across cities to construct a difference matrix for indicators i to vii to make various indicators comparable. The range method was used to normalize the relation matrix.

3.3.1. The QAP Correlation Analysis

The QAP correlation analysis compares the similarity of two matrix values based on matrix data arrangement. UCINET software was used to randomly arrange the matrix data 5000 times to obtain the correlation coefficient between the spatial correlation matrix of the Tibetan Plateau tourism economic connection network and its influencing factors. The results are shown in Table 5.
Table 5 shows that the correlation coefficient between the star-rated hotels and the spatial association is significantly positive at the 1% level. The A-level attractions and road density have a significant positive correlation with spatial relations at the 5% level. The difference in elevation, the percentage of total tourism revenue in GDP, geographical adjacency, and administrative connection do not pass the significance test, indicating that these four variables have no significant impact on the spatial association.

3.3.2. The QAP Regression Analysis

The QAP regression analysis is used to explore the regression relationship between multiple independent variable matrices and a dependent variable matrix. This study removed four variables: the difference in elevation, percentage of total tourism revenue in GDP, geographical adjacency, and administrative connection. We selected the remaining three driving factors with significant correlation coefficients as the independent variables for QAP regression analysis. UCINET software was used to randomly permute the data 20,000 times, and the results are shown in Table 6. The regression coefficients of the relation matrix variables and their significance test results imply that A-level attractions and star-rated hotels significantly affect the formation of the spatial association network.
The coefficient of the A-level attractions matrix is significantly positive at the 5% level, indicating that the A-level attractions play an important role in promoting the formation of the spatial association. The reason is that tourist attraction is the significant component of tourism products and the center of the tourism industry. Lhasa and Xining have far more tourism resources than other cities on the Tibetan Plateau, so it is easier to have tourism economic associations with other cities.
The coefficient of star-rated hotels is significantly positive at the 1% level, indicating that star-rated hotels have a positive effect on the formation of the spatial association. The reason is that the scale and grade of star-rated hotels have become an important yardstick to measure local economic indicators, and star-rated hotels in Western China have an obvious driving effect on the tourism economy [58]. However, the accommodation conditions in the high-altitude areas of Tibet and Qinghai restrict people’s travel choices [33]. Ordinary travel agencies will also prioritize the safety and comfort of accommodations when arranging travel, resulting in more tourism links between cities with a large number of hotels.
In addition, road density has no significant impact on spatial association.

4. Discussion

The purpose of this paper was to explore the tourism economic network of the Tibetan Plateau. This study not only measured the strength of tourism economic connections on the Tibetan Plateau, but also analyzed the dynamic evolution and driving factors of the spatial association network.
First, the tourism market and traffic distance have become important factors affecting tourism economic connection strength between cities, which is consistent with the studies of Yu et al. [59]. The number of economic connections to cities generally improved from 2015 to 2019, but there was little change in city rankings. Xining had the highest strength of tourism economic connections, while Ali had the lowest. On a provincial scale, cities in Qinghai Province generally had higher tourism economic connection strength, more bordering provinces around them, and a series of government policies issued to promote overall tourism development. Tibet had a lower strength of economic connection. This may be due to the local tourism industry being in a development stage. In terms of the structural characteristics of the overall network, the density value and association relations of the network increased during the study period, indicating that regional tourism economic connections increased significantly, with cities becoming increasingly connected.
Second, the results of degree, closeness, betweenness centrality, and structural holes analyses showed that Xining, Haixi, and Lhasa presented the characteristics of strong centrality with a structural hole advantage. Ali, Naqu, and Guoluo presented the characteristics of low centrality. Although the overall development of the network tended to be balanced during the study period, it still showed a greater value of centrality in the western part of the Tibetan Plateau than in the eastern part. At the provincial level, the centrality of cities in Qinghai Province was stronger than that in other regions.
Third, the urban tourism economic network of the Tibetan Plateau shows an obvious core–edge structure, with uneven development of the overall network structure in 2015, showing the spatial pattern that determines that the “western part is higher than the eastern part”. The year 2019 shows the layout of the core area, showing the distribution of two areas: the Qinghai–Sichuan area and the Lhasa–Rikaze area. In general, the scope of the core area gradually expands, and the cities in the periphery gradually integrate into the high-density core structure. Core cities also promote the development of surrounding cities, which corroborates the finding from the study conducted by Gan et al. [4].
Finally, based on the QAP regression results, we can see that A-level attractions and star-rated hotels can significantly affect the tourism economy connection. These findings provide a theoretical basis on which policy-makers can promote tourism economic integrations and connections. The Tibetan Plateau’s resource endowments dictate that its development needs to rely on tourism, which plays an important role in driving local herders out of poverty and increasing their income, as well as in the sustainable development of ecotourism. Through a method of quantifying different tourism development objectives, Zhang et al. [29] found that there was an urgent need for Tibet to develop tourism-related infrastructure, which is consistent with our results. Therefore, the results obtained through our QAP analysis are consistent with the actual needs of tourism development on the Tibetan Plateau. However, the relatively backward economic conditions and fragile ecological environment dictate that the scale of tourism must be strictly controlled in the process of tourism development on the Tibetan Plateau according to the existing ecological carrying capacity. The government should pay attention to the rational development of scenic spots and build a reasonable number of star-rated hotels.

4.1. Theoretical Implications

This study has several theoretical implications. First, in terms of the research method, this study uses the social network approach to analyze the network structure characteristics of Tibetan Plateau cities from the perspective of the network, which enriches the related research on tourism spatial networks.
Second, the modified gravity model is used to calculate the strength of tourism economic connections between cities. Tourism revenue and the number of tourists are chosen to represent tourism quality, the ratio of geospatial distance to the difference of GDP of two cities is taken as the distance between two cities, and the proportion of tourism trips to the total number of tourism trips of two cities is used to correct the empirical constants. Thus, a tourism economic spatial connection matrix is established.
Third, most of the previous studies focus on urban clusters in economically developed regions. However, this paper makes up for the lack of research in this area by studying cities on the Tibetan Plateau, which possess great potential but face challenges in development. It contributes to the sustainable development of the tourism economy.
Finally, this study identifies the evolution of different cities’ positions in the tourism economic network from 2015 to 2019 and explores the driving factors of the evolution of the network structure.

4.2. Practical Implications

First, in the Tibetan Plateau city tourism economic network, Lhasa, Xining, Haixi, Aba, and other cities located in the core position should enhance the role of a bridge, with the advantages of tourism economic growth pole radiating to surrounding cities. Marginal areas, such as Ali and Nagqu in Tibet and Guoluo in Qinghai, should promote tourism economic development policies and formulate scientific tourism development plans. Moreover, based on the tourism lines of the Sichuan–Tibet South Line, Sichuan–Tibet North Line, and Qinghai–Tibet Line, various characteristic cultures are spatially combined to improve the exchange network, and advance the formation and development of regional tourism integration on the Tibetan Plateau.
Second, Tibetan Plateau cities should benefit from the plateau characteristics of tourism resources to improve the development and construction of scenic spots and service levels to attract tourism investment. In particular, cities located in low-value areas, such as Ali and Nagqu, should fully explore the ecological and cultural resources, such as the Guge dynasty, sacred mountains, sacred lakes, Qiangtang nature reserve, and other tourism resources with world-class value, and turn the unique and high-quality ecological and cultural resource advantages into economic advantages.
Third, under the premise of protecting the environment, the construction of star-rated hotels and other service facilities in moderation promotes the strengthening of tourism economic ties. The tourism reception capacity and service quality are improved, providing tourists with a more convenient and comfortable tourism experience.

5. Conclusions

Based on the data for the Tibetan Plateau cities from 2015 to 2019, the modified gravity model was used to determine the spatial association. In addition, the social network analysis method was adopted to study the structural characteristics and evolutionary trends of the overall network and centrality. Finally, the QAP correlation and regression analysis methods were employed to explore the driving factors. The study lead to the following conclusions:
  • The strength of tourism economic connections between cities on the Tibetan Plateau witnessed an improvement from 2015 to 2019, but it was unbalanced in spatial distribution. Tourism economic strength was generally higher in Qinghai Province and lower in Tibet.
  • The overall network structure from 2015 to 2019 showed an overall upwards trend in the density and association relations. The tourism and economic connections between cities on the Tibetan Plateau increased significantly, and the tourism and economic ties grew closer. However, network connectivity was significantly higher on the eastern Tibetan Plateau.
  • The spatial association network presented a significant core–edge distribution pattern. Xining, Haixi, and Lhasa were all higher than other cities in the network, which was the bridge with the advantage of structural holes. Meanwhile, the centrality of Rikaze significantly improved during the study period. However, Naqu, Ali, and Guoluo were always at the edge of the network.
  • The QAP regression analysis showed that A-level attractions and star-rated hotels could significantly promote the formation of spatial association.
Several limitations to this study need to be acknowledged. As a result of the difficulty in obtaining data on the tourism economy of some cities, the current study only examined the data from 2015 to 2019; thus, it is difficult to study the evolution of the tourism economy of cities on the Tibetan Plateau over a longer period of time. In addition, in further research, we can try to explore the economic links of tourism between cities by studying different tourism flows. Moreover, this study analyzed the influencing factors on the structure of the tourism economic network. However, empirical studies are unable to determine the mechanisms of influencing factors. Future research should therefore concentrate on methods to explore the impact mechanism of these factors.

Author Contributions

Writing—original draft preparation, X.C.; writing—review and editing, X.C. and F.H.; visualization, X.C., T.W. and X.Z.; supervision, Z.Y. All authors have read and agreed to the published version of the manuscript.

Funding

This research was funded by the Second Tibetan Plateau Scientific Expedition and Research Program, grant number 2019QZKK1004 and 2019QZKK0401.

Institutional Review Board Statement

Not applicable.

Informed Consent Statement

Not applicable.

Data Availability Statement

Data is available for use upon request.

Conflicts of Interest

The authors declare no conflict of interest.

References

  1. Cawley, M.; Marsat, J.; Gillmor, D. Promoting integrated rural tourism: Comparative perspectives on institutional networking in France and Ireland. Tour. Geogr. 2007, 9, 405–420. [Google Scholar] [CrossRef]
  2. van der Zee, E.; Vanneste, D. Tourism networks unravelled; a review of the literature on networks in tourism management studies. Tour. Manag. Perspect. 2015, 15, 46–56. [Google Scholar] [CrossRef] [Green Version]
  3. Zach, F.; Racherla, P. Assessing the value of collaborations in tourism networks: A case study of Elkhart County, Indiana. J. Travel Tour. Mark. 2011, 28, 97–110. [Google Scholar] [CrossRef]
  4. Gan, C.; Voda, M.; Wang, K.; Chen, L.; Ye, J. Spatial network structure of the tourism economy in urban agglomeration: A social network analysis. J. Hosp. Tour. Manag. 2021, 47, 124–133. [Google Scholar] [CrossRef]
  5. Buhalis, D.; Molinaroli, E. Entrepreneurial networks and supply communities in the Italian eTourism. Inf. Technol. Tour. 2002, 5, 175–184. [Google Scholar] [CrossRef]
  6. Cehan, A.; Eva, M.; Iațu, C. A multilayer network approach to tourism collaboration. J. Hosp. Tour. Manag. 2021, 46, 316–326. [Google Scholar] [CrossRef]
  7. Kelliher, F.; Reinl, L.; Johnson, T.G.; Joppe, M. The role of trust in building rural tourism micro firm network engagement: A multi-case study. Tour. Manag. 2018, 68, 1–12. [Google Scholar] [CrossRef]
  8. Liu, Y.; Zhang, R.; Zhao, W.; Wang, S.; Fu, B. Comparison between tourists’ and inhabitants’ willingness to pay for nature in the Tibetan Plateau. J. Clean. Prod. 2020, 255, 120219. [Google Scholar] [CrossRef]
  9. Tran, M.T.; Jeeva, A.S.; Pourabedin, Z. Social network analysis in tourism services distribution channels. Tour. Manag. Perspect. 2016, 18, 59–67. [Google Scholar] [CrossRef]
  10. Kim, Y.-R.; Scott, N. Network dynamics of tourism development in South Korea. Curr. Issues Tour. 2018, 21, 1239–1259. [Google Scholar] [CrossRef] [Green Version]
  11. Scott, N.; Baggio, R.; Cooper, C. Network Analysis Methods for Modeling Tourism Inter-Organizational Systems; Emerald Group Publishing Limited: Bingley, UK, 2011. [Google Scholar]
  12. Kang, S.; Lee, G.; Kim, J.; Park, D. Identifying the spatial structure of the tourist attraction system in South Korea using GIS and network analysis: An application of anchor-point theory. J. Destin. Mark. Manag. 2018, 9, 358–370. [Google Scholar] [CrossRef]
  13. Wang, K.; Wang, M.; Gan, C.; Chen, Q.; Voda, M. Tourism Economic Network Structural Characteristics of National Parks in the Central Region of China. Sustainability 2021, 13, 4805. [Google Scholar] [CrossRef]
  14. Liu, B.; Huang, S.S.; Fu, H. An application of network analysis on tourist attractions: The case of Xinjiang, China. Tour. Manag. 2017, 58, 132–141. [Google Scholar] [CrossRef]
  15. Wang, Y.; Li, X.; Lai, K. A meeting of the minds: Exploring the core–periphery structure and retrieval paths of destination image using social network analysis. J. Travel Res. 2018, 57, 612–626. [Google Scholar] [CrossRef]
  16. Pavlovich, K. A rhizomic approach to tourism destination evolution and transformation. Tour. Manag. 2014, 41, 1–8. [Google Scholar] [CrossRef]
  17. Wang, S.; Xu, X.; Ma, J.; Wang, Y. Spatial and temporal evolution of the tourism economy network in Xinjiang: Based on modified gravity model and social network analysis. Arid. Land Geogr. 2020, 43, 458–465. (In Chinese) [Google Scholar]
  18. Wang, J.; Xia, J. Study on the Spatial Network Structure of the Tourism Economy in China and Its Influencing Factors: Investigation of QAP Method. Tour. Trib. 2018, 33, 13–25. [Google Scholar]
  19. Yang, L.; Liu, N.; Bai, C. The Spatial Structure of the Tourism Economy in Beijing-Tianjing-Hebei-Xiongan Region. Sci. Geogr. Sin. 2018, 38, 394–401. (In Chinese) [Google Scholar]
  20. Zhong, Y.; Feng, X.; Wen, Y. The Evolvement and Driving Mechanism of Economic Network Structure in the Changjiang River Economic Zone. Sci. Geogr. Sin. 2016, 36, 10–19. (In Chinese) [Google Scholar]
  21. Wang, D.; Niu, Y.; Qian, J. Evolution and optimization of China’s urban tourism spatial structure: A high speed rail perspective. Tour. Manag. 2018, 64, 218–232. [Google Scholar] [CrossRef]
  22. Yin, P.; Lin, Z.; Prideaux, B. The impact of high-speed railway on tourism spatial structures between two adjoining metropolitan cities in China: Beijing and Tianjin. J. Transp. Geogr. 2019, 80, 102495. [Google Scholar] [CrossRef] [PubMed]
  23. Makkonen, T. Cross-border shopping and tourism destination marketing: The case of Southern Jutland, Denmark. Scand. J. Hosp. Tour. 2016, 16, 36–50. [Google Scholar] [CrossRef]
  24. Dejean, S. The role of distance and social networks in the geography of crowdfunding: Evidence from France. Reg. Stud. 2019, 54, 329–339. [Google Scholar] [CrossRef]
  25. Mou, N.; Zheng, Y.; Makkonen, T.; Yang, T.; Tang, J.J.; Song, Y. Tourists’ digital footprint: The spatial patterns of tourist flows in Qingdao, China. Tour. Manag. 2020, 81, 104151. [Google Scholar] [CrossRef]
  26. Matsumoto, H.; Domae, K. Assessment of competitive hub status of cities in Europe and Asia from an international air traffic perspective. J. Air Transp. Manag. 2019, 78, 88–95. [Google Scholar] [CrossRef]
  27. Monzon, A.; Lopez, E.; Ortega, E. Has HSR improved territorial cohesion in Spain? An accessibility analysis of the first 25 years: 1990–2015. Eur. Plan. Stud. 2019, 27, 513–532. [Google Scholar] [CrossRef]
  28. Zheng, C.; Ma, Y. Spatial economic connection and network structure of cities in Central Jilin Urban System. J. Univ. Chin. Acad. Sci. 2021, 38, 323–332. [Google Scholar]
  29. Zhang, J.; Zhang, Y. Trade-offs between sustainable tourism development goals: An analysis of Tibet (China). Sustain. Dev. 2019, 27, 109–117. [Google Scholar] [CrossRef] [Green Version]
  30. Christie, I.T.; Sharma, A. Research notes: Millennium Development Goals—What is tourism’s place? Tour. Econ. Bus. Financ. Tour. Recreat. 2008, 14, 427–430. [Google Scholar]
  31. Saarinen, J.; Rogerson, C.M. Tourism and the millennium development goals: Perspectives beyond 2015. Tour. Geogr. 2014, 16, 23–30. [Google Scholar] [CrossRef]
  32. Shen, H. Discuss on the poverty alleviation by rural tourism in Tibet. Tibet. Stud. 2018, 2, 117–124. [Google Scholar]
  33. Cheng, D.; Fountain, J. Mainland Chinese Generation Y tourists to Tibet: Travel constraints, revisit intention and their negotiation. J. Hosp. Tour. Manag. 2021, 48, 128–137. [Google Scholar] [CrossRef]
  34. Mou, N.; Liu, Z.; Zheng, Y.; Makkonen, T.; Yang, T.; Zhang, L. Cycling in Tibet: An analysis of tourists’ spatiotemporal behavior and infrastructure. Tour. Manag. 2022, 88, 104418. [Google Scholar] [CrossRef]
  35. Zhang, S.; Zhong, L.; Ju, H.; Wang, Y. Land border tourism resources in China: Spatial patterns and tourism management. Sustainability 2019, 11, 236. [Google Scholar] [CrossRef] [Green Version]
  36. Wang, L.-E.; Zeng, Y.; Zhong, L. Impact of climate change on tourism on the Qinghai-Tibetan Plateau: Research based on a literature review. Sustainability 2017, 9, 1539. [Google Scholar] [CrossRef] [Green Version]
  37. Zhang, X.; Lu, L.; Zhang, H.; Xu, Y.; Li, D.; Zhang, X.; Yang, J. Evaluation of China’s Plateau Ecotourism Development Potential. Econ. Geogr. 2021, 41, 195–203. [Google Scholar]
  38. Xu, J.; Hu, L. Geospatial Semantics Analysis of the Qinghai–Tibetan Plateau Based on Microblog Short Texts. ISPRS Int. J. Geo-Inf. 2021, 10, 682. [Google Scholar] [CrossRef]
  39. Zipf, G.K. The P1 P2/D hypothesis: On the intercity movement of persons. Am. Sociol. Rev. 1946, 11, 677–686. [Google Scholar] [CrossRef]
  40. Taaffe, E.J. The urban hierarchy: An air passenger definition. Econ. Geogr. 1962, 38, 1–14. [Google Scholar] [CrossRef]
  41. Crampon, L.J. A New Technique to Analyze Tourist Markets. J. Mark. 1966, 30, 27–31. [Google Scholar] [CrossRef]
  42. Kortum, E.S. Technology, Geography, and Trade. Econometrica 2002, 70, 1741–1779. [Google Scholar]
  43. Kuik, O.; Branger, F.; Quirion, P. Competitive advantage in the renewable energy industry: Evidence from a gravity model. Renew. Energy 2019, 131, 472–481. [Google Scholar] [CrossRef]
  44. Lovrić, M.; Da Re, R.; Vidale, E.; Pettenella, D.; Mavsar, R. Social network analysis as a tool for the analysis of international trade of wood and non-wood forest products. For. Policy Econ. 2018, 86, 45–66. [Google Scholar] [CrossRef]
  45. Borgatti, S.P.; Everett, M.G.; Freeman, L.C. Ucinet for Windows: Software for Social Network Analysis; Analytic Technologies: Harvard, MA, USA, 2002; Volume 6. [Google Scholar]
  46. Bai, C.; Zhou, L.; Xia, M.; Feng, C. Analysis of the spatial association network structure of China’s transportation carbon emissions and its driving factors. J. Environ. Manag. 2020, 253, 109765. [Google Scholar] [CrossRef]
  47. Kim, A.C.H.; Newman, J.I.; Kwon, W. Developing community structure on the sidelines: A social network analysis of youth sport league parents. Soc. Sci. J. 2020, 57, 178–194. [Google Scholar] [CrossRef]
  48. Wang, F.; Gao, M.; Liu, J.; Fan, W. The spatial network structure of China’s regional carbon emissions and its network effect. Energies 2018, 11, 2706. [Google Scholar] [CrossRef] [Green Version]
  49. Song, J.; Feng, Q.; Wang, X.; Fu, H.; Jiang, W.; Chen, B. Spatial association and effect evaluation of CO2 emission in the Chengdu-Chongqing urban agglomeration: Quantitative evidence from social network analysis. Sustainability 2019, 11, 1. [Google Scholar] [CrossRef] [Green Version]
  50. Huang, M.; Wang, Z.; Chen, T. Analysis on the theory and practice of industrial symbiosis based on bibliometrics and social network analysis. J. Clean. Prod. 2019, 213, 956–967. [Google Scholar] [CrossRef]
  51. Lin, Z.; Zhang, Y.; Gong, Q.; Chen, Y.; Oksanen, A.; Ding, A.Y. Structural Hole Theory in Social Network Analysis: A Review. IEEE Trans. Comput. Soc. Syst. 2021, 1–16. [Google Scholar] [CrossRef]
  52. Lou, T.; Tang, J. Mining structural hole spanners through information diffusion in social networks. In Proceedings of the 22nd International Conference on World Wide Web, Rio de Janeiro, Brazil, 13–17 May 2013; pp. 825–836. [Google Scholar]
  53. Burt, R.S. The social capital of structural holes. New Econ. Sociol. Dev. Emerg. Field 2002, 148, 122. [Google Scholar]
  54. Borgatti, S.P.; Everett, M.G. Models of core/periphery structures. Soc. Netw. 2000, 21, 375–395. [Google Scholar] [CrossRef]
  55. Csermely, P.; London, A.; Wu, L.; Uzzi, B. Structure and dynamics of core/periphery networks. J. Complex Netw. 2013, 1, 93–123. [Google Scholar] [CrossRef] [Green Version]
  56. Yang, J.; Zhang, M.; Shen, K.N.; Ju, X.; Guo, X. Structural correlation between communities and core-periphery structures in social networks: Evidence from Twitter data. Expert Syst. Appl. 2018, 111, 91–99. [Google Scholar] [CrossRef]
  57. Krackhardt, D. Predicting with networks: Nonparametric multiple regression analysis of dyadic data. Soc. Netw. 1988, 10, 359–381. [Google Scholar] [CrossRef]
  58. Zhou, Z.; Huang, Y.; Hsu, M.K. Using data envelopment analysis to evaluate efficiency: An exploratory study of the Chinese hotel industry. J. Qual. Assur. Hosp. Tour. 2008, 9, 240–256. [Google Scholar] [CrossRef]
  59. Yu, H.; Li, Q.; Mei, L.; Liu, J. Research on the Spatial Structure and Spatial Development Patterns of Urban Tourism Economic Connections of Heilongjiang Province-Focus on the Perspective of Social Network. Sci. Geogr. Sin. 2015, 35, 1429–1436. [Google Scholar]
Figure 1. The 18 cities on the Tibetan Plateau (source: GS(2020)4630).
Land 11 00241 g001
Figure 2. Strength of the tourism economic connection.
Land 11 00241 g002
Figure 3. The trend of network density and association relations.
Land 11 00241 g003
Figure 4. Tourism economic network structure of the Tibetan Plateau.
Land 11 00241 g004
Figure 5. The spatial distribution of the degree, betweenness, and closeness.
Land 11 00241 g005
Figure 6. Core–periphery model.
Land 11 00241 g006
Table 1. The calculation formula of the characteristic index of the tourism economic network structure.
IndexFormulaExplanation of the Formula
Network density D = L N ( N 1 ) D is the network density; L is the actual number of connections; N is the number of points in the network structure; and N(N − 1) means the maximum possible number of connections.
Degree centrality C A D i = d N 1 C A D i is the degree centrality of node i, and d is the degree of point i.
Closeness centrality C A P i 1 = N 1 j = 1 n d i j C A P i 1 is the closeness centrality of node i, and dij is the shortcut distance between nodes i and j.
Betweenness centrality C A B i = 2 j n k n b j k ( i ) N 2 3 N + 2 , j k i   and   j < k C A B i   is   the   betweenness   centrality   of   node   i ,   and   b j k ( i ) represents the ability of city i to control the communication between nodes i and j.
Table 2. The strength of tourism economic connections between cities.
City 2015 2019
RankThe Strength of TourismProportion (%)RankThe Strength of TourismProportion (%)
Economic CooperationEconomic Cooperation
Xining17,692,832.9849.1566147,801,435.5948.7333
Haidong22,921,168.0318.6660217,603,128.4417.9463
Hainan31,954,045.3312.4862314,806,490.7315.0951
Huangnan41,236,013.397.898047,790,432.077.9423
Gannan5633,004.614.044963,276,612.563.3405
Haibei6551,469.823.523953,865,810.983.9412
Aba7346,424.192.21368502,737.370.5125
Haixi8137,987.400.88177927,525.560.9456
Ganzi948,124.400.307510430,646.220.4390
Lhasa1048,030.970.30699457,863.280.4668
Guoluo1133,364.710.213213110,796.270.1130
Linzhi1222,364.730.142911264,869.280.2700
Yushu1311,882.410.075912127,670.900.1302
Shannan145558.140.03551541,765.950.0426
Rikaze155164.450.03301469,331.310.0707
Changdu161649.060.0105166701.150.0068
Naqu17466.440.0030173322.190.0034
Ali1881.130.000518724.890.0007
Table 3. The structural hole indicators.
CityEffective SizeEfficiencyConstraintHierarchy
20152019201520192015201920152019
Lhasa8.6007.1180.5730.4190.2620.2250.1220.046
Linzhi1.3331.4440.2220.1600.5550.3940.0040.001
Changdu1.4001.8890.2800.2100.6380.3930.0080.005
Naqu1.0001.0000.3330.2000.9260.6480.0000.000
Rikaze1.8005.1430.3600.3670.6270.2670.0240.039
Ali0.0001.0000.3600.2500.0000.7660.0000.000
Shannan1.0001.2860.2500.1840.7660.4900.0000.002
Aba5.0004.8570.3850.3470.2880.2660.0460.030
Ganzi4.0004.8570.3330.3470.3070.2660.0310.030
Xining8.5007.1180.5310.4190.2430.2250.0900.046
Haidong6.3855.8750.4910.3670.2930.2360.0910.033
Haibei1.2862.4550.1840.2230.4900.3290.0020.008
Hainan1.8892.8330.2100.2360.3930.3040.0050.010
Huangnan1.5002.0000.1880.2000.4360.3580.0020.005
Guoluo1.2861.2860.1840.1840.4900.4900.0020.002
Haixi8.5007.1180.5310.4190.2430.2250.0900.046
Yushu1.3332.0000.2220.2000.5550.3580.0040.005
Gannan1.2861.4440.1840.1600.4900.3940.0020.001
Table 4. Network core–periphery density matrix.
Area20152019
CorePeripheryCorePeriphery
Core0.9640.6000.9560.700
Periphery0.6000.0220.7000.071
Table 5. QAP correlation analysis.
CoefficientSignificanceAverageStd. Dev.MinimumMaximumProp ≥ 0Prop ≤ 0
A-level attractions0.3640.013−0.0030.175−0.5210.5240.0130.987
Difference in elevation−0.0380.3780.0030.127−0.3690.3880.6220.378
Star-rated hotels0.5630.0000.0000.176−0.5770.5540.0001.000
Percentage of total tourism revenue in GDP−0.0910.317−0.0020.176−0.5430.5650.6830.317
Road density0.3460.0210.0010.176−0.5150.4850.0210.980
Geographical adjacency0.1030.120−0.0010.076−0.3090.2300.1200.945
Administrative connection−0.0300.4020.0030.090−0.3240.2940.7160.402
Table 6. QAP regression analysis.
IndependentUnstandardized CoefficientStandardized CoefficientSignificanceProportion as LargeProportion as Small
A-level attractions0.4330.1930.0330.0330.968
Star-rated hotels0.9230.4580.0010.0011.000
Road density0.2590.1110.1130.1130.887
Intercept0.0590.000
R20.438Adj R20.431observations306
Publisher’s Note: MDPI stays neutral with regard to jurisdictional claims in published maps and institutional affiliations.

