Abstract
Net-Zero Energy Districts (NZEDs) are city districts in which the annual amount of CO2 emissions released is balanced by emissions removed from the atmosphere. NZEDs constitute a major component in a new generation of “smart-green cities”, which deploy both smart city technologies and renewable energy technologies. NZEDs promote environmental sustainability, contribute to cleaner environments and reduce global warming and the threats from climate change. This paper describes a model to assess the feasibility of the transition of city districts to self-sufficient NZEDs, based on locally produced renewable energy suitable for cities. It also aims to identify threshold conditions that allow for a city district to become a self-sufficient NZED using smart city systems, renewable energy, and nature-based solutions. The significance of transition to self-sufficient NZEDs is extremely important as it considerably decentralises and multiplies the efforts for carbon-neutral cities. The methodology we follow combines the literature review, model design, model feed with data, and many simulations to assess the outcome of the model in various climate, social, technology, and district settings. In the conclusion, we assess whether the transition to NZEDs with solar panel energy locally produced is feasible, we identify thresholds in terms of climate, population density, and solar conversion efficiency, and assess the compatibility of NZEDs with compact city planning principles.
1. Introduction
Net-Zero Energy Districts (NZEDs) constitute a major component of a new generation of smart-green cities leading to carbon-neutral cities. They deploy smart city systems for energy optimisation, renewable energy (RE), and nature-based solutions, to zero carbon dioxide emissions. NZEDs are city districts where the annual amount of CO2 removed from the atmosphere is equal to that released.
Every city district or city ecosystem can evolve into an NZED. This paper describes a model to assess the feasibility of the transition of city districts into self-sufficient NZEDs, based on locally produced renewable energy suitable for cities. Such districts do not need renewable energy imports and produce energy via a distributed local system that works as a virtual energy plant. The model also identifies social, climate, and technological thresholds that allow for a city district to become self-sufficient NZEDs using smart city systems and covering all energy needs from locally produced renewable energy.
The significance of city districts transitioning to self-sufficient NZEDs is extremely important, as it considerably decentralises and reinforces the efforts for carbon-neutral cities. NZEDs reduce global warming, promote environmental sustainability, contribute to cleaner environments, and open a way out from the environmental threats of climate change and disasters associated with extreme heat, droughts, and floods.
1.1. Problem Definition
The NZED is an evolution of the eco-district concept and designates city districts designed according to principles of environmental sustainability but focusing on renewable energy and CO2 emissions [1]. The NZED is also an evolution of the “Net Zero Energy Building”, a building with optimised and reduced energy needs that can be balanced by energy generated from renewable sources. The definition provided by Cortese and Higgins [2] that “ZNE Districts are groups of buildings such as a city district, community or campus with a stated goal of ZNE” shows the interrelation between net zero energy buildings and districts. However, focusing on buildings does not allow for the consideration of all activities of a city district beyond buildings, such as mobility, industry, recreation, and public infrastructure. On the contrary, the NZED is based on a combination of renewable energy and smart systems in various infrastructures and activities of the city, such as smart street lighting, smart urban mobility, smart grid and smart metering, real-time waste monitoring and collection, enabling a complete transition to clean energy and zero CO2 [3].
The transition of city districts to NZEDs is a prospect for any city district or urban ecosystem: area-based ecosystems (housing districts, central business districts, port areas, technology or university campuses), vertical ecosystems based on economic activities (manufacturing, food production, education, health, hospitality), and network-based ecosystems (transport, energy, and other utilities).
Our ambition is to develop a model to assess the feasibility of transitioning to NZED by smart city systems for energy optimisation, locally produced renewable energy, and nature-based solutions. Though the model we propose focuses on the activities and land uses of housing districts and energy needs for residential activities and mobility, it can be further enriched to cover other energy needs and CO2 emissions of any city district.
Core components of the NZED model are (a) the “district”, a subsystem of the city with clear spatial boundaries and land uses, (b) the “energy usage and consumption”, depending on the activities of the district, the socio-economics of the district’s population, and climate conditions, (c) the “transition to NZED” with different types of measures and actions towards carbon neutrality, and (d) the balance of energy consumption and renewable energy production and the balance of CO2 released by activities in the district and CO2 removed by other elements of the district, leading to zero total emissions.
We want to identify thresholds, in terms of population density, spatial structure, energy usage, energy optimisation and renewable energy deployment, which allow for a housing district to become a self-sufficient NZED. We also examine the implications of the transition to NZED for the spatial organisation of housing districts and district planning models.
1.2. Research Hypotheses
The three hypotheses we propose concern the feasibility of NZEDs depending on locally produced renewable energy without energy import from external sources; the thresholds in terms of population, climate conditions, energy consumption, and technology that define the feasibility of an NZED; and the spatial form and structure of such self-sufficient NZEDs.
Hypothese (H1).
It is feasible to design an NZED relying on locally produced renewable energy.
There is evidence that renewable energy (geothermal, wind, solar, biomass, waste) can cover important parts of the energy needs of a city, and—if combined—the entire city’s demand for energy. For instance, the capacity at a citywide rollout of solar photovoltaic panels (PVs) can cover 62% of electricity demand in Oeiras, Portugal, and 60% of the demand in Cagliari, Italy [4,5]. Rooftop solar PVs currently available on the market can cover between 19.7% and 31.1% of the daily electricity demand in Mumbai, India [6]. An important part of the total solar irradiation can be captured by the vertical exterior envelope of buildings, estimated at 41% in Karlsruhe, Germany and 45% in Greater London with better urban and building design [7].
In wind RE, Vertical Axis Wind Turbines can supply up to 33% of electricity in residential buildings, excluding electric thermal heating, in major urban centres of New Zealand [8], and 40% in the city of San Cataldo, Sicily [9]. Geothermal energy is also a very effective resource for the heating of buildings. Usual geothermal energy is drawn from the relatively stable temperature in shallow ground. The potential of deep geothermal energy (>10 km below the surface) is higher and can provide as much as 10% of urban energy supply [10,11]. Biomass and the use of biofuel are not included for consideration in this paper, given the concerns about their impact on land use, competition with land suitable for food production, and related threats of deforestation [12].
According to a review study by Hoang and Nguyen, combinations of different renewable energy sources have the potential to meet an important part of the energy needs of a city. There is also a significant margin for improvement in the energy efficiency of renewable energy systems [13].
Based on this evidence, our first hypothesis is that a combination of three types of measures can lead to NZEDs: (a) smart city systems for energy saving and optimisation in housing, public lighting, and mobility, (b) locally produced RE mainly from photovoltaic panels, and (c) nature-based solutions for CO2 removal.
Hypothese (H2).
There are thresholds related to energy consumption and locally produced renewable energy that limit the feasibility of NZEDs.
H1 relies on a three-step verification process. The total energy consumption in the district is minimised by smart city energy systems, electric energy consumption after optimisation is covered by RE locally produced, and the CO2 from any fossil energy use is balanced by nature-based solutions.
H2 is a follow-up of H1 and identifies thresholds in the above processes, in terms of population density, energy consumption, climate conditions, and the spatial structure city districts, which limit the transition to NZEDs.
On the energy side, the size of the district, the population density, energy consumption per capita, and mobility patterns define the overall energy needs of the district. In a self-sufficient NZED, these needs should be covered by renewable energy locally produced. On the CO2 side, emissions from using fossil energy should be removed by CO2 absorption measures. The spatial structure, the building code, and the features of the district define the capacity both for local deployment of RE and nature-based solutions for CO2 removal from the atmosphere.
Since a NZED is documented by the balance between energy consumption and renewable energy production, and the balance between CO2 emissions and CO2 absorption, H2 wants to define the conditions and thresholds of these balances. Under certain thresholds of population density, per capita energy consumption, local RE deployment, and nature-based solutions, a housing district can evolve into an NZED. H2 also aims to identify interdependencies among the various components of the transition process such as energy saving, RE deployment, and CO2 capture capacity.
Hypothese (H3).
The compact city form is not compatible with self-sufficient NZEDs.
Concerns about the negative environmental impact of urban expansion and sprawl appeared in the early 1970s [14]. However, in the 1990s, the principles of “Smart Urban Growth”, “Compact City”, “New Urbanism”, “Transit-Oriented-Development” and “LEED for Neighbourhood Development” converged into a coherent model for the sustainable design of city districts. Under these planning principles, city districts should protect open areas, natural resources, and agricultural land; promote compact growth with a focus on mixing uses and facilitating public transport and pedestrian traffic; a large variety of homes both in terms of typology and affordability; and re-design city infrastructures to reduce energy and water use. Core components of this planning model are a compact city design with relatively high population density, smart location close to existing city boundaries, redevelopment of brownfield areas, and a total rejection of urban sprawl [15,16].
H3 questions the validity of the compact city form for net-zero energy districts. Three conditions of an NZED are potentially in conflict with the compact city form. First, the higher population density of a compact city district increases the total energy consumption in the district. Second, the compact district form limits the space available for the deployment of renewable energy, solar panels, or geothermal systems. Third, traditional compact city districts have less open and green space, offering fewer opportunities for nature-based solutions to compensate for CO2 emissions.
H3 seeks to assess whether NZEDs relying on locally produced RE are feasible under the usual density of compact city districts and whether city planning for net-zero should reconsider the critique of urban sprawl and low-density urban development.
1.3. Theoretical Framework
The theoretical framework to assess Hypotheses H1, H2 and H3 is based on previous work on the making and operation of NZEDs. Carlisle et al. [17] outline key milestones towards an NZED. The energy load and CO2 production are gradually reduced and tend to zero in successive rounds through energy efficiency and renewable energy deployment. In a typical community—a city district is also a community—energy usage in industry, mobility and buildings is minimised by energy efficiency measures, and then renewable energy comes to cover the needs of industry, transportation, and buildings. As they state “When the community has implemented all energy efficiency and conservation opportunities and quantified these energy savings, the community can claim it fully met the achievement of a net zero community for milestone one. In this way, over time the community can show progress and claim success as it moves toward the aspiration of net zero” [17], p. 12.
We follow this generic model for developing the transition to NZEDs. At successive stages, we optimise the energy load from residential, mobility, and public space activities with smart systems for energy efficiency, and then local production of renewable energy suitable to housing districts comes to cover the optimised energy needs. In the end, nature-based solutions come to offset any remaining CO2.
All measures for energy optimisation and RE are distributed. They are based on many small-size installations and energy prosumers in the district. The build-up of the system requires a series of technologies, skills, and forms of engagement. In combination, they offer an alternative model of energy production, which is distributed, collective, and collaborative. Human skills, organisational capacities, and technologies used form a complex system of collaboration and empowerment.
Thus, the transition to NZEDs relies on the combination and integration of all available capabilities, resources, and behaviours in a city district. Capabilities to be found in technologies and systems, such as smart energy systems and renewable energy production; capabilities to be found in community practices, rules, and institutions, such as energy sharing rules, green building code, and city planning regulations; and human behaviour in favour of a prosumer culture, saving energy, and adopting environmentally friendly technologies.
We have called this integration connected intelligence. “Connected intelligence is the intelligence of a community of actants, people, organisations, machines and software, integrated through information flows, information transformations, linkages between physical and digital elements, between humans and machines” [18], p. 29. Connected intelligence appears in collaborative spaces and environments where human capabilities, collective thinking, and machine capabilities are combined to address challenges. It is the wider type of intelligence produced by the integration of human, collective, and machine intelligence. City ecosystems and smart ecosystems, which comprise groups of interacting organisations and their interdependent activities are places where this type of intelligence emerges [19].
Table 1 shows different manifestations of human, collective and machine intelligence that are integrated into connected intelligence. Included are generic behaviours and behaviours specific to the transition of city districts to NZEDs.

Table 1.
Connected intelligence as an integration of three types of intelligence.
1.4. Methodology and Data
The methodology we follow combines the literature review, model design, model feed with data, and a large number of simulations to assess the outcome of the model in various climate, social, and district settings, and understand the process towards net-zero. This methodology is reflected in the structure of the paper.
We start with a literature review on the typology and processes in NZEDs. There is a wide literature in the field, and we focus on publications with an operational perspective that allow for setting the transition model to NZEDs.
Using this literature, we define the building blocks and variables of a model for transition to NZEDs, the social and physical characteristics of the district, the energy consumption and CO2 emissions, the measures for transition to NZED, including nature-based solutions to offset carbon, and finally the balance of energy and CO2 emissions.
The next stage is working with indicators and statistics that provide data for assessing the transition of the district to carbon neutrality under various conditions of geography and climate, per capita energy consumption, and spatial organisation of the district. Then, follows the stage of simulations. We define the baseline scenario and feed the model with performance data relevant to transition measures. We run the model under different conditions to understand the processes towards zeroing CO2 emissions.
The final stage is the assessment of hypotheses considering the model outcomes. We assess whether the transition of self-sufficient NZEDs with solar panel energy locally produced is feasible, the transition thresholds in terms of climate, population density, and solar conversion efficiency, and finally the compatibility of NZEDs with compact city planning principles.
2. Net-Zero Energy Districts: Literature Highlights for NZED Model Design
2.1. The Origin of the Concept
The origin of the Net-Zero Energy District concept can be found in the literature on “Net-Zero Energy Buildings”. These are energy neutral buildings and deliver to the energy grid as much energy they draw back [20]; or buildings that produce at their location as much energy as they use around the year [21]. Other similar terms for the same concept are “Nearly Zero Energy Buildings”, “Zero Emission Buildings”, “Net Zero Source Energy Buildings”, “Net Zero Site Energy Buildings”, “Nearly Net Energy Buildings”, and “Autonomous Zero Energy Buildings” [22]. The discussion about Net Zero Energy Buildings goes back to 1976 in the study of Esbensen and Korsgaard [23] on solar heating for an experimental residential building named “Zero Energy House”. In the early 2000s, the concept gained more attention in research and policymaking due to concerns about fossil fuels energy consumption and CO2 emissions in the building sector [24]. Moving from the level of building to city district or community, the concept changes substantially as the district is more complex than the building and consumes energy not only for residential and office activities but also public spaces, mobility, and a large array of city infrastructures [17].
The smart city paradigm added another dimension to the NZED concept related to smart systems and digital platforms that contribute to energy optimisation and enable the creation of energy communities exchanging and sharing energy over smart grids and platforms [12]. Thus, in the framework of NZEDs, smart city systems converge with renewable energy systems for the pursuit of objectives for decarbonisation [25], nearly or net-zero energy [26], carbon neutrality [27], and full energy from renewable sources [28].
Measures for “nature-based solutions” are also added in the portfolio towards NZED transition, considering that full zero emissions are not feasible and nature-based solutions are needed to balance any remaining residue of CO2 released in the atmosphere.
2.2. Types of Net-Zero Energy Districts
Other city districts work in a similar or quasi-similar way to NZEDs towards carbon neutrality, such as “Zero Energy Districts”, “Positive Energy Districts”, “Net Zero Energy Communities”, and “Clean Energy Communities”.
Zero Energy Districts focus on new construction and have similar objectives to NZEDs. The Better Buildings Initiative of the U.S. Department of Energy considers that they offer an important pathway toward optimising energy efficiency in new constructions. The NREL guide for energy master planning defines such districts as High-Performance Districts. “An HPD is a multibuilding project in which the buildings as well as the district as a whole integrate and optimize, on a life cycle basis, all major high-performance attributes, including energy conservation, environment, safety, security, durability, accessibility, cost–benefit, productivity, sustainability, functionality, and operational considerations” [29], p. 15.
Positive Energy Districts (PEDs) focus on energy import-export between city districts. The Joint Programming Initiative (JPI) Urban Europe, an international network of research councils throughout Europe on vitality, liveability, and accessibility of European cities, defines PEDs as follows: “A Positive Energy District is seen as an urban neighbourhood with annual net-zero energy import and net-zero CO2 emissions working towards a surplus production of renewable energy, integrated into an urban and regional energy system”. Additionally, PEDs “are energy-efficient and energy-flexible urban areas or groups of connected buildings which produce net zero greenhouse gas emissions and actively manage an annual local or regional surplus production of renewable energy. They require integration of different systems and infrastructures and interaction between buildings, the users and the regional energy, mobility and ICT systems, while securing the energy supply and a good life for all in line with social, economic and environmental sustainability” [30].
Net Zero Energy Communities focus on community building and user engagement. Such communities can be formed in areas larger than city districts or located in rural areas. Net zero energy communities reduce energy needs through efficiency measures enabling the balance of energy for vehicles, thermal, and electrical energy in the community to be met by renewable energy. In energy communities, the engagement of citizens and users in energy production and energy projects is the driving force to environmental sustainability. These communities are formed by a prosumer culture in the energy sector. They are particularly important in renewable energy produced by distributed systems, in which many RE producers cooperate to provide full energy production, distribution, consumption, and selling of excess energy capacity. Analysing the challenges and risks of energy communities, Abada et al. [31] use a cooperative game theory framework. They argue that despite the value created, there is no guarantee that the community will be viable, and some participants may find it profitable to exit the community and create another one of their own. De Vries et al. [32] point out the social and technological innovations that are at the heart of civic energy communities and the need to combine off-the-shelf technologies with novel technical and non-technical ideas and business models for effective energy community building.
Clean Energy Communities (CECs) is a concept proposed by Gui and MacGill as “social and organizational structures formed to achieve specific goals of its members primarily in the cleaner energy production, consumption, supply, and distribution, although this may also extend to water, waste, transportation, and other local resources” [33], p. 95. A CEC can comprise a small number of households in a city district or thousands of households and businesses, distributed over a wide geographic region [34]. The authors categorise the different CECs into five types according to collaboration and motivation: (1) community-scale energy projects, (2) virtual power plants, (3) peer-to-peer trading, (4) community microgrids, and (5) integrated community energy systems. They also define three distinct types of CECs, centralised, distributed, and decentralised. A centralised CEC has a high level of cohesion and can be easily integrated into the existing large-scale electricity infrastructure under the existing institution and regime. A distributed CEC comprises several nodes/members in geographical proximity, but most members are not directly connected with each other. Members make individual investments based on their preference and their financial situation in the context of a virtual community. A decentralised CEC is “a community of households, businesses or a municipality that generates and consumes energy locally for self-sufficiency that may or may not connect to the main grid” [33], p. 102.
All the above types of districts and communities have objectives and work towards carbon neutrality. NZEDs differ in the way carbon neutrality is calculated on an annual basis, taking into consideration the yearly variability of energy consumption, renewable energy production, and CO2 emissions. Moreover, understanding that full zero carbon emissions are not feasible, NZEDs include nature-based solutions to compensate for any remaining CO2 emissions.
2.3. NZED Processes towards Carbon Neutrality
The operation of an NZED relies on various measures and solutions for energy optimisation, renewable energy production, and carbon removal.
Emissions inventories: The goal of reducing greenhouse gas emissions depends on the ability to monitor, record, and analyse urban emissions. Cities need an emission inventory that measures air pollutants released from various fixed and mobile sources, such as transport, electricity generation, manufacturing, and residential fuel for heating and cooking. An emission inventory can help a city district identify emission sources and develop mitigation strategies. The recording of emissions is effective when it follows established standards. Data repositories, use of indicators, dashboards, and software for analytics and visualisation can help cities to create inventories of emissions and record their geographical dispersion.
Renewable energy community building is a fundamental process towards carbon neutrality. Caramizaru and Uihlein [35] in a JRC report analyse 24 schemes that take place in different types of energy communities. These communities combine energy transition to renewable energy and social innovation in decentralised systems. Their activities include energy generation, supply, energy efficiency, distribution, electro-mobility, consumption and sharing, storage, and financial services. Renewable energy cooperatives (Ecopower in Belgium, Enercoop in France, Som Energia in Spain, EWS Schonau in Germany) is a very usual type of energy community in Europe with more than 3500 cooperatives operating in North-Western Europe alone. Other types of communities include eco-villages, small-scale heating organisations, and energy communities in mobility and car-sharing. These communities work under different legal forms, such as cooperatives, limited partnerships, trusts and foundations, housing associations, non-profit organisations, public-private partnerships, and public utility companies. The most common driver for creating energy communities is the prosumer culture and motivation to invest in renewable energy and energy efficiency. The protection of the environment and sustainability prevail in housing communities and bio-villages. In the cases analysed in the JRC report, solar panel is the most common technology for renewable energy production (38%), followed by wind (19%), biomass (17%) and biogas (15%). Important too is the connectivity to the public energy grids and the payments tariffs. In cases with a public grid (on-grid), no network charges are applied for the energy that is generated and consumed within the property behind the access point. Communities without a public grid (off-grid) are disconnected from the public grid and manage their energy supply at their own responsibility in terms of security and quality. In virtual electricity sharing, customers rely on the public grid and the payment of network charges and tariffs follow the general principles [36].
Energy optimisation in the NZED can be achieved at the building level through building improvement technologies, such as refurbishment, thermal insulation, use of electrical appliances instead of gas and oil for heating and cooking, passive building design for better solar orientation and natural heating and cooling. At the district level, optimisation with smart systems, IoT and sensors, digital platforms, and applications that enable energy coordination between producers and users, energy forecasting, and energy-saving behaviour are most important.
Smart grids and smart meters enable user-producer coordination. The smart grid is an integrated electricity network that connects locally the key players in the generation, distribution, and consumption of energy for creating more efficient and sustainable electricity networks. A smart grid serves three key roles: (a) it modernises the power system through automation, remote monitoring and control, (b) it provides access to information and educates users on energy consumption, (c) it enables an integrated approach in incorporating and exploiting distributed renewable energy sources [12]. Combining smart meters, wireless technology, sensors and platforms, consumers become aware of energy usage patterns and adopt energy-saving behaviours. In parallel, utility companies can monitor energy usage, predict consumption, and adapt their production volume to real demand and consumption. Artificial Neural Networks in combination with statistical analysis can be used to create Decision Support Systems that predict energy consumption [37]. Additionally, utility companies can integrate distributed generation and renewable energy into their overall system of energy supply.
Smart home systems for energy saving either introduce automation for energy saving or increase user awareness for better energy-saving behaviour. They can be applied in-house with smart displays that inform about energy consumption in various rooms, and with devices and remote control of home appliances and equipment. Equally well, smart systems can be applied to public urban spaces, public buildings, and streetlights, to monitor consumption and adapt lighting to the usage of the space. Public infrastructures such as smart street lighting systems can prompt energy-saving resulting in lower utilisation and power demand. There are many solutions for such systems from high to low levels of sophistication, from simple sensor-based solutions to complex, that combine artificial neural networks and fuzzy logic controllers [38].
Nature-based solutions can be used to capture and remove CO2 emissions from the atmosphere. These are city planning projects that transform land uses, green areas, infrastructure, materials, and the design of city districts. The protection and restoration of natural ecosystems and habitats, the increase in biodiversity and forestation are also encouraged. Urban tree planting and the creation of parks are among the best examples of nature-based solutions to absorb CO2. Nature-based solutions also include green roofs, rain gardens, and constructed wetlands that minimise damage from runoff by absorbing stormwater. The reduction of heat islands by utilising materials that reflect solar radiation can also minimise the external temperature of a city district and reduce the energy needed for cooling.
3. A Model for Transitioning to NZED
The use of models to assess energy efficiency, CO2 emissions, and decarbonisation solutions and policies are mainstream in energy systems and smart energy systems as well. Hoang and Nguyen [13] conducted a literature review of models used in smart energy systems including, among others, distributed systems and how energy producers integrate many smaller distributed generation sources, power systems, smart grids, local microgrids, renewable energy systems, and the carbon footprint of various activities. The review includes urban planning models for decision-making and mitigation strategies for climate change threats. It also covers energy software models, such as EnergyPLAN, HOMER, Energy Hub, and TRNSYS that have been used in optimisation. The authors point out that actions taken by operators of buildings might not yield the most optimal result as the interactions among buildings and their environment are not included in the model. A system model should be developed to consider all energy cycles that span across the city and deliver holistic and all-inclusive urban energy optimisation.
Foley et al. [39] have shown that stochastic programming is the preferred method of choice in most power system modelling. It is based on minimising an objective function under several constraints. A two-stage process is most common in stochastic programming. The basic idea of two-stage stochastic programming is that decisions should be based on data available at the time the decisions are made and should not depend on future observations.
De Santoli et al. [40] developed a model to assess the renewable energy potential and the optimal location and type of renewables given geographical and environmental constraints. It documents that optimisation at the level of independent buildings is not enough on its own to improve the potential of a city or city district. Recent explorations make use of other techniques such as artificial intelligence, genetic algorithms, and game theory.
3.1. Model Building Blocks
Taking stock of previous modelling and solutions towards carbon neutrality, the NZED model we propose is based on scenario building and decarbonisation measures. Once the model documents that a scenario of NZED is feasible for a city district, then optimisation can be further applied for a better configuration of the measures proposed. Additionally, once an NZED is proven feasible, a financial plan should be elaborated to streamline private and public investments and assess the depreciation period and the economic benefits from a prosumer energy perspective.
The model we propose is composed of four building blocks (A, B, C, D) which are depicted in Figure 1. Block A describes the district, Block B calculates the energy consumption and CO2 emissions, Block C includes the transition measures to NZED and Block D calculates the energy balance and the CO2 balance that document the transition to NZED.
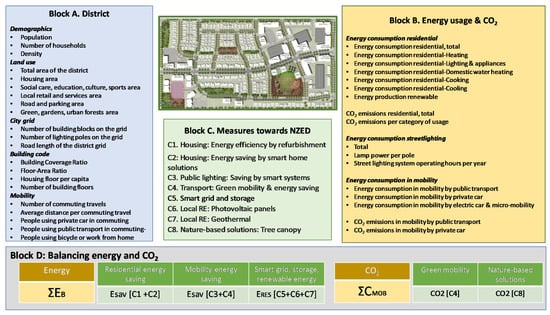
Figure 1.
Building blocks of the NZED model.
In the first version, the model is applied to a housing district with residential energy consumption, public street lighting, and mobility-related energy and CO2. To document the transition to self-sufficient NZED, both the import of renewable energy and CO2 emissions should be zero. In more complex configurations of the model, other activities and land uses can be added, such as commercial, professional, and industrial land uses, and the corresponding energy consumption and CO2 emissions.
3.2. Block A: District
Block A of the transition-to-NZED model describes the spatial characteristics of a typical residential city district in terms of population, density, land use, buildings, open space, transportation, planning regulation and building code. Energy consumption and CO2 emissions depend on these features and are calculated in Block B of the model. The spatial characteristics of the district also define restrictions upon Block C and the measures for transition to NZED.
Key variables and metrics in Block A are listed in Table 2. From a very large number of variables relevant for a housing district, we have selected a small set that allows energy needs to be defined and the capacity for renewable energy deployment to be identified. It is usual for a residential district to include five major categories of land use: (1) housing, (2) social care, education, culture, sports, (3) local retail and services, (4) road and open parking, and (5) green areas, parks and plazas. The values of these variables are exclusive for each district. Even within the same city, values change considerably from one district to another. All listed variables refer to realised space and may differ from planning regulation values.
Table 2.
Key variables and metrics of housing district spatial features.
3.3. Block B: Energy Usage and CO2
Block B of the model describes the energy consumption and corresponding CO2 emissions that derive from the population and spatial features of the district, climate conditions, socioeconomics, and per capita energy consumption. Three types of energy usage are included that are common in residential areas, related to housing, mobility, and public street lighting. Key variables and metrics of Block B are listed in Table 3.
Table 3.
Key variables and metrics energy usage and CO2 in residential districts.
Residential energy consumption depends on the country, GDP per capita, geographic location and climate, and the mix of energy sources. In the EU (2019), households, or the residential sector, represented 26.3% of the final energy consumption. The breakdown of residential energy in the EU is presented in Table 4.
Table 4.
Distribution of energy consumption in EU households.
In EU countries, the total energy consumption per capita varies very much (2020 data in kWh): Netherlands (57,047), Finland (55,118), Germany (43,703), France (41,281), and Greece (30,384); also per capita electricity consumption varies considerably, in Finland (12,175), France (8097), Netherlands (7264) Germany (6771), and Greece (4637). CO2 emissions in countries with similar per capita energy consumption but very different energy mix also vary, such as Germany (9.44 tons CO2 per person) with 5% of energy production from nuclear and 17.5% from coal, and France (5.13 CO2 tons per person) with 36.7% energy from nuclear and 2.7% from coal (Country profiles, Our World in Data). However, these differences in the energy supply mix and emissions do not affect our model which relies on locally produced renewable energy.
Energy consumption on street lighting depends on the geographical location of the district and the total operating hours during the year. We assume that the system operates throughout the night. Calculators of day and night duration, such as Solartopo.com (accessed 13 December 2021), provide information about the length of days each month of the year and allow the yearly operating hours of a street lighting system to be estimated.
Energy consumption in mobility depends on the transport means used (public transport, private cars, green mobility, micro-mobility) the number of journeys per capita during the year, and the average travel distance in daily commuting. These variables change from one city to another, following the infrastructure available, the spatial distribution of housing and work, as well as the local culture for mobility. Estimating the feasibility of transition to NZED we use national statistics for travel data [42,43]. We also compare commuting data in the EU with statistics from the US that have a very high rate of travel by private car, which is the most energy-consuming and high CO2 emission behaviour. The data used for calculating mobility energy consumption, initially and in the NZED state, are given in Table 5. To calculate CO2 emissions, we used the Greenhouse Calculator of the US Environmental Protection Agency.
Table 5.
Means of transportation to work.
3.4. Block C: Transition Measures to NZED
This Block comprises measures for decarbonisation that can be applied in a housing district. It includes 8 types of measures based on smart city technologies, building refurbishment, local renewable energy, and nature-based solutions. These are applied in various spatial entities and activities of a district, housing areas, mobility means, street network, public space open and green spaces. These are the following:
- C1.
- Housing: Energy saving by building refurbishment
- C2.
- Housing: Energy saving by smart city solutions
- C3.
- Public lighting: Energy saving by smart city lighting
- C4.
- Transport: Green mobility and energy saving
- C5.
- Smart grid and storage
- C6.
- Local RE: Photovoltaic panels
- C7.
- Local RE: Heat pumps and geothermal heat pumps
- C8.
- Nature-based solutions: Tree canopy and CO2 offset
The combined effect of the above measures and technologies should offset all CO2 emissions produced by using fossil energy, as described in Block B of the model, leading the city district into a net-zero state. All measures of block C (C1–C8) have an impact on the variables in Block B, either related to energy usage or CO2 emissions.
A very important metric in Block C is the coefficient (z) that measures the percentage of the population or households that adopt an NZED transition measure. The coefficient (z) applies to measures C1–C7 and its value is between 0 and 1. Per analogy, the percentage of the population that remains in the old behaviour is (1 − z). A value of (z) equal to zero means that no behaviour change has occurred, while a value of (z) equal to 1 is obtained when a measure becomes mandatory after being imposed by legislation.
- C1. Housing: energy saving by building refurbishment
Building refurbishment (improving buildings by re-equipping) or retrofitting (adding elements that the building did not have when first constructed) is about upgrading the energy system and performance of existing buildings. Building energy efficiency is the starting step towards an NZED. It ensures that buildings maximise energy efficiency, which in turn reduces the renewable energy generation to achieve an NZED.
Building energy retrofitting includes objectives of energy optimisation, lower environmental impact, and better living conditions in the building. Performance metrics may include energy reduction, Indoor Environmental Quality, CO2 emissions, and financial such as energy bills and investment returns [44]. Both refurbishment and retrofitting are implemented by improving or replacing lighting fixtures, ventilation systems, replacing single-glazed windows with double glazing, windows and doors, adding insulation on roof and external walls, especially for buildings that face direct sunshine which heat up quickly and need more energy to keep cool.
According to the EU news and information service Science for Environmental Policy (https://rb.gy/reecha) (accessed 13 December 2021), data from nine countries shows that building refurbishments and energy efficiency measures in existing housing districts could save 10% of energy for heating by 2020 and 20% by 2030. However, the country and local differences are high and depend on the quality of housing and climate.
A survey by Tuominen et al. [45] shows high differences between countries and types of buildings in potential energy saving under the Energy Performance of Buildings Directive (EPBD) (Table 6). The authors underline that their calculations “ rely heavily on average values for a large amount of buildings that are, in reality, very different. Some of the uncertainty is offset by the law of large numbers, i.e., even if some buildings are more difficult to renovate than average, others are easier, and in such a large sample both amounts are probably of more or less similar magnitude. Nevertheless, the results should be regarded as indicative estimates of a potential development, rather than exact forecasts” [45], p. 50. The average reduction of heat energy is between 47.51% and 49.65% in houses and 45.38% in apartments. We should note that this high energy saving reflects the implementation of all EPBD measures, not building refurbishment only, according to targets of every country under the umbrella of the EU Directive on the energy performance of buildings.
Table 6.
Expected saving potential under the EPBD for existing dwellings.
Given this evidence, we estimate that potential improvements in energy performance by refurbishment is in the field of energy for heating. How much energy building refurbishment can actually save depends on local climate conditions and the quality of the building stock that define an energy reduction coefficient (x). For a coefficient x = 20%, which is the value proposed by the EU Science for Environmental Policy for 2030, the saving of energy will be equal to:
Energy heating saving = Energy reduction coefficient (x) × Energy consumption residential-Total (kWh) × Energy consumption residential-Heating (%)
EH-S = 0.20 × ERT × EH
- C2. Housing: energy saving by smart city solutions
In smart cities, residential projects for energy saving have used smart meters and readable displays that allow users to become aware of energy consumption per electric appliance. A series of experiments and pilots in Amsterdam Smart City for assessing the contribution of smart city solutions to energy saving has led to rather mediocre results.
In the Geuzenveld neighbourhood, 500 homes have been provided with smart meters and displays that show energy consumption, while energy savings practices were discussed at citizen meetings and brainstorming sessions. Still, the energy savings per household were only 3.9%. In the West Orange project, 400 households have been provided with smart meters and displays that make it possible to see the energy consumption per appliance, and a personal energy-saving plan was set for every household. Energy savings per household were still only 7.8%. The ITO Tower, a pilot for testing energy savings in a large multi-tenant office building using smart building technology, smart plugs, and data analytics, saw a higher energy consumption fall of 18% [46]. We should note that these data do not make it clear whether they refer to total energy or to energy consumption for lighting and appliances in the household. The overall ambition in Smart Amsterdam was to achieve energy savings at the level of 14%.
Simulations with an experimental smart home prototype that uses a microcontroller and various sensors for temperature and infrared for movement detection, as well as actuators to control the lights and air conditioning by Panna et al. [47] show a much higher level of energy saving at the level of 20–30% depending on the number of persons per room.
Given this data, a conservative estimation is that smart home solutions can provide a 10% saving in residential energy consumption for lighting and appliances.
Energy lighting and appliances saving = Energy reduction coefficient (x) × Energy consumption residential total (kWh) × Energy consumption residential-Lighting and appliances (%)
ELA-S = 0.10 × ERT × ELA
- C3. Public lighting: energy saving by smart city lighting
A city street lighting system consists of lighting poles, each consisting of a lamppost, a streetlamp, and other equipment depending on the type of lamps (e.g., ballasts when fluorescent lamps are used). Street lighting accounts for an important part of energy consumption, which is estimated between 15–40% of the energy spent in cities [48,49]. Smart city systems can considerably contribute to reduced energy consumption for street lighting and to net-zero objectives, especially when fossil energy is used to produce electricity.
At the level of a city district, the yearly energy consumption of a street lighting system depends on the number of poles in the district, the lamps wattage, and the system operating hours per year. The number of poles can be computed by the road length in the district. Calculations by Subramani et al. [48] for a streetlight system with a spacing of 50 m and width 7 m, equipped with 250-watt lamps on each pole, shows illumination of 8.20 lumen per square meter, which exceeds the required illumination standard of 6.46 lumen. Thus 200–250 Watt lamps are adequate for streetlighting.
Optimising ordinary streetlighting with smart city solutions includes (a) replacing lamps with LED lights that have lower energy consumption, (b) installing sensors for motion detection, and (c) brightness adaptation for lights to switch on when pedestrians are near, or vehicles pass and switch off in the absence of movement. Thus, a lamppost works in four stages: off, low, medium, and high. Replacement of bulbs can be carried out with Light Emitting Diodes (LED) or Compact Fluorescent Lamps (CFL) which use 75% less energy than ordinary bulbs.
Using smart city lighting, it is estimated that the energy savings that can be made are around 50%. Following Subramani et al. [48], p. 020082 “Replacing the existing lamps with LEDs, the required power is 5.33 kW so there is an energy saving of 12.61 kW for installed capacity and 5.43 kW for actual working in terms of kWh per year, the saving for installed capacity is 55,232 kWh and for actual working is 33,139 so the savings percentage is 57.7%”.
Escolar et al. [50] conducted simulations in the city of Leganés, 11 km southwest of the centre of Madrid, a city equipped with 50,000 lampposts that “during winter nights turned on in state LOW at 6:00 p.m. and progressively increase the intensity to reach the HIGH state at 7:00 p.m. They remain in this state until 5:00 a.m., when they progressively decrease their intensity to reach the state OFF at 7:00 a.m. The energy savings reach 55% relative to the nonadaptive application”.
Nefedov et al. [51], p. 1718 estimated that “LED technology enables intelligent street lighting that is based on sensing individual vehicles and dimming streetlights accordingly. The potential energy savings are considerable, exceeding 50% on roads with low traffic.”
Given this evidence, it is reasonable to accept that a traditional street lighting system can be upgraded to improve efficiency and reduce energy consumption by 50%, using LED and sensors so the light system glows and adapts upon detecting pedestrian or vehicle movement.
Energy saving by smart city lighting = Energy reduction coefficient (x) × Number of lighting poles on the grid × Street light lamp wattage × Hours operation/year (kWh)
ESL-S = 0.50 × PL × LW × Hy
- C4. Transport: Green mobility, energy, and CO2 emissions
In mobility, energy consumption and CO2 emissions come from daily travel for work, shopping, recreation, and other activities. With the functional urbanism of 20th century cities, daily commuting is the rule for most of the population and substantial CO2 emissions are generated by daily travels. Urban sprawl and the integration of small settlements into metropolitan areas has increased commuting average travel distance and emissions.
New city planning concepts such as the 15-min city [52,53] can reduce daily commuting but will not make it disappear. In cities, many activities and land uses are unique (e.g., university campuses, museums, hospitals, polluting industrial estates, luxury commerce) and cannot be replicated in every cell of a 15-min city. Moreover, it is not feasible for every citizen to find a job close to their place of residence. On the other hand, work from home certainly opens a window of opportunity for such spatial concepts and telework will definitely contribute to lower commuting.
In daily commuting all available means are used: public transport, private cars, and green mobility (bicycles, electric scooters, electric vehicles). The distribution of transport modes is specific to each city, depending on culture, topography, transport means and infrastructure. In the transition to NZED, the objective for mobility is conversion to green mobility powered by renewable energy. In calculating the changes that can be introduced by green mobility measures, we use the following principles.
- All energy and CO2 emissions for mobility are counted in the residential district of travel origin. As the commuting distance increases, energy consumption and emissions are released to neighbouring city districts. This calculation is the worst-case scenario for the district of travel origin but is neutral at the entire city level, as total emissions are aggregated from one district to another.
- Within the next few years, public transport will progressively adopt electromobility, and all energy consumption (EMPT) will be covered by electricity. If only renewable energy is used, CO2 emissions (CMPT) will go down to zero.
- Green mobility is on the rise and will continue to increase. The share of the population (z) that will adopt green mobility is specific to each city and should be introduced in the respective scenario.
- However, a part of the population will continue to use conventional fossil fuel cars that release CO2. These emissions should be absorbed by nature-based solutions.
Thus, in the transition to NZED, we first estimate the energy needed for all kinds of electromobility, public transport, private cars, micro-mobility, which should be covered by renewable energy. The average energy consumption for electric vehicles is estimated at 0.2 kWh, 0.1 kWh/km for public transport, and 0.05 kWh/km for micro-mobility (Table 5). The total electric energy depends on the distribution of commuting between public transport, electric vehicles, and e-micro mobility. Then, we compute CO2 emissions from the use of fossil fuels cars, which depends on the yearly mileage, fuel consumption, and CO2 emissions per unit of fuel. The amount of CO2 released is estimated at 0.19 kg/km.
Energy for electric mobility = [Population × % workers × ev transport mode] × [average travel distance × number of travels per year] × energy consumption/km
EEV = P × AP × z (ev) × Dtpc × Tpc × 0.2 (0.05) kWh/km (kWh)
CO2 emissions for mobility by private car = [Population × % workers × conventional car transport mode] × [average travel distance × number of travels per year] × CO2/km
CMPC = P × AP × z (cc) × Dtpc × Tpc × 0.19 kg/km (kg)
- C5. Smart grid and energy storage
The smart grid is the backbone of the Net Zero Energy District. According to the U.S. Department of Energy, “these systems are made possible by two-way communication technology and computer processing that has been used for decades in other industries. They are beginning to be used on electricity networks, from the power plants and wind farms all the way to the consumers of electricity in homes and businesses” [54]. Smart grids support many functions in the local energy system, such as integration of distributed energy resources located on buildings and other RE installations in the district, energy storage to secure uninterrupted supply of energy to users, and real-time monitoring of energy flows, enabling optimisation and service provision to producers and consumers.
Optimisation of energy supply and demand is important to avoid additional investments to cover peak loads in energy consumption. The smart grid of a city district can monitor and coordinate energy generation and consumption and reduce peak power demand. For instance, the so-called Virtual Power Plant (VPP) can compensate the volatility of renewable energy production through sharing among members of an energy community and energy storage in electric vehicles [55].
Equally important is energy storage. In the context of smart cities, it can be conducted at different levels of the energy system: (a) at the energy generation level to balance and reserve power, (b) at the smart grid level to support capacity and investment deferral, (c) at the customer level to address peak load [56]. Many engineering solutions and technologies can be used in RE storage such as compressed air, battery, pumped hydro storage plants, super capacitors, and flywheels. If RE is not supported by sufficient storage, it will not be effective. Balancing the volatility of RE generation to local consumption is the main task of smart grids and can be carried out by the grid storing quantities of energy. Energy storage levels at the smart grid level in Japan and Germany are 15% and 10%, respectively, and much lower in the US, at 2% only [57].
Regarding the transition measures to NZED, the smart grid is a condition for the integration of the measures proposed (C1–C8), balancing RE supply and demand. The added value is estimated in the next two measures (C6 and C7) for local renewable energy.
- C6. Local RE: Photovoltaic panels
In the model we propose, distributed photovoltaic panels are selected as the sole source of locally produced renewable energy. In non-self-sufficient NZEDs, additional renewable energy can be imported from external sources such as large-scale hydro, wind parks, and tidal installations. PV panels can be installed on all available buildings, private yards, and public spaces. They should be combined with storage for energy use when the sun sets, or with electric vehicles to store energy for mobility. An energy community will be needed to manage the distribution of energy among the households, as well as the management of the smart grid, the digital platform for energy transactions and analytics, and the storage of energy at district level.
A key metric in the local production of renewable energy is the annual energy output per PV panel square meter (kWh/m2). As PV panels are the sole energy production facility, this metric allows the total energy available in the district to be calculated. The energy potential of PV panels depends on solar irradiance and the PV power conversion efficiency. The solar irradiance above the earth’s atmosphere (Solar Constant) on a clear day at solar noon in the summer months is around 1380 Watts per square meter (W/m2). The earth at sea level receives about 1000 W/m2. In current PV panels, the efficiency is at the level of 20% and an equal percentage of solar radiation is converted into electricity. On an average day, a PV panel receives about 5 to 6 h of direct full sun. Thus, one square meter of PV panel will give approximately 1–1.2 kWh per day, a max of 365–438 kWh annually.
PV panels’ energy output depends on geographic location, solar irradiance and their power conversion efficiency. The NREL’s PV Watts Calculator (https://pvwatts.nrel.gov/) (accessed 13 December 2021) allows the energy output of grid-connected photovoltaic energy systems throughout the world to be estimated. Using this calculator, we find that a PV panel system of 1 kW gives annually 1416 kWh in Athens Greece, 944 kWh in Paris France, and 894 kWh in Helsinki Finland.
The installation of photovoltaic panels on the roof of buildings can follow different patterns depending on the roof. Figure 2 shows different types of roofs and the coverage rates for PV panels. A flat roof has a photovoltaic panel capacity of 50–70% of its surface, which drops to 40% on gable and hipped roofs.
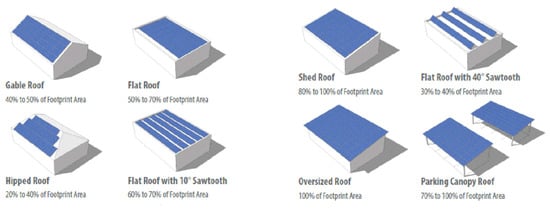
Figure 2.
Placing photovoltaic panels on building roofs. Source: Adapted from Polly et al. [58].
Given the above data, we compute the energy generated by PV panels in three steps. First, we estimate the total surface of PV panels in the district, including panels on building roofs, on the ground in private yards, and in public parking spaces. We assume the maximum capacity of photovoltaic panels on roofs of buildings (70%), plus photovoltaic panels on the ground equal to 10% of residential plots, plus panels on streets and parking areas equal to 10% of this area. Second, considering the district as a Virtual Power Plant, we compute the DC system size. PV Watts Calculator proposes the following formula to estimate the system size based on the area of the array: Size (kW) = Array Area (m2) × 1 kW/m2 × Module Efficiency (%). For module efficiency, we consider that 1 square meter of PV panel gives 0.217 kW. This is a rather conservative estimation given that new PV panels available on the market have a power conversion capacity at the level of 30%. Third, for a given city we use the PVWatts® Calculator to compute the energy generated annually.
PV panels surface: 0.70 × [Housing area × BRC + 0.10 × Housing area + 0.10 Road and parking area]
PVs = 0.70 × [Ah × BRC + 0.1 × Ah + 0.1 × Ar] (sm)
PVs = 0.70 × [Ah × BRC + 0.1 × Ah + 0.1 × Ar] (sm)
DC system size = 0.217 × PV panels surface (kW)
Energy from PV panels = DC system size × solar irradiance
ERE = f (DC system size) (kWh/year)
ERE = f (DC system size) (kWh/year)
- C7. Local RE: Heat pumps and geothermal heat pumps
This type of renewable energy can be used to reduce energy consumption for space heating (EH) and domestic water heating (EDWH). As shown in Table 4, these categories account for 63.6% and 14.8% of household energy consumption in the EU. Currently, gas and petroleum products have high shares in the energy sources of these two energy usage categories. Air-source heat pumps (ASHP) and geothermal heat pumps (GHP) allow the transition from gas and diesel for space and water heating to electricity with a considerable energy reduction margin. There is a double gain to this; transitioning to electricity enables saving energy, using renewable energy and reducing CO2 emissions [59,60].
The most common commercial solutions for heating are air-source heat pumps that take heat from the atmosphere and heat water which then circulates to heat radiators. Geothermal heat pumps are more efficient and use the heat of the earth to provide heating for houses and offices and water heating too. Compared to air source heat pumps, geothermal pumps are more energy efficient as they take advantage of ground temperatures which are more uniform than air temperatures. They can reduce energy consumption by approximately 25% to 50% compared to air-source heat pump systems [61].
The energy efficiency of a heat pump, whether ASHP or GHP, for heating is defined by the Coefficient of Performance (COP) and for cooling by the Energy Efficiency Ratio (EER). The Total Efficiency Ratio (TER) defines both heating and cooling efficiency. A heat pump with a COP 4.0 gives 4 kW of energy by consuming 1 kW of electricity only, which corresponds to a significant energy reduction [62].
Many publications have attempted simulations and experimental studies to assess the energy saving of heat pump-based heating systems. Zanetti et al. [63] reviewing papers that compared different solutions of photovoltaic-assisted by air-source heat pumps show a potential energy saving of between 20–35%. The energy efficiency of geothermal heat pumps is higher; they remain an under-used technology, due mainly to the limited awareness of their potential. Their CO2 emissions are less than half those of conventional oil boiler systems [64]. According to Energy Saver, U.S. Department of Energy, “[a] heat pump can reduce electricity use for heating by approximately 50% compared to electric resistance heating such as furnaces and baseboard heaters” [65].
Given this data, we can estimate the energy-saving potential of heat pumps for space heating and water heating as follows:
Energy saving heating = Energy reduction coefficient (x) × Energy consumption residential total (kWh) × Energy consumption residential-heating (%)
EH-S = 0.35 × ERT × EH
Energy saving domestic water heating = Energy reduction coefficient (x) × Energy consumption residential total (kWh) × Energy consumption residential- domestic water heating (%)
EDWH-S = 0.35 × ERT × EDWH
- C8. Nature-based solutions: Tree canopy and CO2 offset
The concept of ‘Nature-based solutions’ (NbS) was introduced by the World Bank to underline the positive role of biodiversity on the climate. The International Union for Conservation of Nature (IUCN) defines NbS as “actions to protect, sustainably manage and restore natural or modified ecosystems, which address societal challenges (e.g., climate change, food and water security or natural disasters) effectively and adaptively, while simultaneously providing human well-being and biodiversity benefits” (Cohen-Shacham et al.) cited by [66]. Nature-based solutions is an umbrella concept for ecosystem-based adaptation (EbA), green infrastructure (GI), and ecosystem services (ESS). These concepts are interrelated and form a dominant discourse on human-nature relationships. They are based on the same set of principles, such as multifunctionality and participation. Their differences are related to implementation in planning and practice [67].
Nature-based solutions protect, manage, restore, or enhance natural ecosystems in cities. In the fight against climate change, NbS comprise measures that stop deforestation and increase tree canopy and green areas that capture CO2 emissions. Prominent land-based nature-based solutions for negative emissions are afforestation, biomass for energy with carbon capture and storage, and soil carbon sequestration [68]. Examples of NbS include trees in urban parks and forests, street trees that contribute to lowering the temperature in cities, elimination of urban heat islands, conservation of natural habitat space in floodplains, as well as architectural solutions for buildings, green roofs, wall installations for temperature reduction and energy saving through reduced cooling loads [66].
Planting trees and expanding tree canopy in cities is the most established NbS. It is based on the capacity of trees to take CO2 from the air and convert it into oxygen and plant material through photosynthesis. Encon, an independent agency that supports organisations to become more sustainable, having reviewed many studies on CO2 capture by trees, estimates that “the annual CO2 offsetting rate varies from 21.77 kg CO2/tree to 31.5 kg CO2/tree. To compensate 1 tonne of CO2, 31 to 46 trees are needed. In Europe, there are 300 to 500 trees per hectare. For calculating the figures on the Encon website, we assume a rate of 24 kg CO2/tree and an average of 500 trees per hectare. This means that 1 hectare of forest: 500 trees × 24 kg CO2/tree = 12,000 kg of CO2 offsets, i.e., 12 tonnes CO2/hectare.” [69]. However, estimations based on the US Environmental Protection Agency give a max capture capacity per 10-year urban tree at 38 lbs (17.2 kg) per year. This capacity increases substantially with tree age [70].
In a city district, trees can be planted in three areas, (a) public gardens and green spaces, (b) on both sides of roads, and (c) in private gardens, yards, and the non-built space of plots. The maximum number of trees in the tree canopy of a city district can be estimated as follows:
- (a)
- Public gardens, large and small, and city forests can contain 500 trees per hectare. We assume 60% coverage of green spaces by trees.
- (b)
- Roads with trees on both sides at an average distance of 5 m from each other can contain 400 trees per km.
- (c)
- Private gardens and yards may have 25% of their surface covered by trees.
Thus, the maximum capacity of CO2 absorption by the tree canopy in a district is
CO2 absorption = Number of trees × CO2 absorption/tree
CO2-a = [f (Ag)+f(Rlg)+f(Ah)] × 24 kg CO2/tree (kg)
CO2-a = [f (Ag)+f(Rlg)+f(Ah)] × 24 kg CO2/tree (kg)
Ag = green area, Rlg = road length, Ah = housing area
3.5. Block D: Balancing Energy and CO2 in the NZED
Block D of the model combines the solutions of block C and assesses the transformation of energy consumption and CO2 generated by the variables in Blocks A and B. Thus, in Block D we can assess different scenarios for balancing energy and CO2 emissions, the feasibility of an NZED, and the thresholds of feasibility. The hypotheses we described (H1, H2, H3) can be validated or rejected by the balancing of energy and CO2.
Since in all transition scenarios, part of the energy used in mobility will be from fossil fuels (diesel and gas), due to the value of the z coefficient in transportation, we must also calculate the CO2 balance between the CO2 released and the CO2 removed by nature-based solutions. Thus, in block D, starting from an NZED scenario, we calculate first the energy balance and then the carbon balance. A transition to NZED is documented when both balances are positive in favour of renewable energy and CO2 absorption.
D1. Energy balance: Energy balance is equal to total energy demand after optimisation by smart systems minus renewable energy produced locally (EDi-EREi). To calculate this balance, we take one by one the measures for transition to NZED (C1–C7) and compute the saving of energy due to smart city systems and the renewable energy generated from PV panels. Estimations are not cumulative one over the other, and we follow the equations given in C1 to C7. Thus, for positive Energy Balance, the total energy consumption in housing, street lighting, mobility by public transport and electromobility minus energy saving from measures for transitioning to NZED should be lower than energy generated by PV panels.
D2. Carbon balance: In the short- and medium-term, even if the mobility of public transport is completely converted to electricity, there will be some private mobility by cars that will use fossil fuels and generate CO2 emissions. For a carbon balance, these CO2 emissions should be less than the amount of CO2 removed from the atmosphere by nature-based solutions. Thus, for a positive Carbon Balance, CO2 emissions in mobility by private cars should be lower than the CO2 removed by nature-based solutions.
The overall NZED transition model can be described by the following equations:
where refers to the total energy consumption in housing (ER), street lighting (ESL), mobility (EM) including private cars (EMPC), public transport (EMPT) and electromobility (EMEV); refers to energy savings from heating (EH-S), lighting and appliances (ELA-S), smart city lighting (ESL-S), with the addition of the energy consumption by electric mobility (EEV); refers to the energy generated by PV panels.
And
where refers to the CO2 emissions from mobility by private car; and to the capacity of CO2 absorption by tree canopy in the district.
By taking a closer look at these two model equations, we can see that Equation (12) suggests that the difference between energy consumption () and energy savings () should be lower than the amount of energy generated by PV panels () for a district to experience an effective transition to NZED. At the same time, Equation (13) indicates the need for the CO2 emissions to be less than the capacity of CO2 absorption by tree canopy in a district (). Having these two conditions in mind, we can document the transition to NZED in specific scenarios which we analyse in the following section.
4. Simulation and Results
4.1. Baseline Scenario and Simulations
The model for assessing the transition to NZED we described can be applied to any housing district, anywhere in the world. The outcome depends on the specific features of the district, energy consumption, and climate conditions. Even in neighbouring districts within the same city, the outcome can be different.
This is due to the variables included in Blocks A, B, and C of the model. The variables in Block A depend on the spatial features of a city district, land uses, population density, the morphology of the city grid, the building code (BRC, FAR), mobility patterns, pedestrian and bicycle lanes, and others. The variables in Block B depend on geography, variations in climate, energy consumption per capita, available modes of transportation. The variables in Block C depend on human behaviour towards sustainability, energy saving, investment in renewable energy, community planning for smart city systems, and public policy towards nature-based solutions.
The transition scenarios to NZED are countless. There are millions of combinations between the variables of Blocks A, B and C. To assess many scenarios and the Hypotheses H1, H2, and H3 we have described, we start from a baseline scenario upon which we calculate the energy and carbon balance for different cities. Then, we change key variables of this scenario and recalculate energy and the CO2 balance. This method allows for verifying or rejecting the H1 hypothesis on the feasibility of NZED, defining thresholds for H2, and assessing the hypothesis H3 on the compatibility between the compact city and the NZED.
The baseline scenario we choose describes a usual district of pure housing with the following features. In Block A, the population is 5000 inhabitants, gross density is 100 inhabitants/ha (net density 200 inhabitants/ha), the number of persons per household is equal to the EU average, the housing area is 50% of the total, the road area is 20% of the total, and green spaces, gardens and urban forests account for 30% of the total, the road width is 8 m, BRC is 40%, and FAR is 0.8. The number of building blocks on the grid is 169, there are 676 lighting poles, and the total road length in the grid is 12 km. The number of commuting travels per worker annually is 500, and the average distance per commuting travel is 10 km.
In Block B, to compute the energy consumption and CO2 emissions for a city district, we take as residential energy consumption per capita (ERPC) in the district the value of the corresponding country provided by Our World in Data (https://ourworldindata.org/energy) (accessed 13 December 2021). Additionally, we use the breakdown of residential energy consumption as in the EU (2019) presented in Table 4. We calculate energy consumption for public lighting and mobility according to the values of Block A variables.
In Block C, all transition measures (C1–C8) are included, the (z) coefficient we use is 1.0, and coverage of PV panels is at the maximum of 70% of building roof surface. These strong transition measures need an institutional framework for carbon neutrality making the deployment of solar panels on every building obligatory, electric mobility in public transport, and progressive replacement of vehicles by electric vehicles.
We assess through simulations the baseline scenario at three geographic locations and climate conditions, in cities of northern Europe (Helsinki, Stockholm), central Europe (Frankfurt, Munich, Vienna), and southern Europe (Athens, Rome, Madrid) and examine the feasibility of transition to NZED (hypothesis H1). Then, we change the variables included in Blocks A, B, and C related to density, mobility, and PV power conversion efficiency to identify critical thresholds in the transition to NZED (hypothesis H2). Additionally, we change the spatial features of districts with positive energy and carbon emission balance to evaluate their compatibility with the compact city form (hypothesis H3).
4.2. Feasibility of NZED—H1
The outcome of the baseline scenario in Athens, Frankfurt and Helsinki is presented in Table 7. Transition to NZED combining smart city systems, local production of renewable energy, and nature-based solutions is feasible in Athens only. In Frankfurt and Helsinki, there is an annual gap of 15.03 and 24.56 GWh of renewable energy. In Athens, the model shows a surplus of 6.18 GWh of renewable energy, which indicates that other land uses in the district can be accommodated, such as social amenities, local retail, and personal services.
Table 7.
Outcome of baseline NZED scenario in Athens, Frankfurt, and Helsinki.
This data shows that as we move from southern to northern Europe, energy consumption increases, and the energy yield of solar panels diminishes. In central and northern Europe, geographic and climate conditions do not allow a transition to NZEDs without renewable energy imported from external sources. Both positive and negative outcomes have a magnitude that leaves no doubt about the conclusion. In Athens, the renewable energy surplus is 24.80% of the energy needs, in Frankfurt, the renewable energy gap is 42.77%, and in Helsinki, the gap is 55.94% of the energy needs.
These outcomes are similar in other cities of southern, central, and northern Europe, such as Rome, Madrid, Munich, Vienna, and Stockholm, in which we have tested the model. In all cases, there is a positive renewable energy balance in southern Europe and a negative one in central and northern Europe.
The transition to NZED is made possible by two groups of technologies, on the one hand, energy-saving technologies including smart city systems, and on the other, renewable energy production. Simulations show that both are equally important. In all scenarios, the saving of energy by smart city systems is at the level of 40%. Renewable energy covers 1.25 times the energy usage in Athens, and 0.57 to 0.44 of energy consumption in Frankfurt and Helsinki.
4.3. Critical Thresholds for Carbon-Neutral Disricts—H2
Some factors have a strong impact on the feasibility of a self-efficient NZED relying on locally produced renewable energy from solar panels. The simulations we have tried reveal three critical thresholds.
Higher density due to a larger population in the district increases the total energy consumption that has to be covered by renewable energy, and vice versa. Table 8 illustrates the relationships between density and the feasibility of the NZED. By decreasing the gross density in the Frankfurt scenario from 100 to 56 in/ha and in Helsinki from 100 to 43 in/ha, both scenarios show a positive balance of energy, and the NZED becomes feasible.
Table 8.
Impact of density on NZED feasibility.
However, increasing density in the Athens scenario, besides the margin in energy balance, the NZED turns out to not be feasible due to a negative balance of CO2 emissions. It seems that gross population density at the level of 100 in/ha or net density of 200 in/ha is an upper limit for the feasibility of NZEDs, given the current efficiency of solar panels to convert solar irradiance to electricity.
Electric mobility: The capacity to capture CO2 emissions in an NZED comes from the tree canopy, the available space for planting trees and the age of trees as their absorptive capacity increases with age. Within a city district, the available space for trees is limited. In positive NZED transitions, the tree canopy is close to 25% of the district area. This percentage is high, since in few cities tree canopy exceeds 30% of their surface. Therefore, the absorption capacity of CO2 emissions released in the district is also limited. A ceiling for CO2 absorption by trees is 300 tons per year.
This is a threshold for the total CO2 emissions to be released in the district, either in residences or mobility. If only electricity is used in residential energy, then this threshold is for emissions from mobility and vehicles using fossil fuels. It corresponds to a low percentage of commuting with a non-electric private car by 15% of the active population. All other commuting has to be carried out by electric vehicles, electric public transport, and e-micro mobility.
Even if there is a surplus of renewable energy, the CO2 balance sets an upper limit on the share of the population using traditional fossil-fuel vehicles. In the Athens-120 scenario with a gross density of 120 in/ha and population of 6000, the increase in CO2 emissions in mobility from 285 tons to 342 means transition to NZED is not feasible.
Solar panel technology and RE generation: The power conversion efficiency (PCE) of solar panels (the percentage of solar energy converted to electricity) has been steadily increasing over the last 20 years [71,72]. The National Renewable Energy Laboratory (NREL) has mapped the evolution of proven conversion efficiency for a range of photovoltaic technologies since 1976 (https://www.nrel.gov/pv/cell-efficiency.html) (accessed 13 December 2021). Progress is staggering from a very low PCE in the early 1980s to 48% in 2020. In commercial application of PV research, we should expect the current performance of solar panels, which is at 25%, to double within a decade. In such technological progress, the thresholds of NZED feasibility we have identified in terms of population density will change radically. Self-sufficient NZEDs will become feasible in central and northern Europe at 200 in/ha net residential density, enabling the deployment of PV panel based NZEDs throughout Europe.
4.4. Rejection of the Compact City Form—H3
In the 1990s, New Urbanism and smart urban growth planning [73,74] introduced the concept of the compact city to reduce energy consumption and the dependence of daily commuting on the automobile. Energy efficiency and search for low environmental pollution have been the drivers of these planning concepts. The Leadership in Energy and Environmental Design approach, introduced by the U.S. Green Building Council as a rating system combining principles of smart growth, new urbanism, and green building, also promotes compact city districts. In, LEED v4 for Neighborhood Development (updated 2 July 2018) the intent of a compact city is “To conserve land. To promote livability, walkability, and transportation efficiency and reduce vehicle distance travelled. To leverage and support transit investments. To improve public health by encouraging daily physical activity” (p. 31). In planning compact city districts, the residential density in districts located within walking distances to transit services, should be 12 or more dwelling units per acre (or 30 DU per hectare) of buildable land available for residential uses.
There is an increasing body of knowledge over the last years that has questioned the validity of the compact city form [75,76,77]. Additionally, planning standards in some countries recommend higher density development at a minimum of 30 DU per hectare.
The outcome of the NZED model we described shows that a net density of 200 inhabitants per hectare (100 gross density) is the upper limit for a self-sufficient NZED in southern Europe, a density which is limited further in central and northern Europe. These densities correspond to floor space of between 8000 and 4000 square meters per hectare. With an average of 250 square meters per dwelling unit, they correspond to 16–32 dwelling units per hectare, a density quite below those of the compact city form. Moreover, the unbuilt space of private plots (max BRC 40%) is needed for deployment of PV panels and planting trees on yards at 10% and 25% of the land, respectively.
The model we developed shows that the compact city form is not compatible with a design suitable for self-sufficient net-zero city districts. Smart city technologies and renewable energy production suitable for cities, which exclude urban wind turbines and biomass, demand more open space than the compact city can afford. The energy-saving principle, which has been a pillar of the compact city concept, is a barrier to the sufficient deployment of renewable energy, while a rising density increases the population and energy needs of the district.
5. Conclusions: Connected Intelligence for Carbon-Neutral Cities
The model for transition to NZED we developed shows that under certain population density, at the level of 100 in/ha gross or 200 in/ha net, a housing district using fossil fuels in residential energy, public lighting, and mobility can evolve into a self-sufficient NZED with zero annual CO2 emissions, relying on locally produced renewable energy from solar panels. The urban form of such districts is not compatible with a compact city form.
The NZED model and the simulations we performed also reveal a series of limitations and major challenges for implementing the transition to carbon-neutral neighbourhoods. Currently, NZEDs are feasible in southern Europe where climatic conditions limit energy consumption, while PV panels energy yield is high. However, self-sufficient NZEDs are not feasible in central and northern Europe. However, in the near future, commercial applications of technologies that improve PV panel power conversion efficiency could make the transition to NZEDs feasible throughout Europe.
The transition to NZEDs must also address challenges that we have not discussed in this work, such as the asymmetry of energy consumption and energy production from renewable sources during the year, the transfer energy from peak energy production in summer to high energy consumption in winter, and the financial aspects of the investments needed. Additional RE supply and storage would be needed, as well as connectivity of the local smart grid with the public energy grid.
For a long period, when more than 15% of the district’s residents continue to use fossil fuel vehicles in commuting, the district will function as a “near-zero” rather than “net-zero” energy district without balancing the CO2 emissions. It will take a decade or more to reach a level of 85% carbon-free mobility. Additionally, developing a tree canopy at 25–30% of the district surface will take a decade to properly develop its CO2 absorption capacity. These limitations make it clear that the transition to NZEDs is a project that will take more than a decade to be completed. However, in cities where climate conditions are favourable, the transition can start now, even as near-zero energy districts at first.
In addition to these limitations, the novelty of the proposed approach relates to the combination of three types of measures for transition to NZEDs, namely (a) smart city systems and solutions for energy optimisation and saving, (b) renewable energy systems suitable to housing districts, and (3) nature-based solutions. This is a major difference from previous works towards net-zero solutions which focus exclusively on renewable energy and the energy balance to zero CO2 [1,22,78].
Using the transition model to NZED, we studied the impact of eight measures that can drive this transformation. The transition measures relate to behaviours, capabilities, and forms of intelligence of three types of agents: (1) humans, in decisions for energy investment and saving, generation of renewable energy, mainly adopting a prosumer culture, (2) communities, in setting rules for district planning and operation, and (3) machines in data analytics, automation, and real-time optimisation. Simulations with the model of transition to NZED and the study of feasibility thresholds reveal how behaviours and capabilities at those three levels are interrelated and how connected intelligence is needed for the transition to NZED [79,80,81,82,83].
In human behaviour, the most important is adhering to a prosumer culture, with households investing in renewable energy, PV panels and heat pumps, using electric vehicles and e-micro-mobility for commuting, connecting homes, exchanging, and sharing energy over the local smart grid.
In the community of the district, important behaviours relate to setting up energy communities, control of population density, development of a smart grid in the district, sharing energy under a barter exchange that will increase equity in the community, upgrading public transport to electromobility, installing smart lighting systems, and planning for nature-based solutions.
In machine capabilities, it is necessary to set up smart city systems, a smart grid, and smart meters, platforms for local energy transaction, to make available performance data and analytics, dashboards to raise user awareness, and to use automation and algorithms for energy optimisation.
Combining human, community, and machine capabilities, the city district develops a system of intelligence having the functions that Legg and Hutter [84] consider as core properties of intelligence, namely (a) communication and interaction with the environment, (b) problem-solving based on memory and learning, and (c) behaviour adaptation based on prediction. In NZEDs, these functions are supported by smart city systems, digital platforms for energy optimisation, and algorithms embedded in smart city solutions.
All the above behaviours and capabilities are necessary for creating an effective ecosystem of self-sufficient NZEDs. The numerical data shows that the highest impact comes from changes in human behaviour in favour of producing renewable energy and turning to electromobility. Additionally, high is the impact of community behaviours which work as enablers for more effective human behaviour. Overall, the strength of the system depends on the integration of human actions, community settings, and machine capabilities.
Funding
This research received no external funding.
Institutional Review Board Statement
Not applicable.
Informed Consent Statement
Not applicable.
Data Availability Statement
Data sources and links are provided intext.
Conflicts of Interest
The authors declare no conflict of interest.
References
- Koutra, S.; Becue, V.; Gallas, M.A.; Ioakimidis, C.S. Towards the development of a net-zero energy district evaluation approach: A review of sustainable approaches and assessment tools. Sustain. Cities Soc. 2018, 39, 784–800. [Google Scholar] [CrossRef]
- Cortese, A.; Higgins, C. Getting to Zero Status Update: A Look at the Projects, Policies and Programs Driving Zero Net Energy Performance in Commercial Buildings. USA. 2014. Available online: https://newbuildings.org/sites/default/files/2014_Getting_to_Zero_Update.pdf (accessed on 13 November 2021).
- Saheb, Y.; Shnapp, S.; Paci, D. From Nearly-Zero Energy Buildings to Net-Zero Energy Districts; JRC Technical Reports; Publications Office of the European Union: Luxembourg, 2019. [Google Scholar]
- Amado, M.; Poggi, F. Solar urban planning: A parametric approach. Energy Procedia 2014, 48, 1539–1548. [Google Scholar] [CrossRef] [Green Version]
- Pinna, A.; Massidda, L. A procedure for complete census estimation of rooftop photovoltaic potential in urban areas. Smart Cities 2020, 3, 873–893. [Google Scholar] [CrossRef]
- Singh, R.; Banerjee, R. Estimation of rooftop solar photovoltaic potential of a city. Sol. Energy 2015, 115, 589–602. [Google Scholar] [CrossRef]
- Fath, K.; Stengel, J.; Sprenger, W.; Wilson, H.R.; Schultmann, F.; Kuhn, T.E. A method for predicting the economic potential of (building-integrated) photovoltaics in urban areas based on hourly Radiance simulations. Sol. Energy 2015, 116, 357–370. [Google Scholar] [CrossRef]
- Mithraratne, N. Roof-top wind turbines for microgeneration in urban houses in New Zealand. Energy Build. 2009, 41, 1013–1018. [Google Scholar] [CrossRef]
- Gagliano, A.; Nocera, F.; Patania, F.; Capizzi, A. Assessment of micro-wind turbines performance in the urban environments: An aided methodology through geographical information systems. Int. J. Energy Environ. Eng. 2013, 4, 1–14. [Google Scholar] [CrossRef] [Green Version]
- Reber, T.J.; Beckers, K.F.; Tester, J.W. The transformative potential of geothermal heating in the US energy market: A regional study of New York and Pennsylvania. Energy Policy 2014, 70, 30–44. [Google Scholar] [CrossRef]
- Miglani, S.; Orehounig, K.; Carmeliet, J. A methodology to calculate long-term shallow geothermal energy potential for an urban neighbourhood. Energy Build. 2018, 159, 462–473. [Google Scholar] [CrossRef] [Green Version]
- Eickhout, B.; van den Born, G.J.; Notenboom, J.; Oorschot, M.V.; Ros, J.P.M.; Van Vuuren, D.P.; Westhoek, H.J. Local and Global Consequences of the EU Renewable Directive for Biofuels: Testing the Sustainability Criteria; Netherlands Environmental Assessment Agency (MNP): Bilthoven, The Netherland, 2008.
- Hoang, A.T.; Nguyen, X.P. Integrating renewable sources into energy system for smart city as a sagacious strategy towards clean and sustainable process. J. Clean. Prod. 2021, 305, 127161. [Google Scholar] [CrossRef]
- Maret, I.; Blakeman, H. Can we plan to protect our environment? Spreading urbanisation in the state of Louisiana. WIT Trans. Ecol. Environ. 1970, 84, 451–461. [Google Scholar]
- Meck, S. (Ed.) Growing Smart Legislative Guidebook: Model Statutes for Planning and the Management of Change; Routledge: New York, NY, USA, 2020. [Google Scholar]
- Calthorpe, P. The Next American Metropolis: Ecology, Community, and the American Dream; Princeton Architectural Press: New York, NY, USA, 1993. [Google Scholar]
- Carlisle, N.; Van Geet, O.; Pless, S. No. NREL/TP-7A2-46065; Definition of a ‘Zero Net Energy’ Community. National Renewable Energy Lab. (NREL): Golden, CO, USA, 2009.
- Komninos, N. Smart Cities and Connected Intelligence: Platforms, Ecosystems and Network Effects; Routledge: London, UK, 2020. [Google Scholar]
- Jacobides, M.G.; Cennamo, C.; Gawer, A. Towards a theory of ecosystems. Strateg. Manag. J. 2018, 39, 2255–2276. [Google Scholar] [CrossRef] [Green Version]
- Panagiotidou, M.; Fuller, R.J. Progress in ZEBs—A review of definitions, policies and construction activity. Energy Policy 2013, 62, 196–206. [Google Scholar] [CrossRef]
- Torcellini, P.; Pless, S.; Deru, M.; Crawley, D. No. NREL/CP-550-39833; Zero Energy Buildings: A Critical Look at the Definition. National Renewable Energy Lab. (NREL): Golden, CO, USA, 2006.
- Pacho, A. Retrofitting Residential Districts to Nearly Zero-Energy: A Conceptual Energy Master Planning Framework. Master Thesis submitted for the Erasmus Mundus Joint Master Degree on Smart Cities and Communities (SMACCs). Available online: https://www.researchgate.net/publication/354600950_Retrofitting_Residential_Districts_to_Nearly_Zero-Energy_A_Conceptual_Energy_Master_Planning_Framework (accessed on 13 November 2021).
- Esbensen, T.V.; Korsgaard, V. Dimensioning of the solar heating system in the zero energy house in Denmark. Sol. Energy 1977, 19, 195–199. [Google Scholar] [CrossRef]
- Lin, Y.; Zhong, S.; Yang, W.; Hao, X.; Li, C.Q. Towards zero-energy buildings in China: A systematic literature review. J. Clean. Prod. 2020, 276, 123297. [Google Scholar] [CrossRef]
- Echeverri, L.G. Investing for rapid decarbonisation in cities. Curr. Opin. Environ. Sustain. 2018, 30, 42–51. [Google Scholar] [CrossRef]
- Wells, L.; Rismanchi, B.; Aye, L. A review of net zero energy buildings with reflections on the Australian context. Energy Build. 2018, 158, 616–628. [Google Scholar] [CrossRef]
- Hast, A.; Syri, S.; Welsch, J.; Korkmaz, P.; Balyk, O. Transition to carbon neutral energy systems-implications to district heating in cities. In Proceedings of the 2018 15th International Conference on the European Energy Market (EEM), Lodz, Poland, 27–29 June 2018; pp. 1–5. [Google Scholar]
- Hansen, K.; Mathiesen, B.V.; Skov, I.R. Full energy system transition towards 100% renewable energy in Germany in 2050. Renew. Sustain. Energy Rev. 2019, 102, 1–13. [Google Scholar] [CrossRef]
- NREL. A Guide to Energy Master Planning of High-Performance Districts and Communities. National Renewable Energy Laboratory. 2020. Available online: https://www.nrel.gov/docs/fy21osti/78495.pdf (accessed on 13 November 2021).
- JPI Urban Europe Positive Energy Districts (PED). Available online: https://jpi-urbaneurope.eu/ped/ (accessed on 13 November 2021).
- Abada, I.; Ehrenmann, A.; Lambin, X. On the viability of energy communities. Energy J. 2020, 41, 113–150. [Google Scholar] [CrossRef]
- de Vries, G.W.; Boon, W.P.; Peine, A. User-led innovation in civic energy communities. Environ. Innov. Soc. Transit. 2016, 19, 51–65. [Google Scholar] [CrossRef]
- Gui, E.M.; MacGill, I. Typology of future clean energy communities: An exploratory structure, opportunities, and challenges. Energy Res. Soc. Sci. 2018, 35, 94–107. [Google Scholar] [CrossRef]
- Blasch, J.; van der Grijp, N.M.; Petrovics, D.; Palm, J.; Bocken, N.; Darby, S.; Barnes, J.; Hansen, P.; Kamin, T.; Golob, U.; et al. New clean energy communities in polycentric settings: Four avenues for future research. Energy Res. Soc. Sci. 2021, 82, 102276. [Google Scholar] [CrossRef]
- Caramizaru, A.; Uihlein, A. Energy Communities: An Overview of Energy and Social Innovation; Publications Office of the European Union: Luxembourg, 2020. [Google Scholar]
- Pahkala, T.; Uimonen, H.; Väre, V. Flexible and Customer-Centred Electricity System. Final Report of the Smart Grid Working Group; Ministry of Economic Affairs and Employment: Helsinki, Finland, 2018.
- Ghadami, N.; Gheibi, M.; Kian, Z.; Faramarz, M.G.; Naghedi, R.; Eftekhari, M.; Fathollahi-Fard, A.M.; Dulebenets, M.A.; Tian, G. Implementation of solar energy in smart cities using an integration of artificial neural network, photovoltaic system and classical Delphi methods. Sustain. Cities Soc. 2021, 74, 103149. [Google Scholar] [CrossRef]
- Mohandas, P.; Dhanaraj, J.S.A.; Gao, X.Z. Artificial neural network based smart and energy efficient street lighting system: A case study for residential area in Hosur. Sustain. Cities Soc. 2019, 48, 101499. [Google Scholar] [CrossRef]
- Foley, A.M.; Gallachóir, B.Ó.; Hur, J.; Baldick, R.; McKeogh, E.J. A strategic review of electricity systems models. Energy 2010, 35, 4522–4530. [Google Scholar] [CrossRef]
- de Santoli, L.; Mancini, F.; Garcia, D.A. A GIS-based model to assess electric energy consumptions and usable renewable energy potential in Lazio region at municipality scale. Sustain. Cities Soc. 2019, 46, 101413. [Google Scholar] [CrossRef] [Green Version]
- Eurostat. Energy Consumption in Households. 2019. Available online: https://ec.europa.eu/eurostat/statistics-explained/index.php?title=Energy_consumption_in_households (accessed on 25 August 2021).
- Eurostat. Passenger Mobility Statistics. 2021. Available online: https://ec.europa.eu/eurostat/statistics-explained/index.php?title=File:Travel_distance_per_person_per_day_by_main_travel_mode_for_urban_mobility_on_all_days_(%25)_Feb_2021.png (accessed on 25 August 2021).
- Burrows, M.; Burd, C.; McKenzie, B. Commuting by Public Transportation in the United States: 2019. American Community Survey Reports. 2021. Available online: https://www.census.gov/content/dam/Census/library/publications/2021/acs/acs-48.pdf (accessed on 25 August 2021).
- Carratt, A.; Kokogiannakis, G.; Daly, D. A critical review of methods for the performance evaluation of passive thermal retrofits in residential buildings. J. Clean. Prod. 2020, 263, 121408. [Google Scholar] [CrossRef]
- Tuominen, P.; Klobut, K.; Tolman, A.; Adjei, A.; de Best-Waldhober, M. Energy savings potential in buildings and overcoming market barriers in member states of the European Union. Energy Build. 2012, 51, 48–55. [Google Scholar] [CrossRef]
- Amsterdam Smart City. Smart Stories. 2011. Available online: http://issuu.com/amsterdamsmartcity/docs/smart_stories (accessed on 25 August 2021).
- Panna, R.; Thesrumluk, R.; Chantrapornchai, C. Development of energy saving smart home prototype. Int. J. Smart Home 2013, 7, 47–66. [Google Scholar]
- Subramani, C.; Surya, S.; Gowtham, J.; Chari, R.; Srinivasan, S.; Siddharth, J.P.; Shrimali, H. Energy efficiency and pay-back calculation on street lighting systems. AIP Conf. Proc. 2019, 2112, 020082. [Google Scholar]
- Dutt, G.S. Illumination and sustainable development. Part I: Technology and economics. Energy Sustain. Dev. 1994, 1, 23–35. [Google Scholar] [CrossRef]
- Escolar, S.; Carretero, J.; Marinescu, M.C.; Chessa, S. Estimating energy savings in smart street lighting by using an adaptive control system. Int. J. Distrib. Sens. Netw. 2014, 10, 971587. [Google Scholar] [CrossRef]
- Nefedov, E.; Maksimainen, M.; Sierla, S.; Flikkema, P.; Yang, C.W.; Kosonen, I.; Luttinen, T. Energy efficient traffic-based street lighting automation. In Proceedings of the 2014 IEEE 23rd International Symposium on Industrial Electronics (ISIE), Istanbul, Turkey, 1–4 June 2014; pp. 1718–1723. [Google Scholar]
- Moreno, C.; Allam, Z.; Chabaud, D.; Gall, C.; Pratlong, F. Introducing the “15-Minute City”: Sustainability, resilience and place identity in future post-pandemic cities. Smart Cities 2021, 4, 93–111. [Google Scholar] [CrossRef]
- Pozoukidou, G.; Chatziyiannaki, Z. 15-Minute City: Decomposing the New Urban Planning Eutopia. Sustainability 2021, 13, 928. [Google Scholar] [CrossRef]
- Lee, Y.; Paredes, J.R.; Lee, S.H. Smart Grid and Its Application in Sustainable Cities. Inter-American Development Bank. 2012. Available online: https://www.uraia.org/documents/32/SMARTdoc_2bb8X1O.pdf (accessed on 13 November 2021).
- European Commission, Directorate-General for Research and Innovation, Virtual Power Plant/Integrated Energy, Publications Office of the European Union, Luxembourg: 2021. Available online: https://op.europa.eu/en/publication-detail/-/publication/8aa0ee83-aedd-11eb-9767-01aa75ed71a1/language-en (accessed on 12 December 2021).
- Atasoy, T.; Akınç, H.E.; Erçin, Ö. An analysis on smart grid applications and grid integration of renewable energy systems in smart cities. In Proceedings of the 2015 International Conference on Renewable Energy Research and Applications (ICRERA), Palermo, Italy, 22–25 November 2015; pp. 547–550. [Google Scholar]
- Farmanbar, M.; Parham, K.; Arild, Ø.; Rong, C. A widespread review of smart grids towards smart cities. Energies 2019, 12, 4484. [Google Scholar] [CrossRef] [Green Version]
- Polly, B.; Pless, S.; Houssainy, S.; Torcellini, P.; Livingood, W.; Zaleski, S.; Jungclaus, M.; Hootman, T.; Craig, M. No. NREL/TP-5500-78495; A Guide to Energy Master Planning of High-Performance Districts and Communities. National Renewable Energy Lab. (NREL): Golden, CO, USA, 2020.
- David, F.; Madani, H. On heat pumps in smart grids: A review. Renew. Sustain. Energy Rev. 2017, 70, 342–375. [Google Scholar]
- Hepbasli, A.; Kalinci, Y. A review of heat pump water heating systems. Renew. Sustain. Energy Rev. 2009, 13, 1211–1229. [Google Scholar] [CrossRef]
- US Department of Energy. Guide to Geothermal Heat Pumps. 2021. Available online: https://www.energy.gov/sites/prod/files/guide_to_geothermal_heat_pumps.pdf (accessed on 13 November 2021).
- Vrachopoulos, M.; Koukou, M.; Karytsas, K. Regular Geothermy. Principles of Design of Geothermal Systems and Applications. Ebook, SEAB, Kallipos. 2015. Available online: https://www.ebooks4greeks.gr/kanonikh-gewthermia-arxes-sxediasmou-gewthermikwn-systhmatwn-kai-efarmoges (accessed on 13 November 2021).
- Zanetti, E.; Aprile, M.; Kum, D.; Scoccia, R.; Motta, M. Energy saving potentials of a photovoltaic assisted heat pump for hybrid building heating system via optimal control. J. Build. Eng. 2020, 27, 100854. [Google Scholar] [CrossRef]
- Chua, K.J.; Chou, S.K.; Yang, W.M. Advances in heat pump systems: A review. Appl. Energy 2010, 87, 3611–3624. [Google Scholar]
- Energy Saver. Heat Pump Systems. Available online: https://www.energy.gov/energysaver/heat-pump-systems (accessed on 13 November 2021).
- Kabisch, N.; Frantzeskaki, N.; Pauleit, S.; Naumann, S.; Davis, M.; Artmann, M.; Haase, D.; Knapp, S.; Korn, H.; Stadler, J.; et al. Nature-based solutions to climate change mitigation and adaptation in urban areas: Perspectives on indicators, knowledge gaps, barriers, and opportunities for action. Ecol. Soc. 2016, 21, 39. [Google Scholar] [CrossRef] [Green Version]
- Kabisch, N.; Korn, H.; Stadler, J.; Bonn, A. Nature-Based Solutions to Climate Change Adaptation in Urban Areas: Linkages between Science, Policy and Practice; Springer Nature: Cham, Switzerland, 2017. [Google Scholar]
- Davies, J.; Janes-Bassett, V.; Yumashev, D. Working with nature: Nature-Based Climate Solutions. N8 Research Partnership. 2020. Available online: https://www.n8research.org.uk/working-with-nature-nature-based-climate-solutions/ (accessed on 13 November 2021).
- Encon. Calculation of CO2 Offsetting by Trees. Available online: https://www.encon.be/en/calculation-co2-offsetting-trees (accessed on 13 November 2021).
- Tree plantation. Tree Carbon Calculator. Available online: https://treeplantation.com/tree-carbon-calculator.html (accessed on 13 November 2021).
- Tang, H.; He, S.; Peng, C. A short progress report on high-efficiency perovskite solar cells. Nanoscale Res. Lett. 2017, 12, 1–8. [Google Scholar] [CrossRef]
- Xu, T.; Chen, L.; Guo, Z.; Ma, T. Strategic improvement of the long-term stability of perovskite materials and perovskite solar cells. Phys. Chem. Chem. Phys. 2016, 18, 27026–27050. [Google Scholar] [CrossRef] [PubMed]
- Daniels, T. Smart growth: A new American approach to regional planning. Plan. Pract. Res. 2001, 16, 271–279. [Google Scholar] [CrossRef]
- Ellis, C. The new urbanism: Critiques and rebuttals. J. Urban Des. 2002, 7, 261–291. [Google Scholar] [CrossRef]
- Dempsey, N. Revisiting the Compact City. Built Environ. 2010, 36, 5–8. [Google Scholar] [CrossRef]
- Rérat, P. Housing, the compact city and sustainable development: Some insights from recent urban trends in Switzerland. Int. J. Hous. Policy 2012, 12, 115–136. [Google Scholar] [CrossRef]
- Kjærås, K. Towards a relational conception of the compact city. Urban Stud. 2021, 58, 1176–1192. [Google Scholar] [CrossRef] [Green Version]
- Uche, J.; Acevedo, L.; Círez, F.; Usón, S.; Martínez-Gracia, A.; Bayod-Rújula, Á.A. Analysis of a domestic trigeneration scheme with hybrid renewable energy sources and desalting techniques. J. Clean. Prod. 2019, 212, 1409–1422. [Google Scholar] [CrossRef] [Green Version]
- Komninos, N.; Panori, A. The creation of city smartness: Architectures of intelligence in smart cities and smart ecosystems. In Smart Cities in the Post-Algorithmic Era: Integrating Technologies, Platforms and Governance; Edward Elgar: Cheltenham, UK, 2019; pp. 101–129. [Google Scholar]
- Komninos, N.; Panori, A.; Kakderi, C. Smart cities beyond algorithmic logic: Digital platforms, user engagement and data science. In Smart Cities in the Post-Algorithmic Era: Integrating Technologies, Platforms and Governance; Edward Elgar: Cheltenham, UK, 2019; pp. 1–15. [Google Scholar]
- Kakderi, C.; Komninos, N.; Panori, A.; Oikonomaki, E. Next City: Learning from Cities During COVID-19 to Tackle Climate Change. Sustainability 2021, 13, 3158. [Google Scholar]
- Komninos, N.; Kakderi, C.; Mora, L.; Panori, A.; Sefertzi, E. Towards High Impact Smart Cities: A Universal Architecture Based on Connected Intelligence Spaces. J. Knowl. Econ. 2021, 1–29. [Google Scholar] [CrossRef]
- Komninos, N.; Kakderi, C.; Collado, A.; Papadaki, I.; Panori, A. Digital Transformation of City Ecosystems: Platforms Shaping Engagement and Externalities across Vertical Markets. J. Urban Technol. 2020, 28, 93–114. [Google Scholar] [CrossRef]
- Legg, S.; Hutter, M. A collection of definitions of intelligence. Front. Artif. Intell. Appl. 2007, 157, 17. [Google Scholar]
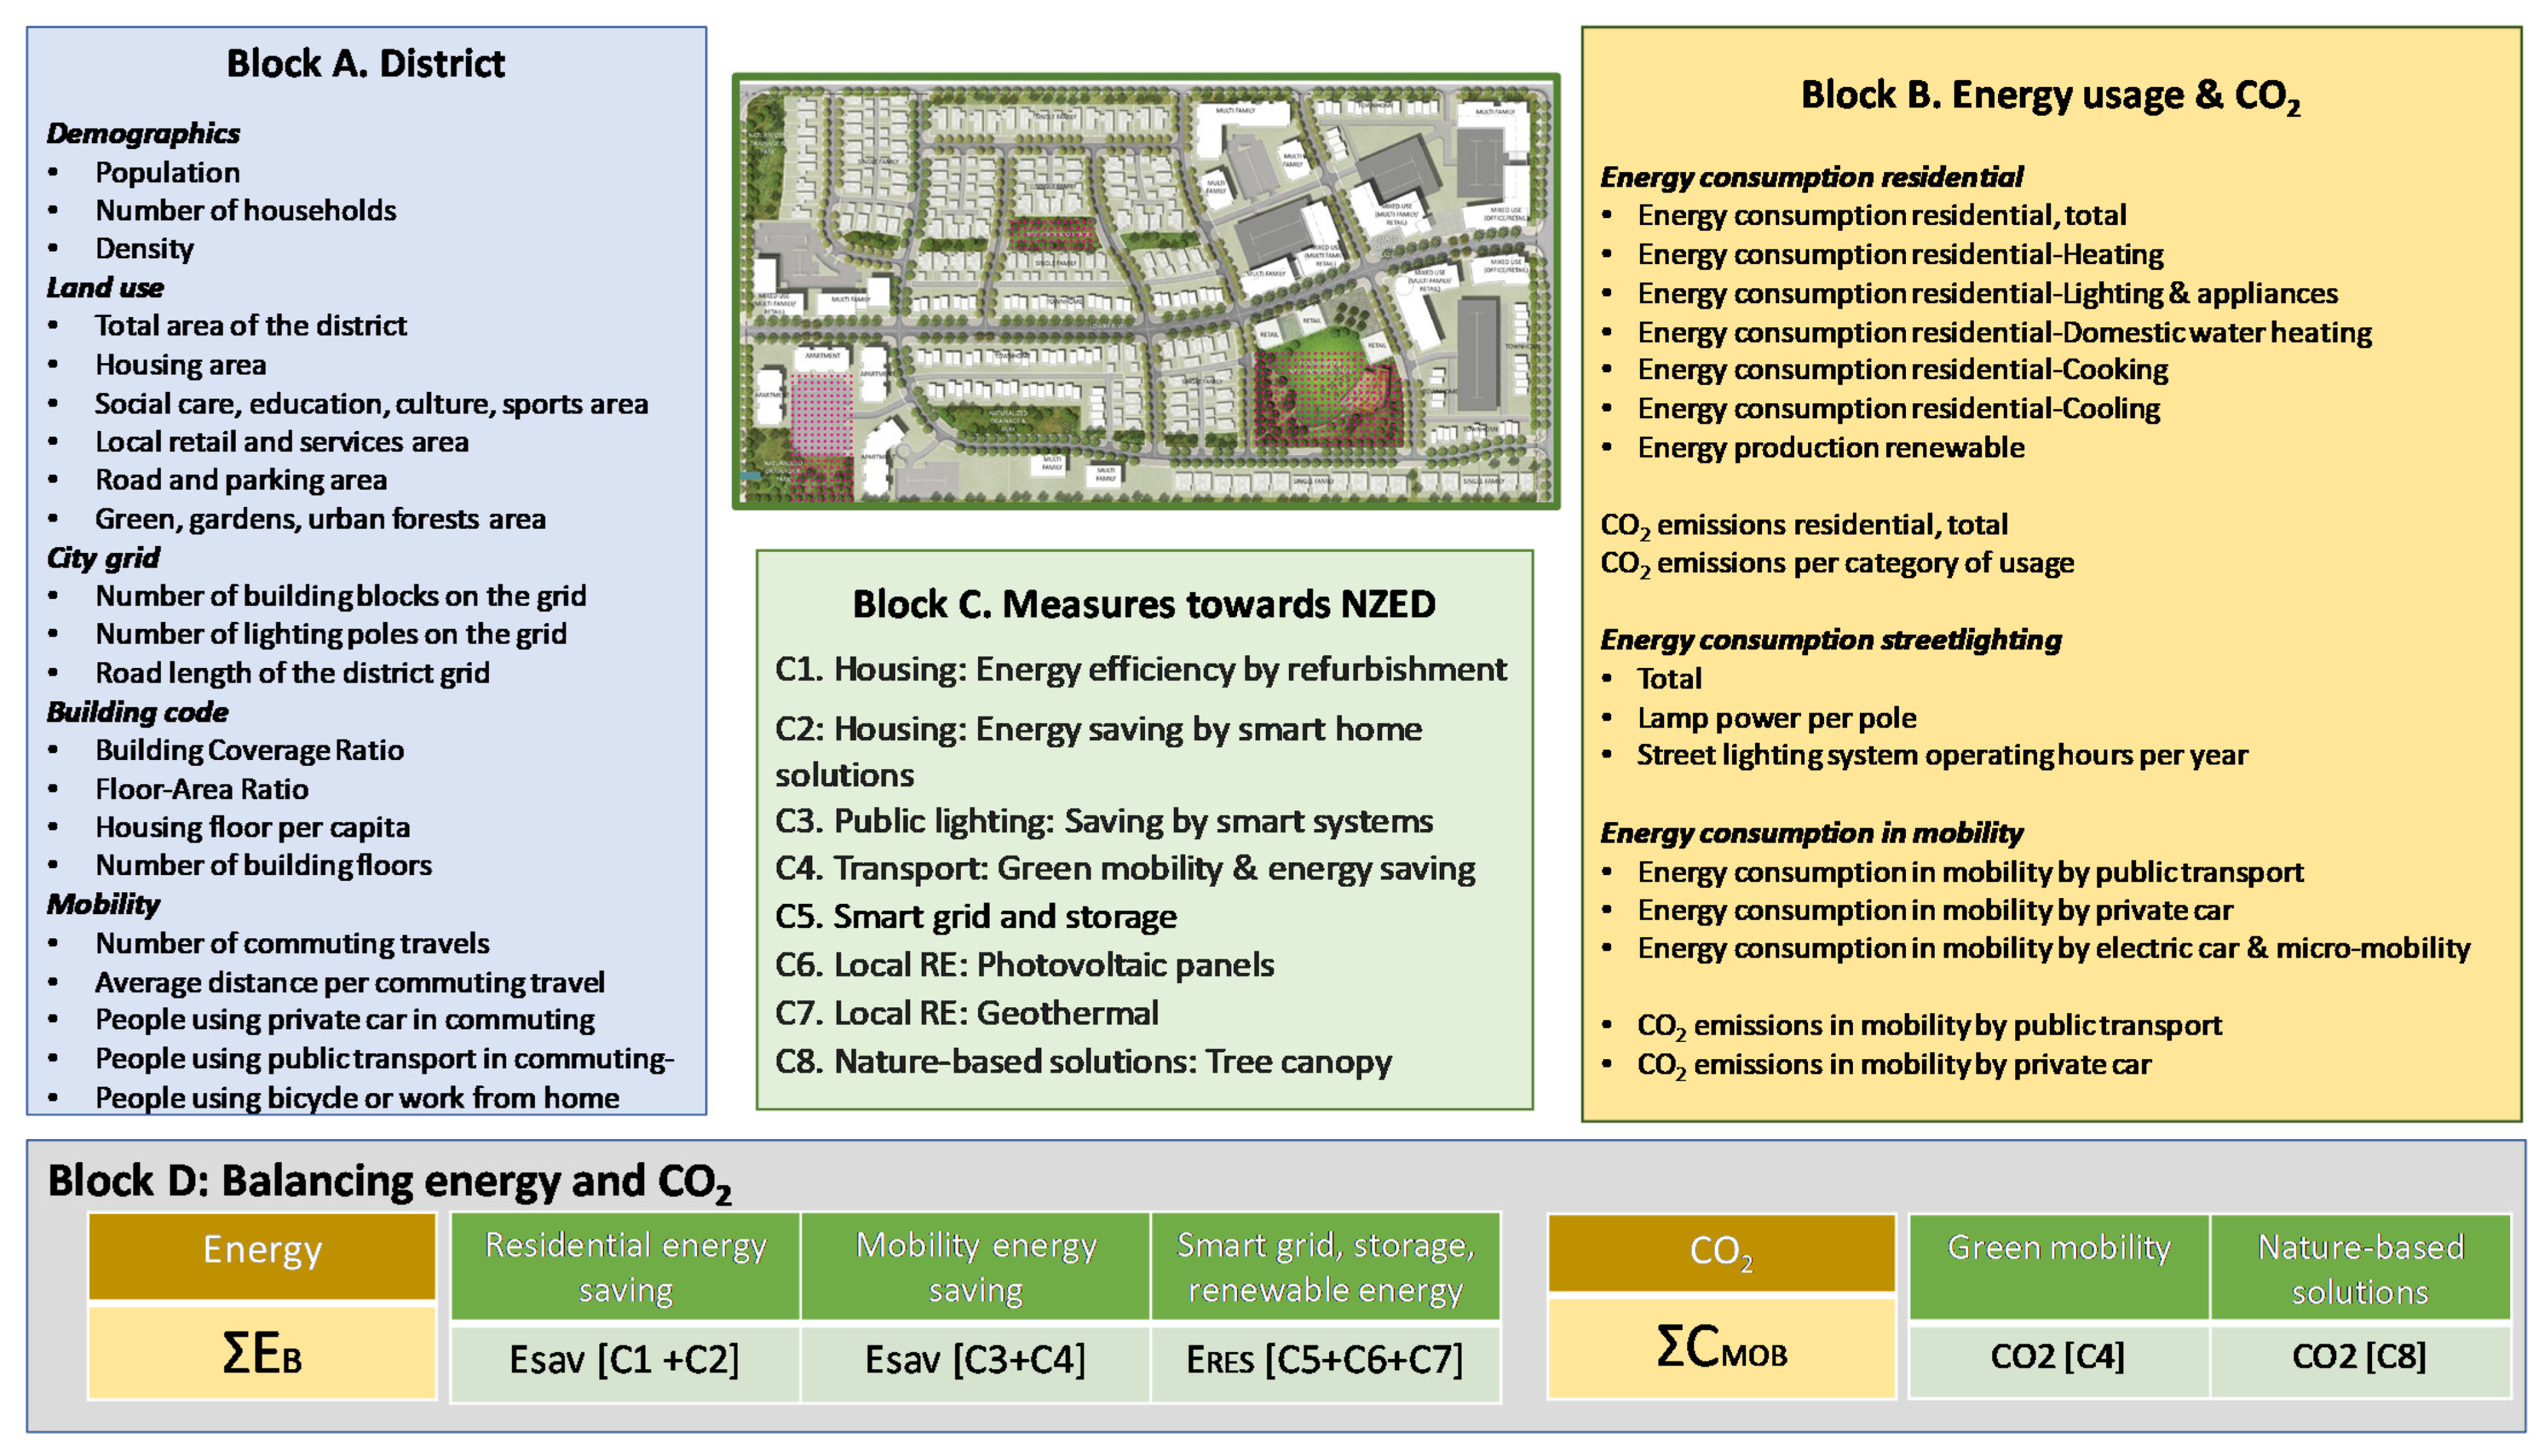

Publisher’s Note: MDPI stays neutral with regard to jurisdictional claims in published maps and institutional affiliations. |
© 2022 by the author. Licensee MDPI, Basel, Switzerland. This article is an open access article distributed under the terms and conditions of the Creative Commons Attribution (CC BY) license (https://creativecommons.org/licenses/by/4.0/).