
Net Zero Energy Districts: Connected Intelligence for Carbon-Neutral Cities


Abstract
:1. Introduction
1.1. Problem Definition
1.2. Research Hypotheses
1.3. Theoretical Framework
1.4. Methodology and Data
2. Net-Zero Energy Districts: Literature Highlights for NZED Model Design
2.1. The Origin of the Concept
2.2. Types of Net-Zero Energy Districts
2.3. NZED Processes towards Carbon Neutrality
3. A Model for Transitioning to NZED
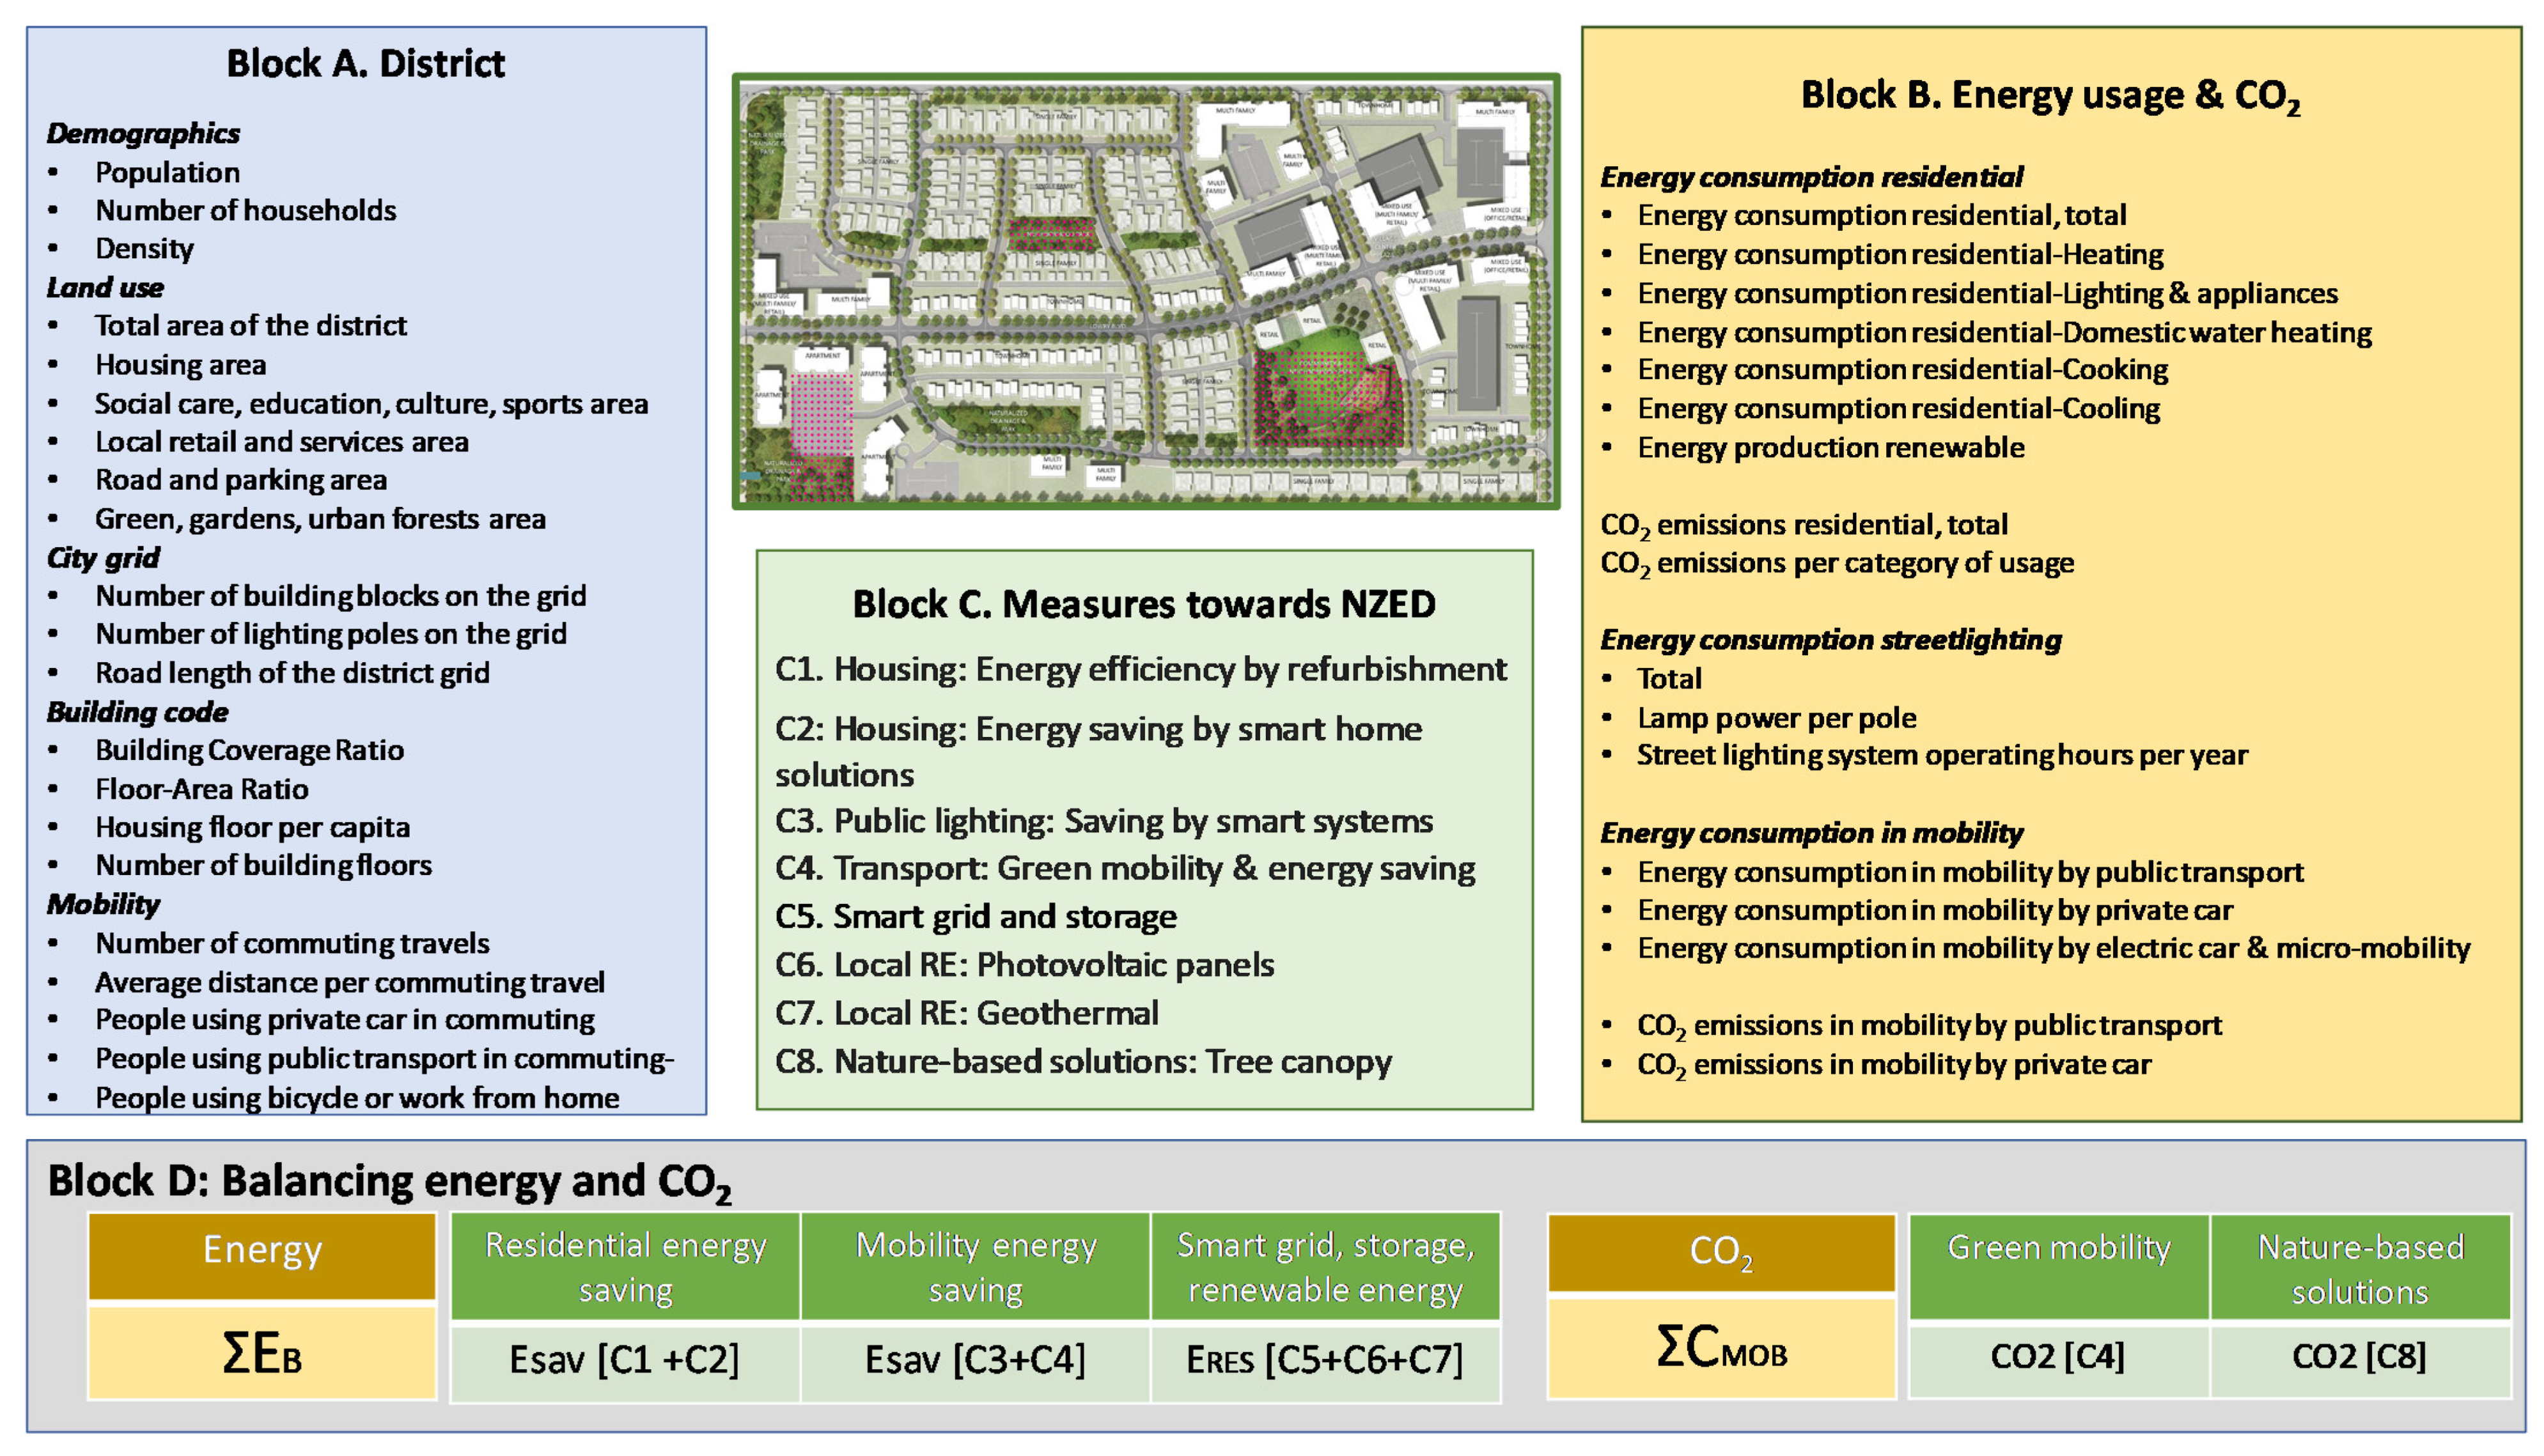
3.1. Model Building Blocks
3.2. Block A: District
3.3. Block B: Energy Usage and CO2
3.4. Block C: Transition Measures to NZED
- C1.
- Housing: Energy saving by building refurbishment
- C2.
- Housing: Energy saving by smart city solutions
- C3.
- Public lighting: Energy saving by smart city lighting
- C4.
- Transport: Green mobility and energy saving
- C5.
- Smart grid and storage
- C6.
- Local RE: Photovoltaic panels
- C7.
- Local RE: Heat pumps and geothermal heat pumps
- C8.
- Nature-based solutions: Tree canopy and CO2 offset
- C1. Housing: energy saving by building refurbishment
- C2. Housing: energy saving by smart city solutions
- C3. Public lighting: energy saving by smart city lighting
- C4. Transport: Green mobility, energy, and CO2 emissions
- All energy and CO2 emissions for mobility are counted in the residential district of travel origin. As the commuting distance increases, energy consumption and emissions are released to neighbouring city districts. This calculation is the worst-case scenario for the district of travel origin but is neutral at the entire city level, as total emissions are aggregated from one district to another.
- Within the next few years, public transport will progressively adopt electromobility, and all energy consumption (EMPT) will be covered by electricity. If only renewable energy is used, CO2 emissions (CMPT) will go down to zero.
- Green mobility is on the rise and will continue to increase. The share of the population (z) that will adopt green mobility is specific to each city and should be introduced in the respective scenario.
- However, a part of the population will continue to use conventional fossil fuel cars that release CO2. These emissions should be absorbed by nature-based solutions.
- C5. Smart grid and energy storage
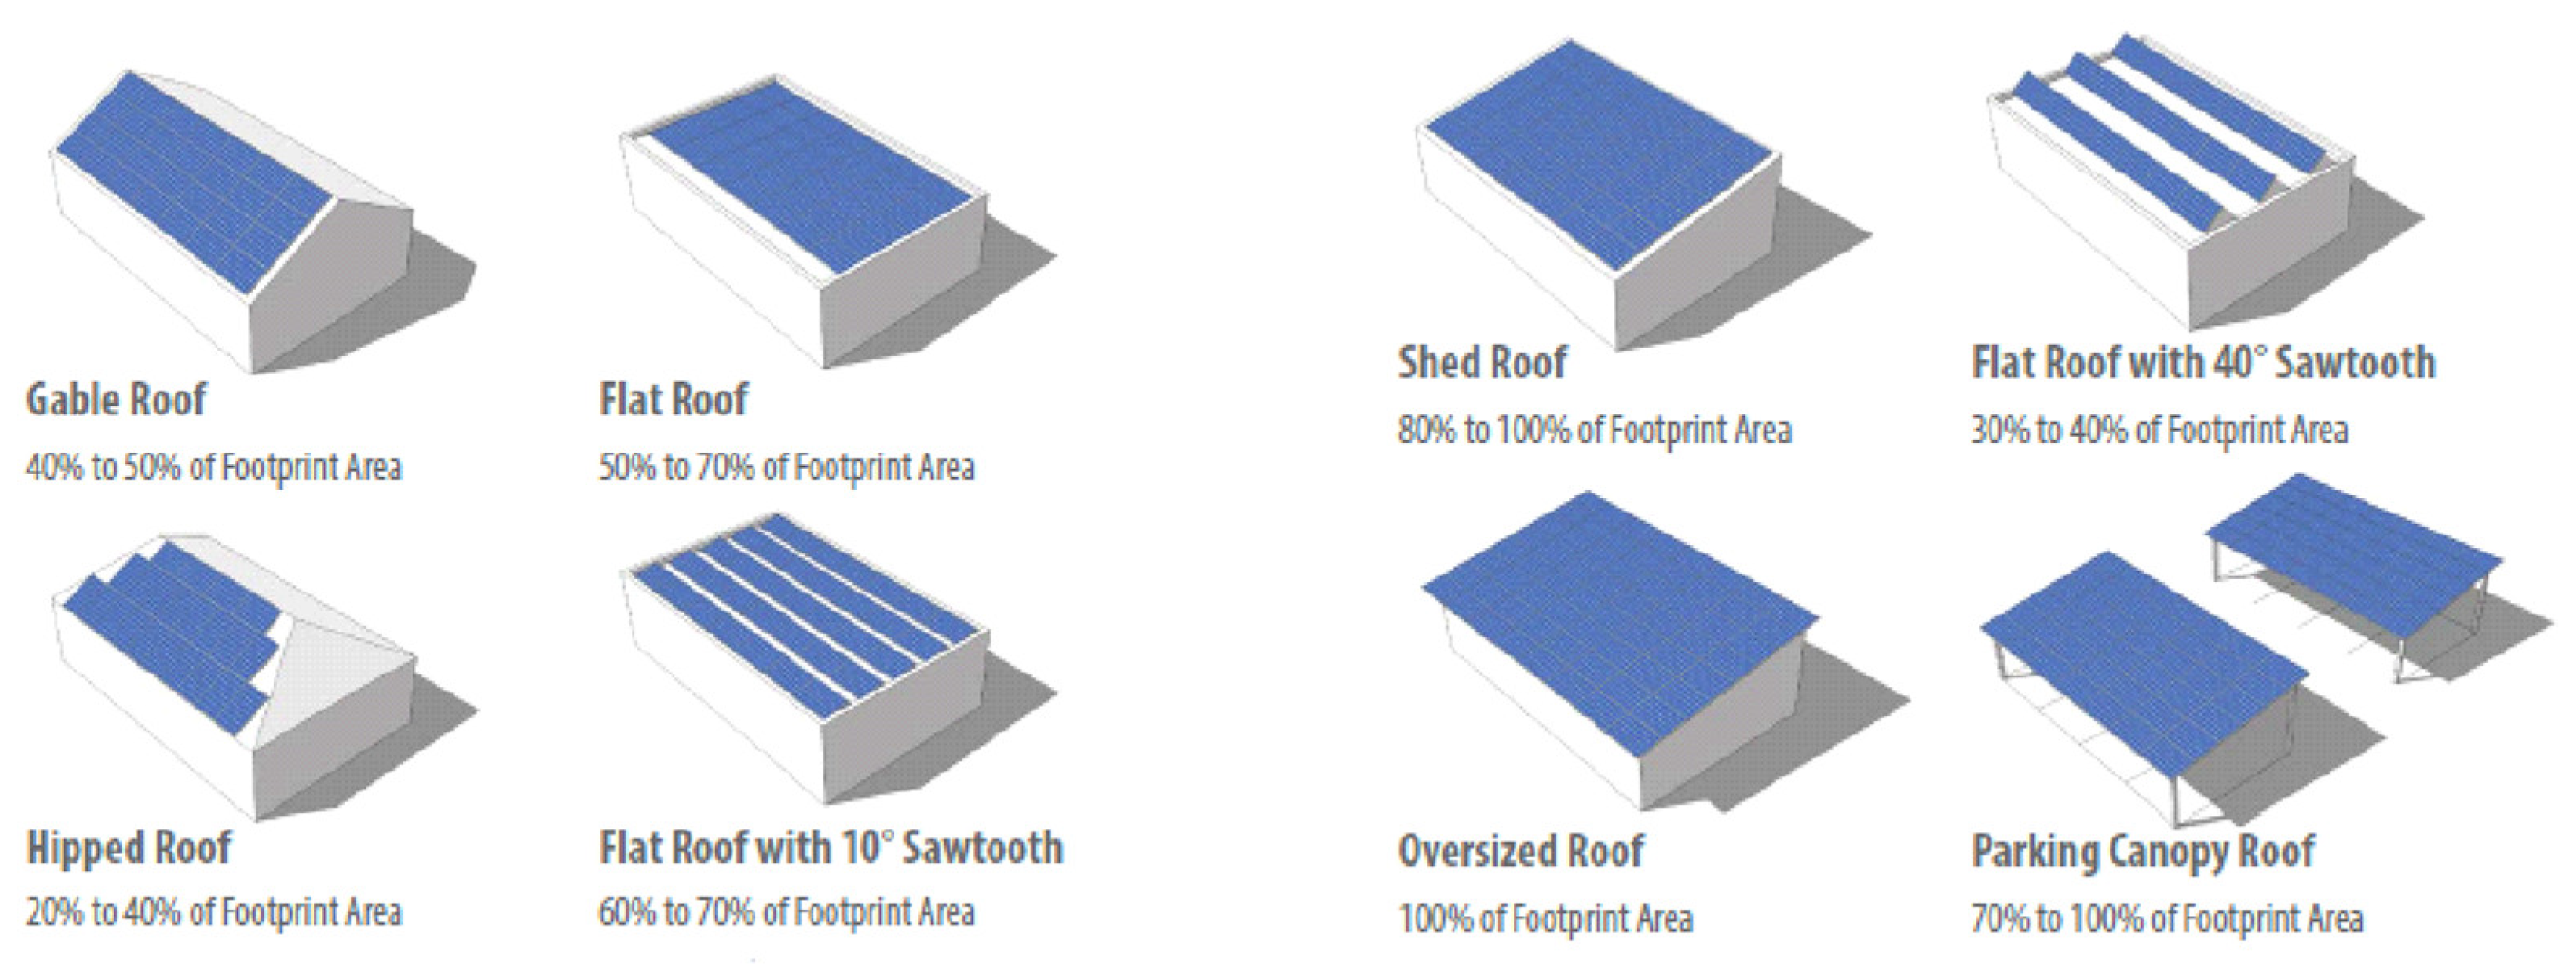
- C6. Local RE: Photovoltaic panels
PVs = 0.70 × [Ah × BRC + 0.1 × Ah + 0.1 × Ar] (sm)
ERE = f (DC system size) (kWh/year)
- C7. Local RE: Heat pumps and geothermal heat pumps
- C8. Nature-based solutions: Tree canopy and CO2 offset
- (a)
- Public gardens, large and small, and city forests can contain 500 trees per hectare. We assume 60% coverage of green spaces by trees.
- (b)
- Roads with trees on both sides at an average distance of 5 m from each other can contain 400 trees per km.
- (c)
- Private gardens and yards may have 25% of their surface covered by trees.
CO2-a = [f (Ag)+f(Rlg)+f(Ah)] × 24 kg CO2/tree (kg)
3.5. Block D: Balancing Energy and CO2 in the NZED
4. Simulation and Results
4.1. Baseline Scenario and Simulations
4.2. Feasibility of NZED—H1
4.3. Critical Thresholds for Carbon-Neutral Disricts—H2
4.4. Rejection of the Compact City Form—H3
5. Conclusions: Connected Intelligence for Carbon-Neutral Cities
Funding
Institutional Review Board Statement
Informed Consent Statement
Data Availability Statement
Conflicts of Interest
References
- Koutra, S.; Becue, V.; Gallas, M.A.; Ioakimidis, C.S. Towards the development of a net-zero energy district evaluation approach: A review of sustainable approaches and assessment tools. Sustain. Cities Soc. 2018, 39, 784–800. [Google Scholar] [CrossRef]
- Cortese, A.; Higgins, C. Getting to Zero Status Update: A Look at the Projects, Policies and Programs Driving Zero Net Energy Performance in Commercial Buildings. USA. 2014. Available online: https://newbuildings.org/sites/default/files/2014_Getting_to_Zero_Update.pdf (accessed on 13 November 2021).
- Saheb, Y.; Shnapp, S.; Paci, D. From Nearly-Zero Energy Buildings to Net-Zero Energy Districts; JRC Technical Reports; Publications Office of the European Union: Luxembourg, 2019. [Google Scholar]
- Amado, M.; Poggi, F. Solar urban planning: A parametric approach. Energy Procedia 2014, 48, 1539–1548. [Google Scholar] [CrossRef] [Green Version]
- Pinna, A.; Massidda, L. A procedure for complete census estimation of rooftop photovoltaic potential in urban areas. Smart Cities 2020, 3, 873–893. [Google Scholar] [CrossRef]
- Singh, R.; Banerjee, R. Estimation of rooftop solar photovoltaic potential of a city. Sol. Energy 2015, 115, 589–602. [Google Scholar] [CrossRef]
- Fath, K.; Stengel, J.; Sprenger, W.; Wilson, H.R.; Schultmann, F.; Kuhn, T.E. A method for predicting the economic potential of (building-integrated) photovoltaics in urban areas based on hourly Radiance simulations. Sol. Energy 2015, 116, 357–370. [Google Scholar] [CrossRef]
- Mithraratne, N. Roof-top wind turbines for microgeneration in urban houses in New Zealand. Energy Build. 2009, 41, 1013–1018. [Google Scholar] [CrossRef]
- Gagliano, A.; Nocera, F.; Patania, F.; Capizzi, A. Assessment of micro-wind turbines performance in the urban environments: An aided methodology through geographical information systems. Int. J. Energy Environ. Eng. 2013, 4, 1–14. [Google Scholar] [CrossRef] [Green Version]
- Reber, T.J.; Beckers, K.F.; Tester, J.W. The transformative potential of geothermal heating in the US energy market: A regional study of New York and Pennsylvania. Energy Policy 2014, 70, 30–44. [Google Scholar] [CrossRef]
- Miglani, S.; Orehounig, K.; Carmeliet, J. A methodology to calculate long-term shallow geothermal energy potential for an urban neighbourhood. Energy Build. 2018, 159, 462–473. [Google Scholar] [CrossRef] [Green Version]
- Eickhout, B.; van den Born, G.J.; Notenboom, J.; Oorschot, M.V.; Ros, J.P.M.; Van Vuuren, D.P.; Westhoek, H.J. Local and Global Consequences of the EU Renewable Directive for Biofuels: Testing the Sustainability Criteria; Netherlands Environmental Assessment Agency (MNP): Bilthoven, The Netherland, 2008.
- Hoang, A.T.; Nguyen, X.P. Integrating renewable sources into energy system for smart city as a sagacious strategy towards clean and sustainable process. J. Clean. Prod. 2021, 305, 127161. [Google Scholar] [CrossRef]
- Maret, I.; Blakeman, H. Can we plan to protect our environment? Spreading urbanisation in the state of Louisiana. WIT Trans. Ecol. Environ. 1970, 84, 451–461. [Google Scholar]
- Meck, S. (Ed.) Growing Smart Legislative Guidebook: Model Statutes for Planning and the Management of Change; Routledge: New York, NY, USA, 2020. [Google Scholar]
- Calthorpe, P. The Next American Metropolis: Ecology, Community, and the American Dream; Princeton Architectural Press: New York, NY, USA, 1993. [Google Scholar]
- Carlisle, N.; Van Geet, O.; Pless, S. No. NREL/TP-7A2-46065; Definition of a ‘Zero Net Energy’ Community. National Renewable Energy Lab. (NREL): Golden, CO, USA, 2009.
- Komninos, N. Smart Cities and Connected Intelligence: Platforms, Ecosystems and Network Effects; Routledge: London, UK, 2020. [Google Scholar]
- Jacobides, M.G.; Cennamo, C.; Gawer, A. Towards a theory of ecosystems. Strateg. Manag. J. 2018, 39, 2255–2276. [Google Scholar] [CrossRef] [Green Version]
- Panagiotidou, M.; Fuller, R.J. Progress in ZEBs—A review of definitions, policies and construction activity. Energy Policy 2013, 62, 196–206. [Google Scholar] [CrossRef]
- Torcellini, P.; Pless, S.; Deru, M.; Crawley, D. No. NREL/CP-550-39833; Zero Energy Buildings: A Critical Look at the Definition. National Renewable Energy Lab. (NREL): Golden, CO, USA, 2006.
- Pacho, A. Retrofitting Residential Districts to Nearly Zero-Energy: A Conceptual Energy Master Planning Framework. Master Thesis submitted for the Erasmus Mundus Joint Master Degree on Smart Cities and Communities (SMACCs). Available online: https://www.researchgate.net/publication/354600950_Retrofitting_Residential_Districts_to_Nearly_Zero-Energy_A_Conceptual_Energy_Master_Planning_Framework (accessed on 13 November 2021).
- Esbensen, T.V.; Korsgaard, V. Dimensioning of the solar heating system in the zero energy house in Denmark. Sol. Energy 1977, 19, 195–199. [Google Scholar] [CrossRef]
- Lin, Y.; Zhong, S.; Yang, W.; Hao, X.; Li, C.Q. Towards zero-energy buildings in China: A systematic literature review. J. Clean. Prod. 2020, 276, 123297. [Google Scholar] [CrossRef]
- Echeverri, L.G. Investing for rapid decarbonisation in cities. Curr. Opin. Environ. Sustain. 2018, 30, 42–51. [Google Scholar] [CrossRef]
- Wells, L.; Rismanchi, B.; Aye, L. A review of net zero energy buildings with reflections on the Australian context. Energy Build. 2018, 158, 616–628. [Google Scholar] [CrossRef]
- Hast, A.; Syri, S.; Welsch, J.; Korkmaz, P.; Balyk, O. Transition to carbon neutral energy systems-implications to district heating in cities. In Proceedings of the 2018 15th International Conference on the European Energy Market (EEM), Lodz, Poland, 27–29 June 2018; pp. 1–5. [Google Scholar]
- Hansen, K.; Mathiesen, B.V.; Skov, I.R. Full energy system transition towards 100% renewable energy in Germany in 2050. Renew. Sustain. Energy Rev. 2019, 102, 1–13. [Google Scholar] [CrossRef]
- NREL. A Guide to Energy Master Planning of High-Performance Districts and Communities. National Renewable Energy Laboratory. 2020. Available online: https://www.nrel.gov/docs/fy21osti/78495.pdf (accessed on 13 November 2021).
- JPI Urban Europe Positive Energy Districts (PED). Available online: https://jpi-urbaneurope.eu/ped/ (accessed on 13 November 2021).
- Abada, I.; Ehrenmann, A.; Lambin, X. On the viability of energy communities. Energy J. 2020, 41, 113–150. [Google Scholar] [CrossRef]
- de Vries, G.W.; Boon, W.P.; Peine, A. User-led innovation in civic energy communities. Environ. Innov. Soc. Transit. 2016, 19, 51–65. [Google Scholar] [CrossRef]
- Gui, E.M.; MacGill, I. Typology of future clean energy communities: An exploratory structure, opportunities, and challenges. Energy Res. Soc. Sci. 2018, 35, 94–107. [Google Scholar] [CrossRef]
- Blasch, J.; van der Grijp, N.M.; Petrovics, D.; Palm, J.; Bocken, N.; Darby, S.; Barnes, J.; Hansen, P.; Kamin, T.; Golob, U.; et al. New clean energy communities in polycentric settings: Four avenues for future research. Energy Res. Soc. Sci. 2021, 82, 102276. [Google Scholar] [CrossRef]
- Caramizaru, A.; Uihlein, A. Energy Communities: An Overview of Energy and Social Innovation; Publications Office of the European Union: Luxembourg, 2020. [Google Scholar]
- Pahkala, T.; Uimonen, H.; Väre, V. Flexible and Customer-Centred Electricity System. Final Report of the Smart Grid Working Group; Ministry of Economic Affairs and Employment: Helsinki, Finland, 2018.
- Ghadami, N.; Gheibi, M.; Kian, Z.; Faramarz, M.G.; Naghedi, R.; Eftekhari, M.; Fathollahi-Fard, A.M.; Dulebenets, M.A.; Tian, G. Implementation of solar energy in smart cities using an integration of artificial neural network, photovoltaic system and classical Delphi methods. Sustain. Cities Soc. 2021, 74, 103149. [Google Scholar] [CrossRef]
- Mohandas, P.; Dhanaraj, J.S.A.; Gao, X.Z. Artificial neural network based smart and energy efficient street lighting system: A case study for residential area in Hosur. Sustain. Cities Soc. 2019, 48, 101499. [Google Scholar] [CrossRef]
- Foley, A.M.; Gallachóir, B.Ó.; Hur, J.; Baldick, R.; McKeogh, E.J. A strategic review of electricity systems models. Energy 2010, 35, 4522–4530. [Google Scholar] [CrossRef]
- de Santoli, L.; Mancini, F.; Garcia, D.A. A GIS-based model to assess electric energy consumptions and usable renewable energy potential in Lazio region at municipality scale. Sustain. Cities Soc. 2019, 46, 101413. [Google Scholar] [CrossRef] [Green Version]
- Eurostat. Energy Consumption in Households. 2019. Available online: https://ec.europa.eu/eurostat/statistics-explained/index.php?title=Energy_consumption_in_households (accessed on 25 August 2021).
- Eurostat. Passenger Mobility Statistics. 2021. Available online: https://ec.europa.eu/eurostat/statistics-explained/index.php?title=File:Travel_distance_per_person_per_day_by_main_travel_mode_for_urban_mobility_on_all_days_(%25)_Feb_2021.png (accessed on 25 August 2021).
- Burrows, M.; Burd, C.; McKenzie, B. Commuting by Public Transportation in the United States: 2019. American Community Survey Reports. 2021. Available online: https://www.census.gov/content/dam/Census/library/publications/2021/acs/acs-48.pdf (accessed on 25 August 2021).
- Carratt, A.; Kokogiannakis, G.; Daly, D. A critical review of methods for the performance evaluation of passive thermal retrofits in residential buildings. J. Clean. Prod. 2020, 263, 121408. [Google Scholar] [CrossRef]
- Tuominen, P.; Klobut, K.; Tolman, A.; Adjei, A.; de Best-Waldhober, M. Energy savings potential in buildings and overcoming market barriers in member states of the European Union. Energy Build. 2012, 51, 48–55. [Google Scholar] [CrossRef]
- Amsterdam Smart City. Smart Stories. 2011. Available online: http://issuu.com/amsterdamsmartcity/docs/smart_stories (accessed on 25 August 2021).
- Panna, R.; Thesrumluk, R.; Chantrapornchai, C. Development of energy saving smart home prototype. Int. J. Smart Home 2013, 7, 47–66. [Google Scholar]
- Subramani, C.; Surya, S.; Gowtham, J.; Chari, R.; Srinivasan, S.; Siddharth, J.P.; Shrimali, H. Energy efficiency and pay-back calculation on street lighting systems. AIP Conf. Proc. 2019, 2112, 020082. [Google Scholar]
- Dutt, G.S. Illumination and sustainable development. Part I: Technology and economics. Energy Sustain. Dev. 1994, 1, 23–35. [Google Scholar] [CrossRef]
- Escolar, S.; Carretero, J.; Marinescu, M.C.; Chessa, S. Estimating energy savings in smart street lighting by using an adaptive control system. Int. J. Distrib. Sens. Netw. 2014, 10, 971587. [Google Scholar] [CrossRef]
- Nefedov, E.; Maksimainen, M.; Sierla, S.; Flikkema, P.; Yang, C.W.; Kosonen, I.; Luttinen, T. Energy efficient traffic-based street lighting automation. In Proceedings of the 2014 IEEE 23rd International Symposium on Industrial Electronics (ISIE), Istanbul, Turkey, 1–4 June 2014; pp. 1718–1723. [Google Scholar]
- Moreno, C.; Allam, Z.; Chabaud, D.; Gall, C.; Pratlong, F. Introducing the “15-Minute City”: Sustainability, resilience and place identity in future post-pandemic cities. Smart Cities 2021, 4, 93–111. [Google Scholar] [CrossRef]
- Pozoukidou, G.; Chatziyiannaki, Z. 15-Minute City: Decomposing the New Urban Planning Eutopia. Sustainability 2021, 13, 928. [Google Scholar] [CrossRef]
- Lee, Y.; Paredes, J.R.; Lee, S.H. Smart Grid and Its Application in Sustainable Cities. Inter-American Development Bank. 2012. Available online: https://www.uraia.org/documents/32/SMARTdoc_2bb8X1O.pdf (accessed on 13 November 2021).
- European Commission, Directorate-General for Research and Innovation, Virtual Power Plant/Integrated Energy, Publications Office of the European Union, Luxembourg: 2021. Available online: https://op.europa.eu/en/publication-detail/-/publication/8aa0ee83-aedd-11eb-9767-01aa75ed71a1/language-en (accessed on 12 December 2021).
- Atasoy, T.; Akınç, H.E.; Erçin, Ö. An analysis on smart grid applications and grid integration of renewable energy systems in smart cities. In Proceedings of the 2015 International Conference on Renewable Energy Research and Applications (ICRERA), Palermo, Italy, 22–25 November 2015; pp. 547–550. [Google Scholar]
- Farmanbar, M.; Parham, K.; Arild, Ø.; Rong, C. A widespread review of smart grids towards smart cities. Energies 2019, 12, 4484. [Google Scholar] [CrossRef] [Green Version]
- Polly, B.; Pless, S.; Houssainy, S.; Torcellini, P.; Livingood, W.; Zaleski, S.; Jungclaus, M.; Hootman, T.; Craig, M. No. NREL/TP-5500-78495; A Guide to Energy Master Planning of High-Performance Districts and Communities. National Renewable Energy Lab. (NREL): Golden, CO, USA, 2020.
- David, F.; Madani, H. On heat pumps in smart grids: A review. Renew. Sustain. Energy Rev. 2017, 70, 342–375. [Google Scholar]
- Hepbasli, A.; Kalinci, Y. A review of heat pump water heating systems. Renew. Sustain. Energy Rev. 2009, 13, 1211–1229. [Google Scholar] [CrossRef]
- US Department of Energy. Guide to Geothermal Heat Pumps. 2021. Available online: https://www.energy.gov/sites/prod/files/guide_to_geothermal_heat_pumps.pdf (accessed on 13 November 2021).
- Vrachopoulos, M.; Koukou, M.; Karytsas, K. Regular Geothermy. Principles of Design of Geothermal Systems and Applications. Ebook, SEAB, Kallipos. 2015. Available online: https://www.ebooks4greeks.gr/kanonikh-gewthermia-arxes-sxediasmou-gewthermikwn-systhmatwn-kai-efarmoges (accessed on 13 November 2021).
- Zanetti, E.; Aprile, M.; Kum, D.; Scoccia, R.; Motta, M. Energy saving potentials of a photovoltaic assisted heat pump for hybrid building heating system via optimal control. J. Build. Eng. 2020, 27, 100854. [Google Scholar] [CrossRef]
- Chua, K.J.; Chou, S.K.; Yang, W.M. Advances in heat pump systems: A review. Appl. Energy 2010, 87, 3611–3624. [Google Scholar]
- Energy Saver. Heat Pump Systems. Available online: https://www.energy.gov/energysaver/heat-pump-systems (accessed on 13 November 2021).
- Kabisch, N.; Frantzeskaki, N.; Pauleit, S.; Naumann, S.; Davis, M.; Artmann, M.; Haase, D.; Knapp, S.; Korn, H.; Stadler, J.; et al. Nature-based solutions to climate change mitigation and adaptation in urban areas: Perspectives on indicators, knowledge gaps, barriers, and opportunities for action. Ecol. Soc. 2016, 21, 39. [Google Scholar] [CrossRef] [Green Version]
- Kabisch, N.; Korn, H.; Stadler, J.; Bonn, A. Nature-Based Solutions to Climate Change Adaptation in Urban Areas: Linkages between Science, Policy and Practice; Springer Nature: Cham, Switzerland, 2017. [Google Scholar]
- Davies, J.; Janes-Bassett, V.; Yumashev, D. Working with nature: Nature-Based Climate Solutions. N8 Research Partnership. 2020. Available online: https://www.n8research.org.uk/working-with-nature-nature-based-climate-solutions/ (accessed on 13 November 2021).
- Encon. Calculation of CO2 Offsetting by Trees. Available online: https://www.encon.be/en/calculation-co2-offsetting-trees (accessed on 13 November 2021).
- Tree plantation. Tree Carbon Calculator. Available online: https://treeplantation.com/tree-carbon-calculator.html (accessed on 13 November 2021).
- Tang, H.; He, S.; Peng, C. A short progress report on high-efficiency perovskite solar cells. Nanoscale Res. Lett. 2017, 12, 1–8. [Google Scholar] [CrossRef]
- Xu, T.; Chen, L.; Guo, Z.; Ma, T. Strategic improvement of the long-term stability of perovskite materials and perovskite solar cells. Phys. Chem. Chem. Phys. 2016, 18, 27026–27050. [Google Scholar] [CrossRef] [PubMed]
- Daniels, T. Smart growth: A new American approach to regional planning. Plan. Pract. Res. 2001, 16, 271–279. [Google Scholar] [CrossRef]
- Ellis, C. The new urbanism: Critiques and rebuttals. J. Urban Des. 2002, 7, 261–291. [Google Scholar] [CrossRef]
- Dempsey, N. Revisiting the Compact City. Built Environ. 2010, 36, 5–8. [Google Scholar] [CrossRef]
- Rérat, P. Housing, the compact city and sustainable development: Some insights from recent urban trends in Switzerland. Int. J. Hous. Policy 2012, 12, 115–136. [Google Scholar] [CrossRef]
- Kjærås, K. Towards a relational conception of the compact city. Urban Stud. 2021, 58, 1176–1192. [Google Scholar] [CrossRef] [Green Version]
- Uche, J.; Acevedo, L.; Círez, F.; Usón, S.; Martínez-Gracia, A.; Bayod-Rújula, Á.A. Analysis of a domestic trigeneration scheme with hybrid renewable energy sources and desalting techniques. J. Clean. Prod. 2019, 212, 1409–1422. [Google Scholar] [CrossRef] [Green Version]
- Komninos, N.; Panori, A. The creation of city smartness: Architectures of intelligence in smart cities and smart ecosystems. In Smart Cities in the Post-Algorithmic Era: Integrating Technologies, Platforms and Governance; Edward Elgar: Cheltenham, UK, 2019; pp. 101–129. [Google Scholar]
- Komninos, N.; Panori, A.; Kakderi, C. Smart cities beyond algorithmic logic: Digital platforms, user engagement and data science. In Smart Cities in the Post-Algorithmic Era: Integrating Technologies, Platforms and Governance; Edward Elgar: Cheltenham, UK, 2019; pp. 1–15. [Google Scholar]
- Kakderi, C.; Komninos, N.; Panori, A.; Oikonomaki, E. Next City: Learning from Cities During COVID-19 to Tackle Climate Change. Sustainability 2021, 13, 3158. [Google Scholar]
- Komninos, N.; Kakderi, C.; Mora, L.; Panori, A.; Sefertzi, E. Towards High Impact Smart Cities: A Universal Architecture Based on Connected Intelligence Spaces. J. Knowl. Econ. 2021, 1–29. [Google Scholar] [CrossRef]
- Komninos, N.; Kakderi, C.; Collado, A.; Papadaki, I.; Panori, A. Digital Transformation of City Ecosystems: Platforms Shaping Engagement and Externalities across Vertical Markets. J. Urban Technol. 2020, 28, 93–114. [Google Scholar] [CrossRef]
- Legg, S.; Hutter, M. A collection of definitions of intelligence. Front. Artif. Intell. Appl. 2007, 157, 17. [Google Scholar]


| Human Intelligence | Collective Intelligence | Machine Intelligence | |
|---|---|---|---|
| Generic |
|
|
|
| NZED specific |
|
|
|
| Code | Name | Measurement Unit |
|---|---|---|
| Demographics | ||
| P | Population | Physical person |
| AP | Active population as % of the district population | Working person |
| H | Number of households | Household |
| D | Density | Persons/Hectare |
| Land use | ||
| At | Total area of the district | Hectare |
| Ah | Housing area | Hectare |
| As | Social care, education, culture, sports area | Hectare |
| Ar | Local retail and services area | Hectare |
| Ar | Road and parking area | Hectare |
| Ag | Green space, gardens, urban forests area | Hectare |
| City grid and public lighting | ||
| Bb | Number of building blocks on the grid | Building block |
| Pl | Number of lighting poles on the grid | Pole |
| Rlg | Road length of the district grid | Kilometre |
| Building code | ||
| BRC | Building Coverage Ratio | Percentage |
| FAR | Floor-Area Ratio | Number |
| Hfpc | Housing floor per capita | Square meter |
| Bnf | Number of building floors | Floor |
| Mobility | ||
| Tpc | Number of commuting travels per worker per year | Travel |
| Dtpc | Average distance per commuting travel | Kilometre |
| Pmpc | People using a private car in commuting, % of total commuting | Percentage |
| Pmpt | People using public transport in commuting, % of total commuting | Percentage |
| Pmgr | People using a bicycle, walk or work from home, % of total commuting | Percentage |
| Code | Name | Measurement Unit |
|---|---|---|
| ERPC | Energy consumption residential per capita | kWh/year |
| ERT | Energy consumption residential-Total | kWh/year |
| EH | Energy consumption residential-Heating | Per cent of total |
| ELA | Energy consumption residential-Lighting and appliances | Per cent of total |
| EDWH | Energy consumption residential-Domestic water heating | Per cent of total |
| EC | Energy consumption residential-Cooking | Per cent of total |
| ECL | Energy consumption residential-Cooling | Per cent of total |
| ERE | Energy production renewable | kWh/year |
| CRT | CO2 emissions residential-Total | Tons/year |
| CH | CO2 emissions residential-Heating | Tons/year |
| CLA | CO2 emissions residential-Lighting and appliances | Tons/year |
| CDWH | CO2 emissions residential-Domestic water heating | Tons/year |
| CC | CO2 emissions residential-Cooking | Tons/year |
| CCL | CO2 emissions residential -Cooling | Tons/year |
| ESL | Energy consumption streetlighting-Total | kWh/year |
| LP | Lamp power per pole | kWh |
| HSL | Street lighting system operating hours per year | Hours |
| EMT | Energy consumption in mobility-Total | kWh/year |
| EMPT | Energy consumption in mobility by public transport | kWh/year |
| EMPC | Energy consumption in mobility by private car | kWh/year |
| EMEV | Energy consumption in mobility by electric car and micro-mobility | kWh/year |
| CMPT | CO2 emissions in mobility by public transport | Tons/year |
| CMPC | CO2 emissions in mobility by private car | Tons/year |
| Energy Usage | Percentage of Total Energy Consumption |
|---|---|
| Space heating | 63.6% |
| Lighting and appliances | 14.1% |
| Domestic water heating | 14.8% |
| Cooking | 6.1% |
| Space cooling | 0.4% |
| Other | 1.0% |
| Daily Commuting by | Initial | Impact on | NZED State | Impact on | Measurement Unit |
|---|---|---|---|---|---|
| Public transport | 15% | kWh | 15% | kWh | 0.1 kWh/km |
| Private car | 70% | CO2 | 15% | CO2 | 190 gr/km |
| Private car—electric vehicle | 0% | kWh | 50% | kWh | 0.2 kWh/km |
| Micro-mobility—electric | 5% | kWh | 10% | kWh | 0.02 kWh/km |
| Walking, cycling, non-commuting | 10% | - | 10% | - | - |
| Country | Type of Housing | Heat before (kWh/m2) | Heat after (kWh/m2) | Saving % |
|---|---|---|---|---|
| Bulgaria | Houses | 143 | 25 | 82.52 |
| Apartments | 96 | 56 | 41.67 | |
| Czech Republic | Houses | 190 | 68 | 64.21 |
| Apartments | 194 | 134 | 30.93 | |
| Denmark | Houses | 139 | 80 | 42.45 |
| Apartments | 135 | 61 | 54.81 | |
| Germany | Houses | 254 | 137 | 46.06 |
| Apartments | 185 | 74 | 60.00 | |
| Finland | Houses | 154 | 118 | 23.38 |
| Apartments | 154 | 141 | 8.44 | |
| Latvia | Houses | 273 | 202 | 26.01 |
| Apartments | 217 | 145 | 33.18 | |
| The Netherlands | Houses | 125 | 54 | 56.80 |
| Apartments | 103 | 52 | 49.51 | |
| Portugal | Houses | 114 | 45 | 60.53 |
| Apartments | 117 | 46 | 60.68 | |
| U.K. | Houses | 216 | 119 | 44.91 |
| Apartments | 172 | 53 | 69.19 |
| Energy | Athens-100 | Frankfurt-100 | Helsinki-100 | |||
|---|---|---|---|---|---|---|
| Energy consumption | ||||||
| Residential | 39,954,960 | 57,469,445 | 72,480,170 | |||
| Public lighting | 776,841 | 732,529 | 710,052 | |||
| Mobility | 1,200,000 | 41,931,801 | 1,200,000 | 59,401,974 | 1,200,000 | 74,390,222 |
| Energy saving | ||||||
| C1: Building refurbishment | 5,082,271 | 7,310,113 | 9,219,478 | |||
| C2: Smart home solutions | 563,365 | 810,319 | 1,021,970 | |||
| C3: Smart city lighting | 388,420 | 366,264 | 355,026 | |||
| C7: Heat pumps | 10,963,641 | 16,997,697 | 15,769,616 | 24,256,313 | 19,888,559 | 30,485,033 |
| Renewable energy | ||||||
| C6: PV panels | 31,118,964 | 20,115,406 | 19,342,450 | |||
| Energy balance NZED (kWh) | +6,184,861 | −15,030,255 | −24,562,739 | |||
| CO2 | ||||||
| C4: CO2 emissions | 285,000 | 285,000 | 285,000 | |||
| C8: CO2 capture | 298,200 | 298,200 | 298,200 | |||
| CO2 balance NZED (kg) | +13,200 | +13,200 | +13,200 | |||
| Energy usage after saving | 24,934,103 | 35,145,661 | 43,905,189 | |||
| RE surplus or gap | 24.80% | −42.77% | −55.94% | |||
| Energy saving/usage | 40.54% | 40.83% | 40.98% | |||
| RE/energy usage | 124.80% | 57.23% | 44.06% | |||
| Energy | Athens-120 | Frankfurt-56 | Helsinki-43 | |||
|---|---|---|---|---|---|---|
| Energy consumption | ||||||
| Residential | 47,945,952 | 32,182,889 | 31,166,473 | |||
| Public lighting | 776,841 | 732,529 | 710,052 | |||
| Mobility | 1,440,000 | 50,162,793 | 672,000 | 33,587,418 | 516,000 | 32,392,525 |
| Energy saving | ||||||
| C1: Building refurbishment | 6,098,725 | 4,093,664 | 3,964,375 | |||
| C2: Smart home solutions | 676,038 | 453,779 | 439,447 | |||
| C3: Smart city lighting | 388,420 | 366,264 | 355,026 | |||
| C7: Heat pumps | 13,156,369 | 20,319,553 | 8,830,985 | 13,744,691 | 8,552,080 | 13,310,929 |
| Renewable energy | ||||||
| C6: PV panels | 31,118,964 | 20,115,406 | 19,342,450 | |||
| Energy balance NZED (kWh) | +1,275,724 | +272,679 | +260,854 | |||
| CO2 | ||||||
| C4: CO2 emissions | 342,000 | 159,600 | 122,550 | |||
| C8: CO2 capture | 298,200 | 298,200 | 298,200 | |||
| CO2 balance NZED (kg) | −43,800 | +138,600 | +175,650 | |||
Publisher’s Note: MDPI stays neutral with regard to jurisdictional claims in published maps and institutional affiliations. |
© 2022 by the author. Licensee MDPI, Basel, Switzerland. This article is an open access article distributed under the terms and conditions of the Creative Commons Attribution (CC BY) license (https://creativecommons.org/licenses/by/4.0/).
Share and Cite
Komninos, N. Net Zero Energy Districts: Connected Intelligence for Carbon-Neutral Cities. Land 2022, 11, 210. https://doi.org/10.3390/land11020210
Komninos N. Net Zero Energy Districts: Connected Intelligence for Carbon-Neutral Cities. Land. 2022; 11(2):210. https://doi.org/10.3390/land11020210
Chicago/Turabian StyleKomninos, Nicos. 2022. "Net Zero Energy Districts: Connected Intelligence for Carbon-Neutral Cities" Land 11, no. 2: 210. https://doi.org/10.3390/land11020210
APA StyleKomninos, N. (2022). Net Zero Energy Districts: Connected Intelligence for Carbon-Neutral Cities. Land, 11(2), 210. https://doi.org/10.3390/land11020210