Abstract
Different fertilizers have different effects on soil chemistry and crop yields. In this paper, we analyzed how long-term and regular application of mineral fertilizers, pig slurry and their combinations (15 fertilizer treatments totally) affect soil pH, nutrient content and yield of field pea at two sites with different soil (cambisol and luvisol) and climatic conditions. The long-term trials evaluated in this paper were established in 1972 at Pernolec and Kostelec, Czech Republic. Results of the soil analyses (evaluated period) are from the years 2015–2020, covering two sequences of crop rotation (winter wheat–spring barley–field pea). The fertilizer treatments significantly affected the soil reaction; application of mineral fertilizers and their combinations resulted in the lowest pH values. On the other hand, the same treatments provided the highest yields and left the highest pool of nutrients in the soil. Pig slurry can provide the same yields of field pea as mineral NPK fertilizers, without a negative effect on soil reaction. Analyzing the mineral fertilizers only, a reasonable dose of N (according to the linear-plateau model) can range from 73 and 97 kg ha−1 N in Pernolec, according to the weather conditions.
1. Introduction
The nutrient content of the soil is one of the parameters determining its fertility and quality. It is a parameter influenced by a wide range of natural, anthropogenic and interrelated factors such as soil type [1], farming method (conventional, organic farming) [2], crop rotations and fertilization [3,4,5], microbial activity in the soil [6], or soil organic matter content [7]. The application of fertilizers represents the main way of supplying nutrients to the soil; for the crops grown, fertilizers thus directly affect soil chemical [8,9,10,11], physiological [12,13] and biological [14,15] properties and crop growth.
Fertilizers are divided into three categories, namely mineral and organic fertilizers and organic manures. They differ in origin, composition and nutrient content, speed of nutrient release and availability to farmers. Mineral fertilizers are fast-acting and have a precisely defined composition, which makes it easier to adjust the dose of nutrients delivered. On the other hand, they are costly and, if used unwisely, can pose a significant threat to the environment [16,17] or arable products [18]. In particular, the effect of nitrogen mineral fertilizers on soil pH poses a risk of acidification [19,20,21,22] and a risk to elements’ availability [23]. Manure fertilizers have a low nutrient content and must be applied in large doses (the classic dose of cow farmyard manure is 40 t ha−1 in Czech Republic). The nutrients contained in manure are released gradually, depending on the origin [24] and C:N ratio. Manures with a low C:N ratio (slurries) release nutrients to a greater extent already in the first year of application; on the other hand, manures with a high C:N ratio (farmyard manure) release nutrients over a longer period in smaller doses [25]. According to [26], approximately 11% of the organic N is mineralized during the first year from the application of composted manure and around 20% for non-composted manure. In the case of slurries, approximately 40% of the organic N is mineralized at the same time [25]. The application of organic manures is usually associated with positive effects on soil properties [7,8,27,28,29], but one has to be careful about the doses and dry matter content. In the case of slurry, the dry matter and nutrient content is very important information in order to correctly adjust the applied dose. Ignorance of this information can easily lead to overdosing, which can significantly damage the crops grown or adversely affect the environment via leaching and volatilization of nitrogen and salinization [30,31,32,33]. In addition to directly supplied nutrients, the unifying factor for the positive effects of organic manures and the nutrient content, pH value, physical and biological properties of soils, is organic matter. Soil organic carbon and nutrient content are usually higher after application of solid organic manures [34,35,36], while the benefit of liquid organic manures, such as slurries, is mainly to increase the nutrient content and the effect on soil organic carbon can be neutral (no changes) [37] or positive [38,39] as the liquid manures contain a lower amount of organic carbon than the solid. As in the case of mineral fertilizers, organic manures can also pose a threat to the environment if not applied judiciously [40,41] or because of the presence of pharmaceuticals [42].
One of the major problems of agriculture in Czech Republic is the disruption between crop and livestock production, reduction of cultivated crops in crop rotations and the fact that most of the arable land is rented [43]. Disruption of the balance between crop and livestock production is manifested by a lack of organic manure and reduced input of organic carbon into the soil. Together with the significant dependence of crop production on mineral nitrogen (and the low level of phosphate and potassium fertilizers applied), we then experience soil erosion (lack of organic carbon), lower content of macronutrients (doses of P and K mineral fertilizers) and soil acidification (due to nitrogen fertilizers application) [44,45]. One way to reduce the negative impact of mineral nitrogen fertilizers on the soil while ensuring good soil nutrient supply and crop yields is to apply mineral and manure fertilizers together. Multiple scientific papers have indicated that joint application of mineral fertilizers and manure has a positive effect on both crop yields and reduction of negative impacts of mineral fertilizers on the soil properties [46,47,48,49,50]. Another problem of Czech agriculture is the reduction of crops in crop rotation. Over the years, there has been a change in the proportion of crops grown, mainly in favor of winter rape. Soil-improving crops such as root crops, forage crops and legumes are grown to a lesser extent than in the past [51]. While root crops (potatoes and sugar beet) are considered as soil-improving plants mainly due to the manure applied to them, legumes have a unique ability to fix airborne nitrogen in the soil, due to their symbiosis with rhizobacteria. Field pea (FP) is the most cultivated legume in Czech Republic (79% of all legumes), yet its representation in the crop rotations of Czech Republic is low (1.2%) (average values from 2015 to 2019 [52]). From the point of view of human nutrition and soil care, it is a valuable crop. Thanks to their symbiosis with rhizobia bacteria, legumes and FP cover a large part of their nitrogen needs from the symbiosis (depending on the type of legumes, they cover their nitrogen requirement from the soil from approximately 15-30%) and leave nitrogen in the soil for use by subsequent crops [53,54]. Although FP can use nitrogen from symbiosis with rhizobia bacteria, fertilizer application significantly affects its yield and quality. Foliar application of phosphorus can significantly improve yield and quality parameters of FP, especially on soils with low phosphorus content [55], but even on soils rich in P content, it has a positive effect on FP yields [56]. N fertilization can also increase yield and quality. Early application of N fertilizers is important, as the actual fixation of airborne nitrogen takes place only in the later stages of growth. Depending on soil and climate conditions, optimum N rates can range from 40 to 80 kg ha−1 N and higher doses can provide lower yields as high N doses can reduce bacteria nodule mass [57]. However, under different soil and climate conditions the response of FP to N fertilization may be different as yields can increase up to the dose of 135 kg ha−1 N [58].
In 1972, long-term experiments were set up at two sites with different soil and climatic conditions to study the effect of the application of organic manure (pig slurries), mineral fertilizers and their combinations on soil chemistry and yields of wheat, barley and peas. The design of this experiment allows us to analyze the long-term effect of different fertilizer combinations on soil properties, which is currently a hot topic due to the dependence of conventional agriculture on mineral nitrogen, the low rates of applied P and K fertilizers and the limited availability of organic manures (slurries). In other words, our experiment can provide answers on how to take better care of the soil with the help of organic manure and how to avoid undesirable effects of mineral nitrogen applied without organic manure (current situation in Czech Republic). Soil types are represented by Cambisol (about 45% of the soil in Czech Republic) and Luvisol (about 13% of the soil in Czech Republic), representing the two most widespread soil types in Czech Republic. The article includes an analysis of the effect of fertilization on pea yields in 2017 and 2020 in Pernolec and the determination of a reasonable dose (using a linear-plateau model) of mineral nitrogen fertilization.
2. Materials and Methods
2.1. General Information and Sites Description
The results come from two long-term field trials located at Pernolec and Kostelec, Czech Republic, Central Europe. Both trials were established in 1972. The long-term trials aim to analyze the effect of mineral fertilizers (mineral nitrogen–N, phosphorus–P and potassium–K), pig slurry (three different doses), and their combination on the yield of arable crops. The crop rotation of both trials consists of winter wheat (Triticum aestivum L., WW), spring barley (Hordeum vulgare L., SB) and field pea (Pisum sativum L., FP). At the same time, the effect of long-term fertilizer application on basic soil properties is monitored (pH, the concentration of soil P, K, magnesium–Mg, calcium–Ca, the content of soil organic carbon–Cox, the content of soil total N–Ntot). In this paper, we assessed the period from 2015 to 2020 (six years) to analyze how long-term regular application of mineral fertilizers and organic manures affects soil properties and FP yields (yields from the years 2017 and 2020; 2015–WW, 2016–SB, 2017–FP, 2018–WW, 2019–SB, 2020–FP).
According to Köpper–Geiger climate classification [59], both sites are located in warm summer humid continental climate (Dfb). The basic site description of both localities is shown in Table 1. Detailed weather information can be found in Section 2.3. It should be noted here that our team was not the team that established the experiments in 1972 and we have not been able to find the results of soil analyses from the period of the trial establishment.

Table 1.
The description of trial sites—Pernolec and Kostelec.
2.2. Field Trials Description
In both long-term trials, the effect of a total of fifteen fertilization treatments with four replications has been running since 1972. The trial consists of sixty plots (15 × 4) arranged in a completely randomized block design. The plot size is 8 m × 5.5 m (44 m2). The fertilization treatments are identical in both trials, but the fertilization rates differ slightly (Table 2 and Table 3 show fertilizer treatments and rates applied to FP in Pernolec and Kostelec. Tables S1 and S2 show the fertilizer treatments and rates applied over the whole three-year crop rotation—the sum of nutrients applied to all three crops over the three years). Mineral N was applied in two forms. Ammonium sulfate (AS) was applied in the spring, before the planting. Calcium ammonium nitrate (CAN) was applied during the beginning of stem elongation (BBCH 30). Mineral P was applied as superphosphate and mineral K as potassium sulfate. Both mineral fertilizers and PS were applied in the autumn, before tillering. Mineral fertilizers were spread by hand at both sites. Pig slurries were applied by manual sprayer. The average content of dry matter (DM) ranged from 0.68% (Pernolec) to 1.8% (Kostelec). This is a very low value: the amount of DM in slurry usually ranges from 0.7% to 24% [61] and is significantly affected by the season of the year [62]. Quality slurry is considered to have a dry matter content between 6% and 8%. The average pH and concentrations of N, P, K, Ca and Mg (% of DM) in Pernolec were 7.75, 1.79%, 0.52%, 16.77%, 1.11%, and 0.73%, respectively. In Kostelec, the average pH value of PS was 7.68 and the concentrations of N, P, K, Ca and Mg (% of DM) were 1.95%, 1.53%, 14.53%, 3.84% and 0.98%, respectively. Pig slurries were obtained from the nearest livestock farms that were able to supply manure in time. The FP (cul. Eso) was sown at the beginning of April (one million germinating seeds per ha, approximately 270 kg) and harvested in the first half of August.
Table 2.
Forms and doses of mineral fertilizers and pig slurry (PS) according to the fertilizer treatments applied to FP in Pernolec.
Table 3.
Forms and doses of mineral fertilizers and pig slurry (PS) according to the fertilizer treatments applied to FP in Kostelec.
2.3. Weather Information
Weather data (average monthly temperatures and monthly precipitation) were evaluated according to [63], which describes the World Meteorological Organization’s recommendations for describing meteorological and climatological conditions of a defined period (text in Czech, tables in English). The weather analysis was based on long-term records. In Pernolec we compared the years 2017 and 2020 with the period from 1977 to 2014 (37 years). In Kostelec, we based our analysis on the period from the years 1982 to 2014 (32 years).
In Pernolec, the year 2017 was evaluated as warm (+0.9 °C in comparison with long–term average) and 2020 as very warm (+1.5 °C). In terms of precipitation, 2017 was a very dry year (76% of the long–term average), while 2020 was normal (98%). In Kostelec, the year 2017 was evaluated as warm (+0.8 °C) and 2020 as very warm (+1.5 °C). In terms of precipitation, 2017 was a normal year (109%), while 2020 was a very wet year (135%, Table 1). Detailed weather information for 2017 and 2020 at both sites, including assessments, is provided in Tables S3 and S4.
2.4. Soil Analyses
Following the harvest of the crops, soil samples were taken using the stainless-steel soil probe sampler. The soil samples were taken from the topsoil layer (0–20 cm). Four samples from each plot were taken. The samples were then mixed and transported to the laboratory, where they were dried and sieved to get fine and dry soil. The soil pH was analyzed potentiometrically using 0.2 mol KCl (inoLab pH 730, WTW, Xylem Analytics, Weilheim, Germany). The concentration of total N (Ntot) was analyzed using sulfuric acid in the heating block (Tecator, Foss Analytics, Hillerød, Denmark), followed by the Kjeldahl method [64]. The concentrations of P, K, Ca and Mg were analyzed using the Mehlich III solution [65], followed by the ICP-OES analysis (Thermo Scientific iCAP 7400 Duo, Thermo Fisher Scientific, Cambridge, UK). The SOC content was analyzed colorimetrically and via oxidimetric titration according to [66,67].
2.5. Data Analyses
One-way and multivariate analysis of variance (ANOVA, MANOVA) was used to compare the results of pH and soil element concentrations as affected by fertilization treatments and to analyze the effect of weather and fertilization treatments on FB yields (Pernolec locality only). Due to the occurrence of certain problems, we have only the summed FP yield values (average values without repeats) from the Kostelec site. For this reason, it was not possible to perform statistical analysis as in the case of the Pernolec. However, the average FP yield values from the Kostelec were suitable for PCA. FP yields from the Kostelec site are shown in Table S5. In this article, we have analyzed a total of fifteen fertilization treatments. Such a large set makes the interpretation of the results difficult and ambiguous (the results of the post hoc analysis overlap widely). For this reason, we proceeded to group the treatments (Control, PK, NPK, PS, PS+PK, PS + NPK) and calculate separate ANOVA for soil parameters where significant differences between the fertilizer treatments were recorded previously. If statistically significant differences were found, we used Tukey’s HSD post hoc analysis to separate treatments. Statistical analyses were performed in Statistica 13.3. (Tibco Software Inc. Palo Alto, CA, USA). The nitrogen use efficiency (NUE) was calculated as ((GYT-GYC)/N rate) where GYT represents grain yield from the particular fertilizer treatment and GYC represents the grain yield from the Control treatment. The NUE was calculated from seven fertilizer treatments (NPK, PS1, PS1+NPK, PS2, PS2+NPK, PS3, and PS3+NPK. To evaluate the relationships between the yields, fertilizer treatments and soil parameters, principal component analysis (PCA) and factor analysis (FA) were used (Statistica 14.0.). MS Excel 2019 was used for weather analyses (Microsoft Corporation, Washington, DC, USA). The linear-plateau model, analyzing the reasonable N dose for FP (calculated from mineral fertilizer treatments), was calculated using R software (R: A language and environment for statistical computing. R Foundation for Statistical Computing, Vienna, Austria, 2020), together with three R packages [68,69,70].
3. Results
3.1. Comparison of Localities
The two sites are statistically significantly different from each other in all observed soil parameters (results from all fertilizer treatments and for the whole period 2015–2020, Table 6). Compared to Kostelec, the soil in Pernolec is characterized by a higher pH value, and lower mean content of available P, K and Ca. In contrast, the average content of Mg, Cox and Ntot is higher in Pernolec.
3.2. The Effect of Fertilizer Treatments on Soil Chemical Properties
In the following sections the results of the effect of fertilization on pH, nutrient concentration, Cox and Ntot at each site will be presented. A summary description of the relationships between the fertilization treatments and the individual parameters is given in the last section, in which the PCA results are presented.
3.2.1. Soil Reaction
In Pernolec (Cambisol), the soil pH was statistically significantly affected by the fertilizer treatment (d.f. = 14; F = 10.6; p < 0.001). Comparing all 15 treatments, the lowest mean pH value (4.73) was recorded in the NPK E3 treatment. The highest mean pH value (5.93) was recorded in PK treatment (Table 4). Comparing the groups of fertilizers, the lowest mean pH was recorded in NPK treatments (5.16), followed by PS+NPK (5.48), while the highest pH was recorded in PS+PK (5.81) and PK (5.93) treatments (Figure 1a).
Table 4.
Soil pH value, the concentration of P, K, Ca and Mg (mg kg−1), the content of organic carbon (Cox, %) and total nitrogen (Nt, %) as affected by the fertilizer treatments (2015–2020) in Pernolec.
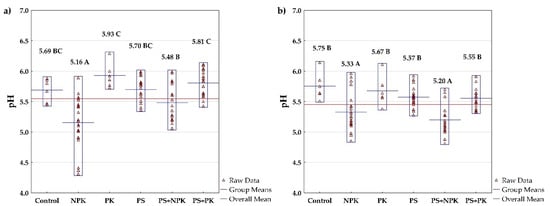
Figure 1.
The effect of fertilizer treatments on pH in (a) Pernolec and (b) Kostelec (2015–2020). Mean values followed by the same letter are not significantly different. Red triangles represent the raw data. The blue lines represent the mean value of the particular treatment, while the red line represents the mean value calculated from all fertilizer treatments.
In Kostelec (Luvisol), the value of the pH was also significantly affected by the fertilizer treatment (d.f. = 14; F = 4.2; p < 0.001). The lowest mean pH value was recorded in PS2 + NPK (5.04) treatments, while the highest was in Control (5.75) and PK (5.67) treatments (Table 5). Comparing the groups of fertilizer treatments, similarly to Pernolec, the lowest mean pH values were recorded in treatments with mineral N–NPK (5.33) and PS+NPK (5.14), while the highest value was recorded in Control (5.75) treatment (Figure 1b).
Table 5.
Soil pH value, the concentration of P, K, Ca and Mg (mg kg−1), the content of organic carbon (Cox, %) and total nitrogen (Nt, %) as affected by the fertilizer treatments (2015–2020) in Kostelec.
The results show that the application of NPK, either alone or in combination with PS, results in the lowest pH values. In Kostelec, the pH values for the NPK and PS+NPK treatments were comparable and significantly different from the other treatments. In Pernolec, the effect of NPK was most significant, while the combined application of PS+NPK was comparable to PS, yet lower. The negative effect of ammonium nitrogen on pH is particularly noticeable when compared to the PK treatment (Figure 1).
3.2.2. Phosphorus
The concentration of P in the soil was not affected by the long-term application of slurry and mineral fertilizers in Pernolec (d.f. = 14; F = 0.6; p = 0.84). The lowest mean concentration was recorded in Control (58 mg kg−1), and the highest in PS3+PK treatment (111 mg kg−1) (Table 4). A different situation occurred in Kostelec, where differences between fertilizer treatments were significant (d.f. = 14; F = 16.47; p < 0.001). As in Pernolec, the lowest concentration was recorded in Control (124 mg kg−1), and the highest in PS3+NPK (262 mg kg−1) treatment (Table 5). Comparing the groups of fertilizers, ANOVA separated three groups of fertilizers according to their effect on soil P concentration in Kostelec (Figure 2a). The lowest mean concentration was recorded in Control (124 mg kg−1), followed by NPK, PK and PS treatments. The combined application of PS+NPK and PS+PK resulted in the highest mean P concentrations, ranging from 229 to 235 mg kg−1 (Figure 2a).
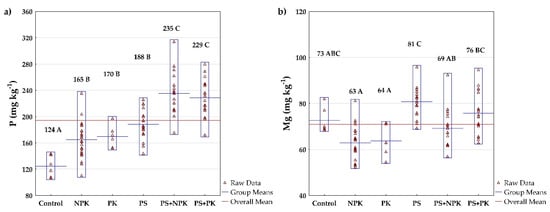
Figure 2.
The effect of fertilizer treatments on (a) soil P and (b) Mg concentration in Kostelec (2015–2020). The differences between P and Mg concentrations as affected by fertilizer treatment were insignificant in Pernolec (Table 6). Mean values followed by the same letter are not significantly different. Red triangles represent the raw data. The blue lines represent the mean value of the particular treatment, while the red line represents the mean value calculated from all fertilizer treatments.
3.2.3. Potassium
Of all the analyzed parameters, potassium was the element most affected by the fertilization treatments (d.f. = 14; F = 22.83; p < 0.001 for Pernolec and d.f. = 14; F = 19.11; p < 0.001 for Kostelec). In Pernolec, the lowest concentration was recorded in NPK E1 treatment (116 mg kg−1), and the highest in PS1+NPK treatment (215 mg kg−1) (Table 4). In Kostelec, the K mean concentration varied from 112 mg kg−1 (NPK E1) to 252 mg kg−1 (PS3+PK) (Table 5). If we compare the fertilizer groups, we find that both localities have a comparable pattern. In Pernolec, application of no fertilizers (Control), NPK and PS resulted in lower K soil concentrations without differences between these treatments, while application of PK, PS+NPK and PS+PK resulted in higher K concentrations (Figure 3a). The situation in Kostelec was similar, with one exception, namely for the PK and PS treatments. The differences between these two treatments were not significant, as in Pernolec (Figure 3b).
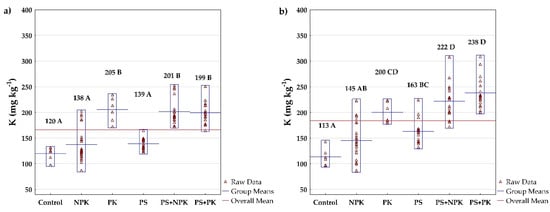
Figure 3.
The effect of fertilizer treatments on soil K concentration in (a) Pernolec and (b) Kostelec (2015–2020). Mean values followed by the same letter are not significantly different. Red triangles represent the raw data. The blue lines represent the mean value of the particular treatment, while the red line represents the mean value calculated from all fertilizer treatments.
3.2.4. Calcium
In Pernolec, the mean Ca soil concentrations varied significantly (d.f. = 14; F = 4.83; p < 0.001) between the treatments and ranged from 1113 mg kg−1 (NPK E3) to 1447 mg kg−1 (PS1) (Table 4). Similarly, in Kostelec, the differences between fertilization treatments were significant (d.f. = 14; F = 4.46; p < 0.001), and varied from 1213 mg kg−1 (PS2+NPK) to 1549 mg kg−1 (Control) (Table 5). Comparing the fertilizer groups, we find that the effect of fertilization on soil Ca content is similar in the two sites. The lowest mean Ca concentrations were recorded in NPK and PS+NPK treatments (Figure 4a,b), while application of no fertilizers (Control) and PS resulted in the highest Ca concentrations.
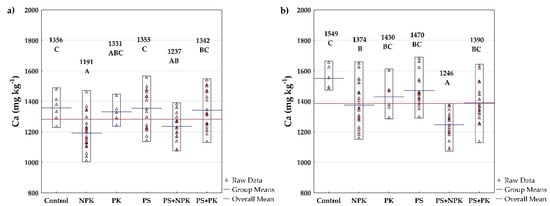
Figure 4.
The effect of fertilizer treatments on soil Ca concentration in (a) Pernolec and (b) Kostelec (2015–2020). Mean values followed by the same letter are not significantly different. Red triangles represent the raw data. The blue lines represent the mean value of the particular treatment, while the red line represents the mean value calculated from all fertilizer treatments.
3.2.5. Magnesium
Average soil Mg concentrations in Pernolec were not significantly affected by the fertilization treatments (d.f. = 14; F = 0.57; p = 0.88) and ranged from 104 mg kg−1 (NPK E3) to 131 mg kg−1 (PS1) (Table 4). In Kostelec, on the other hand, the long-term application of slurry and mineral fertilizers had a significant effect on the Mg concentration (d.f. = 14; F = 7.10; p = 0.001), which varied from 58 mg kg−1 (NPK) to 83 mg kg−1 (PS3) (Table 5). Comparing the groups of fertilizers, the lowest mean concentrations were recorded in NPK and PK treatments, while the highest concentrations occurred in PS and PS+PK treatments (Figure 2b).
3.2.6. Soil Organic Carbon Content
Long-term and regular application of slurry, mineral fertilizers and their combinations did not significantly affect the soil organic carbon content in either Pernolec (d.f. = 14; F = 0.91; p = 0.56) or Kostelec (d.f. = 14; F = 0.77; p = 0.70). In Pernolec, the Cox content in the soil varied from 0.88% (PK, PS1) to 1.02% (PS3+NPK) (Table 4). In Kostelec, the Cox ranged from 0.77% (PK) to 0.87% (PS3+NPK) (Table 5).
3.2.7. Total Nitrogen Content
Similar to soil organic carbon, long-term and regular application of manure, mineral fertilizers and their combinations did not significantly affect total soil nitrogen content at either of the two sites (Pernolec: d.f. = 14; F = 0.52; p = 0.91; Kostelec: d.f. = 14; F = 0.64; p = 0.83). In Pernolec, the Ntot content ranged from 0.11% to 0.13% (Table 4), in Kostelec from 0.10% to 0.11% (Table 5).
3.2.8. Principal Component Analysis (PCA)
Based on the PCA results (Figure 5a), we can classify the fertilizers in Pernolec (cambisol) into four categories according to their effect on yield and soil properties (Figure 5b). (1) The unfertilized treatment (Control) gives lower crop yields and has low P and K concentrations due to no external supply of nutrients. (2) Pig slurry (PS) applied alone, application of mineral P and K (PK), and combination of PS+PK (generally the fertilizers without mineral N): these fertilizers have a positive relationship with pH and Ca and Mg content, and there is no decrease in pH compared to other treatments. On the other hand, the absence of mineral N puts this group at a disadvantage in terms of low grain and straw yields and the soils have a low organic matter content (no organic matter in the PK treatment and low organic matter in the slurry). (3) The third group is represented by PS+NPK treatments. The joint application of PS and mineral NPK represents a kind of golden mean ensuring relatively high grain and straw yields, nutrient and soil organic matter content. However, the presence of the ammonium form of mineral N negatively affects soil pH. (4) The fourth group consists of separately applied mineral fertilizers (NPK, without manure supplement). Mineral fertilizers are clearly closely and positively associated with yield, followed by soil organic carbon and nitrogen. On the other hand, the presence of the ammonium form of nitrogen, accompanied by the absence of slurry, accentuates the negative effect on pH even more significantly (compared to PS+NPK combinations).
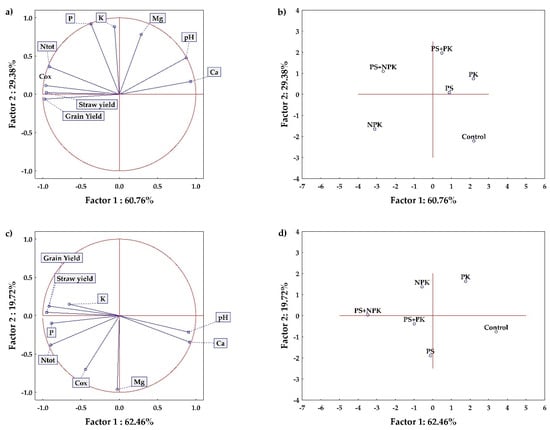
Figure 5.
Results of the PCA—relationships between soil chemical parameters and grain and straw yields as affected by the fertilization treatments: (a,b) Pernolec, (c,d) Kostelec. Grain and straw yields are based on the average WW, SB and FP yield from 2015 to 2020.
With a change in soil type (Kostelec, luvisol), we can see a different response to the long-term application of manure and mineral fertilizers on yield and soil properties (Figure 5c). The separation of fertilizers in Kostelec (Figure 5d) is not as clear-cut as in Pernolec, which means that the differences between fertilizer treatments are not as pronounced. As in Pernolec, unfertilized Control is strongly and positively correlated with pH and soil Ca content. On the other hand, treatment without external nutrient inputs (Control) is associated with low grain and straw yields and also with low concentrations of soil P and K (soil depletion). The PK group (mineral P and K fertilizers) has a completely different status than PS (in Pernolec these two fertilizer groups were together in one cluster). PK has a strong negative relationship with soil organic carbon and total nitrogen. This treatment highlights the need for nitrogen, either supplied in mineral form or the form of manure. In contrast, the application of pig slurry (PS) is strongly and positively associated with soil organic carbon content combined with a neutral relationship to both yield and pH. Mineral fertilizers (NPK) occupy a similar position to PS in terms of yield and pH, with the exception that they are closer to higher yields and lower pH. Quite different (compared to Pernolec) is their relationship to soil organic carbon, with which it is moderately and rather negatively correlated. Similarly to Pernolec, the PS+NPK fertilizer group is dominant. It is associated with high yields, high soil nutrient content, a relatively neutral relationship to soil organic matter and a significantly (strongly) negative relationship to soil pH (stronger negative relationship to pH than in Pernolec).
3.2.9. FP Grain and Straw Yields
As mentioned in Section 2.5, the results of the FP grain and straw yields from Kostelec cannot be statistically analysed. The average grain and straw yields in 2017 and 2020 are shown in Table S5. In 2017, the grain yields varied from 2.8 t ha−1 (PS1, PS1+PK) to 3.7 t ha−1 (PS3+NPK), while in 2020 the grain yields varied from 2.5 t ha−1 (NPK E2) to 3.3 t ha−1 (PS1+PK). Straw yields varied from 2.1 t ha−1 (PS1) to 3.2 t ha−1 (PS3+NPK) in 2017 and from 3.0 t ha−1 (PS1+NPK, NPK E1) to 3.6 t ha−1 (PS2) (Table S5).
According to MANOVA results, the FP grain yields were significantly affected by year (d.f. = 1; F = 71.55; p < 0.001), fertilizer treatment (d.f. = 14; F = 6.76; p < 0.001), and their interaction (d.f. = 14; F = 2.33; p < 0.01) in Pernolec. The effect of year was dominant (89%), while the effect of fertilizer treatment influenced yields by 8%. If we look at the weather in a particular year, we find that 2017 in Pernolec was marked by drought in May and June. Moreover, 2017 was significantly marked by very high temperatures in June and July (Table S3). These were factors that caused significantly lower yields compared to 2020, which was characterized by both higher precipitation and milder temperatures (Table 1). Straw yields were comparable in 2017 and 2020 as the differences were insignificant in Pernolec (d.f. = 1; F = 0.40; p = 0.53), while the effect of the fertilizer treatment was significant (d.f. = 14; F = 4.32; p < 0.001). The interaction between the factors of year and treatment was insignificant (d.f. = 14; F = 1.90; p < 0.07).
In 2017, the grain yields were significantly affected by the fertilization (d.f. = 14; F = 3.18; p < 0.01) and varied from 1.2 t ha−1 (Control) to 2.3 t ha−1 (PS3+PK and NPK E3) (Table 7). Significantly different were Control and PS1+PK against PS3+PK, PS3+NPK and NPK E3. Grain yield slightly increased with increasing nitrogen rate (Figure 6a). According to the linear-plateau model, calculated from the mineral fertilizer treatments (NPK, NPK E1, NPK E2, NPK E3), the FP yield response to different rates of mineral N plateaued at 97 kg ha−1 N, with a corresponding yield of 2.08 t ha−1 (Figure 7, left). Comparing the nitrogen use efficiency (NUE), the highest NUE was recorded in NPK treatment (23.3 kg per 1 kg of N applied), followed by PS1 (5.9 kg), PS1+NPK (4.3 kg), PS2, PS3 and PS3+NPK (3.5 kg), the lowest NUE was recorded in PS2+NPK treatment (3.0 kg per 1 kg of N applied). This calculation shows that mineral fertilizers, compared to organic manures (slurries), supply nutrients very quickly and, even in small quantities can significantly and efficiently promote growth. On the other hand, their effectiveness is offset by their negative effect on the soil environment.
Table 7.
The effect of the year (2017, 2020) and fertilizer treatment on FP grain and straw yield (t ha−1) in Pernolec.
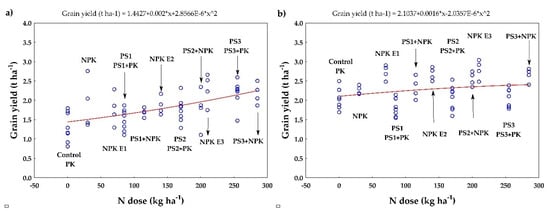
Figure 6.
FP grain yield (t ha−1) as affected by N dose in Pernolec in (a) 2017 and (b) 2020. The average yields (blue points) are interleaved with the quadratic function (red line). The equation of the quadratic model is given above the figure.
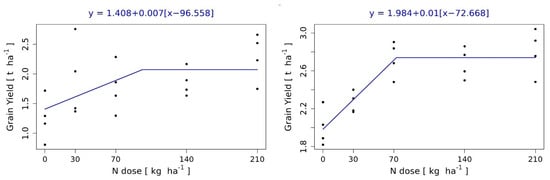
Figure 7.
The response of FP yields to different doses of mineral N fertilizers (NPK, NPK E1, NPK E2, NPK E3 treatments) in 2017 (left) and 2020 (right). Yields (black dots) are interleaved with the linear-plateau model (blue line). The equation of the model is given above the figure.
In 2020, the grain yields varied from 1.8 t ha−1 (PS1 and PS1+PK) to 2.8 t ha−1 (NPK E3). As we can see, the response to the fertilization was a little different as the weather conditions changed (Figure 6b, the red line representing a quadratic model). We can see that grain yield slightly increased with increasing N dose, as in 2017. The course of the function indicates the attainment of a local maximum, which, according to the quadratic model, is located at an N rate of 400 kg ha−1. At this rate, the maximal average yield of 2.4 t ha−1 would be achieved, which is actually lower than the yields already obtained with lower inputs (Figure 6b). According to the linear-plateau model, the response of FP yields to different rates of N doses plateaued at 73 kg ha−1, corresponding with the yield 2.71 t ha−1 (Figure 7, right), showing better weather conditions for yield development in 2020. Comparing the NUE, the highest efficiency was again recorded in NPK treatment (10.0 kg per 1 kg N applied), followed by PS2+NPK (3 kg), PS1+NPK (2.6 kg), PS3+NPK (2.4 kg), PS3 (0.4 kg) and PS1 and PS2 (−2.4 and −0.5, respectively), where the efficiency was negative as the mean yield was lower than in the Control treatment.
Comparing the results from both years (Table 7), we find that the highest average yields were obtained with the NPK E3 treatment (2.5 t ha−1). However, lower, but statistically comparable, yields were obtained with the NPK (30 kg mineral N ha−1 with an average yield of 2.1 t ha−1) and PS3 (51 t ha−1 with an average yield of 2.1 t ha−1) treatments. This is a very important finding as PS applied in higher doses can completely replace mineral fertilizers and a negative effect of mineral fertilizers on soil pH can be partially avoided.
Straw yields were significantly affected by fertilization in 2020 (d.f. = 14; F = 3.26; p < 0.05), with insignificant differences in 2017 (d.f. = 14; F = 3.07; p < 0.05, Tukey’s test did not confirm ANOVA as multiple comparison methods generally have lower test power than analysis of variance-ANOVA). Straw yield tended to increase with increasing fertilizer rate. The differences between 2017 and 2020 were insignificant. The highest yields obtained were recorded for the PS3+NPK and NPK E3 treatments; however, the PK, PS1 and PS2 treatments also provided statistically comparable yields (Table 7).
4. Discussion
Long-term and regular application of mineral fertilizers, pig slurry, and their combinations significantly affected soil properties and the effect of fertilizers depends on soil conditions (type) of the site. One of the most important soil properties is the value of the pH. Soil pH is considered to be the dominant factor directly influencing other soil properties such as elements’ availability [10,71,72] and abundance and representation of plant and microbial communities [73] and their activity [74]. All macronutrients are best available in neutral to alkaline soils, while in acid soils their availability decreases and the availability of elements such as Fe, Mn, B, Zn and Al increases. Changes in pH thus directly affect the soil’s ability to supply nutrients to plants. In our case, the lowest pH values were recorded for the NPK treatments (applied alone or in combination with PS, but only in the NPK treatments with the highest N doses, Table 4 and Table 5). The same result was recorded worldwide [11,13,21,72,75] and has been known for a long time [76]. The primary driver of downward pH changes is mineral nitrogen, in its ammonium form, because the conversion of the ammonium form to nitrate in soils releases hydrogen, directly affecting its concentration in the soil environment. This can be particularly evident in the case of PK treatments. As mentioned above, Czech conventional crop production is primarily dependent on mineral nitrogen. Add to this the fact that most of the cultivated land is rented and its owners have no idea or do not care about acidification. This leaves room for acidification to run freely. An interesting survey was carried out in the USA, which also shows that acidification is taking place there and that about half of the farmers were not even aware of it [77]. One way to reduce the negative effects of mineral fertilizers on soil pH is to combine mineral fertilizers and organic manures [78]. Co-application of mineral fertilizers and organic manures is often cited as a sustainable method of fertilization, providing high and stable yields and a healthy state of the soil. The unifying element of this approach is organic matter (together with nutrients) [3,5,7,8,13,29,79,80] added to the soil, beneficially affecting soil chemical, physical and microbiological properties. From this point of view, we can support these results only partially as the combined application of PS+NPK provided better pH values than NPK only in Pernolec (Figure 1a), in contrast to Kostelec (lower and comparable to NPK treatment, Figure 1b). This may be due to the overall higher soil organic matter content in Pernolec (Table 1) and the very low organic matter content in the slurry, which seems to be behind the non-significant Cox differences between fertilization treatments in both locations (Table 4 and Table 5). The DM of pig slurry usually ranges from 0.7% up to 23% [61] and quality slurry has a dry matter content between 6% and 8% in Czech Republic. In our case, the dry matter content of the available and applied pig slurry was very low, which is probably the reason why the soil organic matter content is slightly higher in the high slurry fertilizer treatments, but not statistically significantly higher compared to the other fertilization treatments.
From the point of view of nutrients, the highest concentrations of macronutrients were always connected with PS+PK, NPK and PS+NPK treatments (Figure 5), while nutrient depletion can be found in Control treatment. PS+PK treatment has a close relationship to nutrient content and a moderate relationship to yields (Figure 5), showing that nitrogen is a limiting element in this treatment and its P and K nutrients are not utilized completely. The combination of mineral fertilizers and organic manures provides high yields while leaving a high micronutrient content in the soil (Figure 5). From the point of view of agriculture in Czech Republic, we can expect that acidification problems will intensify, as mineral nitrogen is important for all agricultural crops and significantly affects yields, which is the most monitored parameter. The application of mineral fertilizers at higher doses (NPK E3, PS2+NPK, PS3+NPK treatments) significantly reduced the soil reaction values at both sites (Kostelec and Pernolec) compared to the Control; a more significant decrease was recorded on the luvisol soil type (Kostelec). Similar findings (decrease in pH in treatments fertilized with mineral fertilizers only) are supported by some other studies [81,82,83,84]. The negative effect of acidification on the content of available nutrients (Ca, Mg) in the plough soil horizon is shown in Table 4 and Table 5 (in the NPK E3, PS2+NPK, PS3+NPK treatments, low Ca and Mg contents were recorded at both sites). For available nutrients P and K, the acidification effect was predominant in the mineral fertilized treatments (NPK E1-3). This is confirmed by the results of the multicriteria PCA evaluation. These results are in agreement with [85,86], which showed a negative effect of acidification on the regime of available nutrients in the soil. Without the addition of other nutrients (PK treatments), there will be a reduction in the content of these nutrients in the soil (as in the case of Control). The combination of mineral fertilizers and organic manures can partially reduce the negative effect of mineral fertilizers on pH (depending on the location and soil and climate conditions), which is good news, but the lack of organic manures due to reduced livestock production in the country plays against the solution to the current problems.
In terms of pea yields, we can clearly see the dependence of yields on nitrogen, with pea yields increasing with increasing nutrient rates, although the differences are not statistically significant between higher doses of fertilizers. The yields are strongly affected by fertilization and by weather conditions. While nutrient utilization is lower in years with poorer weather conditions, nutrient utilization increases in years with normal conditions. This can be seen in the results of the linear-plateau model, which compared nutrient and yield dependence in 2017 and 2020. Based on this model, we can say that under normal weather conditions the optimum nitrogen rate in Pernolec is around 70 kg ha−1. As the variation from normal conditions increases, the nutrient requirement increases as the optimal dose of N raised to 97 kg ha−1 N in 2017. Another important finding is that mineral fertilizers can be completely replaced by PS applied in higher doses (51 t ha−1 in our case). PS has a low C:N ratio, and the mineralization of slurries is rapid, providing a huge amount of available nutrients at the beginning of the season before symbiosis with mycorrhizal bacteria fully develops. Replacing mineral fertilizers with PS can provide comparable yields without a negative effect on soil pH value.
Supplementary Materials
The following are available online at https://www.mdpi.com/article/10.3390/land11020187/s1, Table S1: Forms and doses of mineral fertilizers and pig slurry (PS) according to the fertilizer treatments applied in Pernolec. Cumulative doses for the entire three-year crop rotation. Table S2: Forms and doses of mineral fertilizers and pig slurry (PS) according to the fertilizer treatments applied in Kostelec. Cumulative doses for the entire three-year crop rotation. Table S3: The long-term mean precipitation (Mean; 1977–2016 for Pernolec; 1982–2016 for Kostelec; mm) and the sum of precipitation (mm) in individual months in 2017 and 2020 in Pernolec and Kostelec. The comparison between long-term mean and actual (2017, 2020) precipitation was done according to [63]. Table S4: The long-term mean temperature (Mean; 1977–2016 for Pernolec; 1982–2016 for Kostelec; °C) and the average temperature (°C) in individual months in 2017 and 2020 in Pernolec and Kostelec. The comparison between the long-term mean and actual (2017, 2020) temperature was done according to [63]. Table S5: The effect of the year (2017, 2020) and fertilizer treatment on FP grain and straw yield (t ha−1) in Kostelec.
Author Contributions
Conceptualization, L.H., L.M. and E.K.; methodology, E.K.; software, L.H, L.M. and K.K.; formal analysis, L.H., L.M. and K.K.; investigation, L.H., L.M. and K.K.; resources, E.K. and P.Č. writing—original draft preparation, L.H.; writing—review and editing, L.H., L.M. and E.K.; visualization, L.H. and K.K.; supervision, E.K.; project administration, E.K.; funding acquisition, E.K. and P.Č. All authors have read and agreed to the published version of the manuscript.
Funding
This research was funded by the Ministry of Agriculture of the Czech Republic, grant number RO0418, Czech National Agency for Agricultural Research, grant number QK1810010, QK21020155 and QK21010124, and EU project H2020 677407—Soil care for profitable and sustainable crop production in Europe.
Institutional Review Board Statement
Ethical review and approval were waived for this study, due to the non-use of experimental animals or human subjects.
Informed Consent Statement
No human trials were conducted during the study.
Data Availability Statement
Not applicable.
Acknowledgments
We would like to thank the staff at the experimental station in Pernolec, Pavel Beneš and Vera Folejtárová, and the staff of the experiment in Kostelec nad Orlicí, Petr Ivičic, Vlatimil Basař and Jaroslav Málek.
Conflicts of Interest
The authors declare no conflict of interest.
References
- Yanai, J.; Okada, T.; Yamada, H. Elemental composition of agricultural soils in Japan in relation to soil type, land use and region. Soil Sci. Plant Nutr. 2012, 58, 1–10. [Google Scholar] [CrossRef] [Green Version]
- Domagała-Świątkiewicz, I.; Gąstoł, M. Soil chemical properties under organic and conventional crop management systems in south Poland. Biol. Agric. Hortic. 2013, 29, 12–28. [Google Scholar] [CrossRef]
- Cai, A.; Xu, M.; Wang, B.; Zhang, W.; Liang, G.; Hou, E.; Luo, Y. Manure acts as a better fertilizer for increasing crop yields than synthetic fertilizer does by improving soil fertility. Soil Tillage Res. 2019, 189, 168–175. [Google Scholar] [CrossRef]
- Triberti, L.; Nastri, A.; Baldoni, G. Long-term effects of crop rotation, manure and mineral fertilisation on carbon sequestration and soil fertility. Eur. J. Agron. 2016, 74, 47–55. [Google Scholar] [CrossRef]
- Shang, Q.; Ling, N.; Feng, X.; Yang, X.; Wu, P.; Zou, J.; Shen, Q.; Guo, S. Soil fertility and its significance to crop productivity and sustainability in typical agroecosystem: A summary of long-term fertilizer experiments in China. Plant Soil 2014, 381, 13–23. [Google Scholar] [CrossRef]
- Hemkemeyer, M.; Schwalb, S.A.; Heinze, S.; Joergensen, R.G.; Wichern, F. Functions of elements in soil microorganisms. Microbiol. Res. 2021, 252, 126832. [Google Scholar] [CrossRef] [PubMed]
- Chen, Y.; Camps-Arbestain, M.; Shen, Q.; Singh, B.; Cayuela, M.L. The long-term role of organic amendments in building soil nutrient fertility: A meta-analysis and review. Nutr. Cycl. Agroecosyst. 2018, 111, 103–125. [Google Scholar] [CrossRef]
- Du, Y.; Cui, B.; Zhang, Q.; Wang, Z.; Sun, J.; Niu, W. Effects of manure fertilizer on crop yield and soil properties in China: A meta-analysis. Catena 2020, 193, 104617. [Google Scholar] [CrossRef]
- Shiwakoti, S.; Zheljazkov, V.D.; Gollany, H.T.; Kleber, M.; Xing, B. Macronutrients in soil and wheat as affected by a long-term tillage and nitrogen fertilization in winter wheat–fallow rotation. Agronomy 2019, 9, 178. [Google Scholar] [CrossRef] [Green Version]
- Czarnecki, S.; Düring, R.A. Influence of long-term mineral fertilization on metal contents and properties of soil samples taken from different locations in hesse, Germany. Soil 2015, 1, 23–33. [Google Scholar] [CrossRef] [Green Version]
- Mi, W.; Sun, Y.; Xia, S.; Zhao, H.; Mi, W.; Brookes, P.C.; Liu, Y.; Wu, L. Effect of inorganic fertilizers with organic amendments on soil chemical properties and rice yield in a low-productivity paddy soil. Geoderma 2018, 320, 23–29. [Google Scholar] [CrossRef]
- Maltas, A.; Kebli, H.; Oberholzer, H.R.; Weisskopf, P.; Sinaj, S. The effects of organic and mineral fertilizers on carbon sequestration, soil properties, and crop yields from a long-term field experiment under a Swiss conventional farming system. L. Degrad. Dev. 2018, 29, 926–938. [Google Scholar] [CrossRef]
- Brar, B.S.; Singh, J.; Singh, G.; Kaur, G. Effects of long term application of inorganic and organic fertilizers on soil organic carbon and physical properties in maize-wheat rotation. Agronomy 2015, 5, 220–238. [Google Scholar] [CrossRef]
- Eo, J.; Park, K.C. Long-term effects of imbalanced fertilization on the composition and diversity of soil bacterial community. Agric. Ecosyst. Environ. 2016, 231, 176–182. [Google Scholar] [CrossRef]
- Soman, C.; Li, D.; Wander, M.M.; Kent, A.D. Long-term fertilizer and crop-rotation treatments differentially affect soil bacterial community structure. Plant Soil 2017, 413, 145–159. [Google Scholar] [CrossRef]
- Li, H.; Liu, J.; Li, G.; Shen, J.; Bergström, L.; Zhang, F. Past, present, and future use of phosphorus in Chinese agriculture and its influence on phosphorus losses. Ambio 2015, 44, 274–285. [Google Scholar] [CrossRef] [Green Version]
- Verbeeck, M.; Salaets, P.; Smolders, E. Trace element concentrations in mineral phosphate fertilizers used in Europe: A balanced survey. Sci. Total Environ. 2020, 712, 136419. [Google Scholar] [CrossRef]
- Zwolak, A.; Sarzyńska, M.; Szpyrka, E.; Stawarczyk, K. Sources of Soil Pollution by Heavy Metals and Their Accumulation in Vegetables: A Review. Water. Air. Soil Pollut. 2019, 230, 1–9. [Google Scholar] [CrossRef] [Green Version]
- Kissel, D.E.; Bock, B.R.; Ogles, C.Z. Thoughts on acidification of soils by nitrogen and sulfur fertilizers. Agrosystems Geosci. Environ. 2020, 3, 1–10. [Google Scholar] [CrossRef]
- Kopeć, M.; Gondek, K.; Mierzwa-Hersztek, M.; Jarosz, R. Changes in the soil content of organic carbon nitrogen and sulphur in a long-term fertilisation experiment in czarny potok (Poland). J. Elem. 2021, 26, 33–46. [Google Scholar] [CrossRef]
- Vašák, F.; Černý, J.; Buráňová, Š.; Kulhánek, M.; Balík, J. Soil pH changes in long-term field experiments with different fertilizing systems. Soil Water Res. 2015, 10, 19–23. [Google Scholar] [CrossRef] [Green Version]
- Lassaletta, L.; Billen, G.; Garnier, J.; Bouwman, L.; Velazquez, E.; Mueller, N.D.; Gerber, J.S. Nitrogen use in the global food system: Past trends and future trajectories of agronomic performance, pollution, trade, and dietary demand. Environ. Res. Lett. 2016, 11, 095007. [Google Scholar] [CrossRef]
- Zhu, H.; Chen, C.; Xu, C.; Zhu, Q.; Huang, D. Effects of soil acidification and liming on the phytoavailability of cadmium in paddy soils of central subtropical China. Environ. Pollut. 2016, 219, 99–106. [Google Scholar] [CrossRef] [PubMed]
- Yang, Z.; Ha, L. Analysis and comparison of nutrient contents in different animal manures from Beijing suburbs. Agric. Sci. 2013, 4, 50–55. [Google Scholar] [CrossRef] [Green Version]
- Eghball, B.; Wienhold, B.J.; Gilley, J.E.; Eigenberg, R.A. Biological Systems Engineering: Papers and Publications Mineralization of Manure Nutrients Mineralization of manure nutrients. J. Soil Water Conserv. 2002, 57, 470–473. [Google Scholar]
- Eghball, B. Nitrogen Mineralization from Field-Applied Beef Cattle Feedlot Manure or Compost. Soil Sci. Soc. Am. J. 2000, 64, 2024–2030. [Google Scholar] [CrossRef]
- Hamm, A.C.; Tenuta, M.; Krause, D.O.; Ominski, K.H.; Tkachuk, V.L.; Flaten, D.N. Bacterial communities of an agricultural soil amended with solid pig and dairy manures, and urea fertilizer. Appl. Soil Ecol. 2016, 103, 61–71. [Google Scholar] [CrossRef]
- Šimon, T.; Czakó, A. Influence of long-term application of organic and inorganic fertilizers on soil properties. Plant Soil Environ. 2014, 60, 314–319. [Google Scholar] [CrossRef] [Green Version]
- Suwara, I.; Pawlak-Zaręba, K.; Gozdowski, D.; Perzanowska, A. Physical properties of soil after 54 years of long-term fertilization and crop rotation. Plant Soil Environ. 2016, 62, 389–394. [Google Scholar] [CrossRef] [Green Version]
- De la Torre, A.I.; Jiménez, J.A.; Carballo, M.; Fernandez, C.; Roset, J.; Muoz, M.J. Ecotoxicological evaluation of pig slurry. Chemosphere 2000, 41, 1629–1635. [Google Scholar] [CrossRef]
- Díez, J.A.; Hernaiz, P.; Muñoz, M.J.; de la Torre, A.; Vallejo, A. Impact of pig slurry on soil properties, water salinization, nitrate leaching and crop yield in a four-year experiment in Central Spain. Soil Use Manag. 2005, 20, 444–450. [Google Scholar] [CrossRef]
- Antezana, W.; De Blas, C.; García-Rebollar, P.; Rodríguez, C.; Beccaccia, A.; Ferrer, P.; Cerisuelo, A.; Moset, V.; Estellés, F.; Cambra-López, M.; et al. Composition, potential emissions and agricultural value of pig slurry from Spanish commercial farms. Nutr. Cycl. Agroecosyst. 2016, 104, 159–173. [Google Scholar] [CrossRef] [Green Version]
- Moral, R.; Perez-Murcia, M.D.; Perez-Espinosa, A.; Moreno-Caselles, J.; Paredes, C.; Rufete, B. Salinity, organic content, micronutrients and heavy metals in pig slurries from South-eastern Spain. Waste Manag. 2008, 28, 367–371. [Google Scholar] [CrossRef] [PubMed]
- Antil, R.S.; Singh, M. Effects of organic manures and fertilizers on organic matter and nutrients status of the soil. Arch. Agron. Soil Sci. 2007, 53, 519–528. [Google Scholar] [CrossRef]
- Aula, L.; Omara, P.; Dhillon, J.S.; Fornah, A.; Raun, W.R. Influence of Applied Cattle Manure on Winter Wheat (Triticum aestivum L.) Grain Yield, Soil pH and Soil Organic Carbon. Commun. Soil Sci. Plant Anal. 2019, 50, 2056–2064. [Google Scholar] [CrossRef]
- Han, X.; Wang, S.; Veneman, P.L.M.; Xing, B. Change of organic carbon content and its fractions in black soil under long-term application of chemical fertilizers and recycled organic manure. Commun. Soil Sci. Plant Anal. 2006, 37, 1127–1137. [Google Scholar] [CrossRef]
- Ziogas, M.; Ipsilantis, I.; Matsi, T.; Kostopoulou, S. Long-term Fertilization with Liquid Cattle Manure Leaves Legacy Nutrients, but not Organic Carbon and Has No Effect on Soil Microbial and Physical Properties a Year after Last Application. Commun. Soil Sci. Plant Anal. 2021, 52, 1264–1274. [Google Scholar] [CrossRef]
- Furtado e Silva, J.A.M.; do Amaral Sobrinho, N.M.B.; Lima, E.S.A.; García, A.C. Modifications of soil organic matter structure by long-term pig slurry amendment of tropical soil. Arch. Agron. Soil Sci. 2020, 68, 1–15. [Google Scholar] [CrossRef]
- Büyükkılıç Yanardağ, A.; Faz Cano, Á.; Mermut, A.; Yanardağ, İ.H.; Gomez Garrido, M. Organic carbon fluxes using column leaching experiments in soil treated with pig slurry in SE Spain. Arid L. Res. Manag. 2020, 34, 136–151. [Google Scholar] [CrossRef]
- Marszałek, M.; Kowalski, Z.; Makara, A. The Possibility of Contamination of Water-Soil Environment as a Result of the Use of Pig Slurry. Ecol. Chem. Eng. S 2019, 26, 313–330. [Google Scholar] [CrossRef] [Green Version]
- Yuan, Z.; Pan, X.; Chen, T.; Liu, X.; Zhang, Y.; Jiang, S.; Sheng, H.; Zhang, L. Evaluating environmental impacts of pig slurry treatment technologies with a life-cycle perspective. J. Clean. Prod. 2018, 188, 840–850. [Google Scholar] [CrossRef]
- Ghirardini, A.; Grillini, V.; Verlicchi, P. A review of the occurrence of selected micropollutants and microorganisms in different raw and treated manure–Environmental risk due to antibiotics after application to soil. Sci. Total Environ. 2020, 707, 136118. [Google Scholar] [CrossRef] [PubMed]
- Lorencová, E.Š.; Frélichová, J.; Nelson, E.; Vačkář, D. Past and future impacts of land use and climate change on agricultural ecosystem services in the Czech Republic. Land Use Policy 2013, 33, 183–194. [Google Scholar] [CrossRef]
- Lošák, T.; Čermák, P.; Hlušek, J. Changes in fertilisation and liming of soils of the Czech Republic for the past 20 years. Arch. Agron. Soil Sci. 2012, 58, 17–20. [Google Scholar] [CrossRef]
- Kubát, J.; Lipavský, J. Evaluation of organic matter content in arable soils in the Czech Republic. In Crop Science and Land use for Food and Bioenergy; Agrobios Publications: Jodhpur, India, 2011; p. 500. ISBN 9788190430982. [Google Scholar]
- Wei, W.; Yan, Y.; Cao, J.; Christie, P.; Zhang, F.; Fan, M. Effects of combined application of organic amendments and fertilizers on crop yield and soil organic matter: An integrated analysis of long-term experiments. Agric. Ecosyst. Environ. 2016, 225, 86–92. [Google Scholar] [CrossRef] [Green Version]
- Jaskulska, I.; Lemanowicz, J.; Breza-Boruta, B.; Siwik-Ziomek, A.; Radziemska, M.; Dariusz, J.; Białek, M. Chemical and biological properties of sandy loam soil in response to long-term organic-mineral fertilisation in a warm-summer humid continental climate. Agronomy 2020, 10, 1610. [Google Scholar] [CrossRef]
- Domingo-Olivé, F.; Bosch-Serra, À.D.; Yagüe, M.R.; Poch, R.M.; Boixadera, J. Long term application of dairy cattle manure and pig slurry to winter cereals improves soil quality. Nutr. Cycl. Agroecosyst. 2016, 104, 39–51. [Google Scholar] [CrossRef] [Green Version]
- Zavattaro, L.; Bechini, L.; Grignani, C.; van Evert, F.K.; Mallast, J.; Spiegel, H.; Sandén, T.; Pecio, A.; Giráldez Cervera, J.V.; Guzmán, G.; et al. Agronomic effects of bovine manure: A review of long-term European field experiments. Eur. J. Agron. 2017, 90, 127–138. [Google Scholar] [CrossRef]
- Qaswar, M.; Yiren, L.; Jing, H.; Kaillou, L.; Mudasir, M.; Zhenzhen, L.; Hongqian, H.; Xianjin, L.; Jianhua, J.; Ahmed, W.; et al. Soil nutrients and heavy metal availability under long-term combined application of swine manure and synthetic fertilizers in acidic paddy soil. J. Soils Sediments 2020, 20, 2093–2106. [Google Scholar] [CrossRef]
- Věžník, A.; Král, M.; Svobodová, H. Agriculture of the Czech Republic in the 21st century: From productivism to post-productivism. Quaest. Geogr. 2013, 32, 7–14. [Google Scholar] [CrossRef] [Green Version]
- Czech Statistical Office. Statistical yearbook of the Czech Republic 2020; Czech Statistical Office: Prague, Czech Republic, 2021. [Google Scholar]
- Af Geijersstam, L.; Mårtensson, A. Nitrogen fixation and residual effects of field pea intercropped with oats. Acta Agric. Scand. Sect. B Soil Plant Sci. 2006, 56, 186–196. [Google Scholar] [CrossRef]
- Buraczyńska, D.; Ceglarek, F.; Gasiorowska, B.; Zaniewicz-Bajkowska, A.; Płaza, A. Cultivation of wheat following pea and triticale/pea mixtures increases yields and nitrogen content. Acta Agric. Scand. Sect. B Soil Plant Sci. 2011, 61, 622–632. [Google Scholar] [CrossRef]
- Škarpa, P.; Školníková, M.; Antošovský, J.; Horký, P.; Smýkalová, I.; Horáček, J.; Dostálová, R.; Kozáková, Z. Response of normal and low-phytate genotypes of pea (Pisum sativum L.) on phosphorus foliar fertilization. Plants 2021, 10, 1680. [Google Scholar] [CrossRef] [PubMed]
- Wen, G.; Chen, C.; Neill, K.; Wichman, D.; Jackson, G. Yield response of pea, lentil and chickpea to phosphorus addition in a clay loam soil of central Montana. Arch. Agron. Soil Sci. 2008, 54, 69–82. [Google Scholar] [CrossRef]
- Brkić, S.; Milaković, Z.; Kristek, A.; Antunović, M. Pea yield and its quality depending on inoculation, nitrogen and molybdenum fertilization. Plant Soil Environ. 2004, 50, 39–45. [Google Scholar] [CrossRef] [Green Version]
- Deibert, E.J.; Utter, R.A. Field pea growth and nutrient uptake: Response to tillage systems and nitrogen fertilizer applications. Commun. Soil Sci. Plant Anal. 2004, 35, 1141–1165. [Google Scholar] [CrossRef]
- Beck, H.E.; Zimmermann, N.E.; McVicar, T.R.; Vergopolan, N.; Berg, A.; Wood, E.F. Present and future köppen-geiger climate classification maps at 1-km resolution. Sci. Data 2018, 5, 1–12. [Google Scholar] [CrossRef] [Green Version]
- FAOUN. World reference base for soil resources 2014. In International Soil Classification System for Naming Soils and Creating Legends for Soil Maps; FAOUN: Rome, Italy, 2014; ISBN 9789251083697. [Google Scholar]
- Risberg, K.; Cederlund, H.; Pell, M.; Arthurson, V.; Schnürer, A. Comparative characterization of digestate versus pig slurry and cow manure–Chemical composition and effects on soil microbial activity. Waste Manag. 2017, 61, 529–538. [Google Scholar] [CrossRef]
- Kowalski, Z.; Makara, A.; Fijorek, K. Changes in the properties of pig manure slurry. Acta Biochim. Pol. 2013, 60, 845–850. [Google Scholar] [CrossRef] [Green Version]
- Kožnarová, V.; Klabzuba, J. Recommendation of World Meteorological Organization to describing meteorological or climatological conditions-Information. Plant Soil Environ. 2011, 48, 190–192. [Google Scholar] [CrossRef] [Green Version]
- Kirk, P.L. Kjeldahl Method for Total Nitrogen. Anal. Chem. 1950, 22, 354–358. [Google Scholar] [CrossRef]
- Mehlich, A. Mehlich 3 soil test extractant: A modification of Mehlich 2 extractant. Commun. Soil Sci. Plant Anal. 1984, 15, 1409–1416. [Google Scholar] [CrossRef]
- Sims, J.R.; Haby, V.A. Simplified colorimetric determination of soil organic matter. Soil Sci. 1971, 112, 137–141. [Google Scholar] [CrossRef]
- Nelson, D.W.; Sommers, L.E. Total Carbon, Organic Carbon, and Organic Matter. In Total Carbon, Organic Carbon, and Organic Matter: Methods of Soil Analysis Part 3-Chemical Methods; American Society of Agronomy: Madison, WI, USA, 1996; pp. 961–1010. [Google Scholar]
- Arnhold, E. Easynls: Easy Nonlinear Model, R Package Version 5.0. 2017. Available online: https://cran.r-project.org/web/packages/easynls/easynls.pdf (accessed on 11 January 2021).
- Mangiafico, S. Functions to Support Extension Education Program Evaluation; The Comprehensive R Archive Network: Vienna, Austria, 2019; pp. 1–82. [Google Scholar]
- Wickham, H.; Averick, M.; Bryan, J.; Chang, W.; McGowan, L.; François, R.; Grolemund, G.; Hayes, A.; Henry, L.; Hester, J.; et al. Welcome to the Tidyverse. J. Open Source Softw. 2019, 4, 1686. [Google Scholar] [CrossRef]
- Xiang, J.; Haden, V.R.; Peng, S.; Bouman, B.A.M.; Visperas, R.M.; Nie, L.; Huang, J.; Cui, K. Improvement in nitrogen availability, nitrogen uptake and growth of aerobic rice following soil acidification. Soil Sci. Plant Nutr. 2009, 55, 705–714. [Google Scholar] [CrossRef]
- Rutkowska, B.; Szulc, W.; Sosulski, T.; Stępień, W. Soil micronutrient availability to crops affected by long-term inorganic and organic fertilizer applications. Plant Soil Environ. 2014, 60, 198–203. [Google Scholar] [CrossRef]
- An, G.; Miyakawa, S.; Kawahara, A.; Osaki, M.; Ezawa, T. Community structure of arbuscular mycorrhizal fungi associated with pioneer grass species Miscanthus sinensis in acid sulfate soils: Habitat segregation along pH gradients. Soil Sci. Plant Nutr. 2008, 54, 517–528. [Google Scholar] [CrossRef] [Green Version]
- Aciego Pietri, J.C.; Brookes, P.C. Relationships between soil pH and microbial properties in a UK arable soil. Soil Biol. Biochem. 2008, 40, 1856–1861. [Google Scholar] [CrossRef]
- Fan, J.; Ding, W.; Chen, Z.; Ziadi, N. Thirty-year amendment of horse manure and chemical fertilizer on the availability of micronutrients at the aggregate scale in black soil. Environ. Sci. Pollut. Res. 2012, 19, 2745–2754. [Google Scholar] [CrossRef]
- Hoyt, P.B.; Hennig, A.M.F. Soil Acidification By Fertilizers and Longevity of Lime Applications in the Peace River Region. Can. J. Soil Sci. 1982, 62, 155–163. [Google Scholar] [CrossRef]
- Mahler, R.L.; Wilson, S.; Shafii, B.; Price, W. Long-Term Trends of Nitrogen and Phosphorus Use and Soil pH Change in Northern Idaho and Eastern Washington. Commun. Soil Sci. Plant Anal. 2016, 47, 414–424. [Google Scholar] [CrossRef]
- Hoffmann, S.; Berecz, K.; Tóth, Z. Soil fertility as affected by long-term fertilization and crop sequence. Arch. Agron. Soil Sci. 2010, 56, 481–488. [Google Scholar] [CrossRef]
- Macholdt, J.; Piepho, H.P.; Honermeier, B. Mineral NPK and manure fertilisation affecting the yield stability of winter wheat: Results from a long-term field experiment. Eur. J. Agron. 2019, 102, 14–22. [Google Scholar] [CrossRef]
- Körschens, M.; Albert, E.; Armbruster, M.; Barkusky, D.; Baumecker, M.; Behle-Schalk, L.; Bischoff, R.; Čergan, Z.; Ellmer, F.; Herbst, F.; et al. Effect of mineral and organic fertilization on crop yield, nitrogen uptake, carbon and nitrogen balances, as well as soil organic carbon content and dynamics: Results from 20 European long-term field experiments of the twenty-first century. Arch. Agron. Soil Sci. 2013, 59, 1017–1040. [Google Scholar] [CrossRef]
- Shi, R.Y.; Liu, Z.D.; Li, Y.; Jiang, T.; Xu, M.; Li, J.Y.; Xu, R. kou Mechanisms for increasing soil resistance to acidification by long-term manure application. Soil Tillage Res. 2019, 185, 77–84. [Google Scholar] [CrossRef]
- Ning, Q.; Chen, L.; Jia, Z.; Zhang, C.; Ma, D.; Li, F.; Zhang, J.; Li, D.; Han, X.; Cai, Z.; et al. Agriculture, Ecosystems and Environment Multiple long-term observations reveal a strategy for soil pH-dependent fertilization and fungal communities in support of agricultural production. Agric. Ecosyst. Environ. 2020, 293, 106837. [Google Scholar] [CrossRef]
- Xiang, X.; Liu, J.; Zhang, J.; Li, D.; Xu, C.; Kuzyakov, Y. Soil & Tillage Research Divergence in fungal abundance and community structure between soils under long-term mineral and organic fertilization. Soil Tillage Res. 2020, 196, 104491. [Google Scholar] [CrossRef]
- Nobile, C.M.; Bravin, M.N.; Becquer, T.; Paillat, J. Chemosphere Phosphorus sorption and availability in an andosol after a decade of organic or mineral fertilizer applications: Importance of pH and organic carbon modi fi cations in soil as compared to phosphorus accumulation. Chemosphere 2020, 239, 124709. [Google Scholar] [CrossRef]
- Barak, P.; Jobe, B.O.; Krueger, A.R.; Peterson, L.A.; Laird, D.A. Effects of long-term soil acidification due to nitrogen fertilizer inputs in Wisconsin. Plant Soil 1997, 197, 61–69. [Google Scholar] [CrossRef]
- Matějková, Š.; Kumhálová, J.; Lipavský, J. Evaluation of crop yield under different nitrogen doses of mineral fertilization. Plant Soil Environ. 2010, 56, 163–167. [Google Scholar] [CrossRef] [Green Version]
Publisher’s Note: MDPI stays neutral with regard to jurisdictional claims in published maps and institutional affiliations. |
© 2022 by the authors. Licensee MDPI, Basel, Switzerland. This article is an open access article distributed under the terms and conditions of the Creative Commons Attribution (CC BY) license (https://creativecommons.org/licenses/by/4.0/).