
Vegetation Dynamics Due to Urbanization in the Coastal Cities along the Maritime Silk Road


Abstract
:1. Introduction
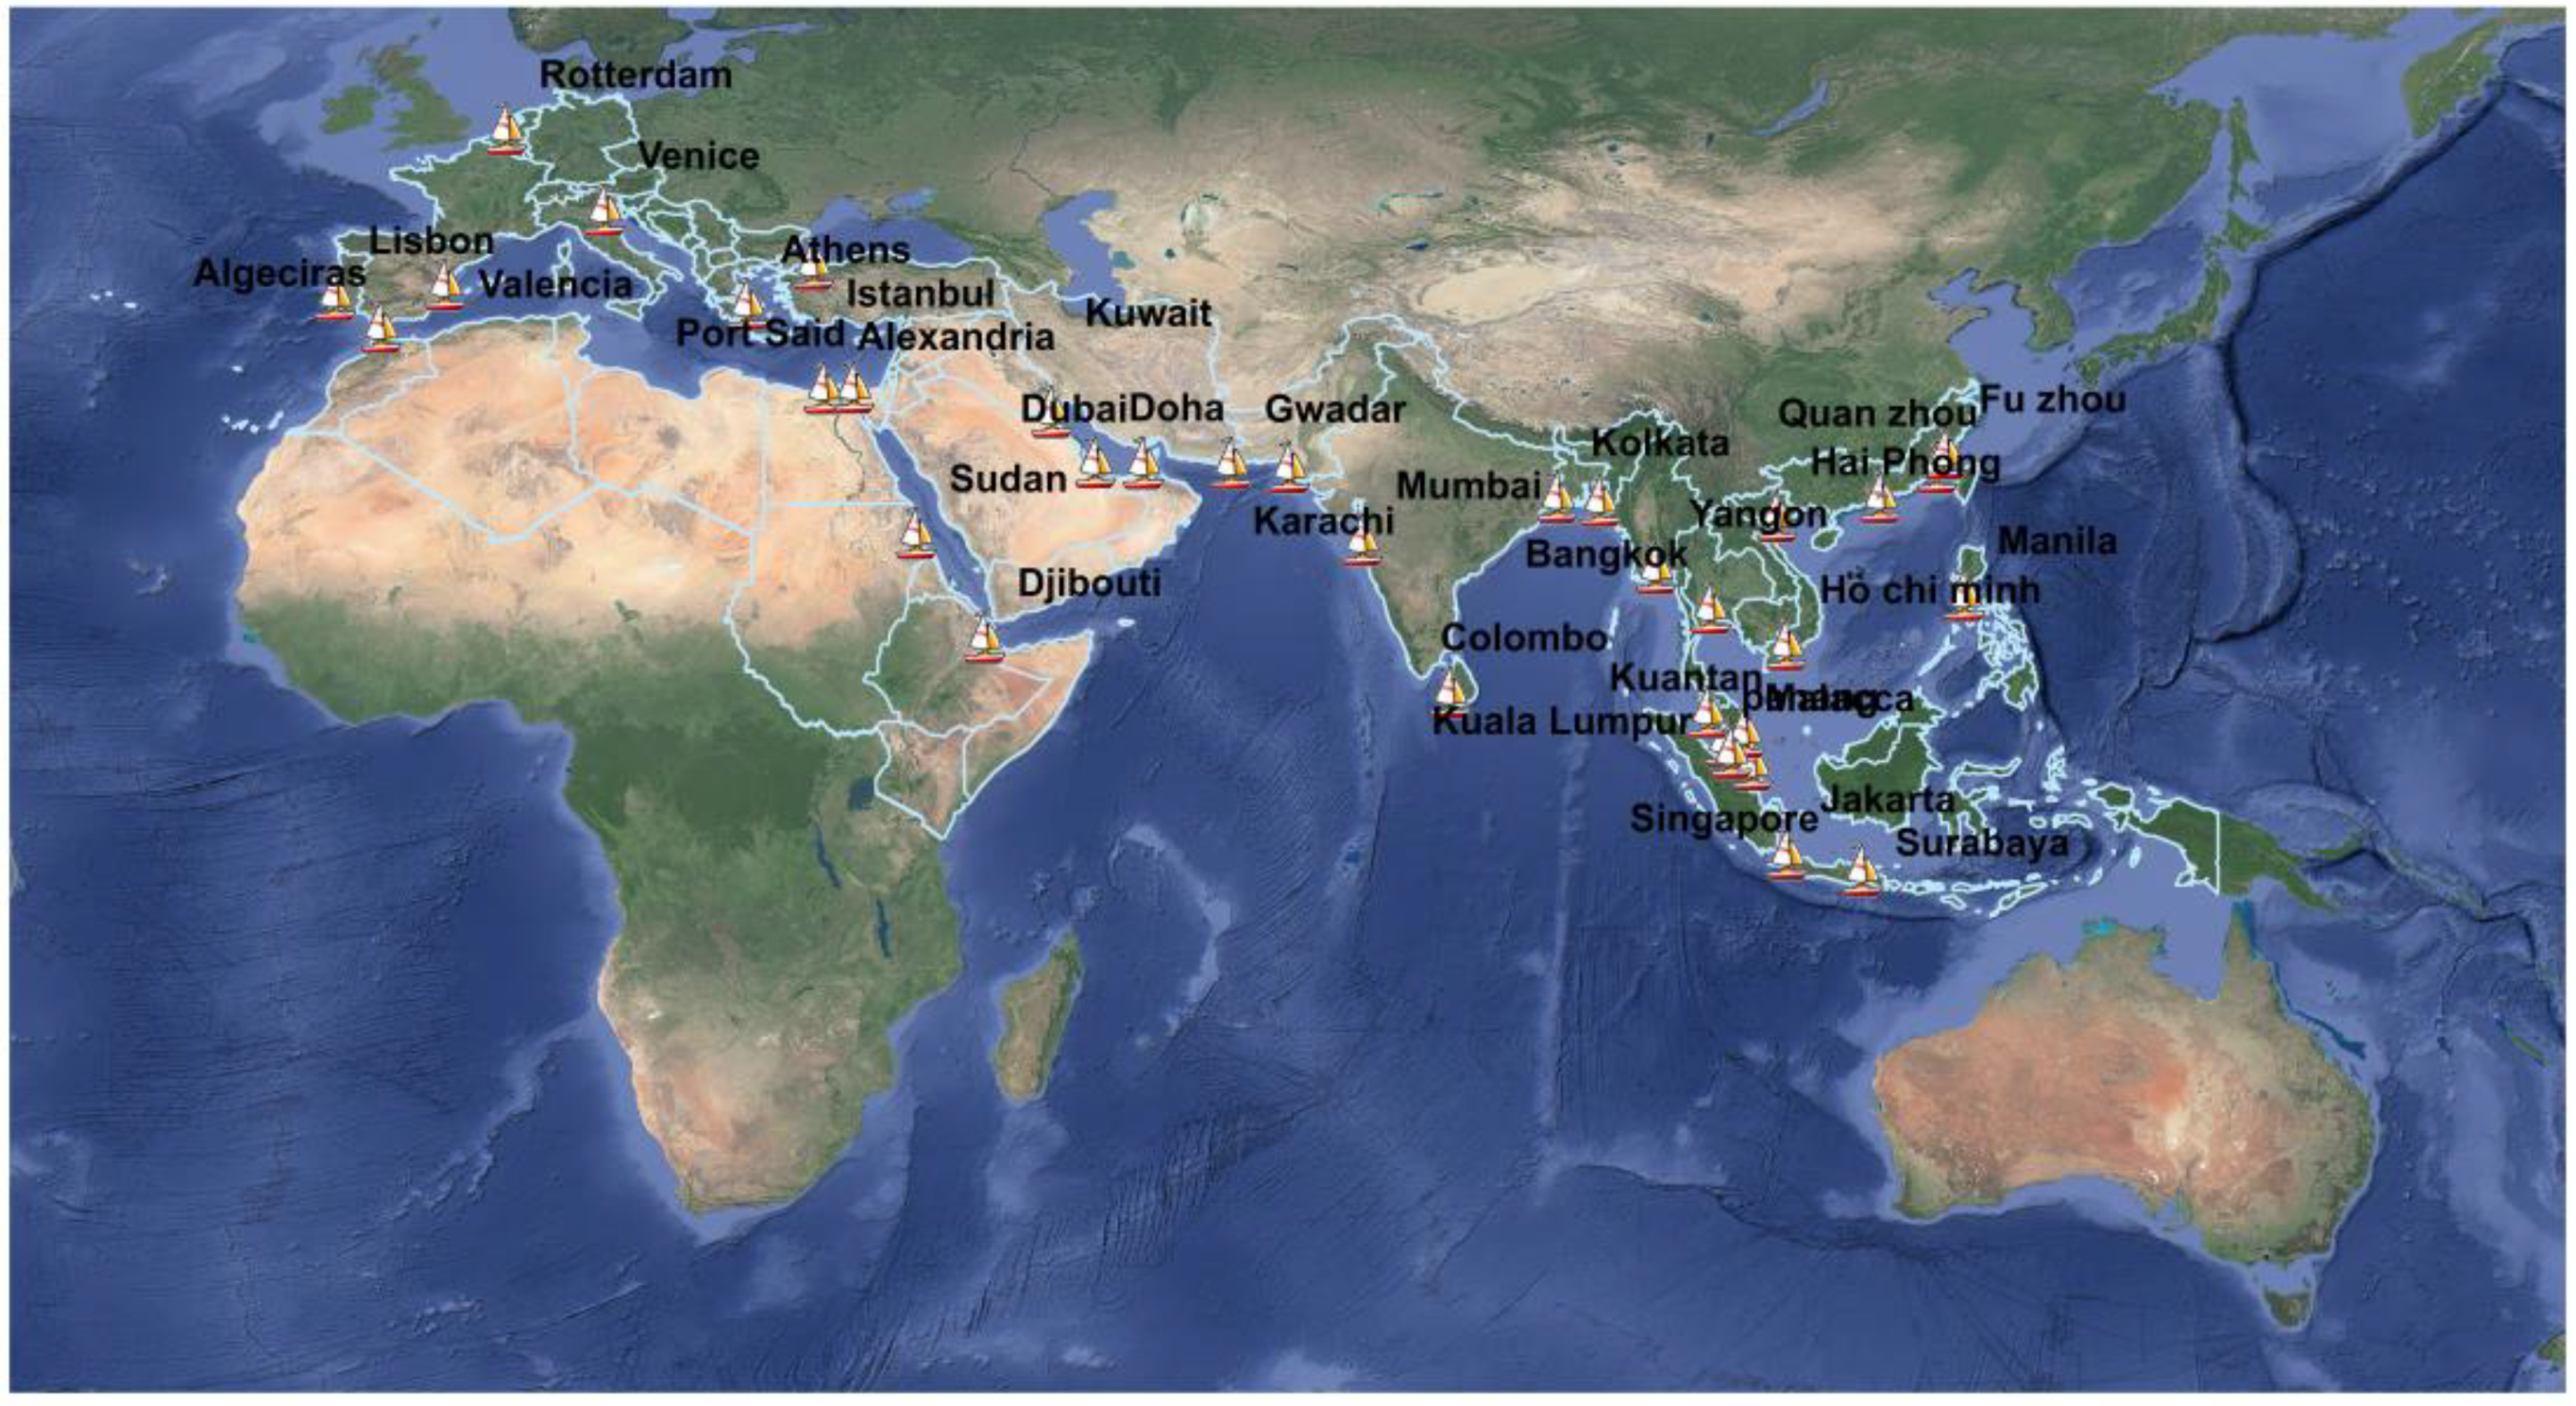
2. Study Area
3. Materials and Methods
3.1. Remotely Sensed Image Acquisition and Processing
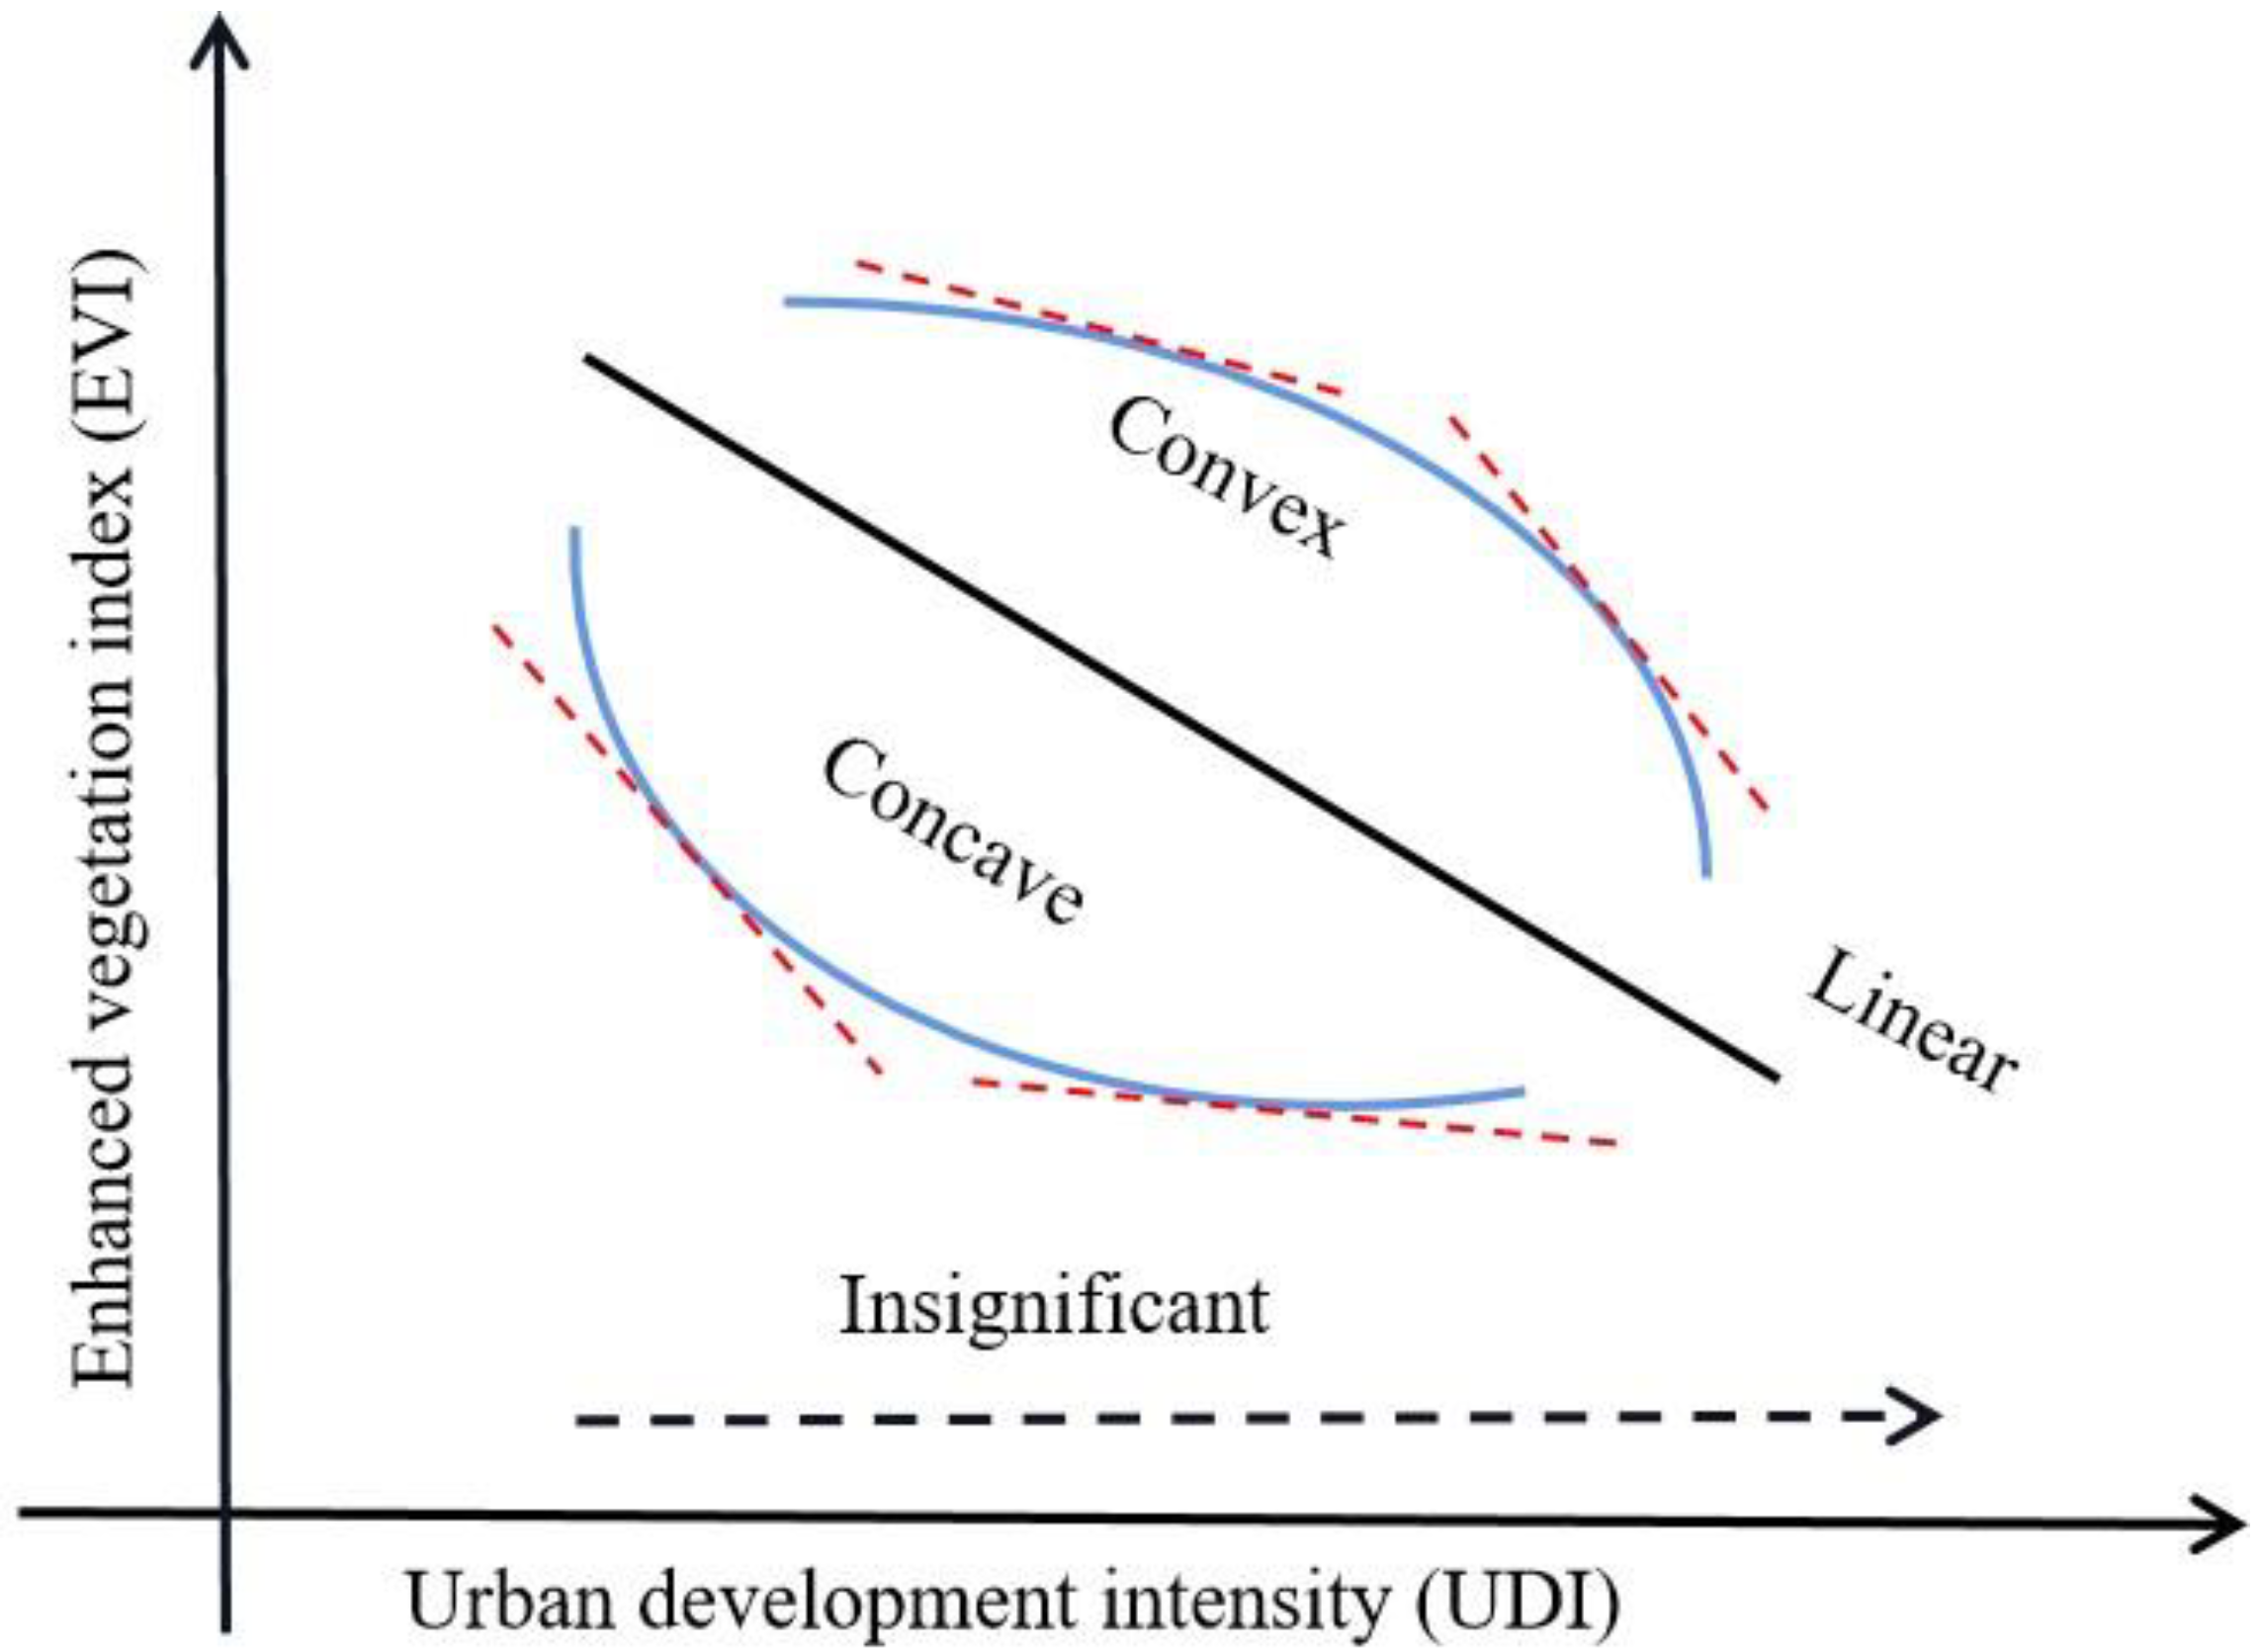
3.2. EVI Trends along Different UDI Gradients
4. Results and Discussion
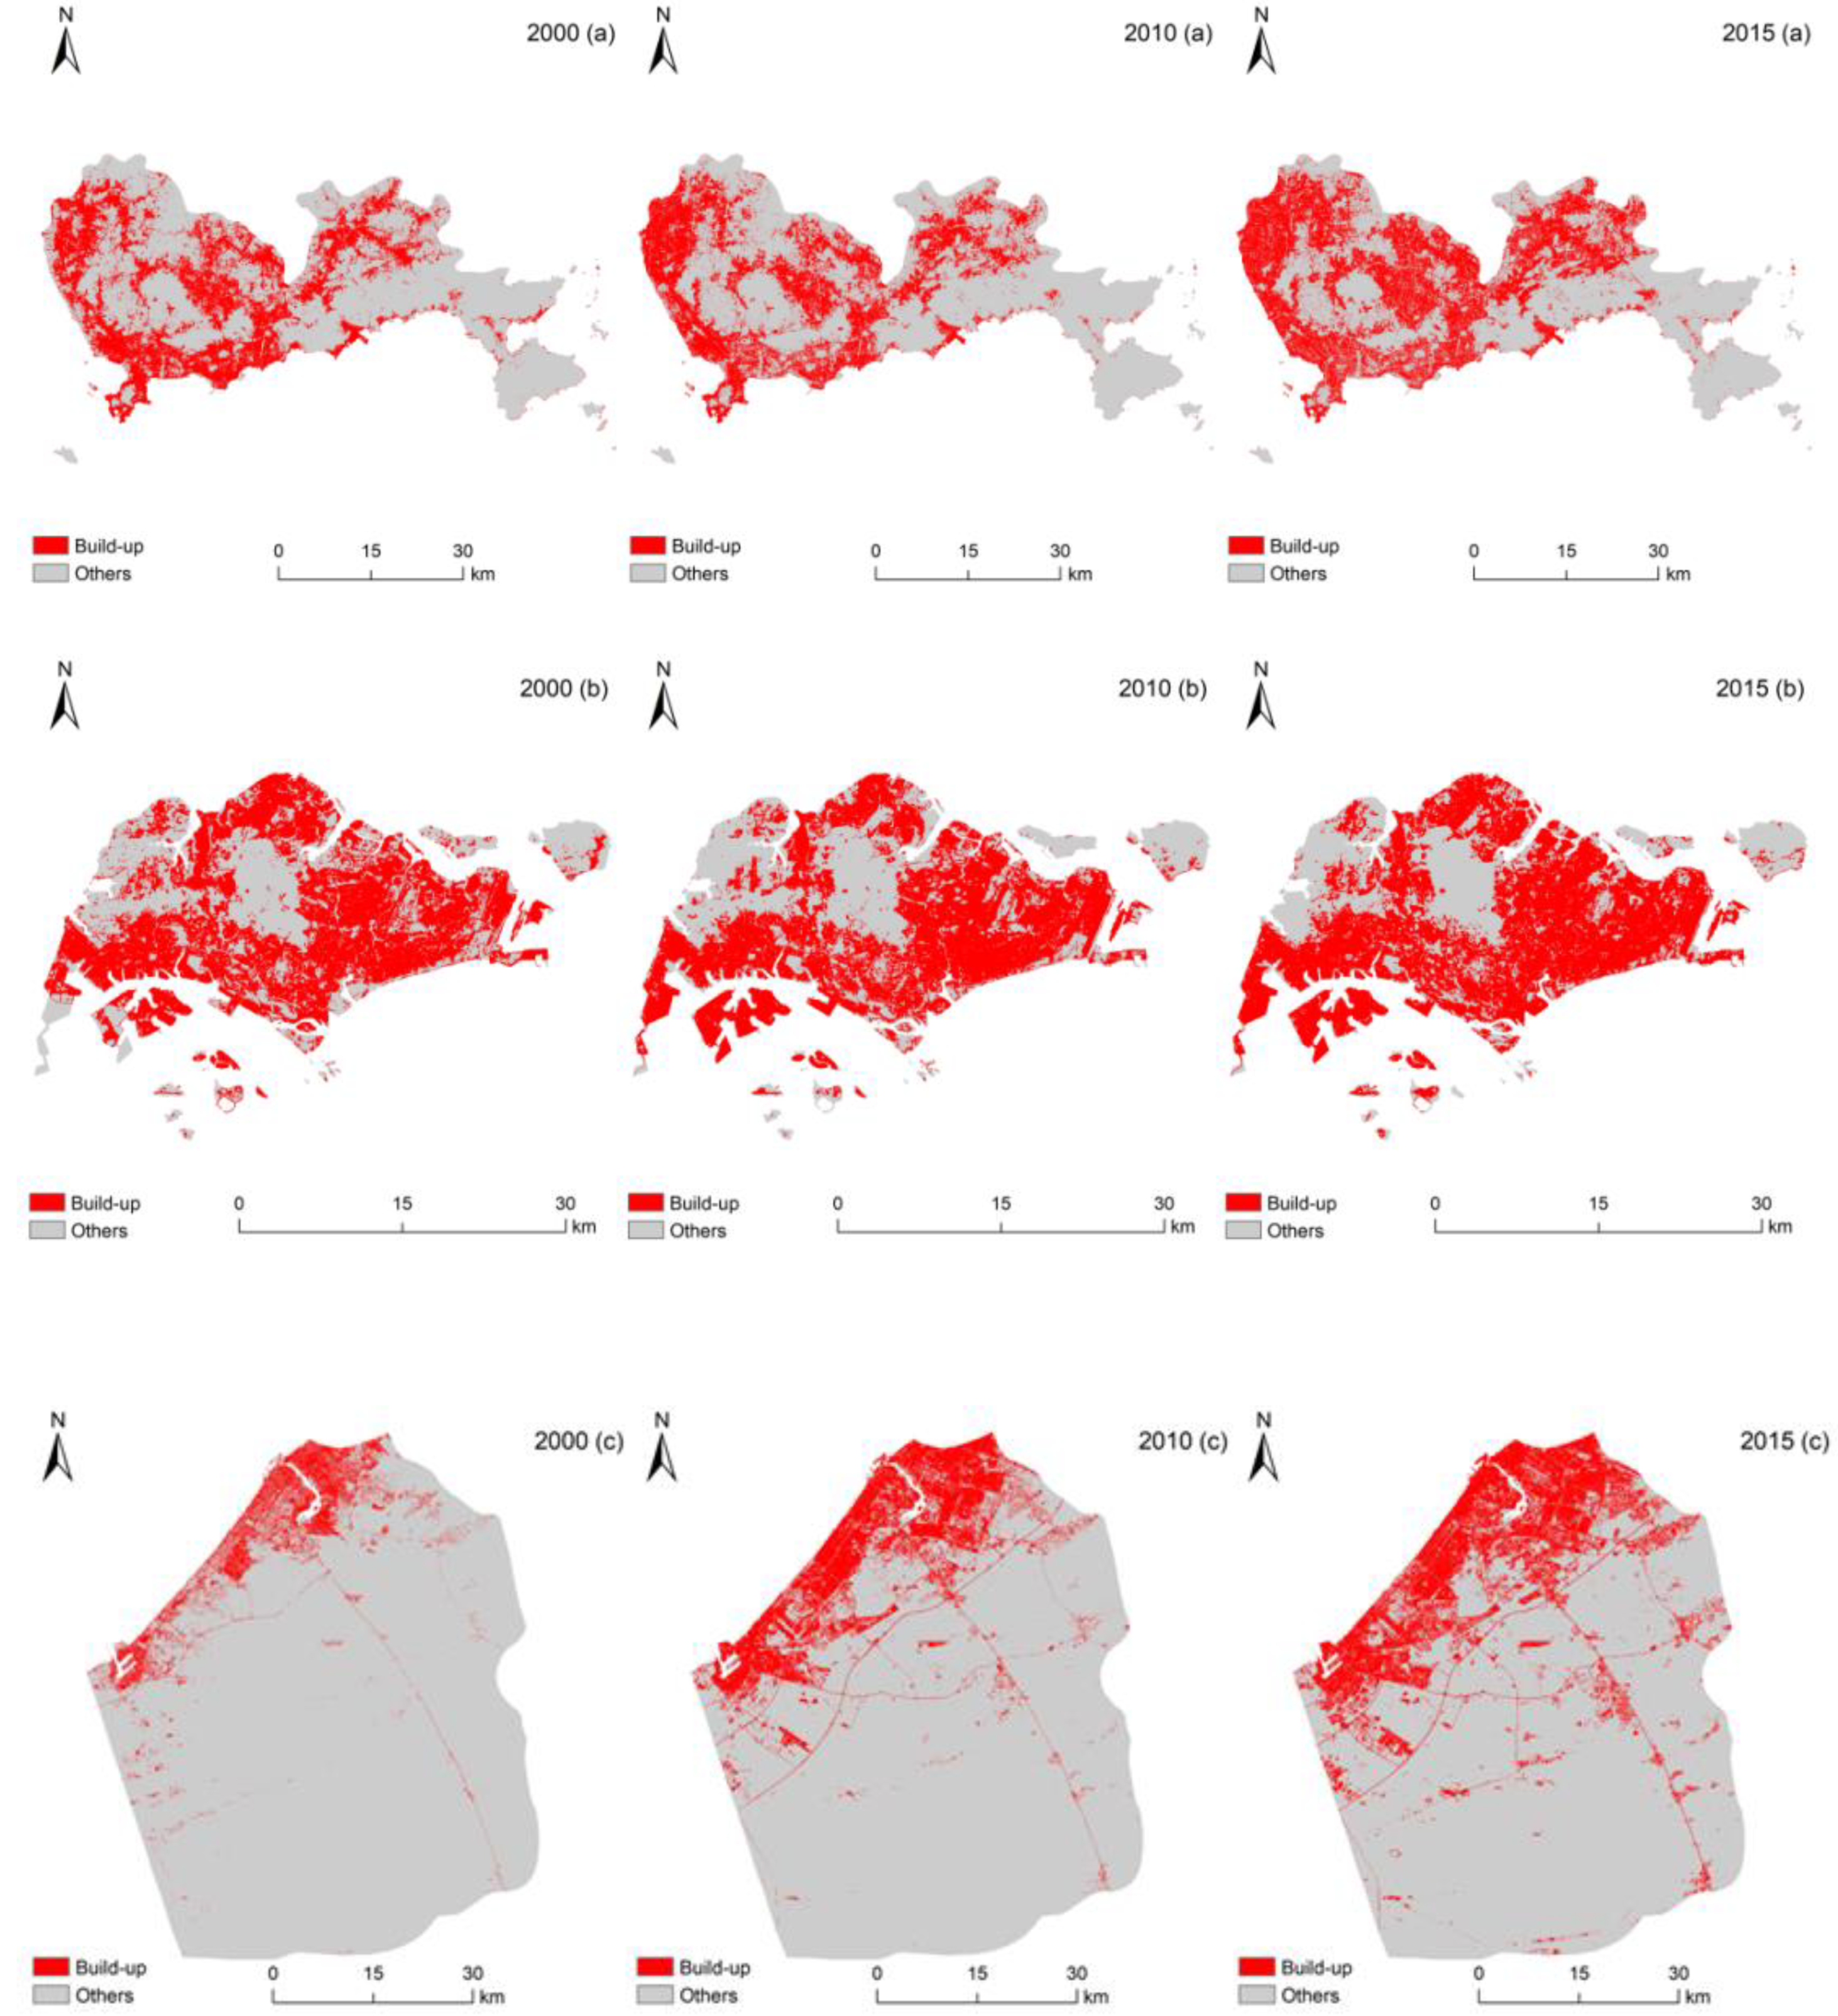
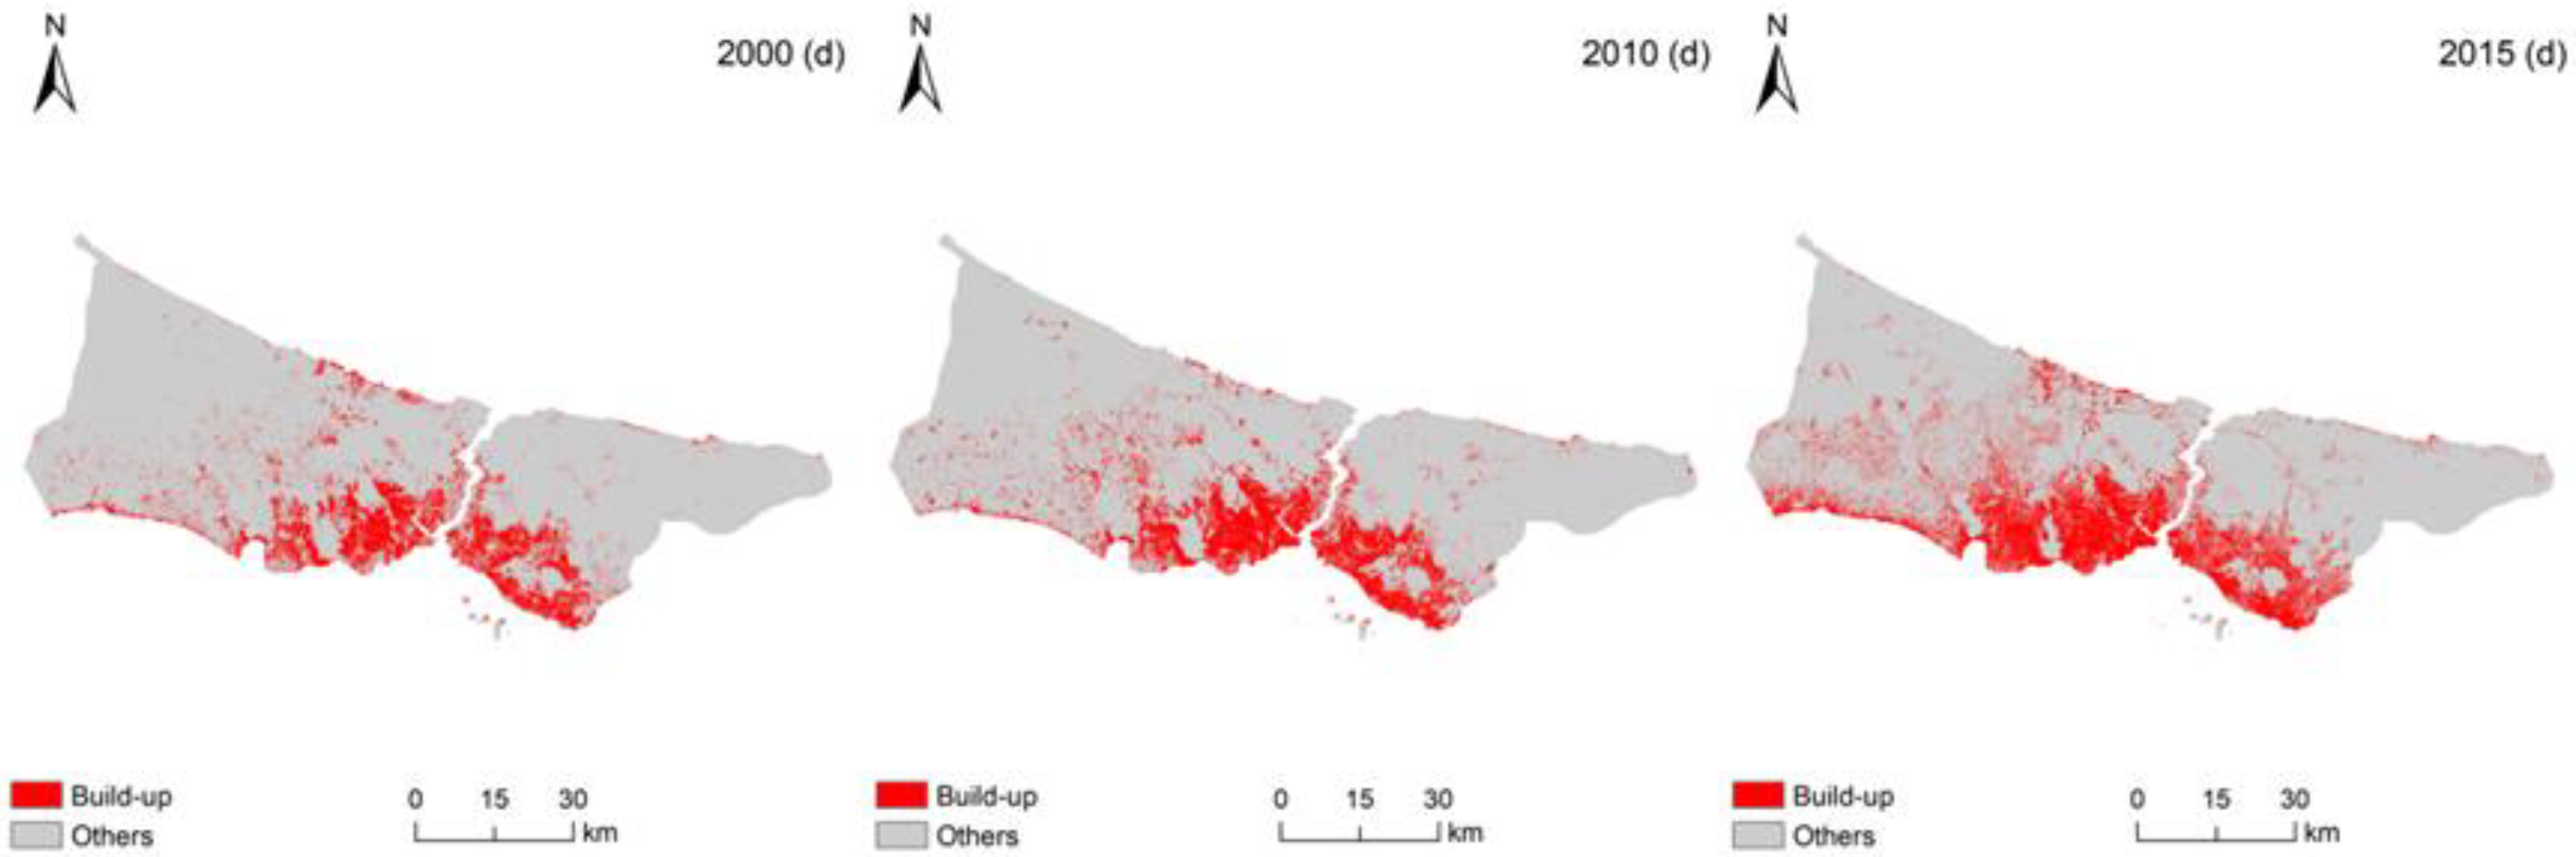
4.1. Urban Change Mapping and Accuracy Assessment
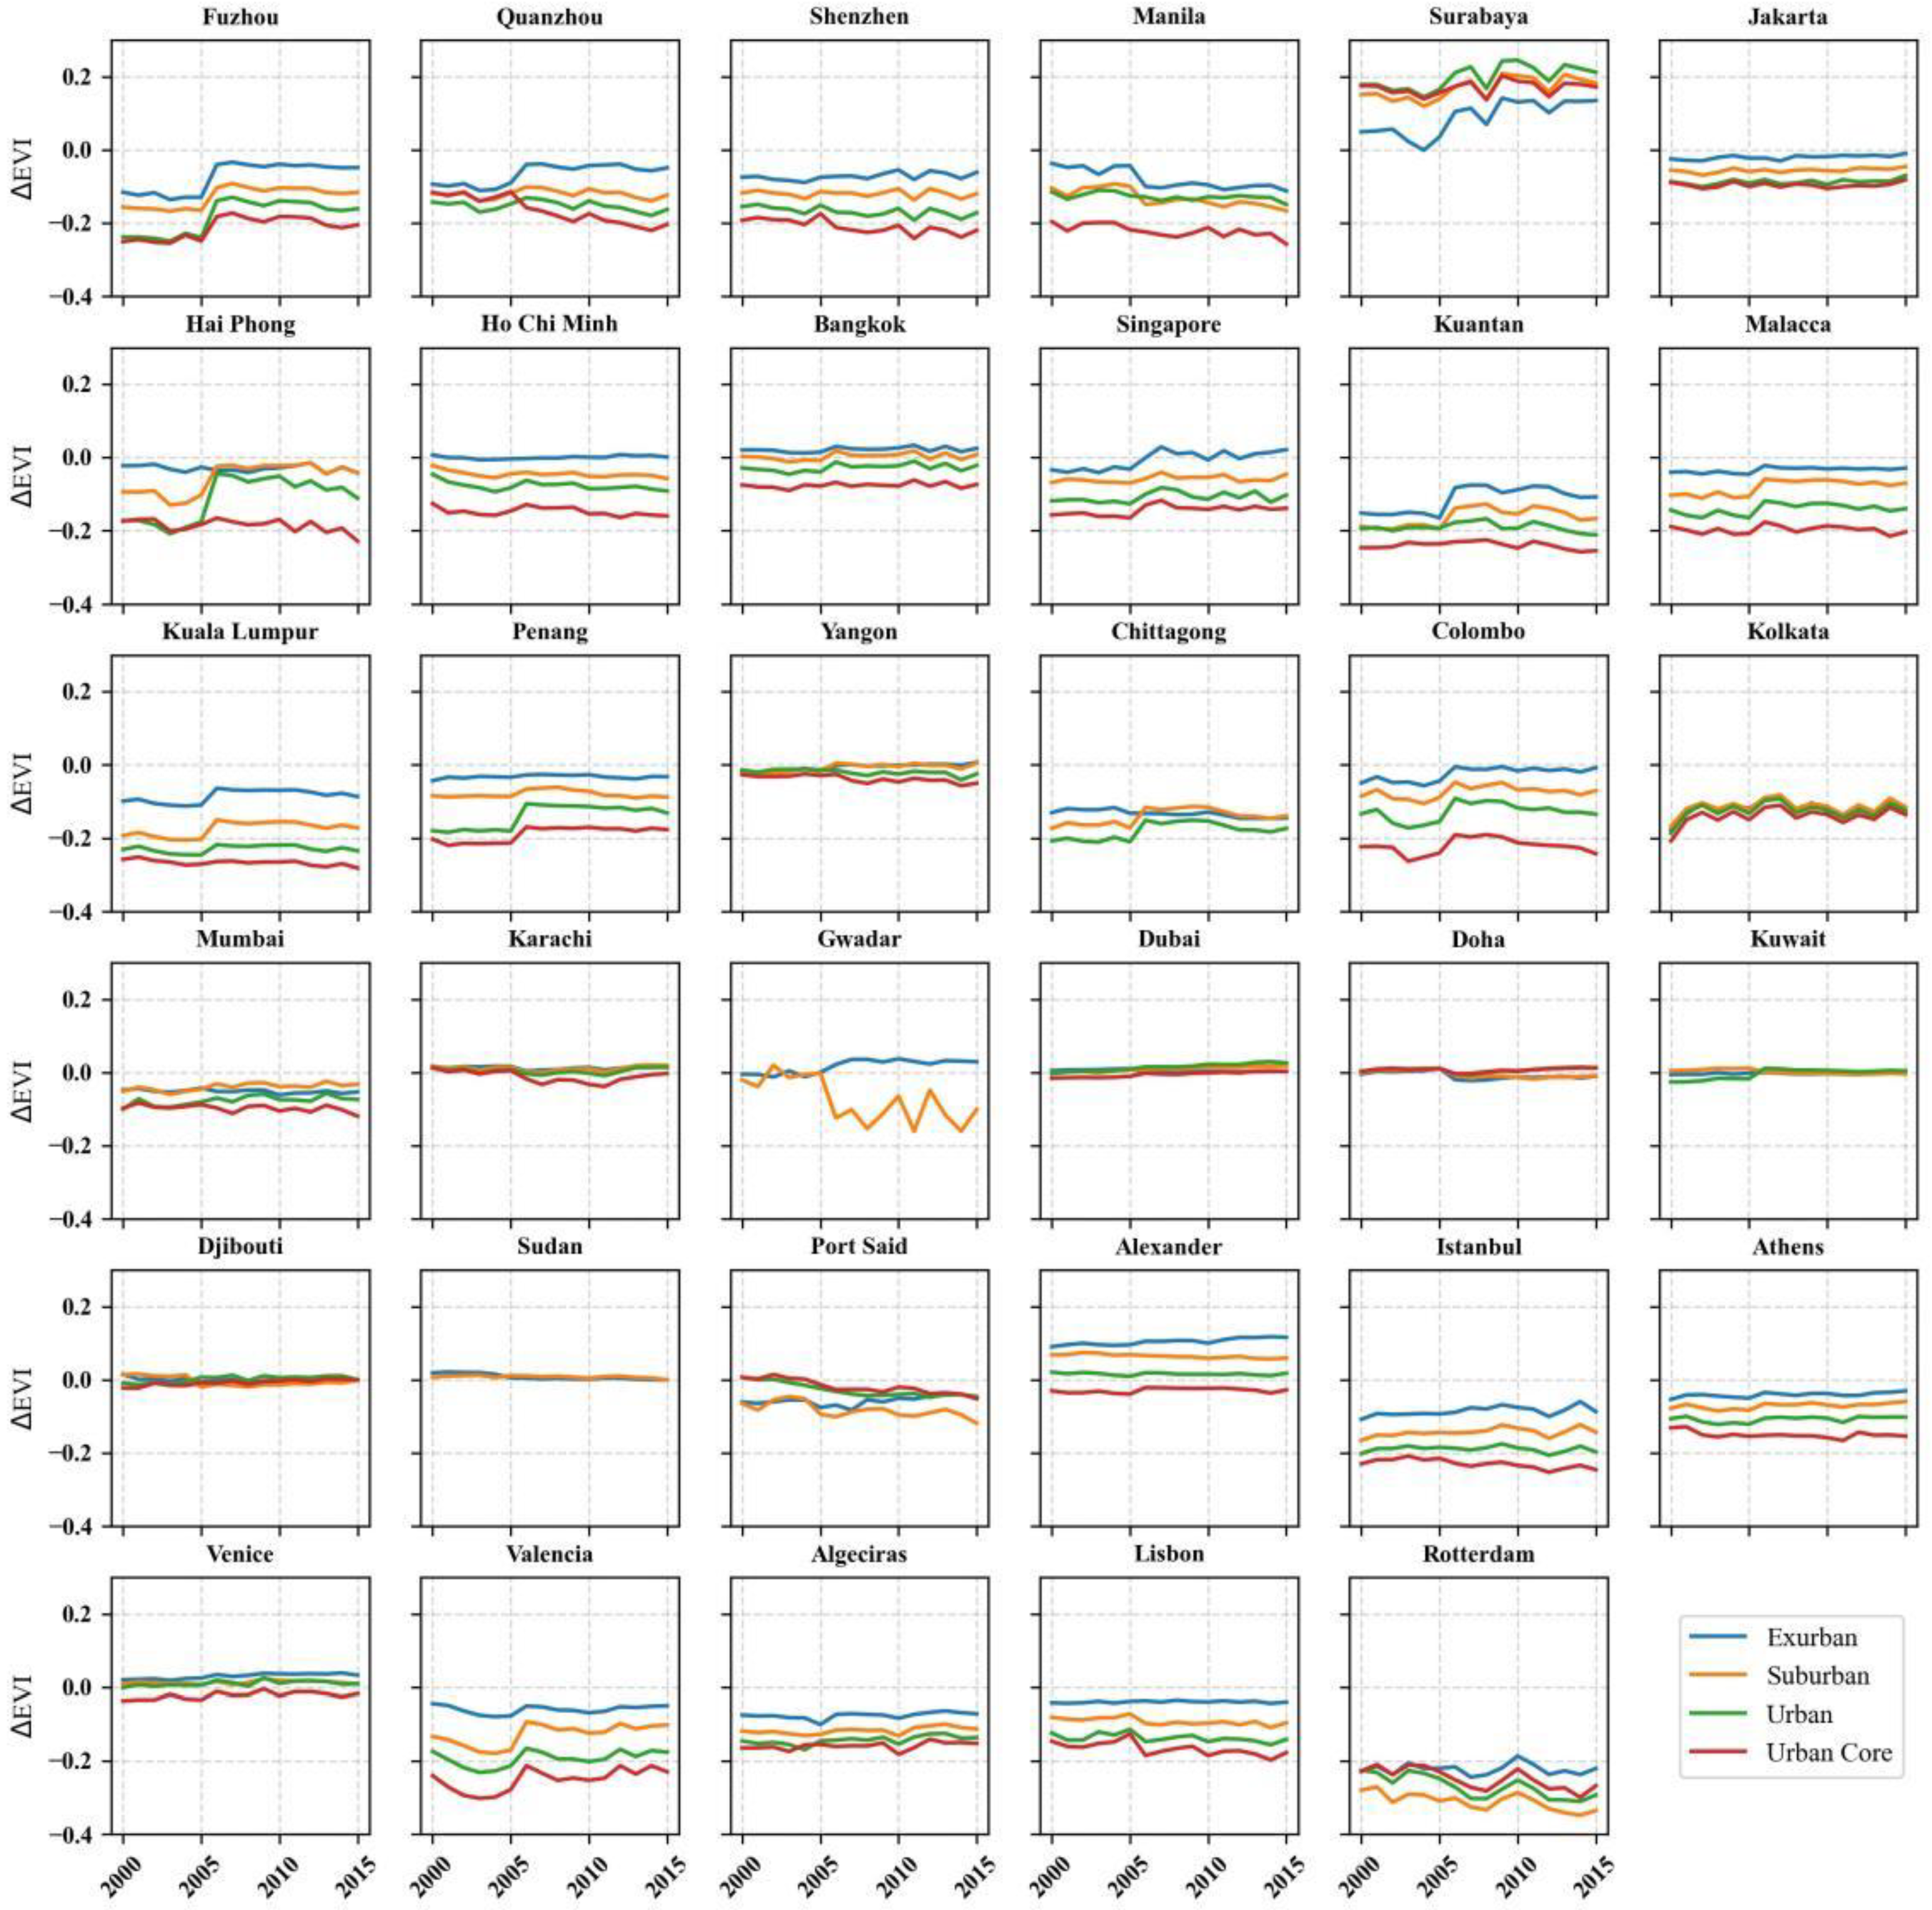
4.2. EVI Temporal Trend along UDI Gradients
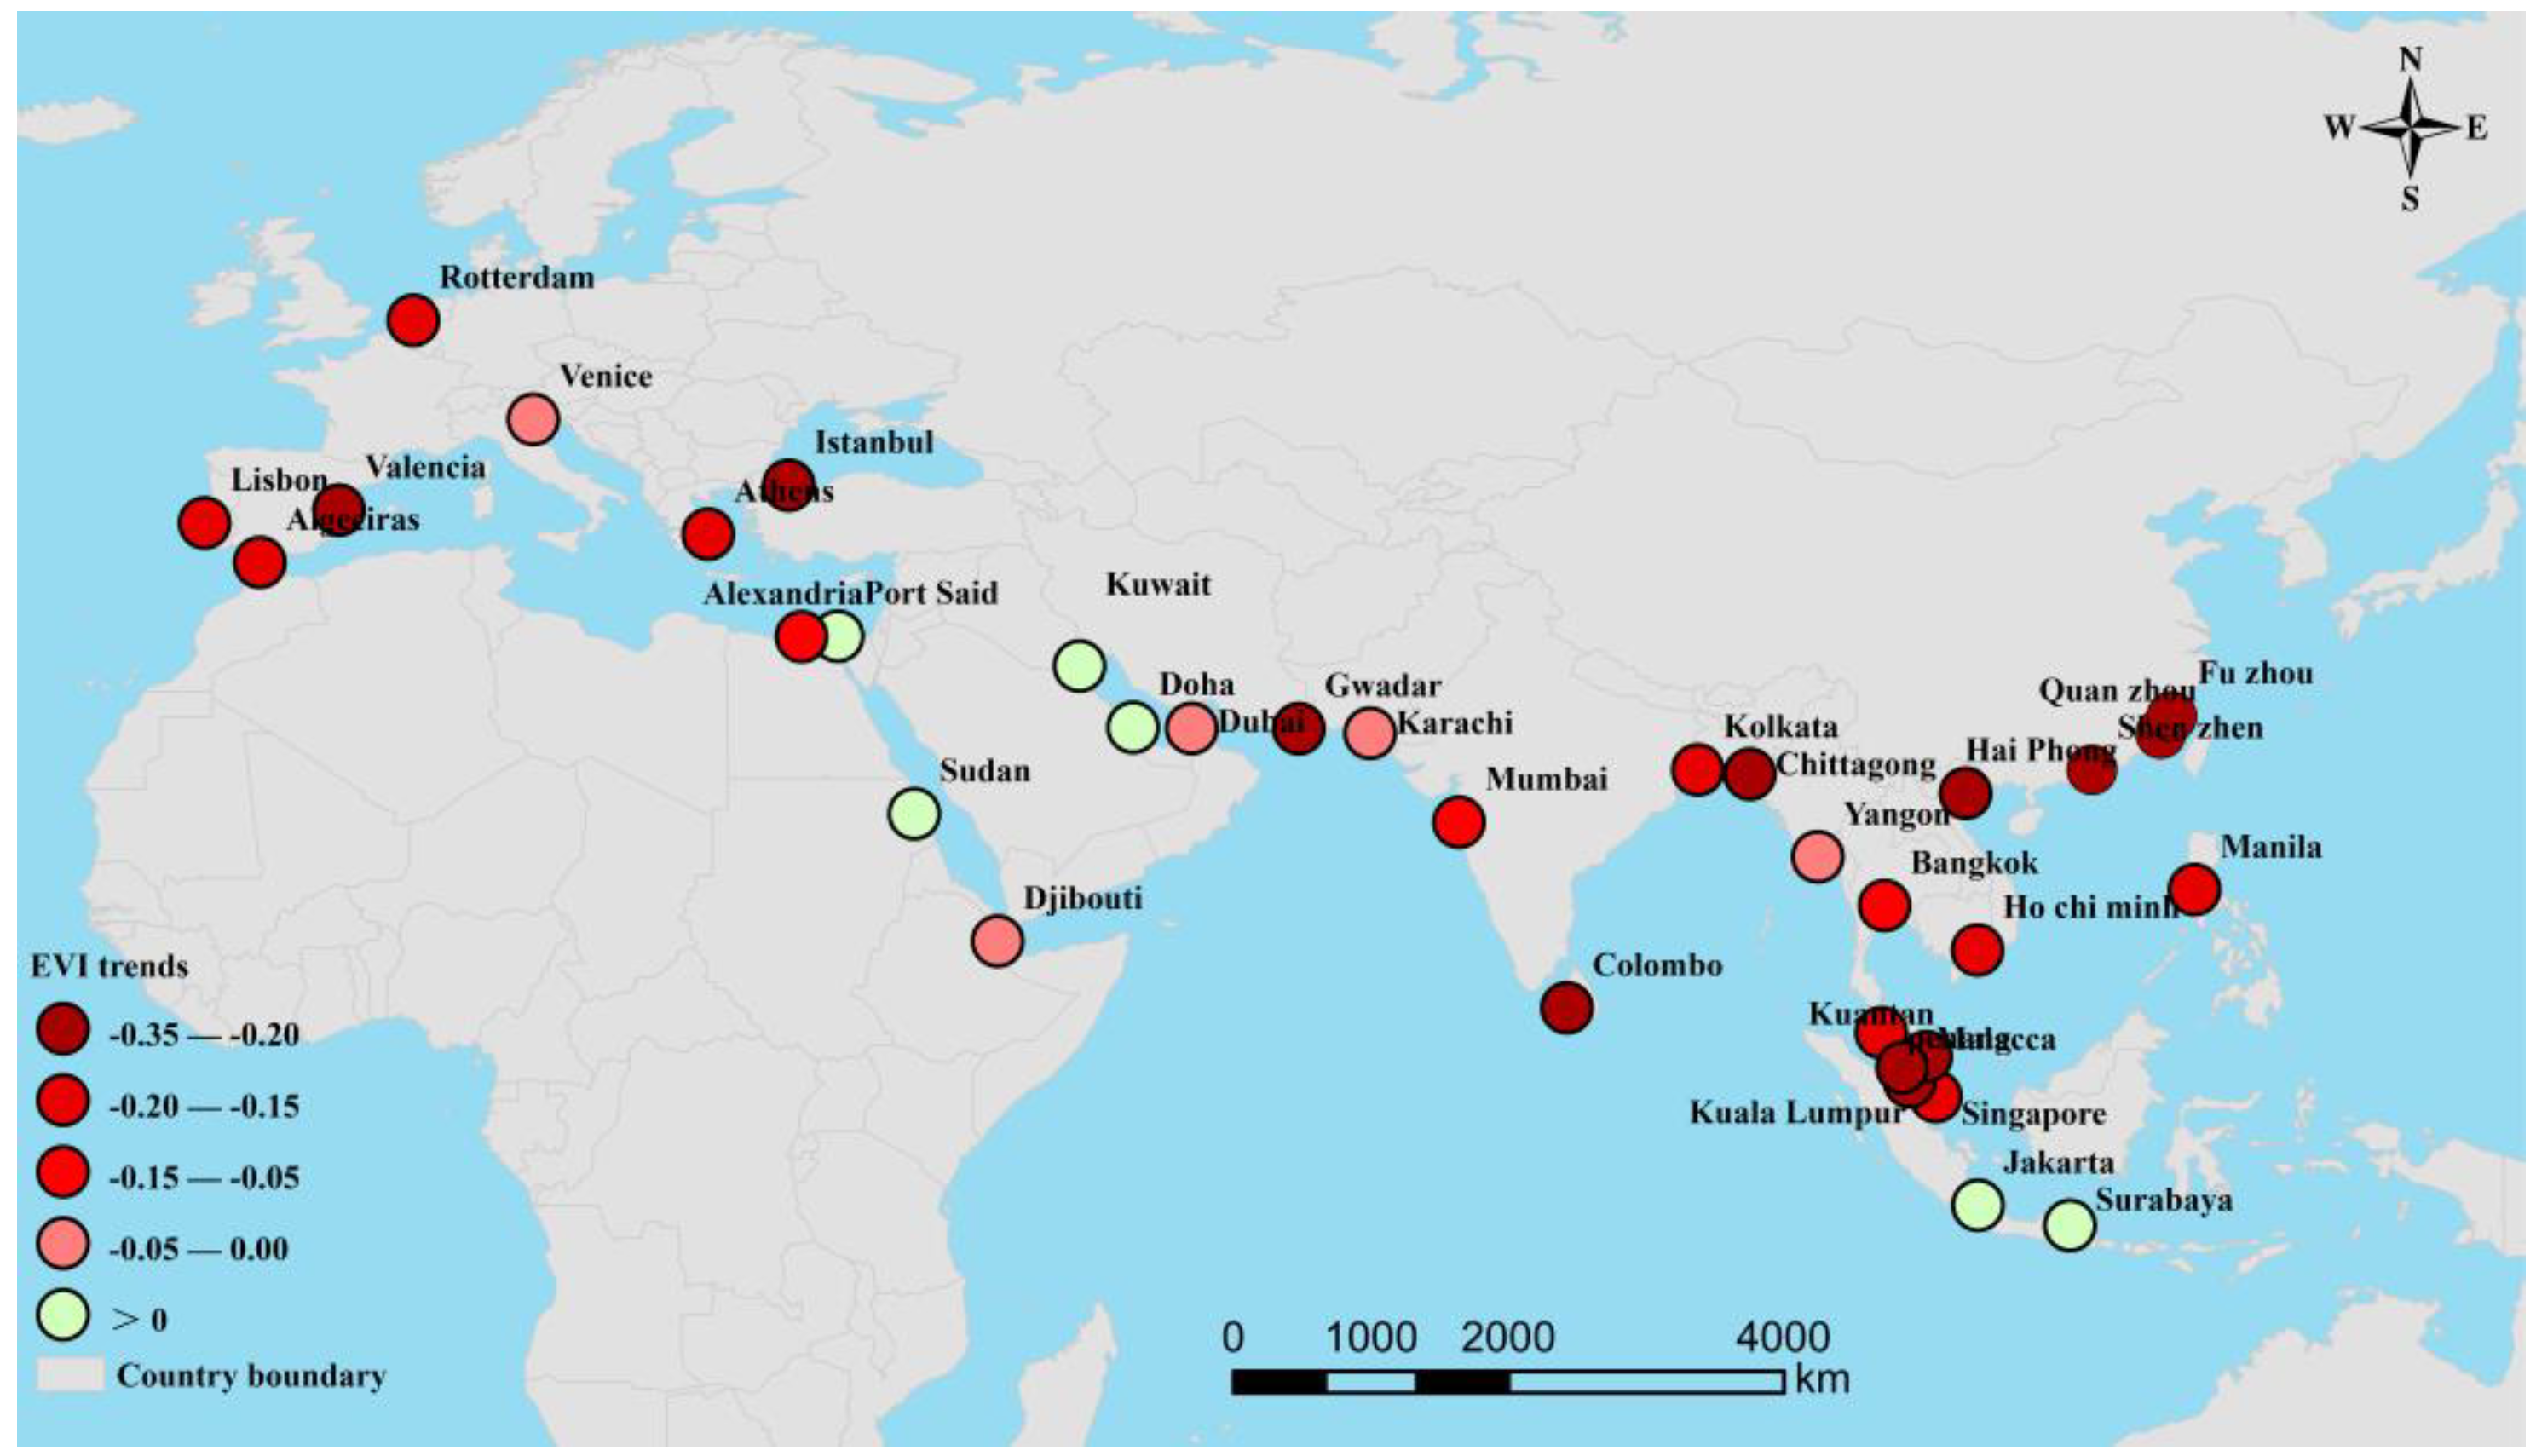
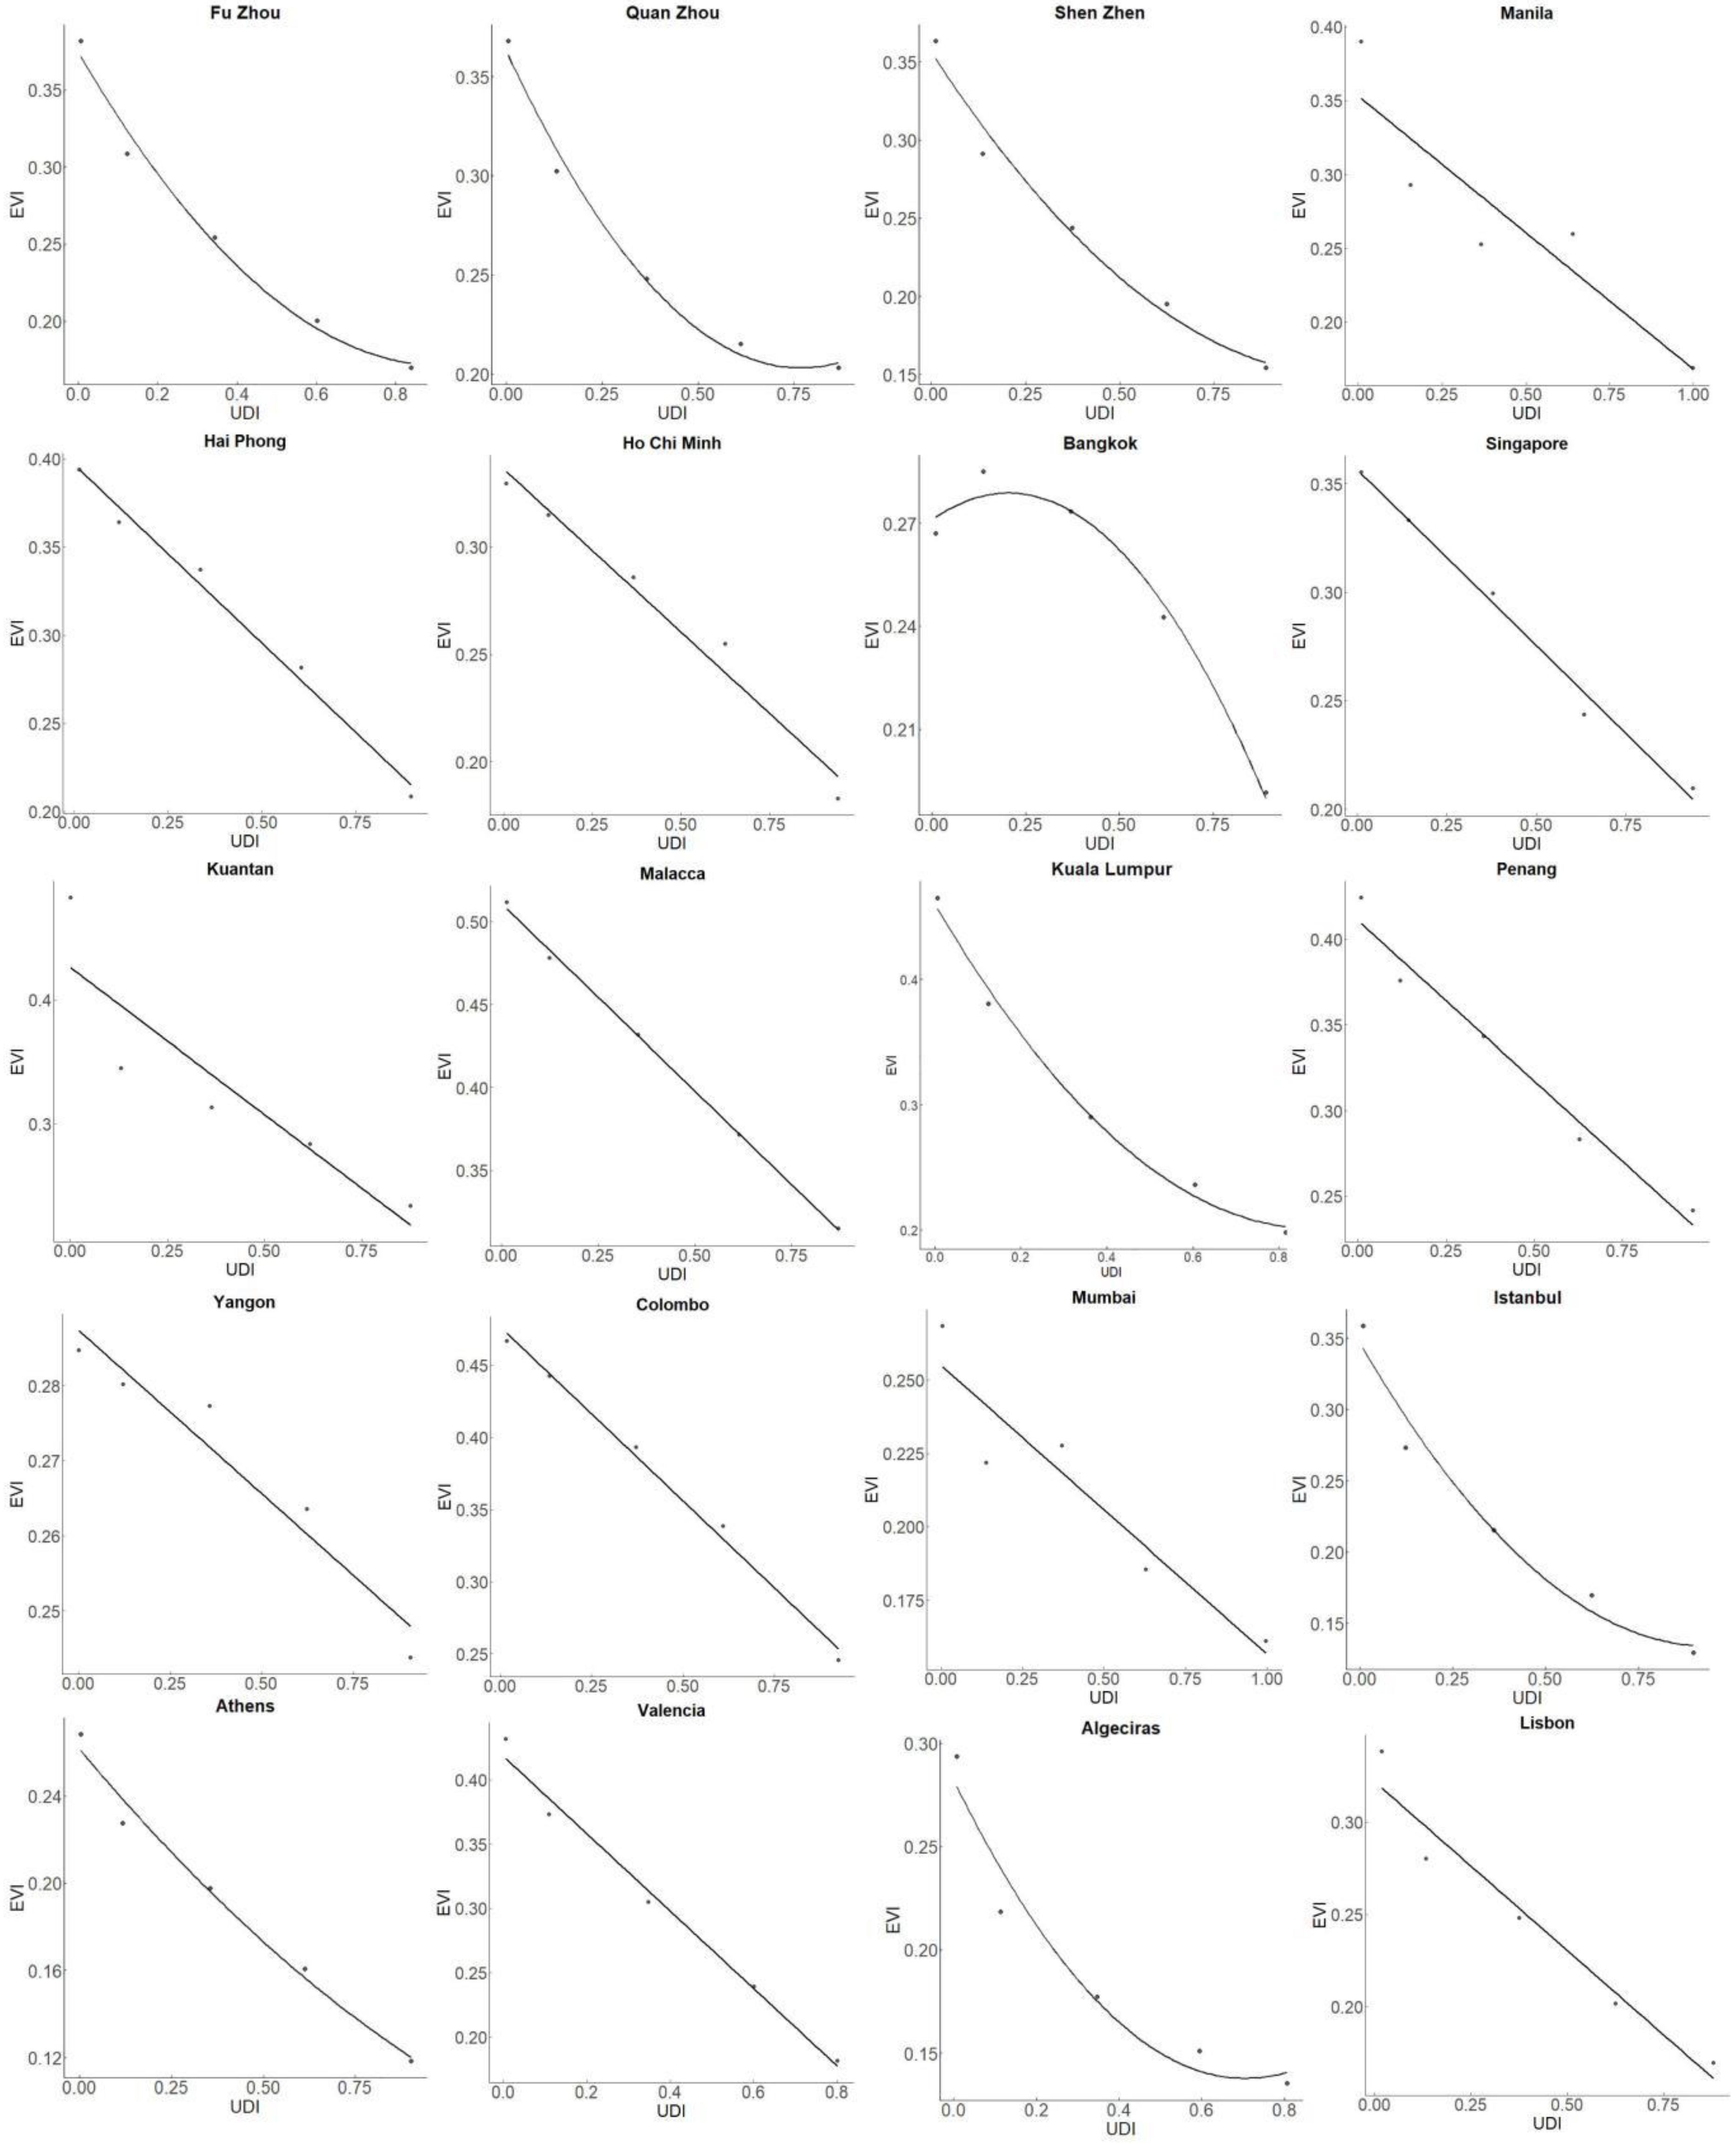
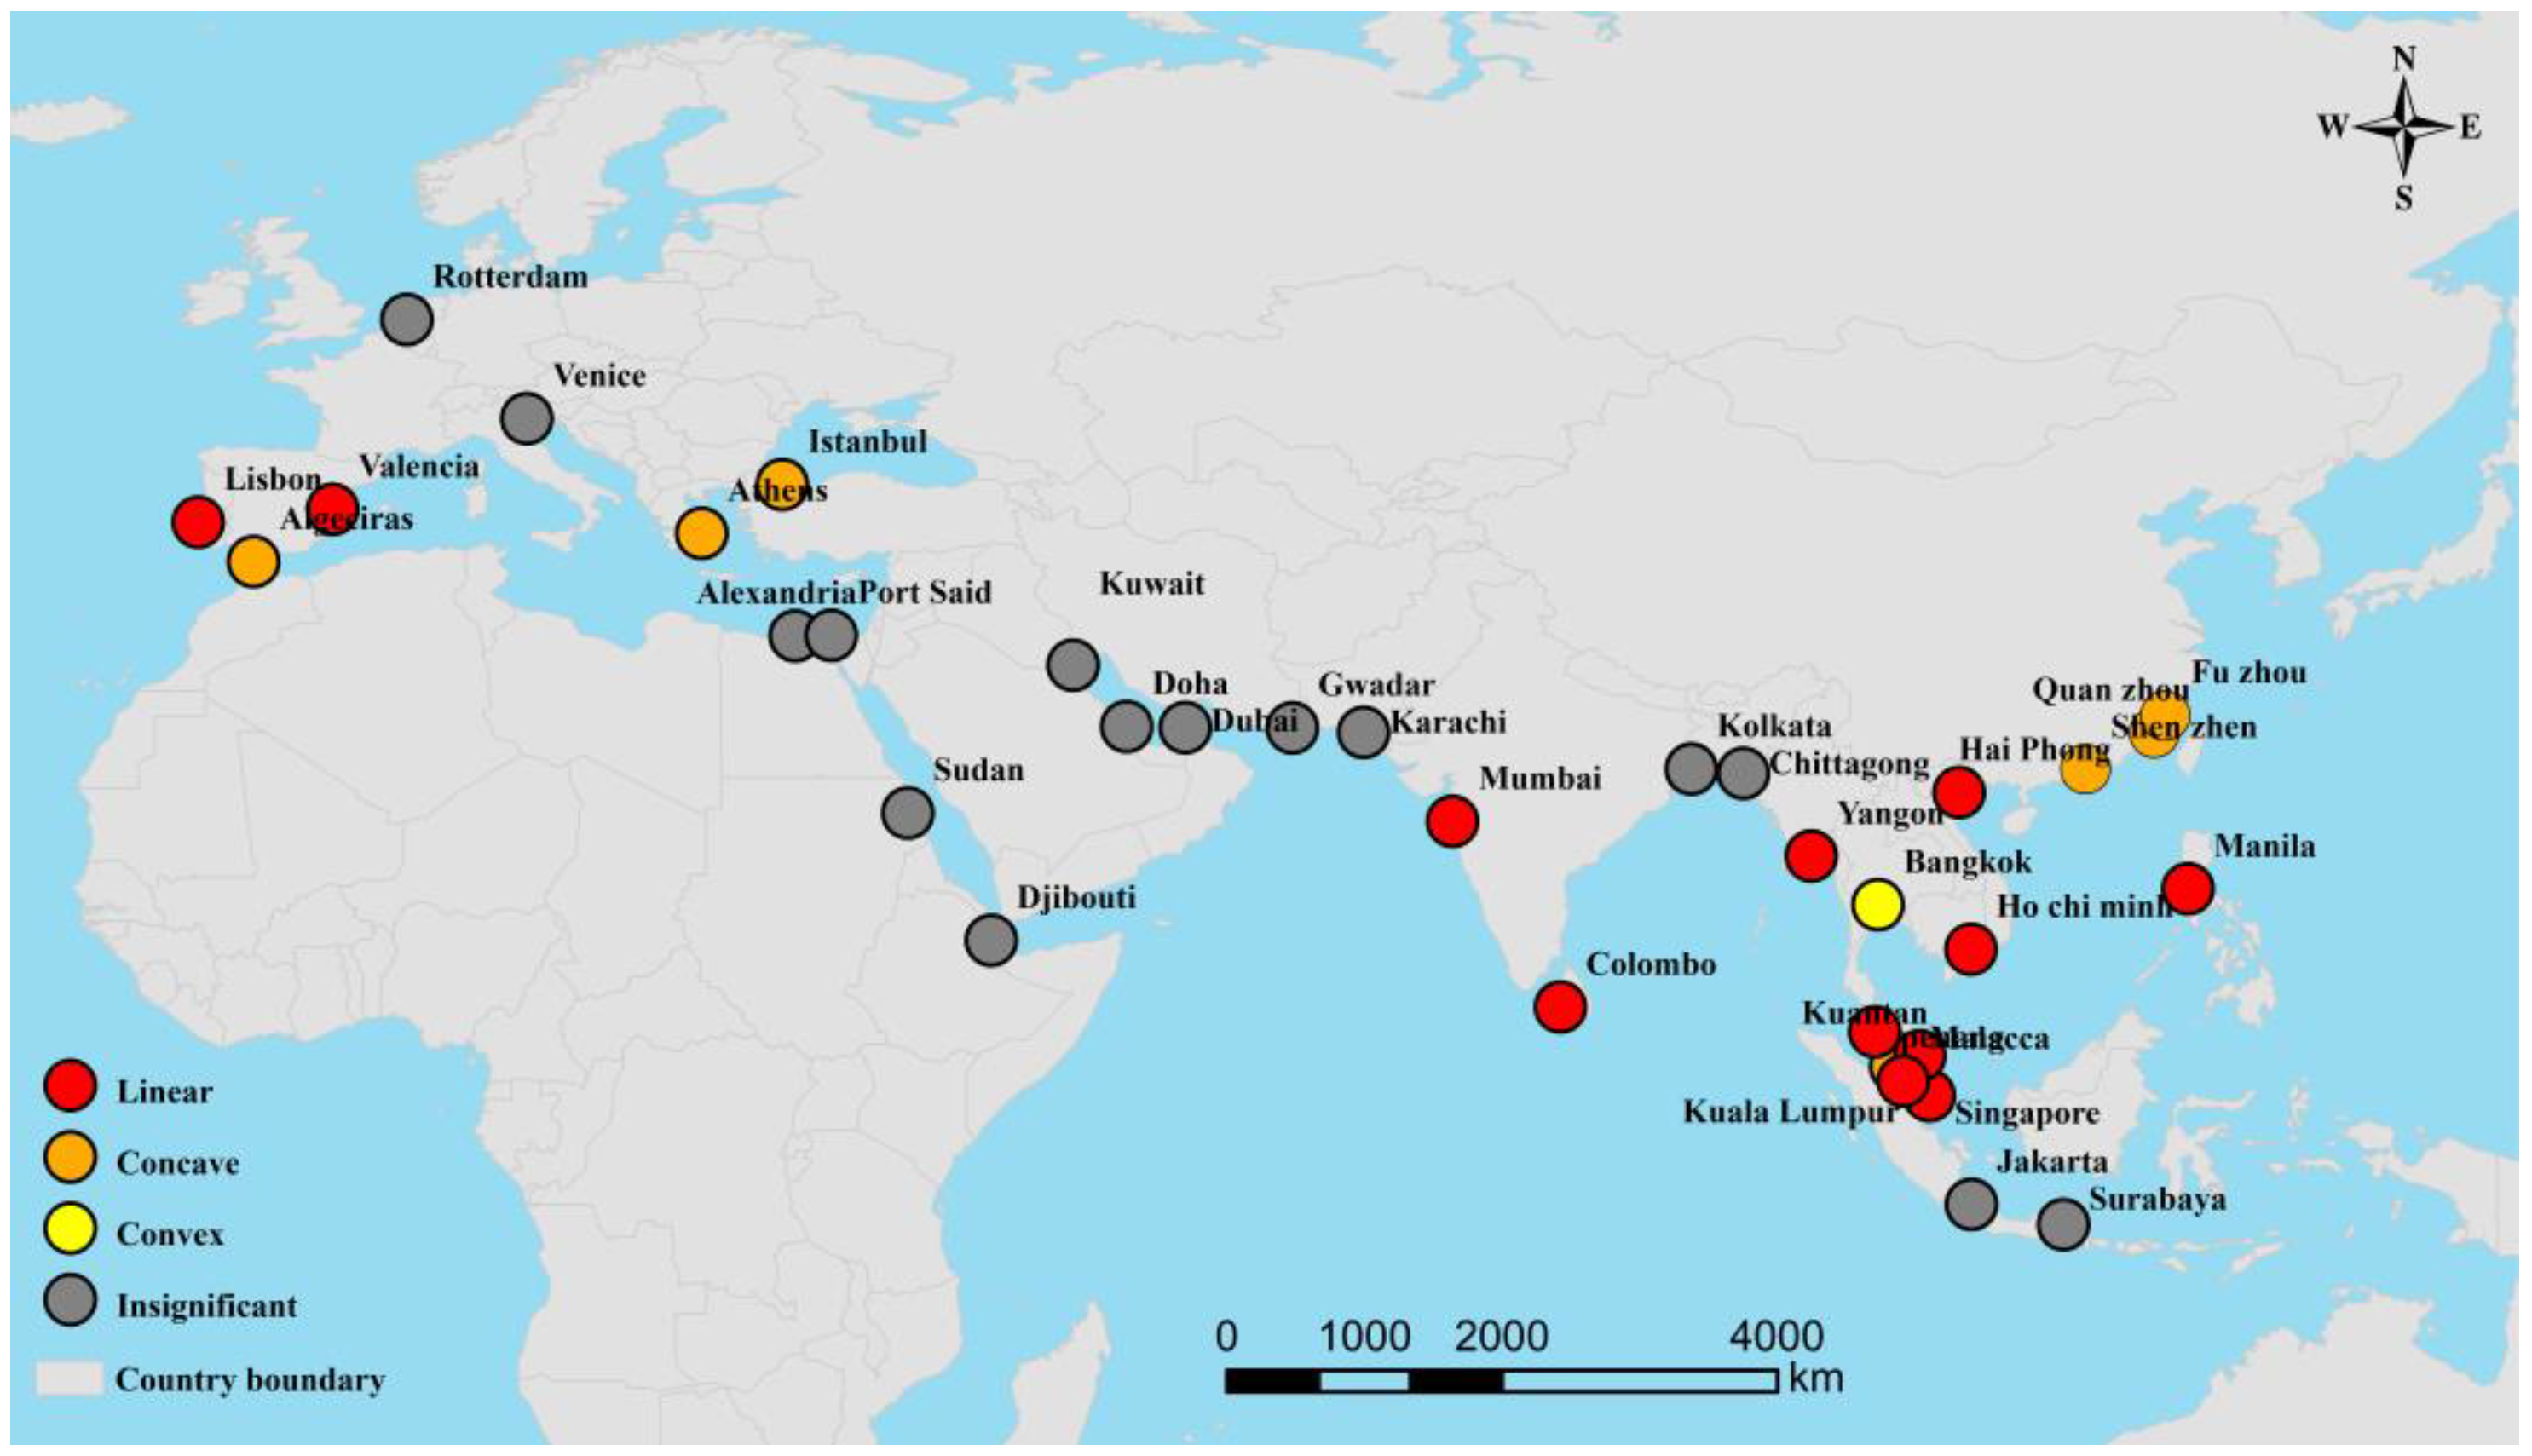
4.3. Spatial Trends of Average EVI under Different Urban Gradients
5. Conclusions and Future Perspective
Author Contributions
Funding
Data Availability Statement
Acknowledgments
Conflicts of Interest
References
- Barragan, J.M.; de Andres, M. Analysis and trends of the world’s coastal cities and agglomerations. Ocean Coast Manag. 2015, 114, 11–20. [Google Scholar] [CrossRef]
- Wang, L.; Zhu, Y.; Ducruet, C.; Bunel, M.; Lau, Y.-Y. From hierarchy to networking: The evolution of the “twenty-first-century Maritime Silk Road” container shipping system. Transp. Rev. 2018, 38, 416–435. [Google Scholar] [CrossRef]
- Zhao, C.; Wang, Y.; Gong, Y.; Brown, S.; Li, R. The evolution of the port network along the Maritime Silk Road: From a sustainable development perspective. Mar. Policy 2021, 126, 104426. [Google Scholar] [CrossRef]
- Zeng, Q.; Wang, G.W.; Qu, C.; Li, K.X. Impact of the Carat Canal on the evolution of hub ports under China’s Belt and Road initiative. Transp. Res. Part. E Logist. Transp. Rev. 2018, 117, 96–107. [Google Scholar] [CrossRef]
- Euzen, A.; Gaill, F.; Lacroix, D.; Cury, P. The Ocean Revealed; CNRS éditions: Paris, France, 2008; pp. 208–209. [Google Scholar]
- Ascensão, F.; Fahrig, L.; Clevenger, A.P.; Corlett, R.; Jaeger, J.A.G.; Laurance, W.F.; Pereira, H.M. Environmental challenges for the belt and road initiative. Nat. Sustain. 2018, 1, 206–209. [Google Scholar] [CrossRef]
- Li, X.; Damen, M.C. Coastline change detection with satellite remote sensing for environmental management of the Pearl River Estuary, China. J. Mar. Syst. 2010, 82, S54–S61. [Google Scholar] [CrossRef]
- Irfan, M.; Houdayer, B.; Shah, H.; Koj, A.; Thomas, H. GIS-based investigation of historic landfill sites in the coastal zones of Wales (UK). Euro-Mediterr. J. Environ. Integr. 2019, 4, 1–10. [Google Scholar] [CrossRef] [Green Version]
- Rees, W.E. Ecological Footprint, Concept of. In Encyclopedia of Biodiversity, 2nd ed.; Levin, S.A., Ed.; Academic Press: Waltham, MA, USA, 2013; Volume 2, pp. 701–713. [Google Scholar]
- Davies, Z.G.; Edmondson, J.L.; Heinemeyer, A.; Leake, J.R.; Gaston, K.J. Mapping an urban ecosystem service: Quantifying above-ground carbon storage at a city-wide scale. J. Appl. Ecol. 2011, 48, 1125–1134. [Google Scholar] [CrossRef] [Green Version]
- Oldfield, E.E.; Warren, R.J.; Felson, A.; Bradford, M. FORUM: Challenges and future directions in urban afforestation. J. Appl. Ecol. 2013, 50, 1169–1177. [Google Scholar] [CrossRef]
- Doick, K.J.; Peace, A.; Hutchings, T.R. The role of one large greenspace in mitigating London’s nocturnal urban heat island. Sci. Total Environ. 2014, 493, 662–671. [Google Scholar] [CrossRef]
- Li, X.; Zhou, X.; Asrar, G.R.; Imhoff, M.; Li, X. The surface urban heat island response to urban expansion: A panel analysis for the conterminous United States. Sci. Total Environ. 2017, 605–606, 426–435. [Google Scholar] [CrossRef]
- Asensi, A.; Garretas, B.D. Coastal vegetation. In The Vegetation of the Iberian Peninsula; Plant and Vegetation Volume 13; Loidi, J., Ed.; Springer: Utrecht, The Netherlands, 2017; pp. 397–432. [Google Scholar]
- Richards, D.R.; Friess, D.A. Rates and drivers of mangrove deforestation in Southeast Asia, 2000–2012. Proc. Natl. Acad. Sci. USA 2016, 113, 344–349. [Google Scholar] [CrossRef] [Green Version]
- Huete, A.; Didan, K.; Miura, T.; Rodriguez, E.P.; Gao, X.; Ferreira, L.G. Overview of the radiometric and biophysical performance of the MODIS vegetation indices. Remote Sens. Environ. 2002, 83, 195–213. [Google Scholar] [CrossRef]
- Chen, B.; Nie, Z.; Chen, Z.; Xu, B. Quantitative estimation of 21st-century urban greenspace changes in Chinese populous cities. Sci. Total Environ. 2017, 609, 956–965. [Google Scholar] [CrossRef] [PubMed]
- Nowak, D.J.; Greenfield, E.J. Tree and impervious cover change in U.S. cities. Urban For. Urban Green. 2012, 11, 21–30. [Google Scholar] [CrossRef] [Green Version]
- Zhao, J.; Chen, S.; Jiang, B.; Ren, Y.; Wang, H.; Vause, J.; Yu, H. Temporal trend of green space coverage in China and its relationship with urbanization over the last two decades. Sci. Total Environ. 2012, 442, 455–465. [Google Scholar] [CrossRef] [PubMed]
- Du, J.; Fu, Q.; Fang, S.; Wu, J.; He, P.; Quan, Z. Effects of rapid urbanization on vegetation cover in the metropolises of China over the last four decades. Ecol. Indic. 2019, 107, 105458. [Google Scholar] [CrossRef]
- Yao, R.; Cao, J.; Wang, L.; Zhang, W.; Wu, X. Urbanization effects on vegetation cover in major African cities during 2001–2017. Int. J. Appl. Earth Obs. 2019, 75, 44–53. [Google Scholar] [CrossRef]
- Krina, A.; Xystrakis, F.; Karantininis, K.; Koutsias, N. Monitoring and projecting land use/land cover changes of eleven large deltaic areas in Greece from 1945 onwards. Remote Sens. 2020, 12, 1241. [Google Scholar] [CrossRef] [Green Version]
- Ritchie, H.; Roser, M.; Urbanization. Published Online at OurWorldInData.org. Available online: https://ourworldindata.org/urbanization (accessed on 10 November 2021).
- United Nations, Department of Economic and Social Affairs, Population Division. World Urbanization Prospects: The 2014 Revision, Highlights; United Nations: New York, NY, USA, 2014. [Google Scholar]
- Zhou, D.; Zhao, S.; Liu, S.; Zhang, L. Spatiotemporal trends of terrestrial vegetation activity along the urban development intensity gradient in China’s 32 major cities. Sci. Total Environ. 2014, 488–489, 136–145. [Google Scholar] [CrossRef]
- Yuan, F.; Bauer, M.E. Comparison of impervious surface area and normalized difference vegetation index as indicators of surface urban heat island effects in Landsat imagery. Remote Sens. Environ. 2007, 106, 375–386. [Google Scholar] [CrossRef]
- Luck, G.W.; Smallbone, L.T.; O’Brien, R. Socio-economics and vegetation change in urban ecosystems: Patterns in space and time. Ecosystems 2009, 12, 604–620. [Google Scholar] [CrossRef]
- Dallimer, M.; Tang, Z.; Bibby, P.R.; Brindley, P.; Gaston, K.J.; Davies, Z.G. Temporal changes in greenspace in a highly urbanized region. Biol. Lett. 2011, 7, 763–766. [Google Scholar] [CrossRef]
- Janssen, L.L.F.; Vanderwel, F.J.M. Accuracy assessment of satellite derived land-cover data: A review. Photogramm. Eng. Remote Sens. 1994, 60, 419–426. [Google Scholar]
- Van Vliet, J. Direct and indirect loss of natural area from urban expansion. Nat. Sustain. 2019, 2, 755–763. [Google Scholar] [CrossRef]
- Shandas, V.; Makido, Y.; Ferwati, S. Rapid urban growth and land use patterns in Doha, Qatar: Opportunities for sustainability? Eur. J. Sustain. Dev. Res. 2017, 1, 11. [Google Scholar] [CrossRef]
- Hashem, N.; Balakrishnan, P. Change analysis of land use/land cover and modelling urban growth in Greater Doha, Qatar. Ann. GIS 2015, 21, 233–247. [Google Scholar] [CrossRef]
- Algharib, S.M. Spatial Patterns of Urban Expansion in Kuwait City between 1989 and 2001. Master’s Thesis, Kent State University, Kent, OH, USA, 2008. [Google Scholar]
- Alghais, N.; Pullar, D. Modelling future impacts of urban development in Kuwait with the use of ABM and GIS. Trans. GIS 2018, 22, 20–42. [Google Scholar] [CrossRef]
- Ati, H.; Pavanello, S.; Jaspars, S.; Hashim, A. City Limits: Urbanisation and Vulnerability in Sudan, Port Sudan Case Study. 2011. Available online: http://dspace.cigilibrary.org/jspui/handle/123456789/31337. (accessed on 19 June 2012).
- Zuo, J.; Bian, J.; Li, A.; Lei, G.; Wang, Z. Estimating Impervious Surfaces of Gwadar City Based on the Chinese Multi-Sources Remote Sensing Images. In Proceedings of the IGARSS 2018-2018 IEEE International Geoscience and Remote Sensing Symposium, Valencia, Spain, 22–27 July 2018; pp. 2631–2634. [Google Scholar] [CrossRef]
- Salvati, L.; Zitti, M. Monitoring vegetation and land use quality along the rural–urban gradient in a Mediterranean region. Appl. Geogr. 2012, 32, 896–903. [Google Scholar] [CrossRef]
- Huang, B.-X.; Chiou, S.-C.; Li, W.-Y. Landscape pattern and ecological network structure in urban green space planning: A case study of Fuzhou city. Land 2021, 10, 769. [Google Scholar] [CrossRef]
- Maheng, D.; Pathirana, A.; Zevenbergen, C. A preliminary study on the impact of landscape pattern changes due to urbanization: Case study of Jakarta, Indonesia. Land 2021, 10, 218. [Google Scholar] [CrossRef]
- Haughton, G.; Hunter, C. Urban Growth and the Urban Environment. In Sustainable Cities, 1st ed.; Routledge: London, UK, 2003. [Google Scholar]
- Nemani, R.R.; Keeling, C.D.; Hashimoto, H.; Jolly, W.M.; Piper, S.C.; Tucker, C.J.; Myneni, R.B.; Running, S.W. Climate-driven increases in global terrestrial net primary production from 1982 to 1999. Science 2003, 300, 1560–1563. [Google Scholar] [CrossRef] [Green Version]
- Rishmawi, K.; Prince, S.D.; Xue, Y. Vegetation responses to climate variability in the northern arid to sub-humid zones of Sub-Saharan Africa. Remote Sens. 2016, 8, 910. [Google Scholar] [CrossRef] [Green Version]
- Bren D’Amour, C.; Reitsma, F.; Baiocchi, G.; Barthel, S.; Güneralp, B.; Erb, K.-H.; Haberl, H.; Creutzig, F.; Seto, K.C. Future urban land expansion and implications for global croplands. Proc. Natl. Acad. Sci. USA 2017, 114, 8939–8944. [Google Scholar] [CrossRef] [PubMed] [Green Version]
- Sun, J.; Wang, X.; Chen, A.; Ma, Y.; Cui, M.; Piao, S. NDVI indicated characteristics of vegetation cover change in China’s metropolises over the last three decades. Environ. Monit. Assess. 2011, 179, 1–14. [Google Scholar] [CrossRef]
- Stutzer, D.; Lawrence, W.; Tucker, C.; Imhoff, M. The use of multisource satellite and geospatial data to study the effect of urbanization on primary productivity in the United States. IEEE Trans. Geosci. Remote Sens. 2000, 38, 2549–2556. [Google Scholar] [CrossRef] [Green Version]
- Urbanization and Sustainability Asia. In Urbanization and Sustainability in Asia: Case Studies of Good Practice; Roberts, B.; Trevor, K. (Eds.) Asian Development Bank and Cities Alliance: Manila, Philippines, 2006; pp. 16–24. [Google Scholar]
- NAGASAWA, R.; Patanakano, B. Urbanization and its Influences on the Suburban landscape changes in Bangkok Metropolitan region, Thailand. J. Jpn. Agric. Syst. Soc. 2013, 29, 29–39. [Google Scholar] [CrossRef]


| Region | Country | ID | Coastal City | |
|---|---|---|---|---|
| Asia | East Asia | China | 1 | Fuzhou |
| 2 | Quanzhou | |||
| 3 | Shenzhen | |||
| West Asia | United Arab Emirates | 4 | Dubai | |
| Qatar | 5 | Doha | ||
| Kuwait | 6 | Kuwait | ||
| Southeast Asia | Philippines | 7 | Manila | |
| Indonesia | 8 | Surabaya | ||
| 9 | Jakarta | |||
| Vietnam | 10 | Hai Phong | ||
| 11 | Ho Chi Minh | |||
| Thailand | 12 | Bangkok | ||
| Singapore | 13 | Singapore | ||
| Malaysia | 14 | Kuantan | ||
| 15 | Malacca | |||
| 16 | Kuala Lumpur | |||
| 17 | Penang | |||
| Myanmar | 18 | Yangon | ||
| South Asia | Bangladesh | 19 | Chittagong | |
| Sri Lanka | 20 | Colombo | ||
| India | 21 | Kolkata | ||
| 22 | Mumbai | |||
| Pakistan | 23 | Karachi | ||
| 24 | Gwadar | |||
| Africa | Djibouti | 25 | Djibouti | |
| Sudan | 26 | Port Sudan | ||
| Egypt | 27 | Port Said | ||
| 28 | Alexander | |||
| Europe | Turkey | 29 | Istanbul | |
| Greece | 30 | Athens | ||
| Italy | 31 | Venice | ||
| Spain | 32 | Valencia | ||
| 33 | Algeciras | |||
| Portugal | 34 | Lisbon | ||
| The Netherlands | 35 | Rotterdam | ||
| Region | ID | Coastal City | Rural | Exurban | Suburban | Urban | Urban Core | |||||
|---|---|---|---|---|---|---|---|---|---|---|---|---|
| R | Slope | R | Slope | R | Slope | R | Slope | R | Slope | |||
| East Asia | 1 | Fuzhou | 0.791 *** | 0.0017 | 0.611 *** | 0.0068 | 0.505 ** | 0.004 | 0.554 *** | 0.007 | 0.441 ** | 0.004 |
| 2 | Quanzhou | 0.711 *** | 0.0036 | 0.568 *** | 0.0044 | 0.006 | −0.0002 | 0.199 | −0.0013 | 0.884 *** | −0.007 | |
| 3 | Shenzhen | 0.669 *** | 0.0046 | 0.268 * | 0.0011 | 0.021 | −0.0003 | 0.367 * | −0.002 | 0.577 *** | −0.003 | |
| Southeast Asia | 4 | Manila | 0.491 *** | 0.003 | 0.717 *** | −0.005 | 0.668 *** | −0.004 | 0.282 * | −0.001 | 0.533 *** | −0.003 |
| 5 | Surabaya | 0.342 * | −0.003 | 0.638 *** | 0.008 | 0.454 ** | 0.004 | 0.426 ** | 0.004 | 0.063 | 0.001 | |
| 6 | Jakarta | 0.687 *** | −0.021 | 0.705 *** | 0.021 | 0.665 *** | 0.021 | 0.679 *** | 0.022 | 0.668 *** | 0.020 | |
| 7 | Hai Phong | 0.140 | 0.0019 | 0.072 | −0.0005 | 0.531 *** | 0.006 | 0.455 ** | 0.008 | 0.290 * | −0.002 | |
| 8 | Ho Chi Minh | 0.613 *** | 0.002 | 0.182 | 0.0001 | 0.393 ** | −0.001 | 0.303 * | −0.001 | 0.213 | −0.001 | |
| 9 | Bangkok | 0.018 | 0.0001 | 0.142 | 0.001 | 0.123 | 0.001 | 0.197 | 0.001 | 0.103 | 0.0001 | |
| 10 | Singapore | 0.003 | 0.0001 | 0.651 *** | 0.004 | 0.162 | 0.001 | 0.149 | 0.001 | 0.318 * | 0.002 | |
| 11 | Kuantan | 0.385 | 0.001 | 0.472 ** | 0.005 | 0.333 * | 0.003 | 0.041 | −0.001 | 0.086 | −0.001 | |
| 12 | Malacca | 0.444 ** | 0.0016 | 0.377 * | 0.001 | 0.502 ** | 0.0029 | 0.207 | 0.0014 | 0.006 | −0.0002 | |
| 13 | Kuala Lumpur | 0.851 *** | 0.0022 | 0.341 * | 0.002 | 0.383 * | 0.0026 | 0.050 | 0.0005 | 0.495 ** | −0.001 | |
| 14 | Penang | 0.348 * | −0.001 | 0.055 | 0.0001 | 0.000 | 0.00002 | 0.560 *** | 0.005 | 0.599 *** | 0.003 | |
| 15 | Yangon | 0.564 *** | 0.002 | 0.820 *** | 0.002 | 0.546 *** | 0.002 | 0.419 ** | −0.001 | 0.609 *** | −0.002 | |
| South Asia | 16 | Chittagong | 0.094 | 0.0005 | 0.736 *** | −0.0017 | 0.292 * | 0.0024 | 0.334 * | 0.003 | 0.496 ** | −0.002 |
| 17 | Colombo | 0.497 ** | 0.0022 | 0.552 *** | 0.003 | 0.136 | 0.0013 | 0.114 | 0.002 | 0.023 | 0.0007 | |
| 18 | Kolkata | 0.241 | −0.008 | 0.493 | 0.010 | 0.337 | 0.007 | 0.336 | 0.009 | 0.381 * | 0.010 | |
| 19 | Mumbai | 0.200 | 0.002 | 0.295 * | −0.0001 | 0.450 ** | 0.001 | 0.395 ** | 0.002 | 0.261 * | −0.001 | |
| 20 | Karachi | 0.172 | 0.0015 | 0.014 | −0.0001 | 0.034 | 0.0003 | 0.003 | 0.00009 | 0.266 * | −0.002 | |
| 21 | Gwadar | 0.502 ** | 0.0008 | 0.652 *** | 0.003 | 0.476 ** | −0.009 | / | / | / | / | |
| West Asia | 22 | Dubai | 0.421 ** | 0.002 | 0.417 ** | −0.0004 | 0.942 *** | 0.0013 | 0.959 *** | 0.002 | 0.917 *** | 0.0014 |
| 23 | Doha | 0.001 | −0.00003 | 0.327 * | −0.001 | 0.583 *** | −0.002 | 0.081 | 0.0001 | 0.072 | 0.0001 | |
| 24 | Kuwait | 0.022 | −0.0001 | 0.55 ** | 0.001 | 0.673 *** | −0.001 | 0.620 *** | 0.002 | 0.174 | −0.0005 | |
| Africa | 25 | Djibouti | 0.253 * | −0.001 | 0.294 * | −0.0014 | 0.499 ** | −0.002 | 0.711 *** | 0.002 | 0.821 *** | 0.002 |
| 26 | Sudan | 0.028 | −0.0001 | 0.706 *** | −0.001 | 0.007 | 0.00005 | 0.166 | −0.0003 | 0.070 | 0.0003 | |
| 27 | Port Said | 0.906 *** | 0.004 | 0.342 * | 0.001 | 0.463 ** | −0.003 | 0.806 *** | −0.004 | 0.849 *** | −0.004 | |
| 28 | Alexander | 0.079 | 0.0002 | 0.837 | 0.0017 | 0.766 *** | −0.001 | 0.124 | −0.00024 | 0.130 | 0.0001 | |
| Europe | 29 | Istanbul | 0.641 *** | 0.003 | 0.352 * | 0.0015 | 0.275 * | 0.001 | 0.018 | −0.00022 | 0.593 *** | −0.002 |
| 30 | Athens | 0.678 *** | 0.003 | 0.450 ** | 0.0009 | 0.408 ** | 0.001 | 0.177 | 0.0007 | 0.256 * | −0.001 | |
| 31 | Venice | 0.279 * | 0.002 | 0.756 *** | 0.001 | 0.112 | 0.0001 | 0.269 * | 0.001 | 0.371 * | 0.001 | |
| 32 | Valencia | 0.336 * | 0.0035 | 0.035 | 0.0004 | 0.433 ** | 0.004 | 0.207 | 0.002 | 0.409 ** | 0.004 | |
| 33 | Algeciras | 0.001 | −0.00003 | 0.229 | 0.0009 | 0.383* | 0.0012 | 0.443** | 0.0016 | 0.202 * | 0.001 | |
| 34 | Lisbon | 0.342 * | 0.003 | 0.058 | 0.0001 | 0.464** | −0.001 | 0.262* | −0.001 | 0.455 ** | −0.003 | |
| 35 | Rotterdam | 0.434 ** | 0.004 | 0.002 | 0.0001 | 0.568*** | −0.004 | 0.652*** | −0.005 | 0.555 *** | −0.004 | |
Publisher’s Note: MDPI stays neutral with regard to jurisdictional claims in published maps and institutional affiliations. |
© 2022 by the authors. Licensee MDPI, Basel, Switzerland. This article is an open access article distributed under the terms and conditions of the Creative Commons Attribution (CC BY) license (https://creativecommons.org/licenses/by/4.0/).
Share and Cite
Yan, M.; Fan, S.; Zhang, L.; Mahmood, R.; Chen, B.; Dong, Y. Vegetation Dynamics Due to Urbanization in the Coastal Cities along the Maritime Silk Road. Land 2022, 11, 164. https://doi.org/10.3390/land11020164
Yan M, Fan S, Zhang L, Mahmood R, Chen B, Dong Y. Vegetation Dynamics Due to Urbanization in the Coastal Cities along the Maritime Silk Road. Land. 2022; 11(2):164. https://doi.org/10.3390/land11020164
Chicago/Turabian StyleYan, Min, Shunxiang Fan, Li Zhang, Riffat Mahmood, Bowei Chen, and Yuqi Dong. 2022. "Vegetation Dynamics Due to Urbanization in the Coastal Cities along the Maritime Silk Road" Land 11, no. 2: 164. https://doi.org/10.3390/land11020164
APA StyleYan, M., Fan, S., Zhang, L., Mahmood, R., Chen, B., & Dong, Y. (2022). Vegetation Dynamics Due to Urbanization in the Coastal Cities along the Maritime Silk Road. Land, 11(2), 164. https://doi.org/10.3390/land11020164