Article

Rice Husk and Its Biochar Have Contrasting Effects on Water-Soluble Organic Matter and the Microbial Community in a Bamboo Forest Soil

1
State Key Laboratory of Subtropical Silviculture, Zhejiang A&F University, Hangzhou 311300, China
2
Department of Soil Sciences, Faculty of Agriculture, Ain Shams University, Cairo 11241, Egypt
3
Department of Renewable Resources, University of Alberta, 442 Earth Sciences Building, Edmonton, AB T6G 2E3, Canada
4
Department of Environment, Energy, and Geoinformatics, Sejong University, Seoul 05006, Republic of Korea
*
Author to whom correspondence should be addressed.
These authors contributed equally to this work.
Land 2022, 11(12), 2265; https://doi.org/10.3390/land11122265
Submission received: 19 October 2022 / Revised: 6 December 2022 / Accepted: 7 December 2022 / Published: 11 December 2022
(This article belongs to the Special Issue Soil Biodiversity in Agricultural Ecosystems)

Abstract

:
Converting rice husk to biochar is one of the solutions to manage crop residues by transforming waste into a value-added material that has broad benefits to the environment when biochar is applied to the soil. This study investigated the impact of the application of rice husk and its biochar at different doses (i.e., 0, 10, and 30 t ha−1) on soil carbon stability, the property of water-soluble soil organic matter, and the abundance and diversity of microbial communities in a Lei bamboo (Phyllostachys praecox) forest soil 262 days after their application. The application of rice husk, especially at 30 t ha−1, increased dissolved organic carbon due to the high labile carbon (C) (e.g., cellulose, hemicellulose, polysaccharides) content in the rice husk. The biochar treatments stimulated the release of humic-like substances (e.g., (poly) phenols) into the soil solution, increased the aromatic C content by 412–557%, and increased the relative abundance of Chloroflexi, Planctomycetota, and Proteobacteria compared to the control. This study shows that biochar application, particularly at 30 t ha−1, enhanced the C stability by turning organic C into recalcitrant forms in the soil, demonstrating the merit of converting rice husk into biochar before its application to the soil.

1. Introduction

Global rice production has dramatically increased over the last decade, reaching 759.6 million tons in 2018, with China and India contributing about 26 and 21%, respectively, of the world’s total rice production [1]. Rice husk is one of the main by-products of rice production and is typically treated as waste biomass. Despite its high lignin, cellulose, and hemicellulose contents, farmers in some developing countries usually dispose rice husk through composting or burning, which are inappropriate management practices. For example, composting rice husk is not preferable due to its low nitrogen (N) content, and burning it causes air pollution, risks human health, increases greenhouse gas emissions, and damages beneficial soil microbes [2]. Therefore, appropriate and eco-friendly methods for disposing the rice husk are highly desirable.
Recently, the thermochemical conversion of carbon-rich crop residues such as rice husk to biochar at a low to medium temperature (300–700 °C) under a no/limited oxygen environment has been recommended as a promising waste management method [3,4,5,6]. Converting rice husk to biochar through pyrolysis has multiple benefits, such as sustainable waste management, energy production, carbon (C) sequestration, soil fertility improvement, climate change mitigation, and better crop productivity when the biochar is applied to the soil [2].
The application of rice husk biochar could improve soil physical characteristics such as soil porosity and water holding capacity and offset soil C loss via increasing C storage in a stable form in the soil [3,5]. Rice husk biochar can also enhance the abundance and diversity of microbial communities in the soil through influencing soil physicochemical properties [2,4,7]. Rice husk biochar is composed mainly of aliphatic and aromatic C components, and the dissolved organic matter (DOM) contained in the biochar has different stabilities [5,8]. The biochar-derived DOM can play a crucial role in the C cycle in the soil due to its richness of aromatic and stable C. The labile fraction of the biochar-derived DOM can also stimulate microbial activities in the soil due to its accessibility to microorganisms [8]. Therefore, it is essential to investigate the compositional characteristics of DOM derived from rice husk biochar in the soil. Fluorescence excitation–emission matrix (EEM) spectroscopy has been used to identify different fluorescent DOM components in organic soil amendments [8,9,10]. For instance, Rajapaksha et al. [11] have applied parallel factor analysis (PARAFAC) using the EEM data of biochar samples produced from feedstocks such as garlic stem, soybean stover, and pine wood and identified the presence of humic-like, protein/tannin-like, fulvic acid-like, and terrestrial humic-like components in the biochar-derived DOM at disparate ratios. The water-soluble soil organic matter (WSOM) in sandy loam soils treated with different types of biochars (i.e., grass, rice straw, and wood) was found to be dominated by microbially degraded humic-like compounds, followed by terrestrial humic-like compounds after 473 d of incubation [8]. The DOM characteristics in soils treated with biochar vary depending on the feedstock type and the biochar application rate. However, the nature and chemical composition of rice husk biochar-derived DOM compared to rice husk and their influence on the microbial activity in the soil and the mechanisms involved are not well documented.
In this study, rice husk and its biochar were added to a Lei bamboo (Phyllostachys praecox) forest soil at different doses (0, 10, and 30 t ha1) in a 262 d greenhouse experiment. It is hypothesized that converting rice husk into biochar would promote the C stability of rice husk, stimulate the generation of humic-like DOM substances, and differentially affect the abundance and diversity of microbial communities in the soil. The objectives of this study were to: (i) investigate the differential impact of rice husk and its biochar on C stability in the soil and (ii) study the impact of both the rice husk and its biochar applied at different doses on the nature and composition of DOM, along with their effects on microbial communities in the soil. The results from this study provide data on the effect of rice husk and its biochar on soil DOM properties and the abundance and diversity of microbial communities.

2. Materials and Methods

2.1. The Collection of Soil and Rice Husk Samples and the Production of Biochar

A composite soil sample (0–20 cm) was collected from a Lei bamboo forest soil in Hangzhou (30°27′ N, 119°57′ E), Zhejiang, China (Figure S1). The fresh soil sample was sieved (<8 mm) and mixed thoroughly prior to conducting the experiment. Rice (Oryza sativa L.) husk was obtained from Zhejiang Changjiang Delta Junong Science and Technology Development Co. Ltd., China. The rice husk was dried and ground. Biochar was produced from the rice husk via slow pyrolysis at 500–600 ℃ after the rice husk was dried in an oven at 65 ℃ for 24 h. The rice husk and its biochar samples were then crushed and sieved to <2 mm. The rice husk and its biochar had a pH of 7.5 and 9.2, a total C of 87.1 and 94.0%, and a total N of 0.9 and 0.6%, respectively, while the biochar had 32.8% ash, 42.3% mobile matter, and 18.4% resident matter [12].

2.2. Experiment Design

Rice husk (RH) and rice husk biochar (RHB) were added to soils at two rates (10 and 30 t ha1), coded as RH10, RH30, RHB10, and RHB30, respectively, along with a control treatment without the addition of RH or RHB, in PVC pots (50 × 50 cm, diameter x height) at a greenhouse in Zhejiang A&F University, Hangzhou, China. The amendments were mixed well to a soil depth of 0–20 cm in each pot, each containing 21 kg of dry soil. All pots were applied with 100 kg N ha1 equivalent by spraying with a urea solution. Each treatment and control were quadruplicated, and the pots were randomly arranged. The pots were planted with Lei bamboo, and the moisture content was preserved at ~60% of the water holding capacity via adding water every three days. The experiment was maintained for 262 d at a greenhouse temperature (25 °C).
Composite samples were collected from the surface layer (i.e., 0–20 cm) of each pot using a stainless-steel auger at the end of the experiment (Figure S2). A part of the soil samples was stored at −80 ℃ until the microbial analysis, and another part was stored at −4 ℃ for the WSOM analysis. The remainder of the soil samples were prepared for chemical analysis by air-drying, crushing, and sieving to <2 mm.

2.3. Chemical and 13C-CPMAS NMR Analyses and PARAFAC Modeling

The soil pH was measured at a soil-to-CaCl2 (0.01 M) ratio of 1:5 (w/v) suspension using a pH meter (Seven Compact, Mettler Toledo, Switzerland). The electrical conductivity (EC) was analyzed in an extracted solution of 1:5 (w/v) soil to deionized water suspension. The soil samples were extracted by 1 M NH4OAc at pH 7.0 at a soil-to-solution ratio of 1:10 (w/v) and analyzed using an inductively coupled plasma atomic emission spectrometer (ICP-OES; Ultima 2, Horiba Jobin Yvon, Unterhaching, Germany) to determine the exchangeable Ca2+, K+, Mg2+, and Na+ concentrations. The cation exchange capacity (CEC) was calculated according to Brown [13].
The soil samples were pretreated prior to the 13C-CPMAS NMR analysis. Briefly, 8 g of each soil sample was transferred into a 100 mL plastic tube. Then, 50 mL of HF solution (10% v/v) was added to each tube. The tube was closed and shaken for 1 h. Subsequently, the sample was centrifuged for 10× g min at 1174 g. The supernatant was removed and discarded, and the residue was again treated with HF. The HF treatment was repeated eight times with shaking times of 1 h for the first four HF treatments, 12 h for the next three treatments, and 24 h for the last treatment. At the end, the remaining soil material was washed four times with distilled water by centrifugation, oven-dried at 40 °C, and ground to pass a 0.3 mm sieve. The NMR spectra were recorded using a Bruker Avance III 400 spectrometer (Bruker BioSpin Corporation, Fällanden, Switzerland) equipped with a magic angle spinning (MAS) probe. The samples were spun at 14 kHz in the scanning region of −50 to 300 ppm, and the 1H ramp sequence was used before transference to 13C at a contact time of 1.5 ms. A total of 1000 scans were obtained with 6300 data points collected over the acquisition time of 10 ms, with a recycle delay of 1 s per spectrum. The WSOM of soil samples was extracted. The freshly filtered extract was used for the ultraviolet (UV) absorbance at 254 nm, dissolved organic C (DOC), and fluorescence spectra measurements. The specific UV absorbance (SUVA) was estimated according to Weishaar [14]. The detailed procedure is described in previous studies [8,10,11]. The DOM indices are as follows: the fluorescence index (FI), Y fluorescence index (a modified index from FI), humification index, and biological index were calculated, and the EEM data were used in PARAFAC modeling [15,16,17,18]. All details of the methods for the chemical analyses are reported in the supplementary material.

2.4. High-Throughput 16S rRNA Gene Sequencing

The total genome DNA of the soil samples was extracted and analyzed following the CTAB/SDS method [19]. The DNA concentrations in the samples were analyzed using a NanoDrop spectrophotometer (NanoDrop One, 207 Thermo Fisher Scientific, Waltham, MA, USA) and then checked with 1% agarose gel electrophoresis. Details of the 16S rRNA amplification, PCR reactions, thermal cycling, library preparation and sequencing, and Operational Taxonomic Units (OTU) creation are reported in the supporting information.

2.5. Data Analysis

The gene sequences were clustered into OTUs using a Uparse algorithm (Uparse v7.0.1001). Shannon, Simpson, and Chao 1 indices were calculated using Qiime software (Version 1.9.1) and were used to assess the species diversity and richness. Principal component analysis (PCA) and non-metric multidimensional scaling (NMDS) based on OTU-level data were performed using the R software (Version 2.15.3). Species abundance and phylum-level data were studied via cluster plots and phylogenetic relationship analyses using R. The Beta Diversity Index group difference analysis was carried out using R. The data were normally distributed and exhibited a homogeneity of variances. The means of variables for different soil analyses were examined by a one-way analysis of variance followed by Duncan’s multiple range test at a significance level of 0.05.

3. Results and Discussions

3.1. Effects of RH and RHB on Soil Physicochemical Properties

The RHB30 treatment significantly increased the soil pH and EC (p < 0.05) compared to the other treatments (Table 1). In particular, the other treatments did not affect soil pH and EC. The increment in soil pH and EC with the RHB30 was due to its alkaline properties (pH = 9.2) and its high ash content (42.3%), respectively [8,20]; however, this effect was minimal with the low dose of biochar. The RHB10 treatment resulted in the highest soil-exchangeable K+ among the different treatments, 52.7% higher than the control (Table 1). The exclusive effect of biochar on K+ alone among all the cations is due to the higher solubility of K+ in the biochar compared to the other cations [21,22]. However, this effect of biochar on exchangeable K+ was minimal with the higher dose (RHB30), which might be attributed to the higher presence of Ca2+ on the exchange sites of soil particles of RHB 30 (Table 1). The overall results showed that the impacts of biochar treatments on soil CEC were minimal (Table 1), which is similar to previous studies [23,24]. The CEC is commonly increased in biochar-treated soils as a result of increased soil pH [22]; however, in this study, none of the biochar treatments had increased the soil pH compared to the control, and this could explain the negligible effect of biochar treatments on soil CEC. It has also been reported that the RHB has a low surface area [25,26], while the large surface area is the second factor after pH that can enhance the CEC in biochar-treated soils [27].

3.2. Effects of RH and RHB on Variations in 13C-CPMAS NMR Spectral Regions

The 13C-CPMAS NMR spectral regions varied among the different treatments, as demonstrated by the different types of C bonds and regions of corresponding references [28,29] along the NMR spectrum (Figure S3 and Table 2). The control was dominated mainly by alkyl C (0–45 ppm), followed by O-alkyl C (61–90 ppm, Table 2). The RH treatments also exhibited a high alkyl C content. The high alkyl C content in RH treatments is attributed to the high lipids and hemicellulose contents in the RH. The RH treatments also showed a considerable increase in carbonyl C (161–190 ppm) and O-alkyl C in the soil compared to the control and the biochar treatments (Table 2). This demonstrates that the RH treatments have increased the presence of polysaccharides, lignin, protein, and carbonyl owing to the composition of the rice husk that was incorporated into the soil. Biochar treatments (i.e., RHB10 and RHB30) showed markedly higher contents of aromatic C (111–140 pm) than the control or the RH treatments. Despite the high contents of (O-)alkyl C and methoxyl C in the control and RH treatments, the O-alkyl C and methoxyl C were decreased in the RHB treatments due to the transformation of those forms of C into more stable forms during the pyrolysis process in the production of biochar.
The RH treatments increased the labile C (cellulose, hemicellulose, and polysaccharides), and the RHB treatments increased the recalcitrant C (aromatic C) compared to the control. Therefore, the RHB10 and RHB30 treatments enhanced C sequestration and C stability into recalcitrant forms in the soil, demonstrating the merit of converting the rice husk into biochar before its addition to the soil.

3.3. Effects of RH and RHB on DOC and Fluorescence Indices

The DOC concentrations were significantly higher in RH30 than they were in RHB10 and RHB30 by 33.7 and 30.1%, respectively (Figure 1). The higher DOC in the RH treatments compared to the biochar treatments indicates that the rice husk has more labile C than its biochar, which is consistent with the results of 13C-CPMAS NMR discussed earlier. The higher aliphatic components in rice husk, especially at the higher dose (RH30), likely facilitated the release of DOC components from dissolved organic metabolites in the soils treated with the rice husk.
The FI (f450/500) values for all treatments (ranging between 1.74 and 1.79, Table 3) are higher than the range reported in several recent studies (0.76–1.35) [8,10,11]. The relatively high FI values indicate that high portions of soil DOM originated from microbial-derived sources [8]. However, among the treatments, RHB30 had a significantly (p < 0.05) lower FI, and the biochar treatments resulted in a minimal decrease in the Y fluorescence index, indicating an enhanced contribution of terrestrial sources to DOM in the soils, particularly in the RHB30 compared to the other treatments, which is facilitated by the high dose of biochar application. This observation was consistent with the biological index results, suggesting that the biochar treatments, particularly the RHB30 treatment, had the lowest biological activity among the treatments. The higher biological activity in RH10 and RH30 is attributed to the stimulation via the labile C derived from the rice husk. The humification index is correlated with the humification degree in the soil [30], and a higher humification index indicates the transformation of organic matter substances into humus.

3.4. Rice Husk and Its Biochar’s Effects on Fluorescence Components, as Identified by EEM-PARAFAC Modeling

The EEM-PARAFAC revealed that two fluorescent components could describe the variations in WSOM compositions (i.e., C1 and C2) [8,11]. Component 1 (C1) exhibited a primary peak at Ex/Em: 245/428 nm and a secondary peak at Ex/Em: 315/428 nm, assigned as a humic-like component. Component 2 (C2) exhibited a primary peak at Ex/Em: 245/340 nm and a secondary peak at Ex/Em: 270/340 nm, assigned as a protein-like component, which might be due to the release of labile organic matter as well as allochthonous organic substances into the soil solution [8]. The humic-like component was much more dominant in the control treatment by 84% compared to the protein-like component (16%). The humic-like component was further intensified in the RHB10 and RHB30 treatments, representing 84.1 and 84.0%, respectively, of the DOM, whereas the humic-like component represented 83.2 and 82.1% of the DOM in the RH10 and RH30 treatments, respectively. The protein-like components represented 16.8 and 17.9% of the DOM of the soils treated with the rice husk, i.e., in the RH10 and RH30 treatments, respectively, while they were only 15.9 and 16.0% in the RHB10 and RHB30 treatments, respectively. The higher protein-like component in the rice husk treatments might be attributed to the higher content of protein substances (methyl C), as indicated by the 13C CPMAS NMR (Figure S3 and Table 2). The results of this study demonstrate that the RHB treatments stimulated the release of humic-like DOM substances (e.g., (poly)phenols) into the soil solution and enhanced the C stability in the soil, as the humification process transformed low-molecular-weight organic compounds into high-molecular-weight polymeric compounds [11,31].

3.5. Relative Abundance of Bacteria Species

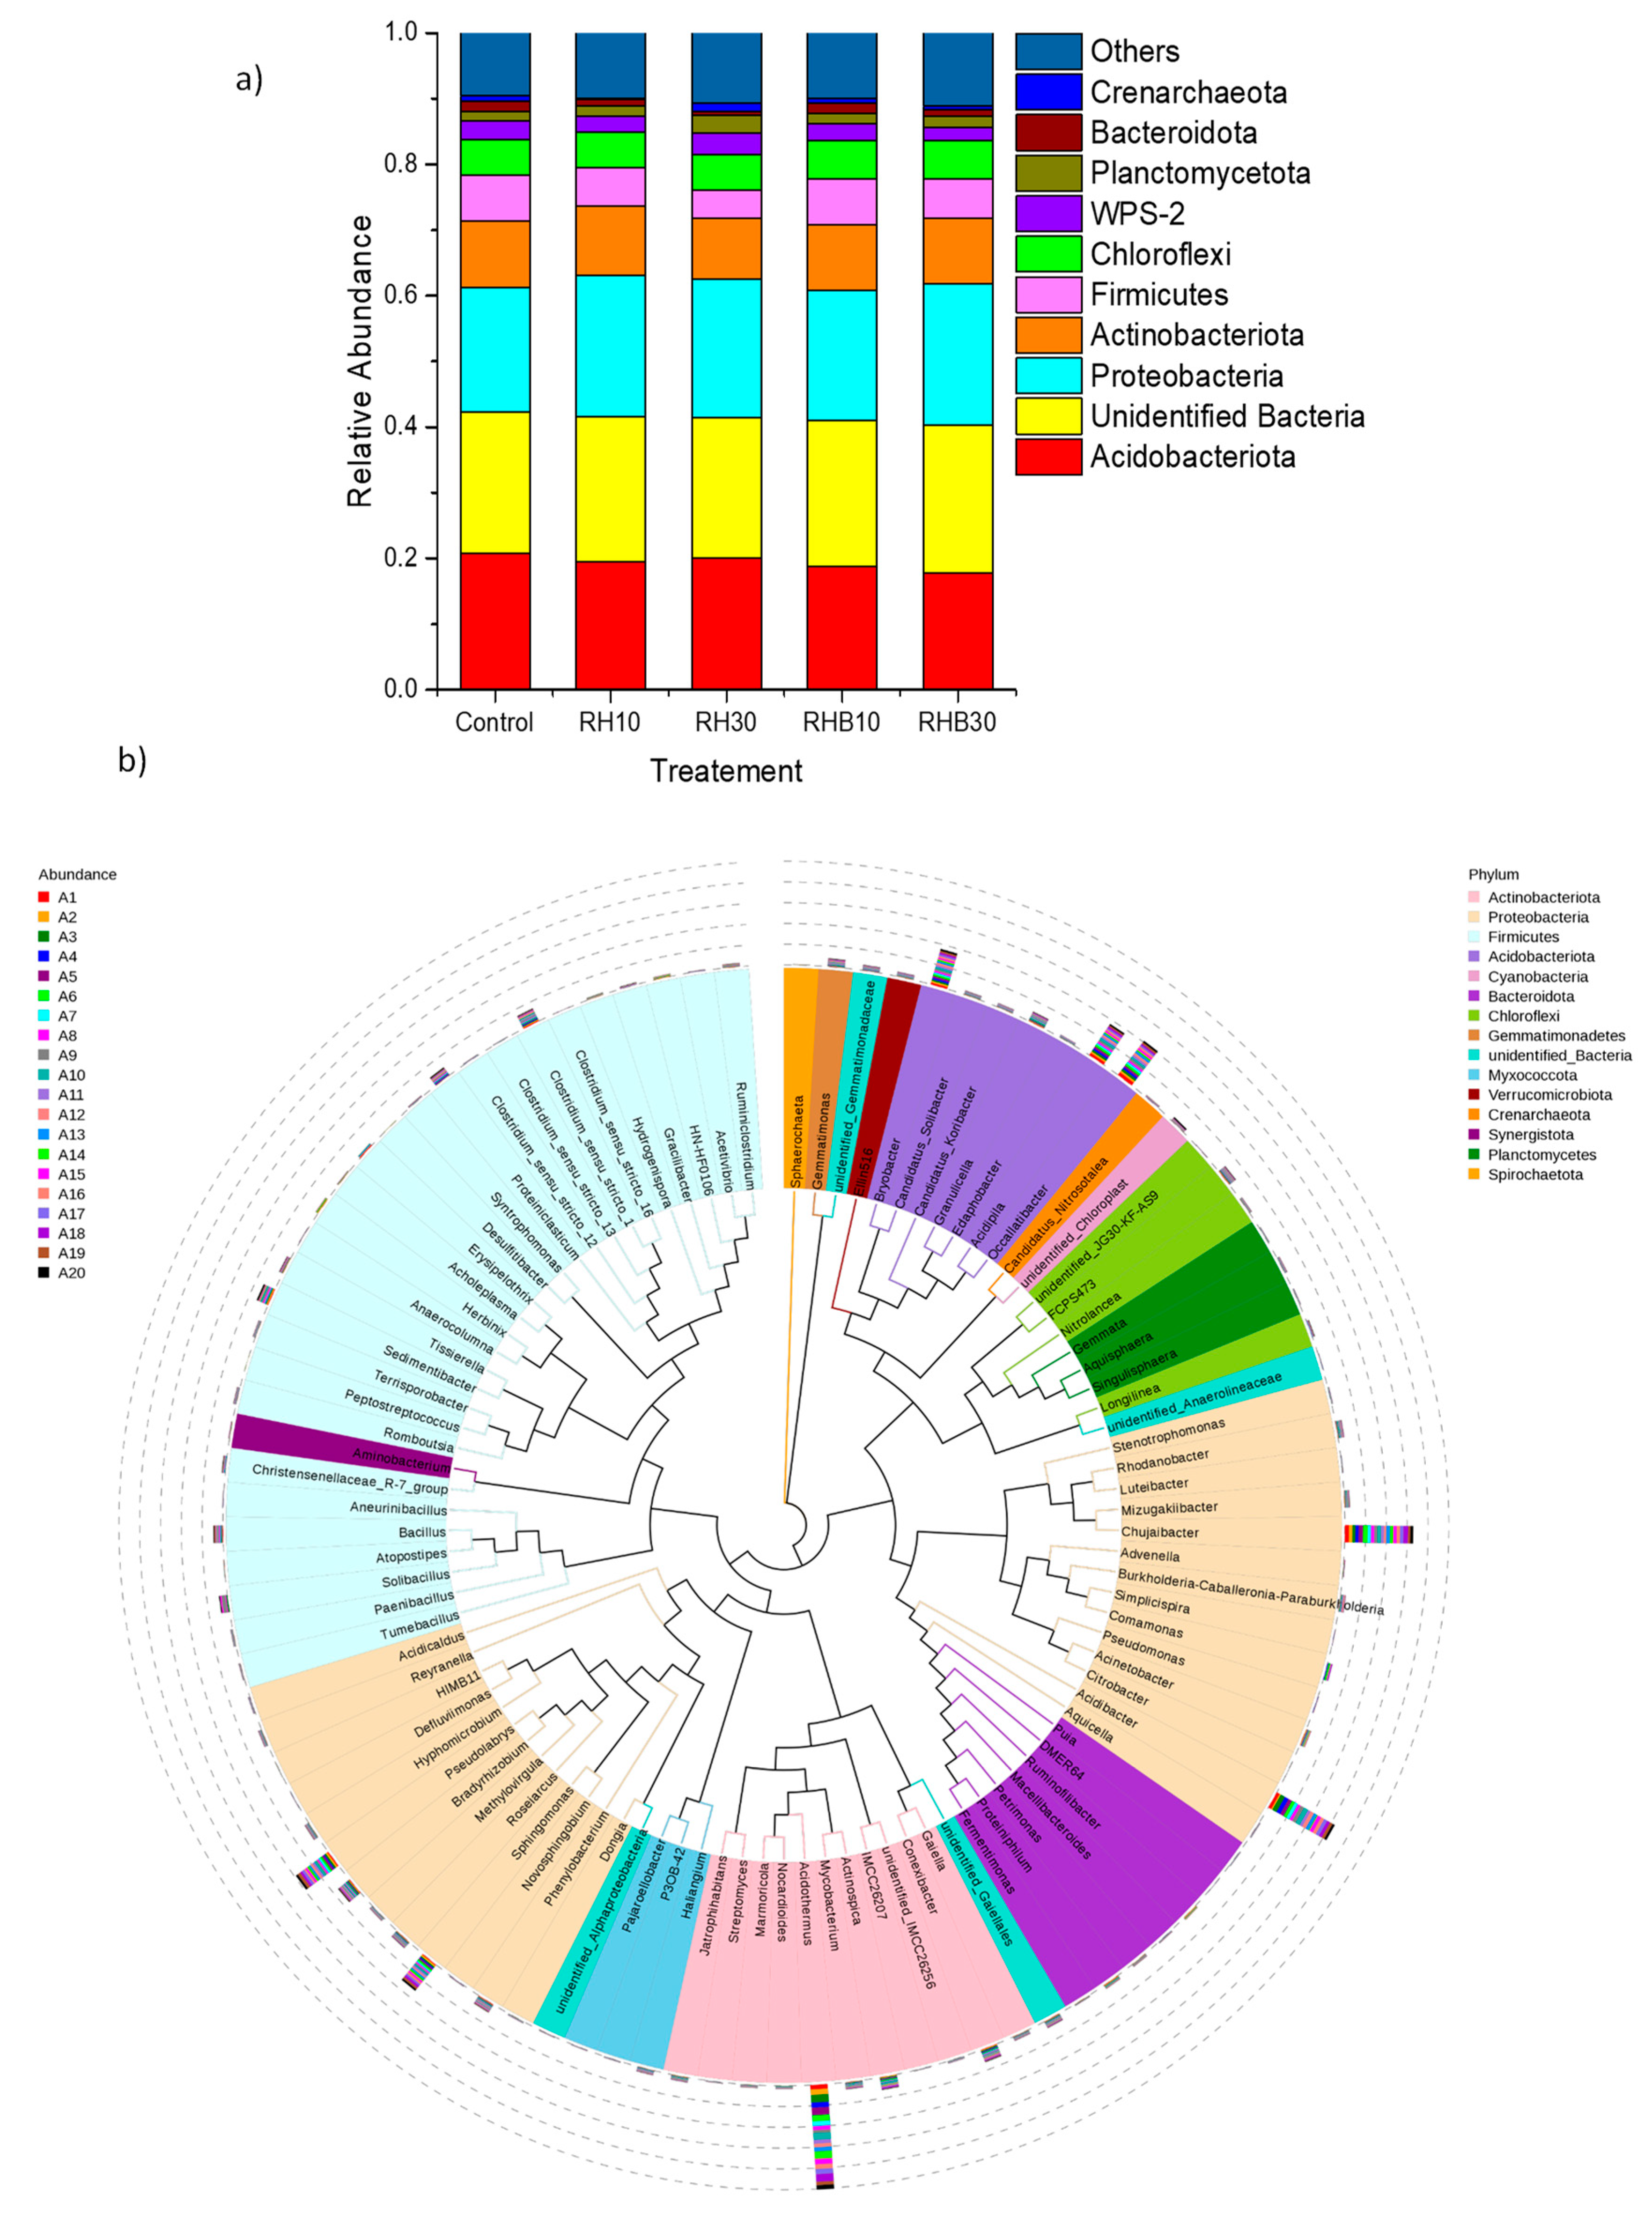
Among the top 10 identified bacterial phyla with the largest relative abundance, Proteobacteria, Acidobacteriota, and Unidentified bacteria were the predominant bacterial phyla in the soil (Figure 2a). The application of RH and RHB to the soil increased the relative abundance of Proteobacteria, especially with RHB30 (increased by 14.2%), whereas it decreased the relative abundance of Acidobacteriota, especially with RHB10 and RHB30 (−10.0 and −14.9%, respectively), compared to the control. The addition of the ice husk, the RH30 treatment in particular, increased Planctomycetes and Crenarchaeote by 84.7 and 35.7%, respectively. The relative abundance of Firmicutes, WPS-2, and Crenarchaeote gradually declined with the increased biochar dose. On the contrary, the relative abundance of Planctomycetes and other phyla (the sum of all other phyla except for these top 10 phyla) exhibited the opposite (increasing) trend with biochar treatments. While the relative abundance of Actinobacteria increased with RH10 (4.3%), it decreased with RH30, RHB10, and RHB30 (−1.7 to −8.9%), compared to the control.
The changes in the microbial community in the soil varied among different treatments, and RH and RHB induced different effects on the enrichment/diminution of different phyla. For instance, it was expected that all amendments would increase the relative abundance of Bacteroidota in the soil, as the RH and RHB are C sources that may stimulate the role of Bacteroidetes in the conversion of organic substances derived from DNA, proteins, and lipids [32]. However, the results showed that RHB10 increased Bacteroidota by 0.7%, while RH10 and RH30 decreased the relative abundance of Bacteroidota by 36.6 and 63.6%, respectively, compared to the control, which could be due to the competition with other organisms.
The relative abundance of Acidobacteriota was decreased with all treatments, especially with the high dose of biochar (RHB30), resulting in a higher pH than the other treatments. At the phylum level of soil bacteria, Acidobacteriota is composed mainly of Occallatibacter, Acidipila, and Bryobacter (Figure 2b). Acidobacteriota is an acidophilic bacterium that exhibits a higher abundance at more acidic conditions [33]. Acidobacteriota belongs to the oligotrophic group, in which their growth rate is inhibited in the eutrophic environment of soils treated with biochar [34].
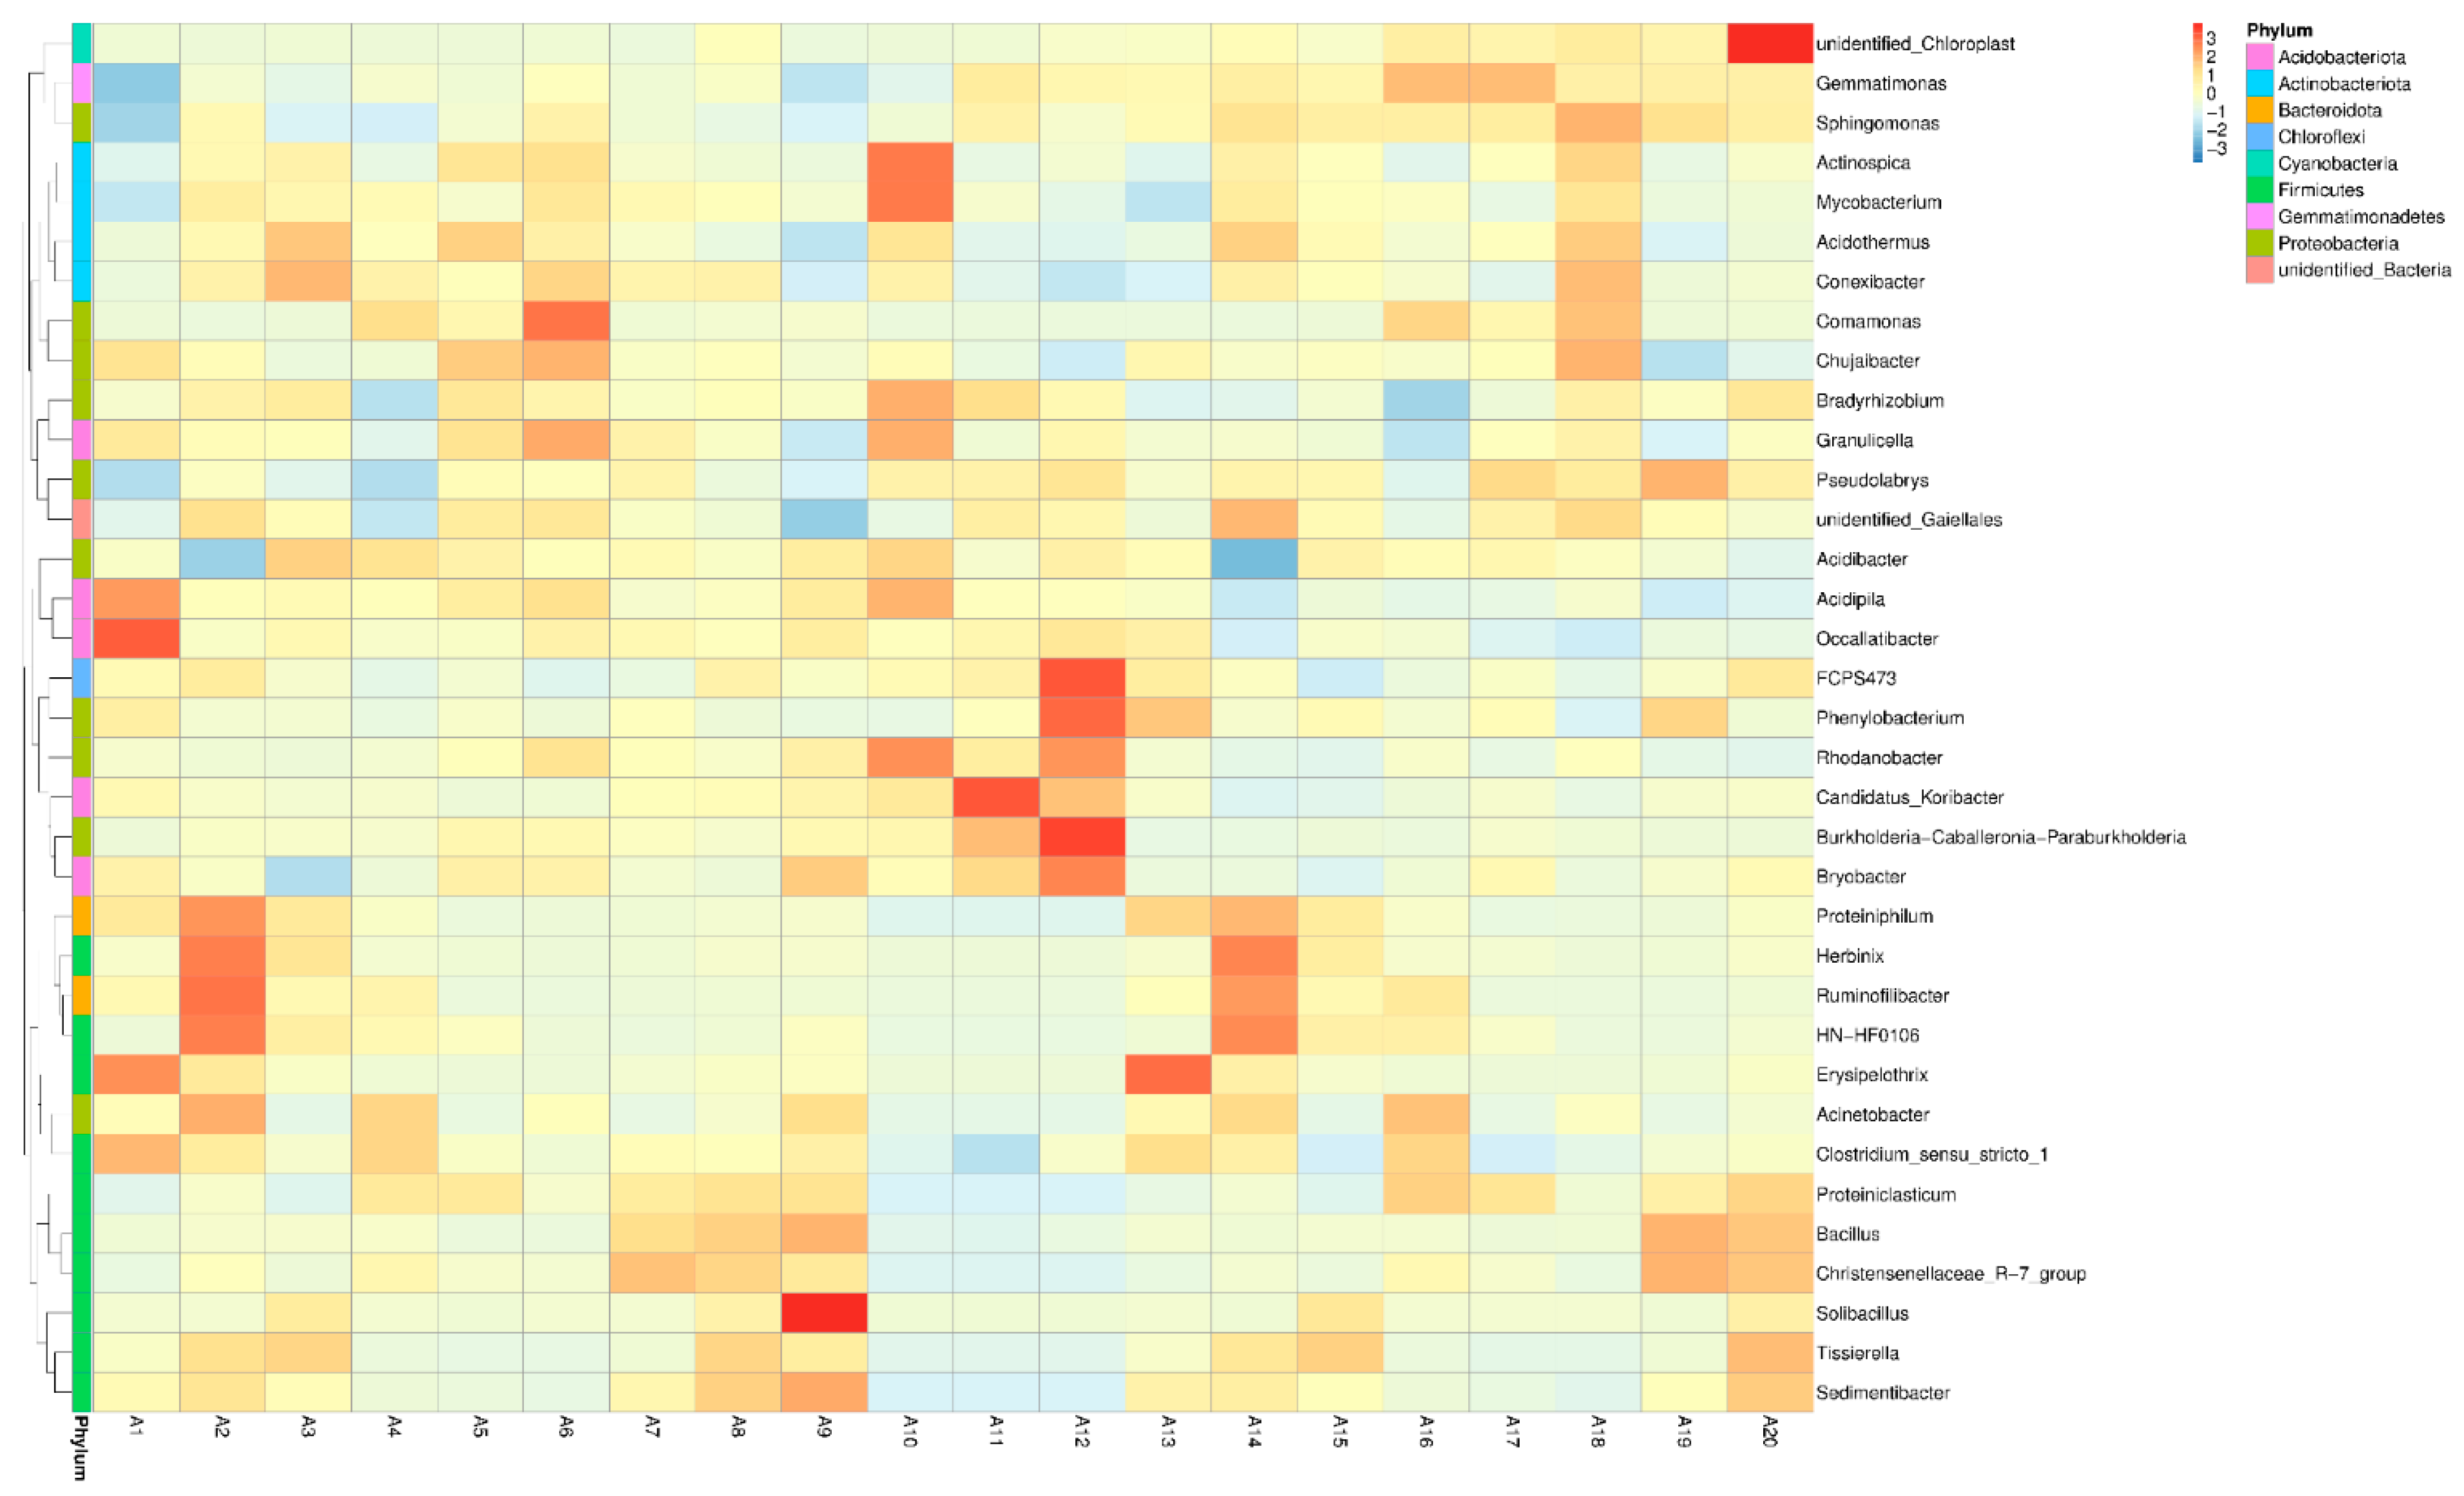
Both RH and RHB treatments increased the phylum of Proteobacteria, particularly Chujaibacter, Pseudolabrys, and Sphingomonas at the phylum level (Figure 2b). The RH10 and RH30 increased the relative abundance of Proteobacteria by 13.6 and 11.7%, respectively. The top 5 genera include Comamonas and Chujaibacter (in the Proteobacteria phylum) in RH10 and Phenylobacterium, Rhodanobacter, and Burkholderia-Caballeronia-Paraburkholderia in RH30 (Figure 3). The phylum Proteobacteria is a eutrophic bacterium [35] that increases with the incorporation of amendments in the soil; thus, the different amendments have enhanced its abundance in the soil.
Interestingly, the RH treatments decreased the relative abundance of Chloroflexi, while the biochar treatments increased it. Chloroflexi plays a crucial role in the degradation of organic substances and the production of energy through photosynthesis [36]. The biochar addition can enhance soil porosity and the light entry into the soil [20], increasing the relative abundance of Chloroflexi. Chloroflexi might play a role in the degradation of cellulose and starch and the competition for labile C derived from biochar DOC with organisms, while the lower relative abundance of Chloroflexi in RH10 and RH30 may reduce the degradation rate of organic materials [34]. The higher relative abundances of Proteobacteria, Chloroflexi, and Planctomycetota in the soils treated with biochar indicated that these microorganisms play a crucial role in the function of rice husk biochar in the soil.

3.6. Diversity of the Microbial Community

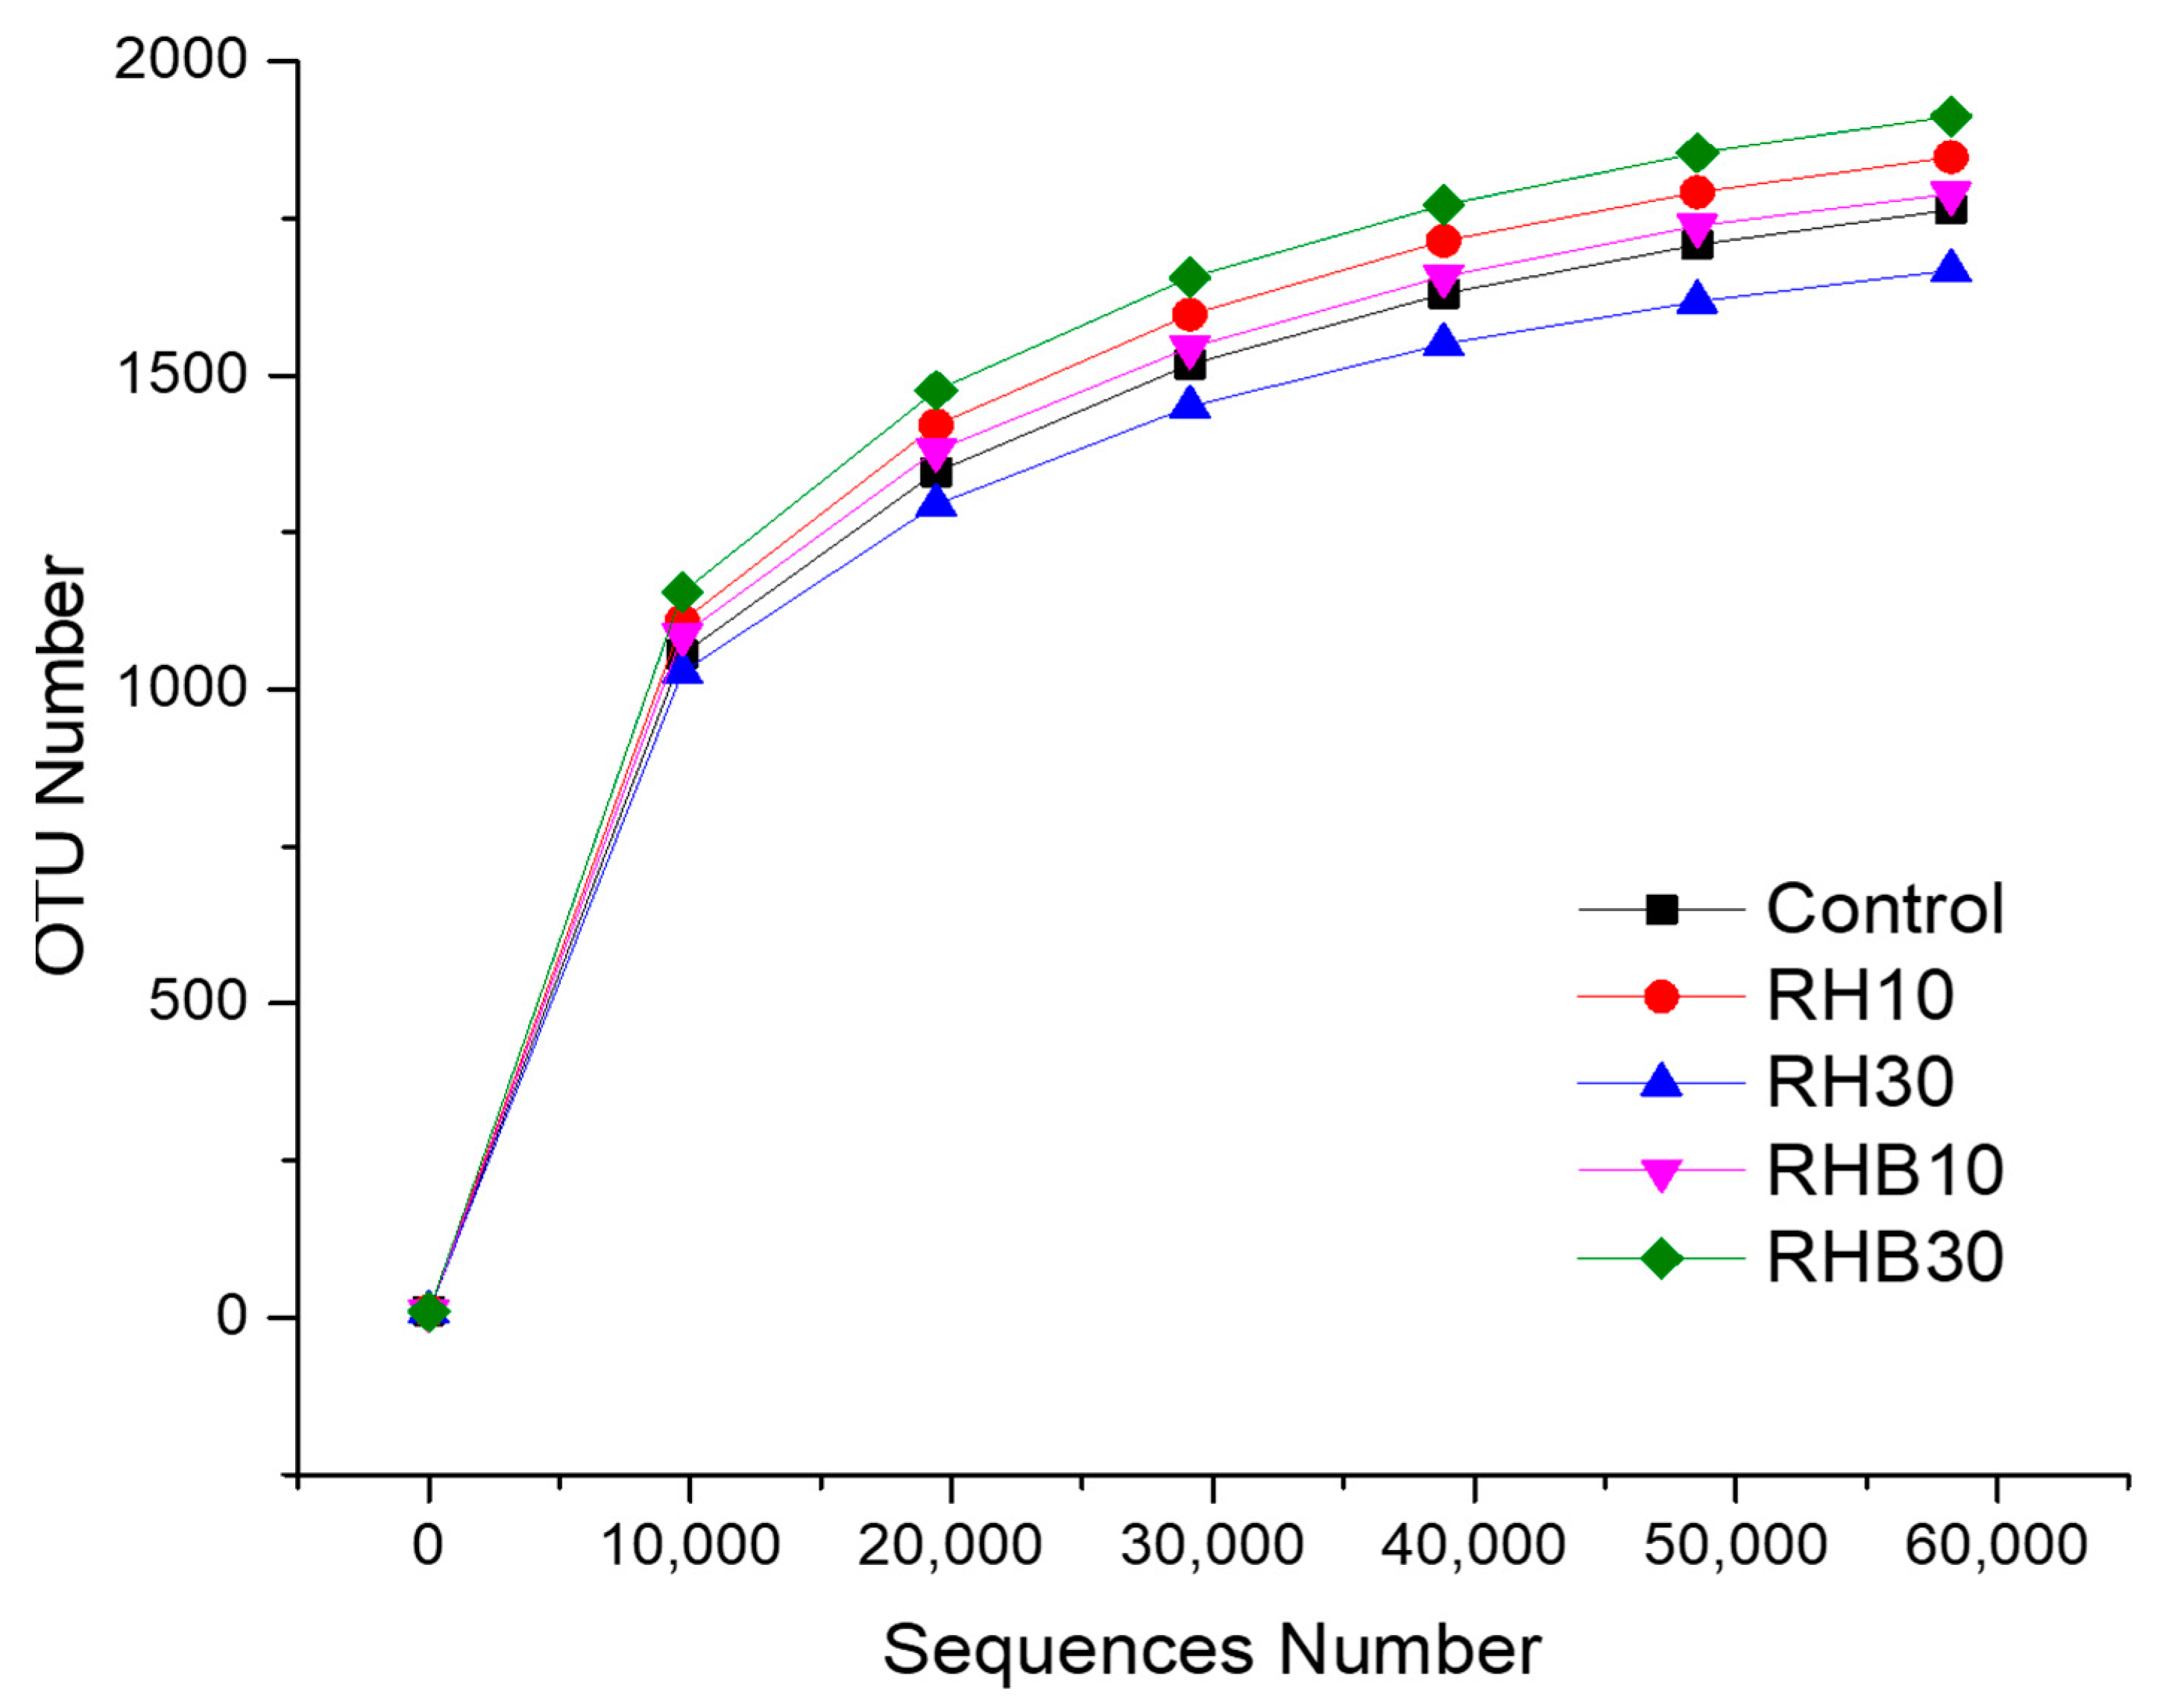
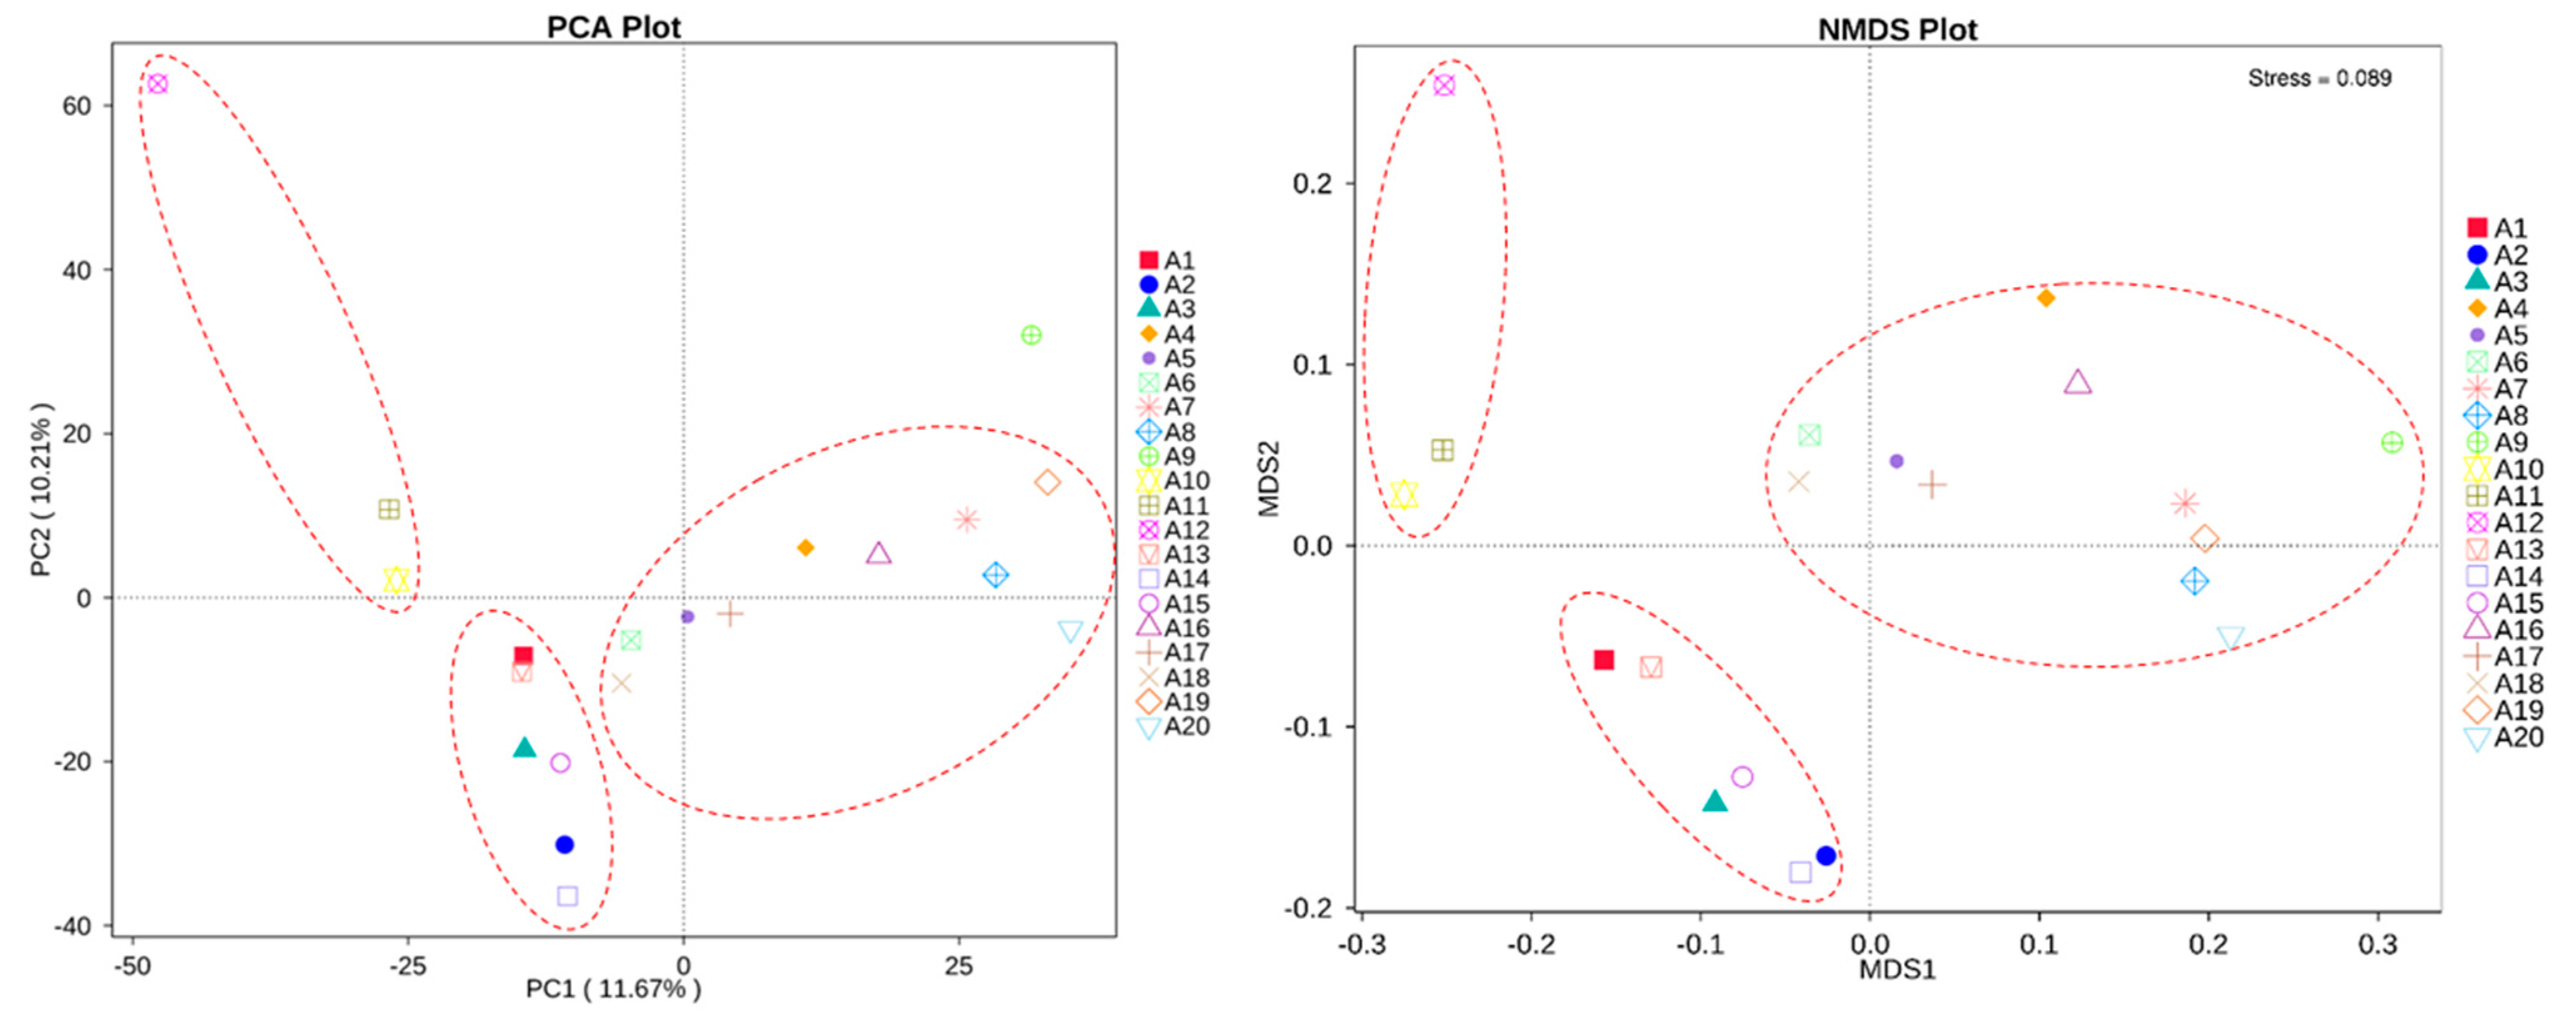
The RHB30 exhibited the highest OTU number, indicating a higher soil microbial diversity, followed by RH10 and RHB10, the control, and RH30 (Figure 4). The dilution curve for OTU reflected the rationality of the amount of sequencing data directly and the richness of species in the sample indirectly. Biochar can promote favorable soil conditions, hence altering the structure and diversity of the soil microbial community [20]. For instance, it has a suitable pore structure that can provide a good habitat for the reproduction of microorganisms [37,38]. Biochar also supplies the microorganisms with a C source through its labile C fraction and enhances the soil properties [39,40], which could indirectly enhance the diversity of microbial communities in the soil. However, the effect of RHB30 on the richness and alpha diversity was minimal, as demonstrated by the Shannon, Chao 1, and Simpson indices at the OTU level (Table S1) and the β diversity heat map based on weighted and unweighted unifrac (Figure S4). The PCA and NMDS showed similarities and differences among all treatments (Figure 5). The results of both PCA and NMDS showed that the low dose of biochar (RHB10) was lumped with the control in the same group, indicating no large effects on β diversity, while RHB30 and RH10 showed similar effects. This result was consistent with that of the OTU number that showed higher effects of RHB30 and RH10 on the OTU number compared to the other treatments (Figure 4).
Overall, the application of RH and RHB to the soil showed varied influences on the microbial community diversity in the soil. The high dose of biochar (RHB30) enhanced the diversity of the microbial community, while the high dose of RH decreased it. The induced changes in soil properties and the characteristic of the DOM following the application of RH and RHB led to changes in microbial metabolism and the enrichment/diminishment of microbial species in the soil. Among these amendments, RHB30 showed the highest positive effect on the diversity of microbial communities in the soil. However, the effect of biochar on microbial diversity is regulated by many factors, including the biochar feedstock type and production condition, as well as the soil type.

4. Conclusions

The addition of rice husk and its biochar at different doses to the soil affected the C stability, the generation of DOM substances, and the abundance and diversity of microbial communities in the soil differentially. In particular, the application of RH to the soil increased labile C, while that of rice husk biochar increased the recalcitrant C concentrations. The high aliphatic components of the rice husk compared to its biochar increased the DOC, released from soluble organic metabolites, in the soils treated with the high dose of RH compared to the soils treated with RHB. This study shows that the biochar treatments stimulated the release of humic-like DOM substances (e.g., (poly)phenolics) into the soil solution and reflected the stability of the biochar in the soil, as the humification process stimulates the presence of high-molecular-weight substances in soil. The abundance of microbial communities varied among different treatments. In contrast, the higher relative abundances of Proteobacteria, Chloroflexi, and Planctomycetota in the soils treated with biochar indicated that these microorganisms play a crucial role in the function of RHB in the soil. The high dose of biochar application increased the diversity of the microbial community, while the high dose of RH application reduced the diversity of the microbial community. The results of this study demonstrated the potential for RHB to promote C stability and the diversity of microbial communities in soil and the merit of converting the rice husk biomass into biochar before its application to soil. However, long-term field studies are still needed to validate these findings.

Supplementary Materials

The following supporting information can be downloaded at: https://www.mdpi.com/article/10.3390/land11122265/s1, Table S1: Soil microbial diversity in the soils treated with rice husk (RH) and its biochar (RHB) at two rates (10 and 30 t ha−1). Figure S1: Site of the soil sample collected from the forest soil in Hangzhou (30°27′ N, 119°57′ E), Zhejiang, China and used in the experiment. Figure S2: Collection of composite samples from the surface layer (0–20 cm) of each pot using a stainless-steel auger at the end of the experiment. Figure S3: Effects of the addition of rice husk (RH) and its biochar (RHB) at two rates (10 and 30 t ha−1) to the soil on the 13C-CPMAS NMR spectra of soils. Figure S4: Effects of the addition of rice husk (RH) and its biochar (RHB) at two rates (10 and 30 t ha−1) to the soil on the beta diversity index heat map. Figure S5: The EEM fluorescence spectra and PARAFAC components.

Author Contributions

A.E.-N.: Conceptualization; Data curation; Formal analysis; Methodology; Software; Visualization; Writing—original draft. R.Z.: Methodology; Visualization; Writing—review & editing. R.T.: Validation; Visualization; Writing—review & editing. J.H.: Data curation; Validation; Visualization; Methodology; Writing—review & editing. Y.C.: Conceptualization; Funding acquisition; Project administration; Supervision; Validation; Writing—review & editing. S.X.C.: Conceptualization; Data curation; Funding acquisition; Project administration; Resources; Supervision; Validation; Visualization; Writing—review & editing. All authors have read and agreed to the published version of the manuscript.

Funding

This study was supported by the National Natural Science Foundation of China (42050410315, 41877085, 41877088), the Research and Development Fund of Zhejiang A&F University (2018FR005, 2018FR006), the Open Research Fund Program of the State Key Laboratory of Subtropical Silviculture, Zhejiang A&F University (ZY20180301, ZY20180205), and the Zhejiang Postdoctoral Research Program (20120200001).

Conflicts of Interest

The authors declare no conflict of interest.

References

  1. FAO Rice Market Monitor (RMM). April 2018. Available online: www.fao.org/economic/RMM (accessed on 15 August 2022).
  2. Bushra, B.; Remya, N. Biochar from pyrolysis of rice husk biomass—Characteristics, modification and environmental application. Biomass. Convers. Biorefin. 2020, 1–12. Available online: https://doi.org/10.1007/S13399-020-01092-3 (accessed on 18 October 2022). [CrossRef]
  3. Abrishamkesh, S.; Gorji, M.; Asadi, H.; Bagheri-Marandi, G.H.; Pourbabaee, A.A. Effects of rice husk biochar application on the properties of alkaline soil and lentil growth. Plant Soil Environ. 2015, 61, 475–482. [Google Scholar] [CrossRef] [Green Version]
  4. Singh, C.; Tiwari, S.; Gupta, V.K.; Singh, J.S. The effect of rice husk biochar on soil nutrient status, microbial biomass and paddy productivity of nutrient poor agriculture soils. CATENA 2018, 171, 485–493. [Google Scholar] [CrossRef]
  5. El-Naggar, A.; El-Naggar, A.H.; Shaheen, S.M.; Sarkar, B.; Chang, S.X.; Tsang, D.C.; Rinklebe, J.; Ok, Y.S. Biochar composition-dependent impacts on soil nutrient release, carbon mineralization, and potential environmental risk: A review. J. Environ. Manag. 2019, 241, 458–467. [Google Scholar] [CrossRef]
  6. El-Naggar, A.; Shaheen, S.M.; Ok, Y.S.; Rinklebe, J. Biochar affects the dissolved and colloidal concentrations of Cd, Cu, Ni, and Zn and their phytoavailability and potential mobility in a mining soil under dynamic redox-conditions. Sci. Total Environ. 2018, 624, 1059–1071. [Google Scholar] [CrossRef]
  7. Yang, X.; Wen, E.; Ge, C.; El-Naggar, A.; Yu, H.; Wang, S.; Kwon, E.E.; Song, H.; Shaheen, S.M.; Wang, H.; et al. Iron-modified phosphorus- and silicon-based biochars exhibited various influences on arsenic, cadmium, and lead accumulation in rice and enzyme activities in a paddy soil. J. Hazard. Mater. 2023, 443, 130203. [Google Scholar] [CrossRef]
  8. El-Naggar, A.; Lee, M.-H.; Hur, J.; Lee, Y.H.; Igalavithana, A.D.; Shaheen, S.M.; Ryu, C.; Rinklebe, J.; Tsang, D.C.; Ok, Y.S. Biochar-induced metal immobilization and soil biogeochemical process: An integrated mechanistic approach. Sci. Total. Environ. 2020, 698, 134112. [Google Scholar] [CrossRef]
  9. Quang, V.L.; Kim, H.-C.; Maqbool, T.; Hur, J. Fate and fouling characteristics of fluorescent dissolved organic matter in ultrafiltration of terrestrial humic substances. Chemosphere 2016, 165, 126–133. [Google Scholar] [CrossRef]
  10. Yang, X.; Tsibart, A.; Nam, H.; Hur, J.; El-Naggar, A.; Tack, F.M.; Wang, C.-H.; Lee, Y.H.; Tsang, D.C.; Ok, Y.S. Effect of gasification biochar application on soil quality: Trace metal behavior, microbial community, and soil dissolved organic matter. J. Hazard. Mater. 2019, 365, 684–694. [Google Scholar] [CrossRef]
  11. Rajapaksha, A.U.; Ok, Y.S.; El-Naggar, A.; Kim, H.; Song, F.; Kang, S.; Tsang, Y.F. Dissolved organic matter characterization of biochars produced from different feedstock materials. J. Environ. Manag. 2019, 233, 393–399. [Google Scholar] [CrossRef]
  12. Zhou, R.; El-Naggar, A.; Li, Y.; Cai, Y.; Chang, S.X. Converting rice husk to biochar reduces bamboo soil N2O emissions under different forms and rates of nitrogen additions. Environ. Sci. Pollut. Res. 2021, 28, 28777–28788. [Google Scholar] [CrossRef] [PubMed]
  13. Brown, I.C. A rapid method of determining exchangeable hydrogen and total exchangeable bases of soils. Soil Sci. 2006, 56, 353–358. [Google Scholar] [CrossRef]
  14. Weishaar, J.L.; Aiken, G.R.; Bergamaschi, B.; Fram, M.; Fujii, R.; Mopper, K. Evaluation of Specific Ultraviolet Absorbance as an Indicator of the Chemical Composition and Reactivity of Dissolved Organic Carbon. Environ. Sci. Technol. 2003, 37, 4702–4708. [Google Scholar] [CrossRef] [PubMed]
  15. Mcknight, D.; Boyer, E.; Westerhoff, P.K.; Doran, P.T.; Kulbe, T.; Andersen, D. Spectrofluorometric characterization of dissolved organic matter for indication of precursor organic material and aromaticity. Limnol. Oceanogr. 2001, 46, 38–48. [Google Scholar] [CrossRef]
  16. Heo, J.; Yoon, Y.; Kim, D.-H.; Lee, H.; Lee, D.; Her, N. A new fluorescence index with a fluorescence excitation-emission matrix for dissolved organic matter (DOM) characterization. Desalination Water Treat. 2015, 57, 20270–20282. [Google Scholar] [CrossRef]
  17. Zsolnay, A.; Baigar, E.; Jimenez, M.; Steinweg, B.; Saccomandi, F. Differentiating with fluorescence spectroscopy the sources of dissolved organic matter in soils subjected to drying. Chemosphere 1999, 38, 45–50. [Google Scholar] [CrossRef]
  18. Huguet, A.; Vacher, L.; Relexans, S.; Saubusse, S.; Froidefond, J.; Parlanti, E. Properties of fluorescent dissolved organic matter in the Gironde Estuary. Org. Geochem. 2009, 40, 706–719. [Google Scholar] [CrossRef]
  19. Ha, L.T.V.; Vanlerberghe, L.; Toan, H.T.; Dewettinck, K.; Messens, K. Comparative Evaluation of Six Extraction Methods for DNA Quantification and PCR Detection in Cocoa and Cocoa-Derived Products. Food Biotechnol. 2015, 29, 1–19. [Google Scholar] [CrossRef]
  20. El-Naggar, A.; Lee, S.S.; Rinklebe, J.; Farooq, M.; Song, H.; Sarmah, A.K.; Zimmerman, A.R.; Ahmad, M.; Shaheen, S.M.; Ok, Y.S. Biochar application to low fertility soils: A review of current status, and future prospects. Geoderma 2019, 337, 536–554. [Google Scholar] [CrossRef]
  21. Angst, T.E.; Sohi, S.P. Establishing release dynamics for plant nutrients from biochar. GCB Bioenergy 2013, 5, 221–226. [Google Scholar] [CrossRef]
  22. El-Naggar, A.; Lee, S.S.; Awad, Y.M.; Yang, X.; Ryu, C.; Rizwan, M.; Rinklebe, J.; Tsang, D.C.; Ok, Y.S. Influence of soil properties and feedstocks on biochar potential for carbon mineralization and improvement of infertile soils. Geoderma 2018, 332, 100–108. [Google Scholar] [CrossRef]
  23. Cely, P.; Tarquis, A.M.; Paz-Ferreiro, J.; Méndez, A.; Gascó, G. Factors driving the carbon mineralization priming effect in a sandy loam soil amended with different types of biochar. Solid Earth 2014, 5, 585–594. [Google Scholar] [CrossRef] [Green Version]
  24. El-Naggar, A.; Awad, Y.; Tang, X.-Y.; Liu, C.; Niazi, N.K.; Jien, S.-H.; Tsang, D.C.; Song, H.; Ok, Y.S.; Lee, S.S. Biochar influences soil carbon pools and facilitates interactions with soil: A field investigation. Land Degrad. Dev. 2018, 29, 2162–2171. [Google Scholar] [CrossRef]
  25. El-Naggar, A.; Shaheen, S.M.; Chang, S.X.; Hou, D.; Ok, Y.S.; Rinklebe, J. Biochar Surface Functionality Plays a Vital Role in (Im)Mobilization and Phytoavailability of Soil Vanadium. ACS Sustain. Chem. Eng. 2021, 9, 6864–6874. [Google Scholar] [CrossRef]
  26. Rinklebe, J.; Shaheen, S.M.; El-Naggar, A.; Wang, H.; Du Laing, G.; Alessi, D.S.; Ok, Y.S. Redox-induced mobilization of Ag, Sb, Sn, and Tl in the dissolved, colloidal and solid phase of a biochar-treated and un-treated mining soil. Environ. Int. 2020, 140, 105754. [Google Scholar] [CrossRef] [PubMed]
  27. Lebrun, M.; Nandillon, R.; Miard, F.; Bourgerie, S.; Morabito, D. Biochar Assisted Phytoremediation for Metal(loid) Contaminated Soils. In Assisted Phytoremediation; Elsevier: Amsterdam, The Netherlands, 2022; pp. 101–130. [Google Scholar] [CrossRef]
  28. Romero, C.M.; Redman, A.-A.P.; Terry, S.A.; Hazendonk, P.; Hao, X.; McAllister, T.A.; Okine, E. Molecular speciation and aromaticity of biochar-manure: Insights from elemental, stable isotope and solid-state DPMAS 13C NMR analyses. J. Environ. Manag. 2021, 280, 111705. [Google Scholar] [CrossRef]
  29. Sarker, T.C.; Incerti, G.; Spaccini, R.; Piccolo, A.; Mazzoleni, S.; Bonanomi, G. Linking organic matter chemistry with soil aggregate stability: Insight from 13C NMR spectroscopy. Soil Biol. Biochem. 2018, 117, 175–184. [Google Scholar] [CrossRef]
  30. Hur, J.; Lee, B.-M.; Shin, K.-H. Spectroscopic characterization of dissolved organic matter isolates from sediments and the association with phenanthrene binding affinity. Chemosphere 2014, 111, 450–457. [Google Scholar] [CrossRef]
  31. Zhang, J.; Lü, F.; Luo, C.; Shao, L.; He, P. Humification characterization of biochar and its potential as a composting amendment. J. Environ. Sci. 2014, 26, 390–397. [Google Scholar] [CrossRef]
  32. Cottrell, M.T.; Kirchman, D.L. Natural Assemblages of Marine Proteobacteria and Members of the Cytophaga-Flavobacter Cluster Consuming Low- and High-Molecular-Weight Dissolved Organic Matter. Appl. Environ. Microbiol. 2000, 66, 1692–1697. [Google Scholar] [CrossRef] [Green Version]
  33. Jones, R.T.; Robeson, M.; Lauber, C.L.; Hamady, M.; Knight, R.; Fierer, N. A comprehensive survey of soil acidobacterial diversity using pyrosequencing and clone library analyses. ISME J. 2009, 3, 442–453. [Google Scholar] [CrossRef] [PubMed] [Green Version]
  34. Yin, D.; Li, H.; Wang, H.; Guo, X.; Wang, Z.; Lv, Y.; Ding, G.; Jin, L.; Lan, Y. Impact of Different Biochars on Microbial Community Structure in the Rhizospheric Soil of Rice Grown in Albic Soil. Molecules 2021, 26, 4783. [Google Scholar] [CrossRef] [PubMed]
  35. Fierer, N.; Bradford, M.A.; Jackson, R.B. Toward an ecological classification of soil bacteria. Ecology 2007, 88, 1354–1364. [Google Scholar] [CrossRef] [PubMed]
  36. Wang, J.; Huang, R.; Zhu, L.; Guan, H.; Lin, L.; Fang, H.; Yang, M.; Ji, S.; Zou, X.; Li, X. The Effects of Biochar on Microbial Community Composition in and Beneath Biological Soil Crusts in a Pinus massoniana Lamb. Plantation. Forests 2022, 13, 1141. [Google Scholar] [CrossRef]
  37. Jiang, L.-L.; Han, G.-M.; Lan, Y.; Liu, S.-N.; Gao, J.-P.; Yang, X.; Meng, J.; Chen, W.-F. Corn cob biochar increases soil culturable bacterial abundance without enhancing their capacities in utilizing carbon sources in Biolog Eco-plates. J. Integr. Agric. 2017, 16, 713–724. [Google Scholar] [CrossRef] [Green Version]
  38. Hoang, A.T.; Goldfarb, J.L.; Foley, A.M.; Lichtfouse, E.; Kumar, M.; Xiao, L.; Ahmed, S.F.; Said, Z.; Luque, R.; Bui, V.G.; et al. Production of biochar from crop residues and its application for anaerobic digestion. Bioresour. Technol. 2022, 363, 127970. [Google Scholar] [CrossRef]
  39. Šrank, D.; Šimanský, V. Differences in soil organic matter and humus of sandy soil after application of biochar substrates and combination of biochar substrates with mineral fertilizers. Acta Fytotech. Zootech. 2020, 23, 117–124. [Google Scholar] [CrossRef]
  40. Pokharel, P.; Ma, Z.; Chang, S.X. Biochar increases soil microbial biomass with changes in extra- and intracellular enzyme activities: A global meta-analysis. Biochar 2020, 2, 65–79. [Google Scholar] [CrossRef]
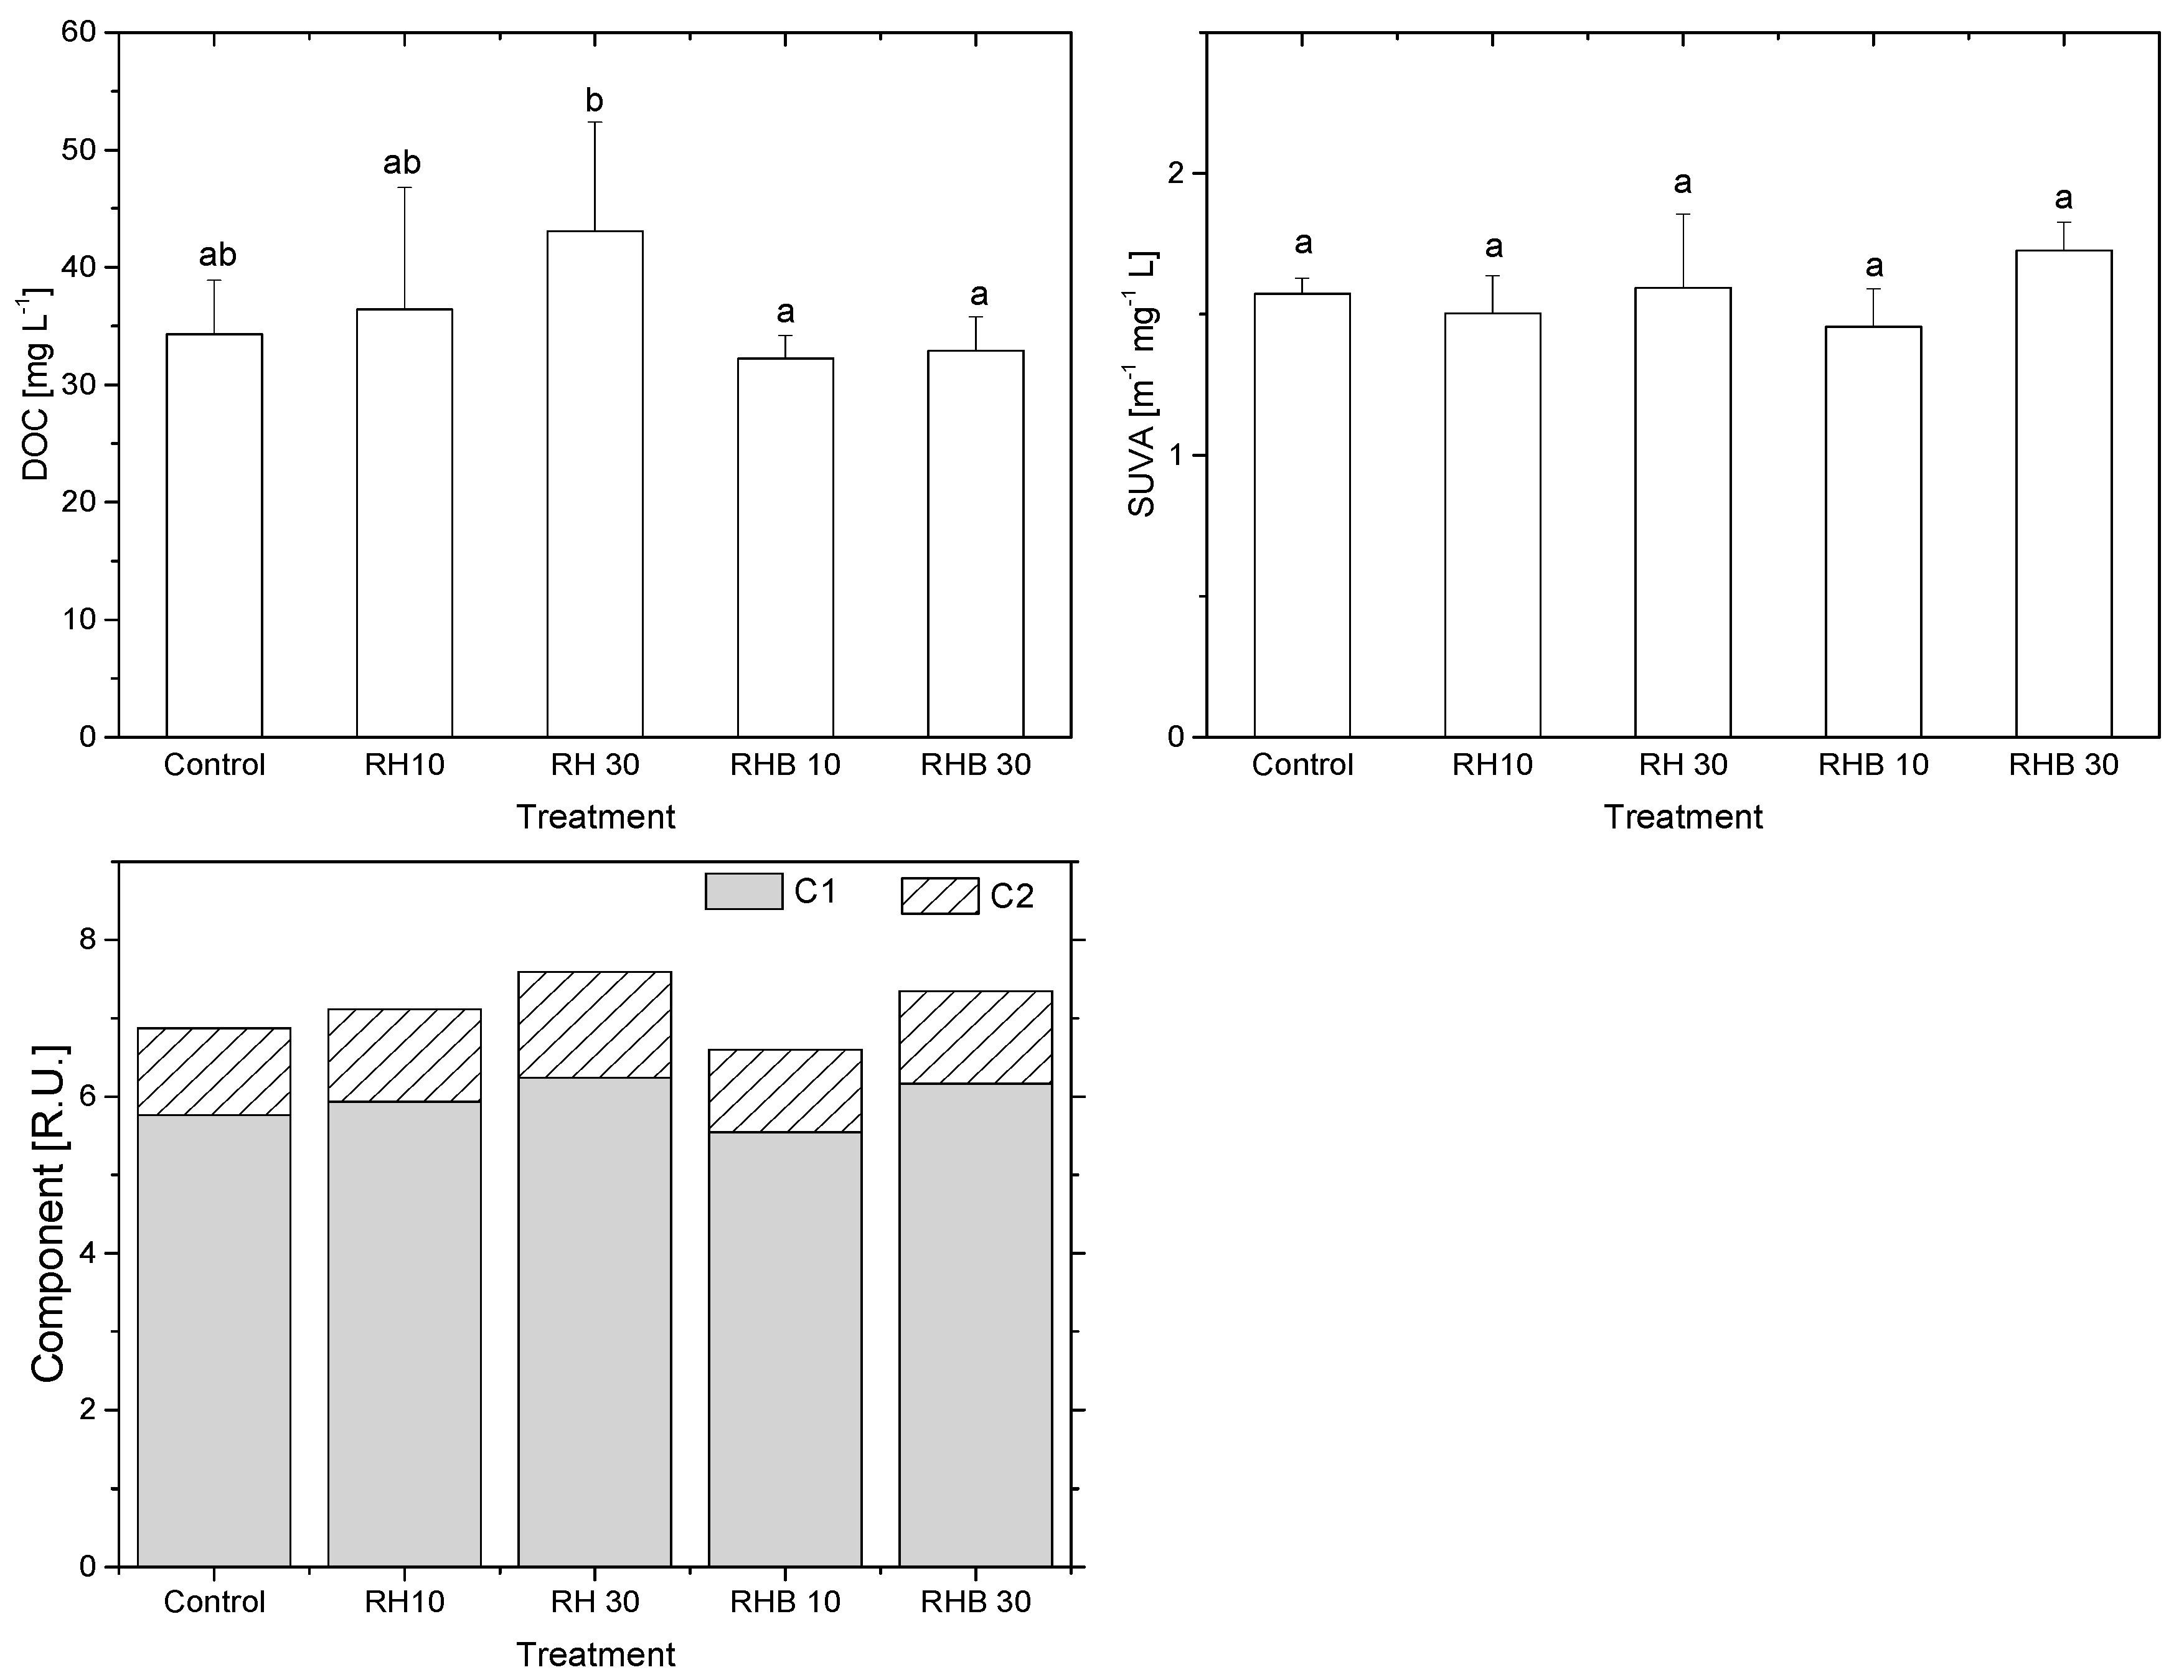
Figure 1. Effects of the addition of rice husk (RH) and its biochar (RHB) at two rates (10 and 30 t ha −1) to the soil on DOC (dissolved organic carbon), SUVA (specific UV absorbance, serves as an indicator of the chemical composition of the DOC), and deconvoluted PARAFAC components (C1: humic-like, C2: protein-like) in the soil. Error bars indicate the standard deviation of the mean. The same letters above the bars indicate no difference among the treatments at a 0.05 significance level.
Land 11 02265 g001
Figure 2. Effects of the addition of the rice husk (RH) and its biochar (RHB) at two rates (10 and 30 t ha−1) to the soil on the relative abundance of (a) phylum and (b) phylum-level species phylogenetic relationships. A1–4: control, A5–8: RH10, A9–12: RH30, A13–16: RHB10, and A17-A20: RHB30.
Land 11 02265 g002
Figure 3. Heat map of the phylum abundance cluster plot for the top 35 genera of all the samples at the phylum level after the addition of rice husk (RH) and its biochar (RHB) at two rates (10 and 30 t ha−1) to the soil. A1–4: control, A5–8: RH10, A9–12: RH30, A13–16: RHB10, and A17-A20: RHB30.
Land 11 02265 g003
Figure 4. Effects of the addition of rice husk (RH) and its biochar (RHB) at two rates (10 and 30 t ha−1) to the soil on the species diversity curve.
Land 11 02265 g004
Figure 5. The principal component analysis (PCA) and non-metric multidimensional scaling (NMDS) based on OTU-level data and soil samples collected from soils treated with rice husk (RH) and its biochar (RHB) at two rates (10 and 30 t ha−1) at the end of the experiment. A1–4: control, A5–8: RH10, A9–12: RH30, A13–16: RHB10, and A17–A20: RHB30.
Land 11 02265 g005
Table 1. Effects of the addition of rice husk (RH) and its biochar (RHB) at two rates (10 and 30 t ha−1) to the soil on physicochemical properties.
TreatmentpH (CaCl2)ECCaKMgNaCEC
[dS m−1][cmol kg−1]
Control4.2 ± 0.1 ab3.1 ± 0.6 a6.0 ± 1.3 a1.2 ± 0.1 b1.1 ± 0.1 a2.7 ± 0.7 a10.9 ± 1.6 a
RH104.1 ± 0.0 a3.3 ± 0.8 a6.0 ± 0.2 a1.1 ± 0.1 a1.1 ± 0.0 a2.4 ± 0.2 a10.5 ± 0.5 a
RH304.2 ± 0.1 a3.0 ± 0.7 a6.0 ± 0.6 a1.4 ± 0.2 b1.0 ± 0.1 a2.3 ± 0.1 a10.7 ± 0.8 a
RHB104.2 ± 0.1 a3.3 ± 0.3 a6.7 ± 1.1 a1.8 ± 0.2 c1.0 ± 0.1 a2.3 ± 0.2 a11.8 ± 1.4 a
RHB304.3 ± 0.1 b4.3 ± 0.5 b7.1 ± 1.0 a1.3 ± 0.1 b1.1 ± 0.1 a2.2 ± 0.1 a11.7 ± 0.9 a
pH (1:5 (w/v) soil: 0.01 M CaCl2); electrical conductivity (EC, 1:5 (w/v) soil: water); cation exchange capacity (CEC). Data are the means ± standard deviation. Different letters after the standard deviations represent significant differences among the treatments at p < 0.05.
Table 2. Effects of the addition of rice husk (RH) and its biochar (RHB) at two rates (10 and 30 t ha−1) to the soil on the relative abundance (%) of carbon functional groups.
TreatmentCarbonyl CAromatic CO-alkyl CMethoxyl CAlkyl C
Control12.59.317.512.748.0
RH1017.34.021.34.652.8
RH3021.2-18.114.046.8
RHB1015.047.69.06.621.8
RHB306.661.16.74.920.6
Table 3. Effects of the addition of rice husk (RH) and its biochar (RHB) at two rates (10 and 30 t ha−1) to the soil on spectroscopic and fluorescence indices in the soil.
TreatmentHIX (Zsolnay)BIXFI (McKnight)YFI
Control4.95 ± 0.31 a0.67 ± 0.02 b1.79 ± 0.02 b0.56 ± 0.01 a
RH104.92 ± 0.80 a0.68 ± 0.01 b1.79 ± 0.03 b0.57 ± 0.02 ab
RH304.70 ± 0.50 a0.68 ± 0.01 b1.78 ± 0.01 b0.59 ± 0.03 b
RHB105.36 ± 0.53 a0.67 ± 0.02 ab1.79 ± 0.03 b0.55 ± 0.01 a
RHB305.29 ± 0.33 a0.65 ± 0.02 a1.74 ± 0.03 a0.55 ± 0.01 a
Humification index (HIX); biological index (BIX); fluorescence index (FI); Y fluorescence index (YFI). Data are the means ± standard deviation. Different letters after the standard deviations represent significant differences among the treatments at p < 0.05.
Publisher’s Note: MDPI stays neutral with regard to jurisdictional claims in published maps and institutional affiliations.