Article

Distribution of Soil Microbes in Urban Parks: An Effect of Under-Tree Crown and Hillside Position on Testate Amoeba Assemblages in Subtropics (Shenzhen, China)

by
Yuantan Zhong
1,2,*,
Aleksandr Ivanovskii
1,2,
Jean Claude Ndayishimiye
1,
Andrey N. Tsyganov
2,
Kirill Babeshko
1,2,
Damir Saldaev
1,2 and
Yuri Mazei
1,2,3
1
Faculty of Biology, Shenzhen MSU-BIT University, International University Park Road, Dayun New Town, Longgang District, Shenzhen 518172, China
2
Faculty of Biology, Lomonosov Moscow State University, Leninskiye Gory 1, Moscow 119991, Russia
3
A.N. Severtsov Institute of Ecology and Evolution of the Russian Academy of Sciences, Leninskiy Ave. 33, Moscow 117071, Russia
*
Author to whom correspondence should be addressed.
Land 2022, 11(12), 2250; https://doi.org/10.3390/land11122250
Submission received: 10 November 2022 / Revised: 2 December 2022 / Accepted: 5 December 2022 / Published: 9 December 2022

Abstract

:
Testate amoebae (TA) are important components of soil ecosystems, where they play an essential role in belowground food webs. In this study, we examined species composition, diversity, and structure of TA assemblages in soils beneath tree crowns (microscale) at three slope positions (mesoscale) in subtropical urban parks in Shenzhen, China. Forty-two species of TA belonging to 18 genera were identified in 81 samples. TA assemblages were the most diverse and abundant in the center of the tree crown comparing with other under-tree habitats. Foot of the hills harbored higher TA abundance and diversity comparing with upper locations along the hillslopes. The distribution of TA was mostly driven by under-crown and hillside positions but not by elementary environmental conditions such as pH, moisture content and thickness of leaf litter layer. None of later factors were sufficient in shaping TA assemblage composition. The findings of our study suggest that in regional studies of soil microbial eukaryotes both micro- (i.e., under-crown) and mesoscale (i.e., the slope position) heterogeneity should be considered.

1. Introduction

Evidence from ecological studies on urban green areas is considered a sufficient and necessary part of comprehensive management strategy in an urban environment [1]. Green areas in urban territories are hot points where ecological relations develop in an environment strongly affected (and managed) by human activity [2,3]. Various groups of organisms, both taxonomical and ecological, attract the attention of researchers in green urban territories: microorganisms (bacteria) and “landscape-makers”—higher plants—as well as arthropods and other soil-dwelling invertebrates [4,5]. In addition, urban territories, including green urban zones, deliver various insights into soil community ecology from warm, moderate, and cold climatic conditions [6,7,8]. Among all soil microorganisms, the protist fauna of urban green territories in subtropical climate remains almost unstudied, but it may reveal ecological patterns other than in moderate climate conditions [9].
Testate amoebae (TA) are a polyphyletic group of unicellular eukaryotes that inhabit aquatic biotopes, wetlands, mosses, and soils [10]. There is a growing interest in studies on TA due to high indicator value both in modern and palaeoecological settings [10,11], wide geographical distribution, and short life cycle [12,13,14]. Additionally, thanks to the presence of the shell [12,15], they are good model organisms for studying distribution patterns of microorganisms at different levels of environment hierarchy. Most of the previous studies on TA assemblages in soils were focused on larger-scale environmental gradients such as altitudinal, latitudinal, and climatic gradients [13]. At the same time, little is known about the distribution of TA at smaller scales, e.g., in the sub-crown space of plants [16]. Furthermore, micro-scale patterns might differ significantly in various types of environmental conditions and biological objects in disturbed territories, either rural or urban [17,18]. Meanwhile, the micro-topography of the land considerably affects TA communities by changing habitats (e.g., through erosional processes) and plant distribution [13]. These demonstrate that interactions among microtopography, vegetation, and environmental variables (e.g., moisture, temperature, pH, and nutrient availability) can regulate the structure and variation in the TA community [19,20,21,22,23,24]. However, the main drivers of TA assemblages in many environmental settings remain poorly understood.
The effects of elevation on soil microbes remain debated despite a large number of studies. Although there were some studies on the effects of altitudinal gradients on the distribution of TA [25,26], there were many controversies. For example, in a study of freshwater protists in European mountains [27], the authors found that the richness and diversity of freshwater protists decrease with altitude in a similar manner observed for plants and animals. However, another study [28] in Switzerland found that the lowest altitudes were characterized by the lowest TA density and species richness, while the highest altitudes had the highest TA density. The results of these two studies were opposite, which indicates that we need more data to explain the altitudinal distribution of TA.
Most of the above-mentioned studies were conducted at a single spatial scale, and inferences based on them might be reliably applied only to a similar sample design. A comparison of evidence from different scales may be ambiguous. Considerable microscale effects on TA assemblages were shown in under-tree crown habitats [29], but a broader scale study [30] revealed that the highest level of spatial heterogeneity also greatly contributes to the species composition of TA assemblages. However, no attempts have been made to address the effects of various spatial scales on TA assemblages in a single sampling design. The main aim of this work is to study the patterns in species diversity and structure of soil TA on a microscale (under tree crowns) and a mesoscale (along the hillside) in urban parks of a subtropical city. Specifically, we had three goals: (1) to investigate the diversity and community composition of soil TA in subtropical urban parks; (2) to assess the distribution patterns of the soil TA communities under tree crowns and along hillsides; (3) to reveal the potential environmental factors that shape the TA community. We hypothesized that (1) the contribution of both scales in shaping of TA assemblages could be high and significant; (2) the hillside position effect (broader scale) could be more sufficient in shaping TA assemblages than at the under-crown position (smaller scale).

2. Materials and Methods

2.1. Study Site Description and Sampling

This study was performed in Shenzhen (a sub-provincial city in the Guangdong province, southeastern China) located on the east bank of the Pearl River estuary. The urban area is 1748 km2, which lies on elevations from 0 to 944 m above the sea level (a.s.l.) (Figure 1a,b). The site is characterized by a warm, monsoon-influenced, humid subtropical climate. Winters are mild and relatively dry due in part to the impact of the South China Sea. The monsoon reaches its peak intensity in the summer, when the city also experiences very humid and hot weather conditions. The average annual temperature is 22.4 °C, the average annual precipitation is ca. 1948 mm [31].
Three urban parks were selected for this study: Baoan, Nanshan, and Yanziling parks (Figure 1c–e). The vegetation in these parks was represented by coniferous forests, mixed conifer forests, evergreen broad-leaved forests, and scrub grassland [32,33,34]. The tree species of genera Acacia Mill. in all parks served as a visual indicator of the dominance of intentionally planted vegetation. Baoan and Nanshan parks are dominated by Litchi chinensis Sonn. The soils in the parks are classified as eroded or granite lateritic red [35]. All parks are located on the hills with the elevation ranging from 45 to 312 m a.s.l.
Samples for this study were collected in June 2021. In each park, we defined three altitudinal zones: the peak (summit), the slope, and the base (foot) of the hill (Figure 1c–e and Table S1). In each altitudinal zone, three different tree species were randomly chosen, and soil samples were collected at three locations beneath the tree crowns: in the center of the crown (CC), in the middle of the crown (MC), and at the edge of the crown (EC) (Figure 2). After removing the leaf litter covering the soil, the topsoil was carefully extracted with a spade to a depth of 5 cm. Each sample was placed in a sealed plastic bag and stored in refrigerator at 4 °C for further analysis. In total, 81 soil samples were collected. During sampling, we measured the size of the crown (i.e., the distance from tree trunk to the edge of the crown) and the thickness of the leaf litter (the mean value based on three measurements per site) using a tape measure and caliper, respectively. Soil acidity (pH) for all samples was measured using a portable soil analyzer with multi probes (RS-TRREC-N01-1, Shandong Renke Control Technology Co. Ltd., Jinan, China). Soil moisture content was determined in the lab by thermogravimetric method (oven-drying, 40 °C, 48 h).

2.2. Testate Amoeba Analysis

TA analysis was carried out using a modified water-based preparation method [24,26,36]. Oven-dried (40 °C, 48 h) samples were sieved using a wide-mesh sieve (2 mm) to remove large particles, such as small gravels, plant roots, and broken leaves. Two grams of the sieved sample were placed in a 50 mL beaker with 30 mL of deionized water to submerge the sample and soak for 24 h. Soaked samples were stirred for 5 min to extract the TA from the soil particles. The suspension was sequentially sieved using 355 and 20 µm sieves, and the sieving residue was washed three times using a weak stream of deionized water. The sieving residue from the fine-mesh sieve was transferred to a 50 mL centrifuge tube, and deionized water was added until the volume reached 50 mL. The prepared samples were stored in a refrigerator at 4 °C for subsequent identification of TA. TA were identified and counted at 200–400× magnification with a Zeiss Axio Lab.A1 microscope (Carl Zeiss Suzhou Co., Suzhou, China). Species were identified using taxonomic references [37,38,39,40,41,42,43,44], and species classification was based on morphological characters according to recent publications [45,46,47,48] and on their aperture positions [49]: axial; plagiostomic; acrostomic (Table S5). The absolute abundance of TA in each sample was calculated as the number of individuals per gram of oven-dried soil (ind·g−1). For each sample, a minimum of 150 individuals [50] were counted. Two samples from Nanshan Park had extremely low species abundance (1 individual per sample) and were not included in the following analysis.

2.3. Statistical Analysis

All calculations and visualizations were performed using R, version 4.1.2 [51]. To estimate the total species richness in the parks, species accumulation curves were plotted using the “specaccum” function in the package “vegan” [52] with the default gamma-diversity estimator. The effects of elevation and sampling location on the univariate characteristics of TA assemblages were tested with analysis of variance (ANOVA, function “aov” and “anova” in the package “stats” [51]) or with Kruskal–Wallis test (function “kruskal.test” in the package “stats” [51]). The homogeneity of variance was tested using Levene’s test (“leveneTest” function in the package “car” [53]). Post-hoc multivariate comparisons were performed using Tukey’s HSD test (function “PostHocTest” in the package “DescTools” [54]) or with pair-wise Wilcoxon rank sum tests (function “pairwise.wilcox.test” in the package “stats” [51]). Non-parametric tests were used for the comparison of differences in TA’s abundance, species richness, Shannon’s diversity index, Pielou’s evenness index, and soil moisture among three slope positions. All other data subsets (assemblage characteristics in three crown positions and the rest of the environmental factors) did not violate the underlying assumptions of parametric tests and were compared using the latter.
The species abundance data were Hellinger-transformed using the “decostand” function in the package “vegan” [52] in order to avoid horseshoe effect (arch effect) in the subsequent ordination analysis [55]. Principal coordinate analysis (PCoA) of the transformed species abundances was performed using the function “pcoa” in the package “ape” [56]. The weighted average score of the species was calculated using the function “wascores” in the package “vegan” [52]. Detrended correspondence analysis (DCA) of the transformed abundance data was performed using the “decorana” function in the package “vegan” [52]. The result of DCA showed that the gradient length of the first axis was 2.56, which was less than 3.0, so redundancy analysis (RDA) was selected as a tool for constrained multivariate analysis [57] (“rda” function in the package “vegan” [52]). The significance of the RDA constraints was tested with the function “anova.cca” in the package “vegan” [52]. Significance of differences in species composition between groups of samples was tested with permutational multivariate analysis of variance (PerMANOVA) based on Bray–Curtis distances (permutation number = 999) using the function “adonis” in the package “vegan” [52] and the function “pairwise.adonis” in the package “pairwiseAdonis” [58]. To estimate the preferences of species for a particular biotope we performed indicator species analysis using the functions “multipatt”, “indicators”, and “pruneindicators” in the package “indicspecies” [59,60], which allows to estimate as an indicator certain species combinations in addition to single species.

3. Results

3.1. Overall Characteristics of TA Communities and Environmental Variables

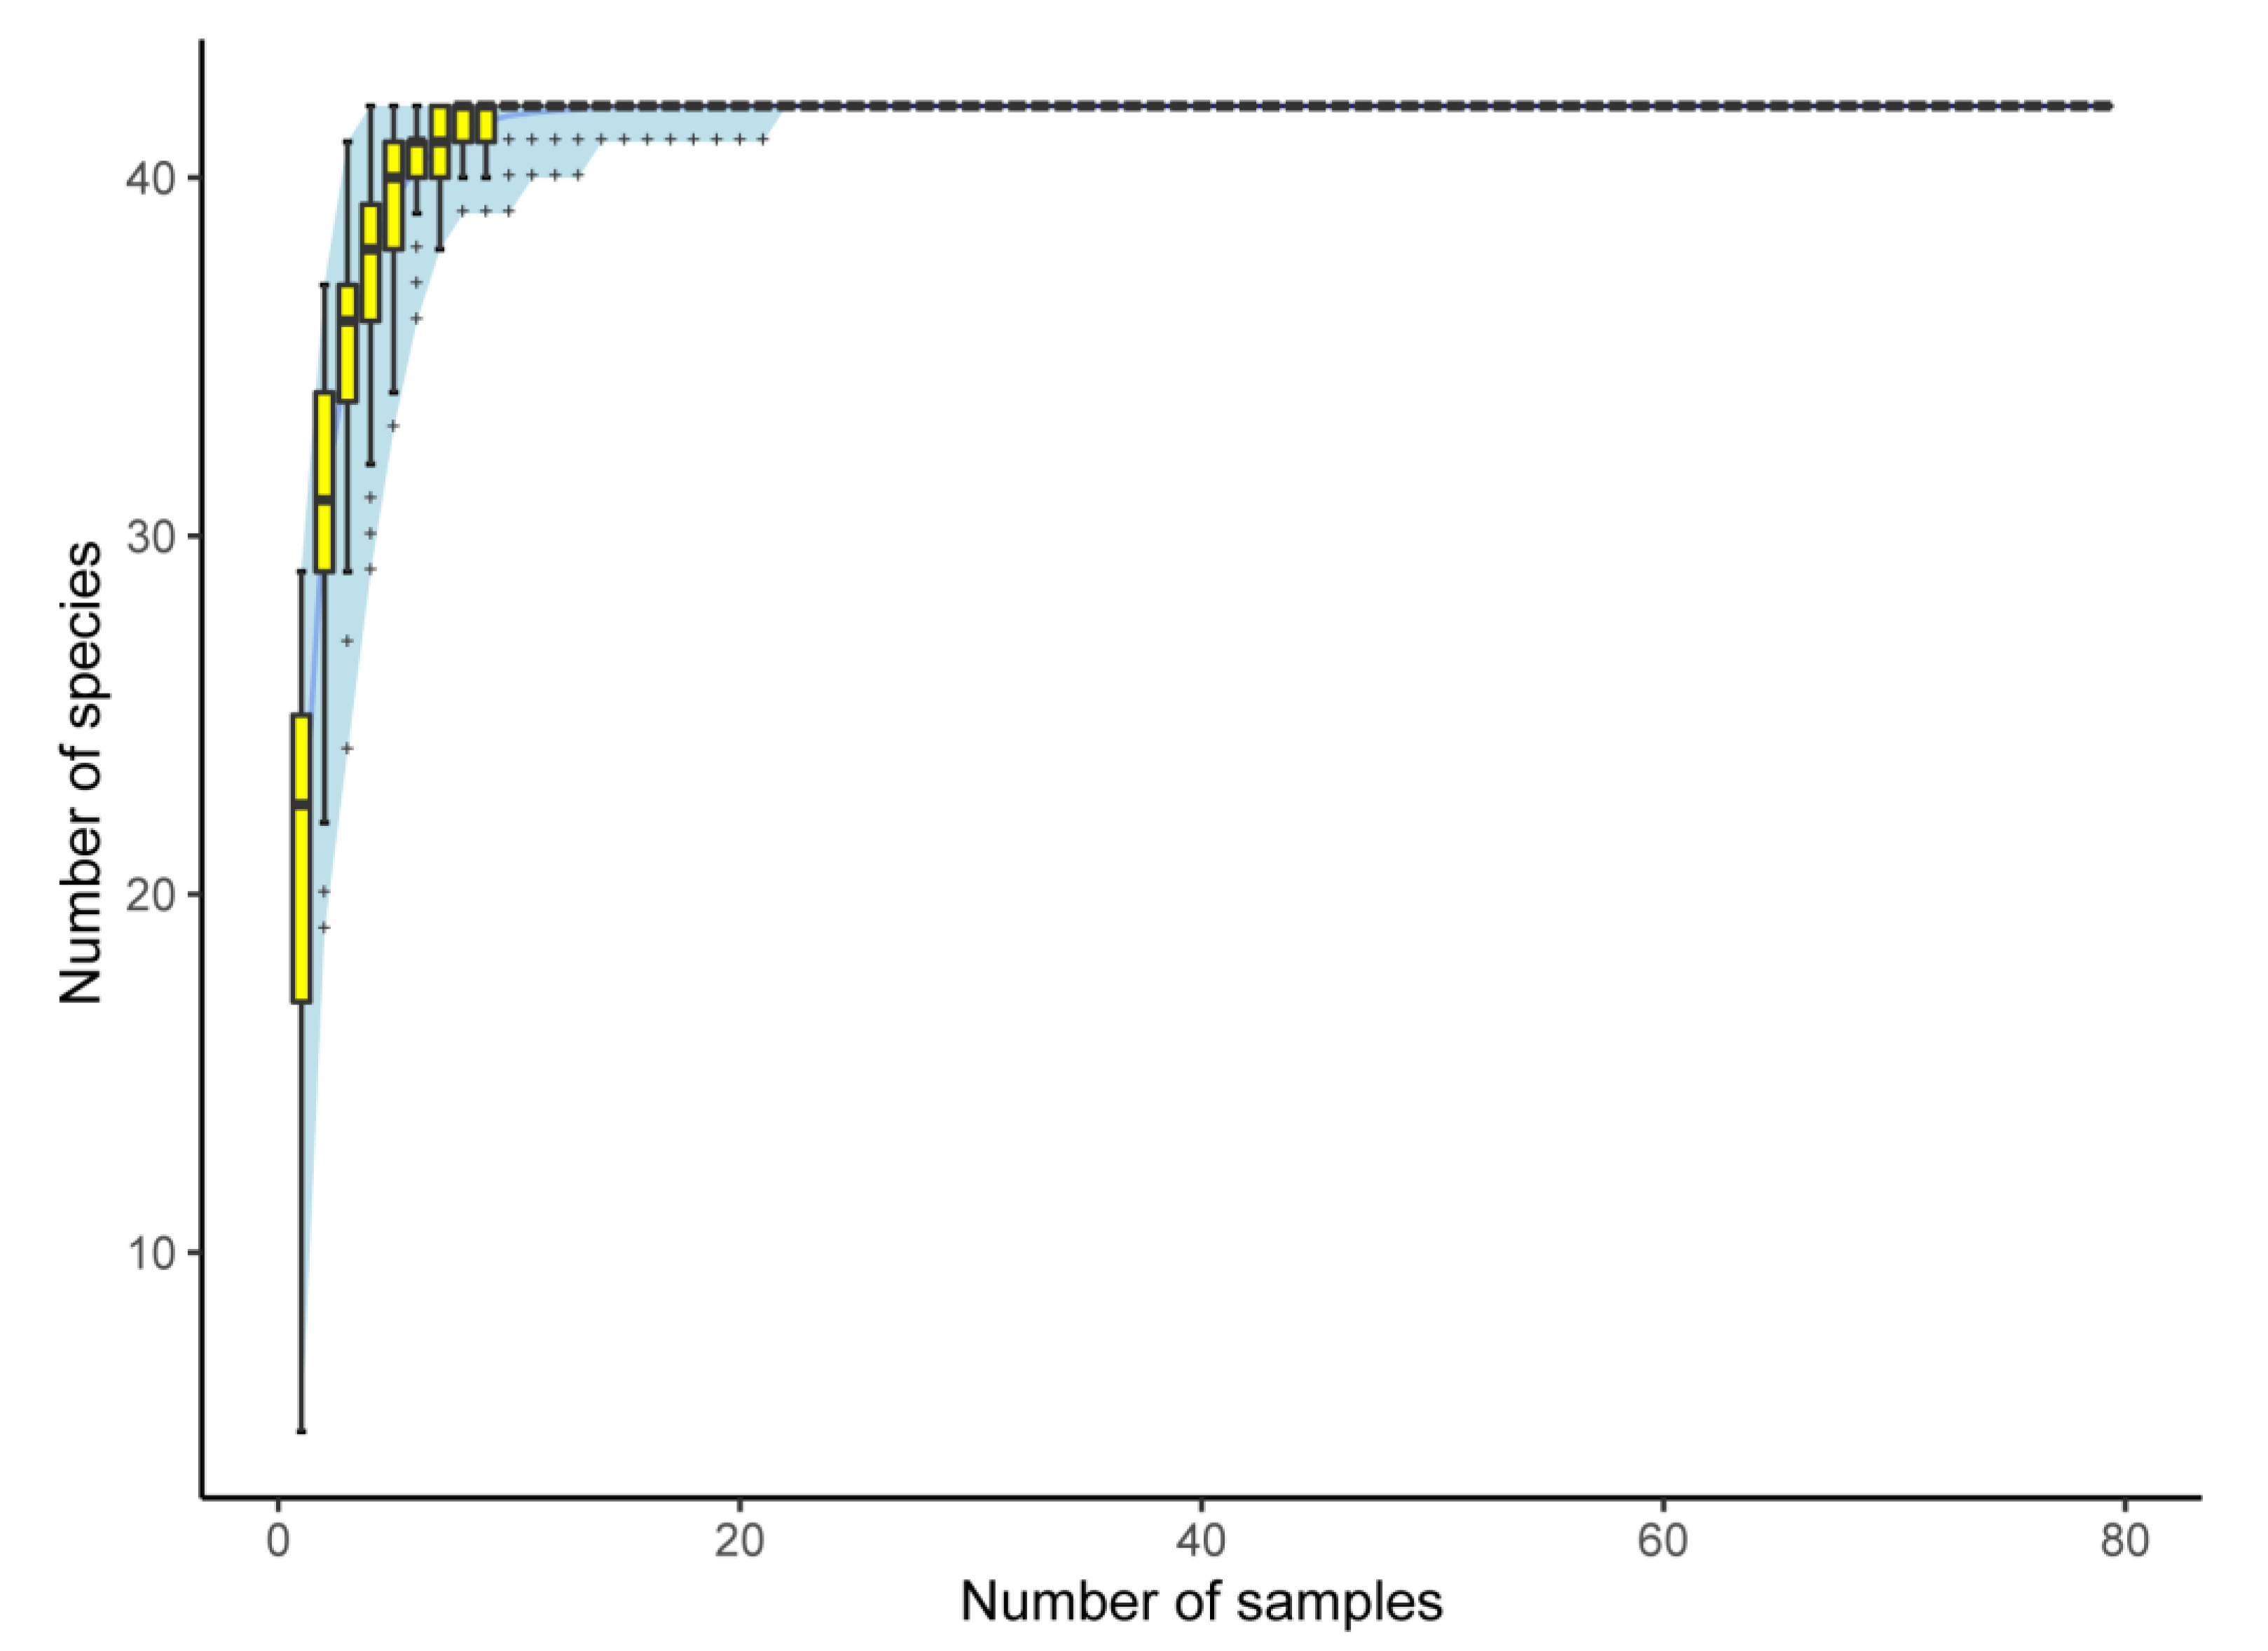
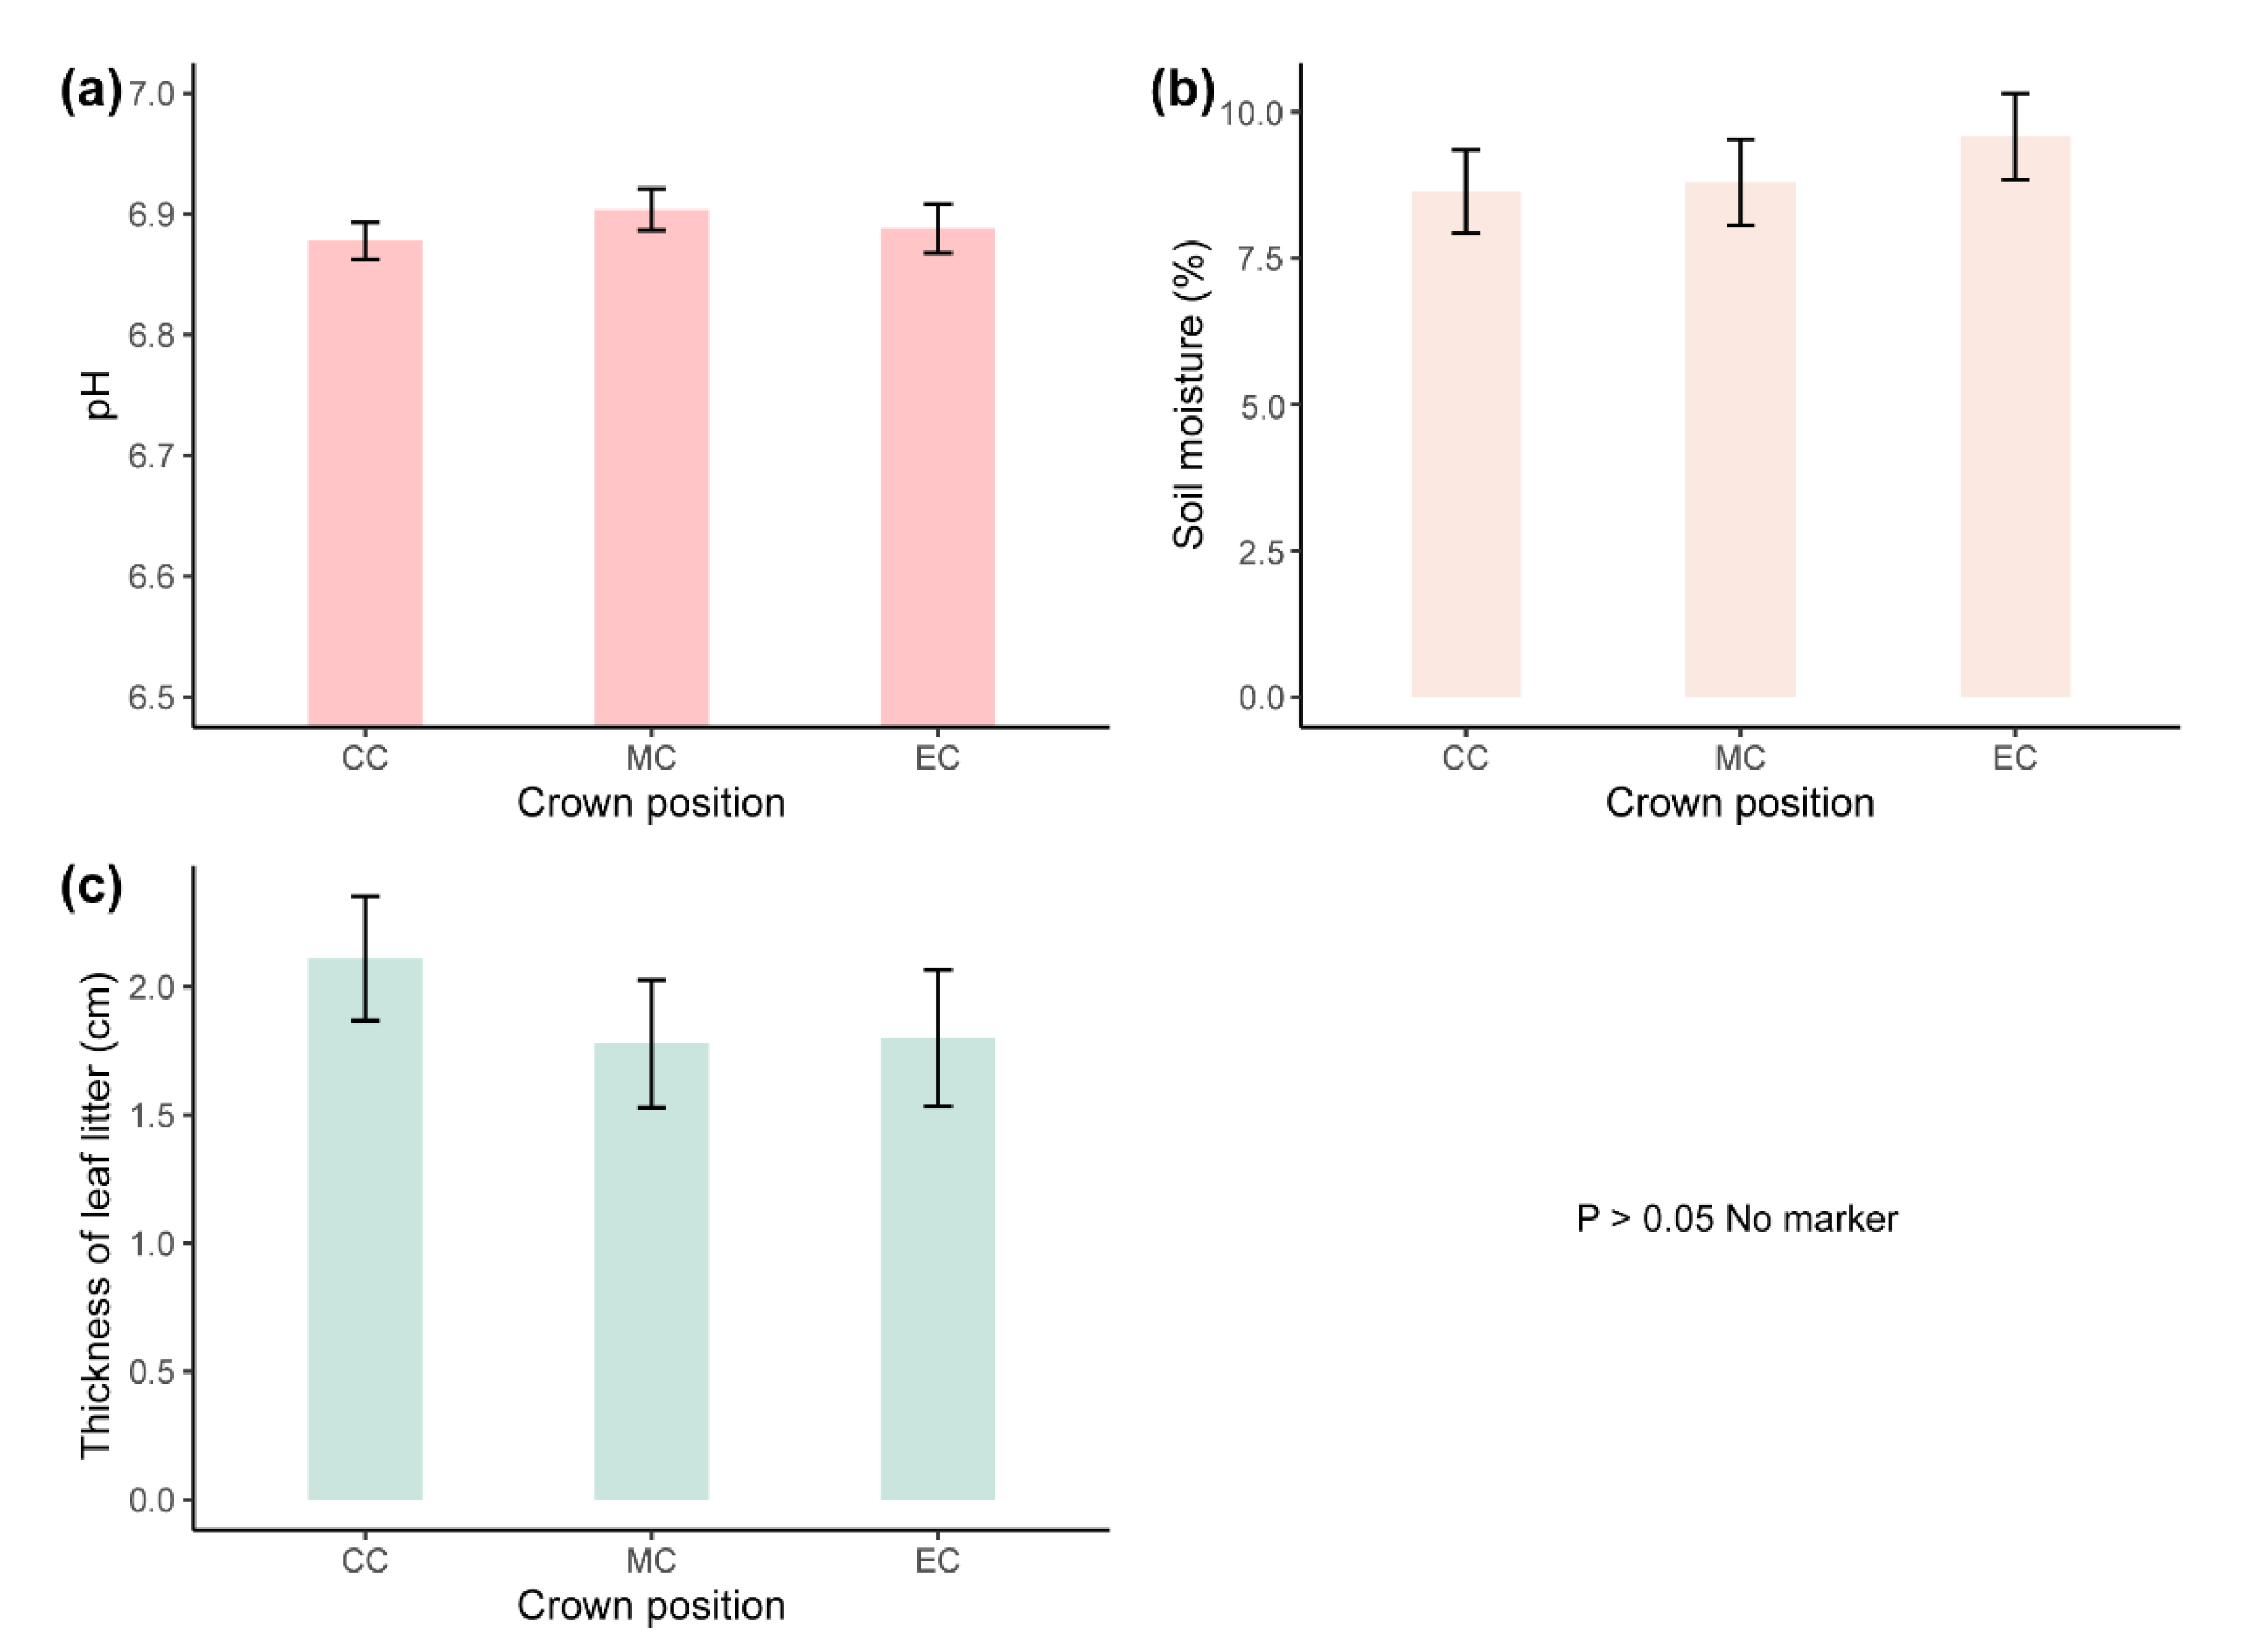
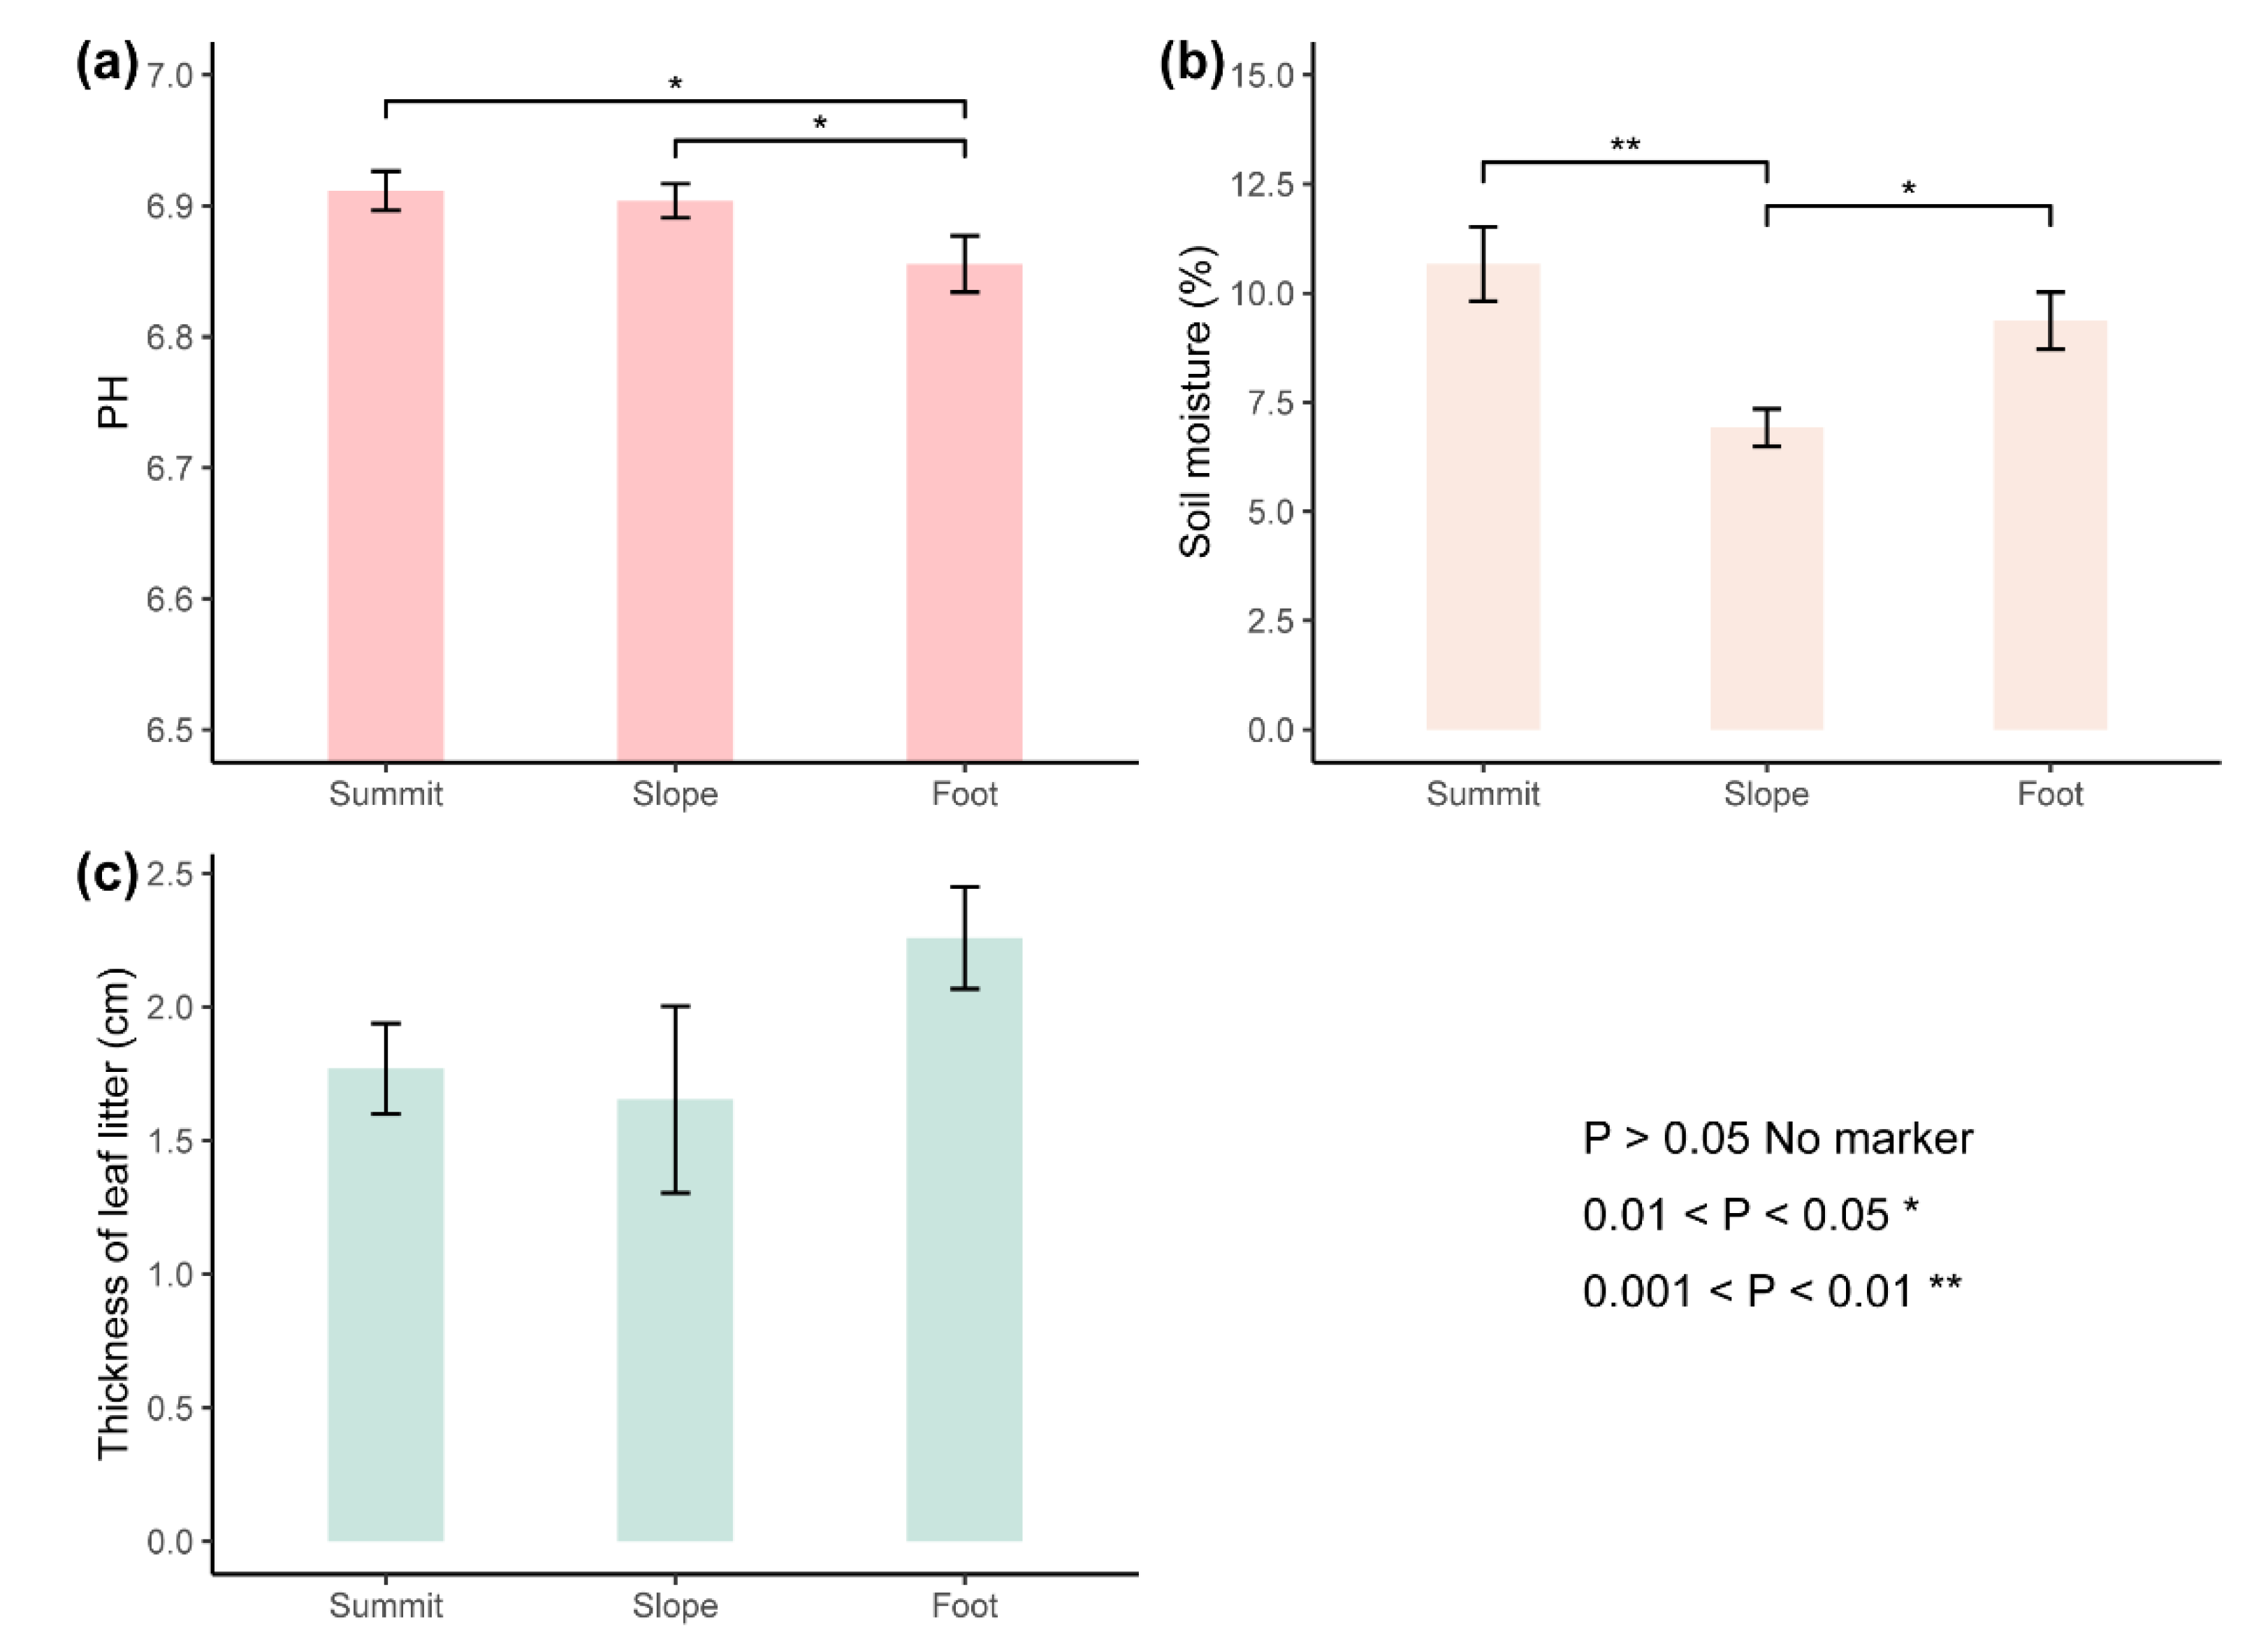
A total of 42 TA taxa belonging to 18 genera were identified in this study (Tables S2 and S3). The most common taxa that occurred in more than 70% of samples were Trinema enchelys (84.8%), Trinema complanatum (82.3%), and Plagiopyxis callida (78.5%). The number of taxa per sample varied from 5 to 29, with a mean ± SE (standard error, n = 79) of 20.22 ± 0.58. The sample-based species accumulation curve (Figure 3) reached a plateau (i.e., 42 species) when the sample number was 23, indicating that the entire TA richness was observed in samples. A complete list of all measured environmental characteristics is presented in the Table S4. The thickness of the leaf litter changed from 0 to 5.0 cm. Soil pH varied from 6.6 to 7.0. The soil moisture content varied from 1.7 to 18.2%. All measured environmental factors showed little variation within tree crowns and did not differ significantly among biotopes (Figure 4, Table S6). For example, soil moisture content was relatively low with values of 8.6 ± 0.7% (mean ± SE) in the center of the crown, 8.8 ± 0.7% in the middle of the crown and 9.6 ± 0.7% at the edge. Along a hillside (Figure 5, Table S7), substrate acidity (pH) was significantly lower at the foot, whereas moisture content was significantly lower at the middle hillside position as compared to the other positions, but absolute values of these significant differences were low, which could explain the absence of consistency between the overall characteristics of TA’s assemblages and the latter measured factors.

3.2. Variation in Abundance and Diversity of TA Communities

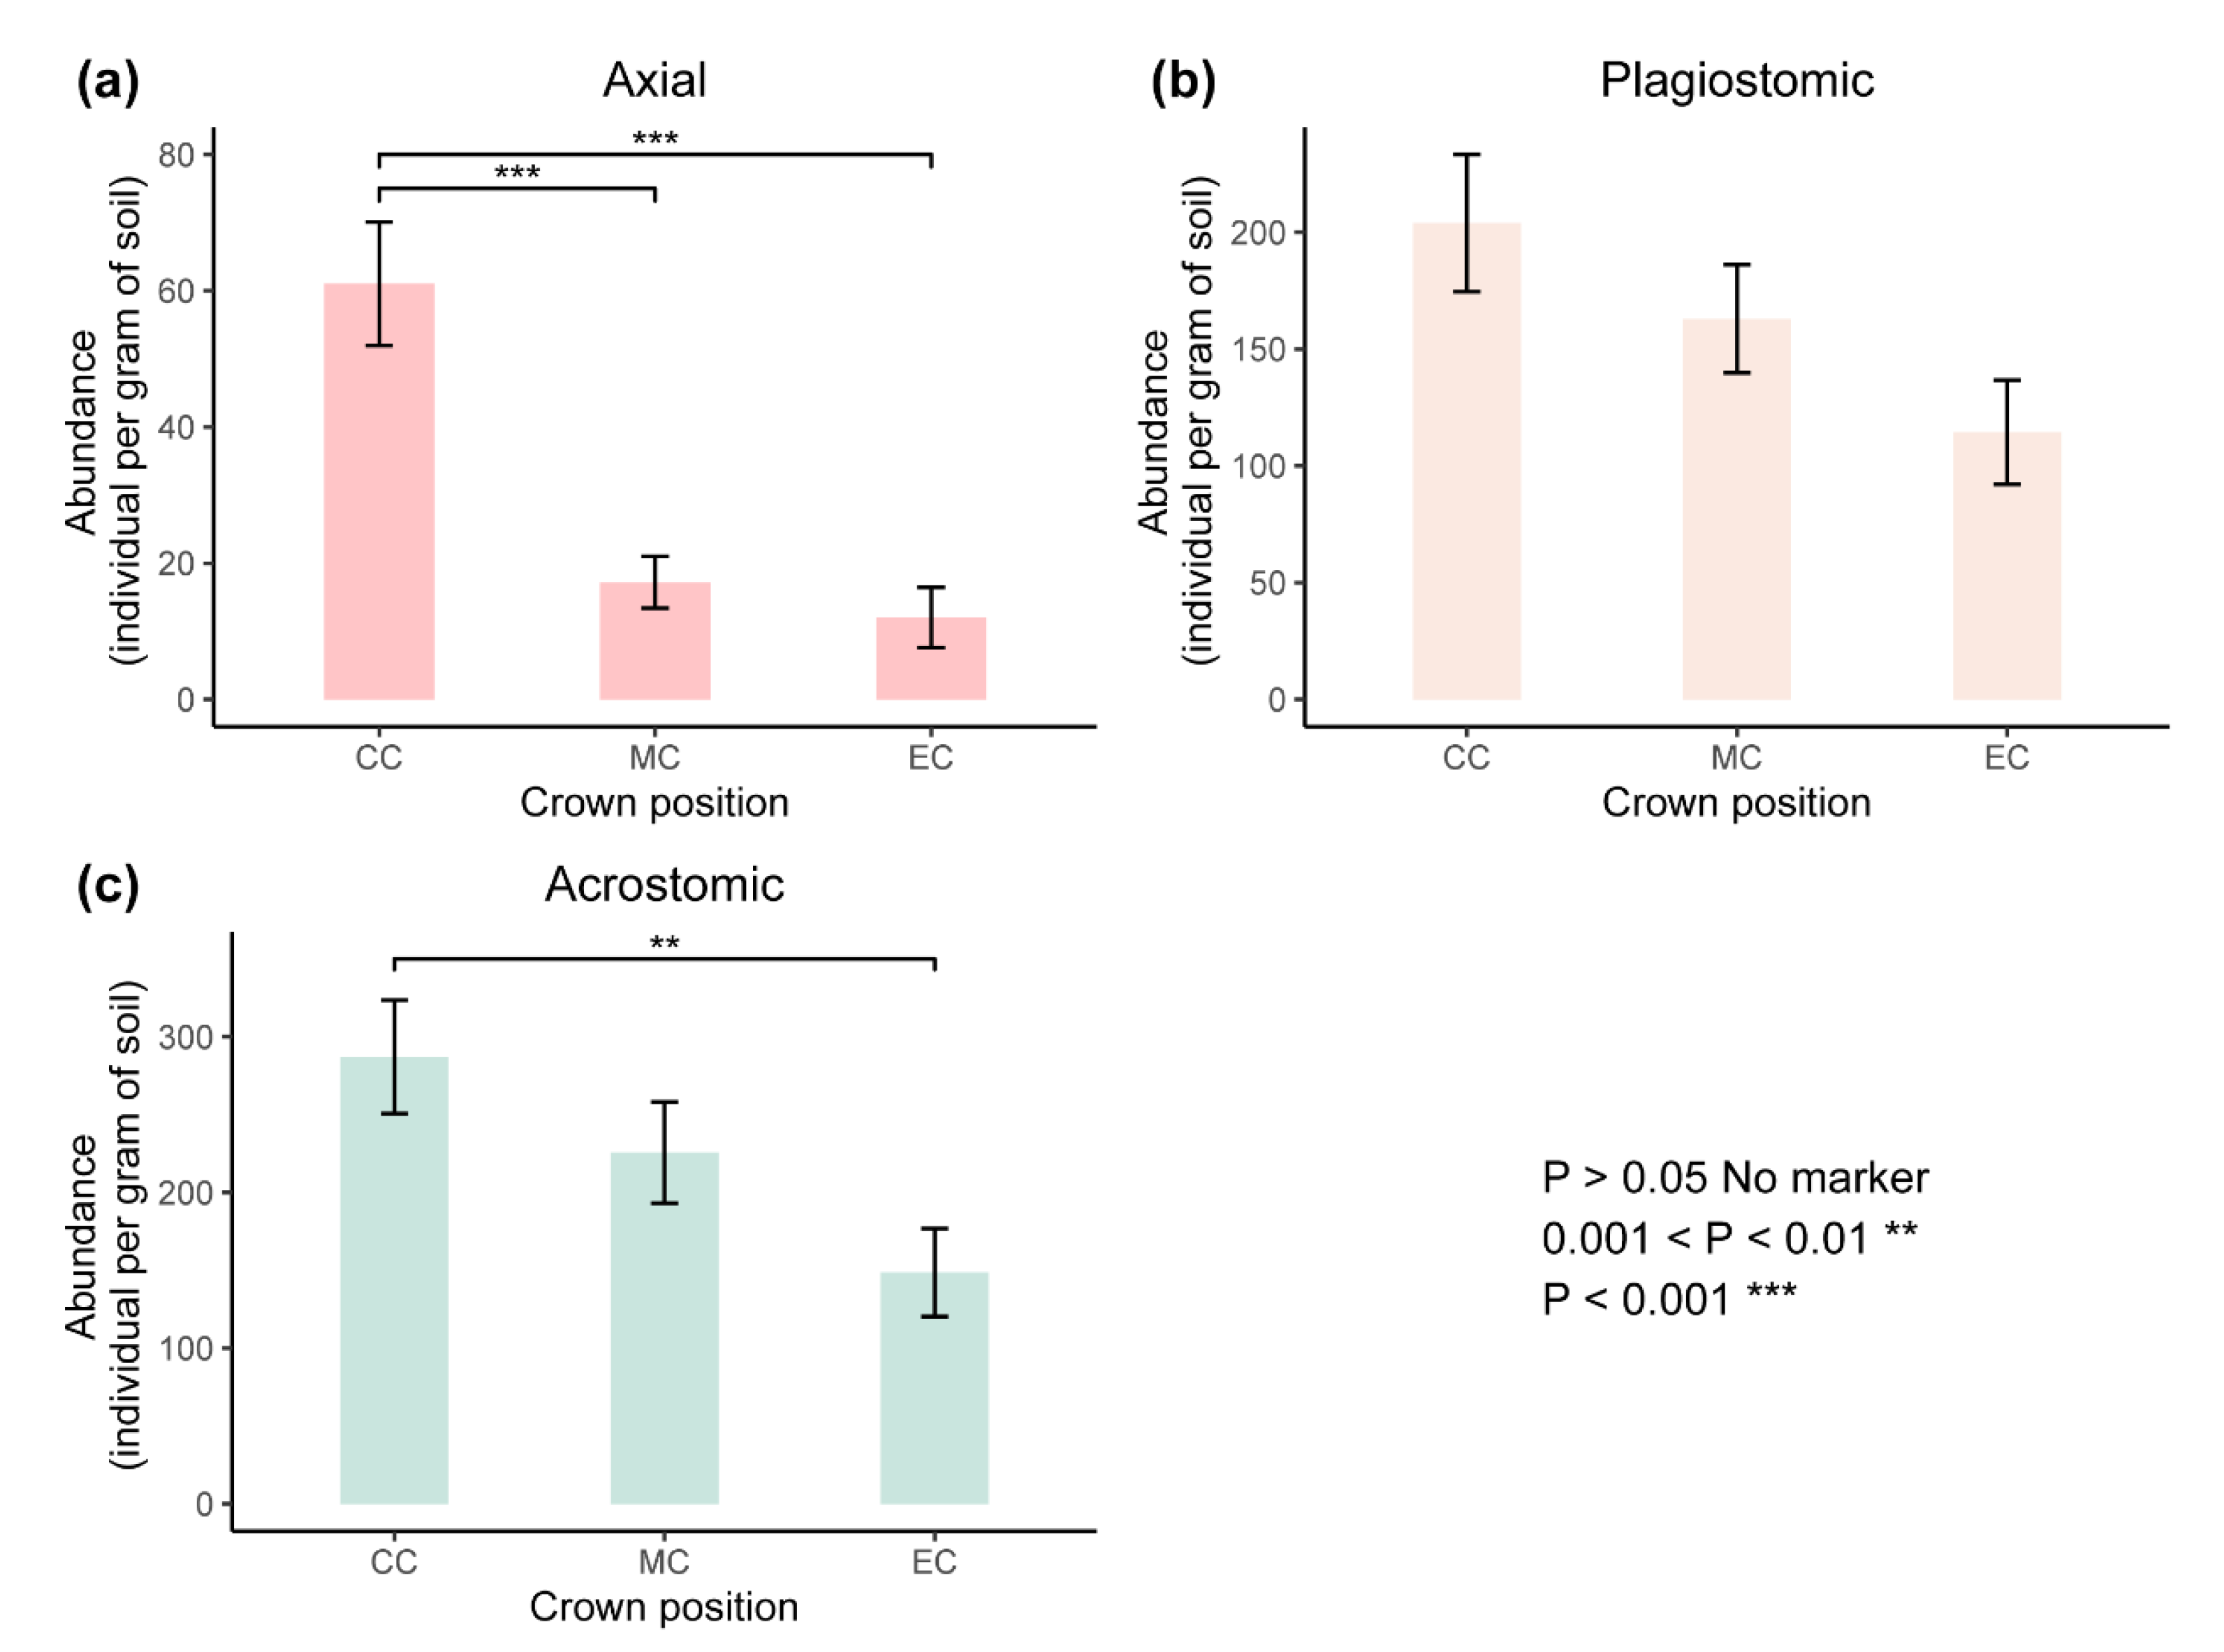
Overall, the abundance and diversity of TA communities decreased from the center to the edge of the tree crown; however, the significance of the differences between biotopes varied depending on the characteristics. The clearest decreasing trend was detected for the species richness (from 23.2 ± 0.7 to 16.56 ± 1.05 species at the edge, mean ± SE), which significantly differed among all under-crown biotopes (Figure 6b). The abundance significantly differed (p < 0.01) only between the center (552.2 ± 70.3 ind. g−1, mean ± SE) and the edge biotopes (275.04 ± 49.29 ind. g−1, mean ± SE) (Figure 6a), whereas the middle of the crown was characterized by intermediate values (405.81 ± 56.57 ind. g−1, mean ± SE) and did not differ from the other biotopes. The observed decreasing pattern in TA abundance was mostly determined by reduced abundances of the centrostomic (with axial aperture position) TA (Figure 7). Shannon’s diversity index was significantly lower (2.48 ± 0.09, mean ± SE) at the edge biotopes as compared to the others (2.88 ± 0.04 and 2.76 ± 0.05 at the center and the middle of the crown, respectively, mean ± SE) (p < 0.01) (Figure 6c). Pielou’s evenness index did not demonstrate any significant differences among the under-crown biotopes (p > 0.05) (Figure 6d).
Along the hillside gradient, the abundance and diversity of TA communities decreased from the foot to the summit biotopes, but the significance of the differences among biotopes was not consistent for all characteristics. The most consistent pattern was detected for abundance that decreased from 757.2 ± 49.6 ind. g−1 (mean ± SE) at the foot to 137.12 ± 16.54 ind. g−1 (mean ± SE) at the summit (Figure 8a). Species richness and the Shannon diversity index were greatest at the foot of hillside (23.1 ± 0.6 and 2.89 ± 0.02, respectively, mean ± SE, p < 0.01) (Figure 8b,c) as compared to the slope (19.35 ± 0.97 species and 2.67 ± 0.06, mean ± SE) and summit (18.12 ± 1.16 species and 2.57 ± 0.09, mean ± SE), which did not differ from each other. Pielou’s evenness index did not differ among the biotopes along the elevation gradient (p > 0.05) (Figure 8d).

3.3. Variation in Species Composition of TA Communities

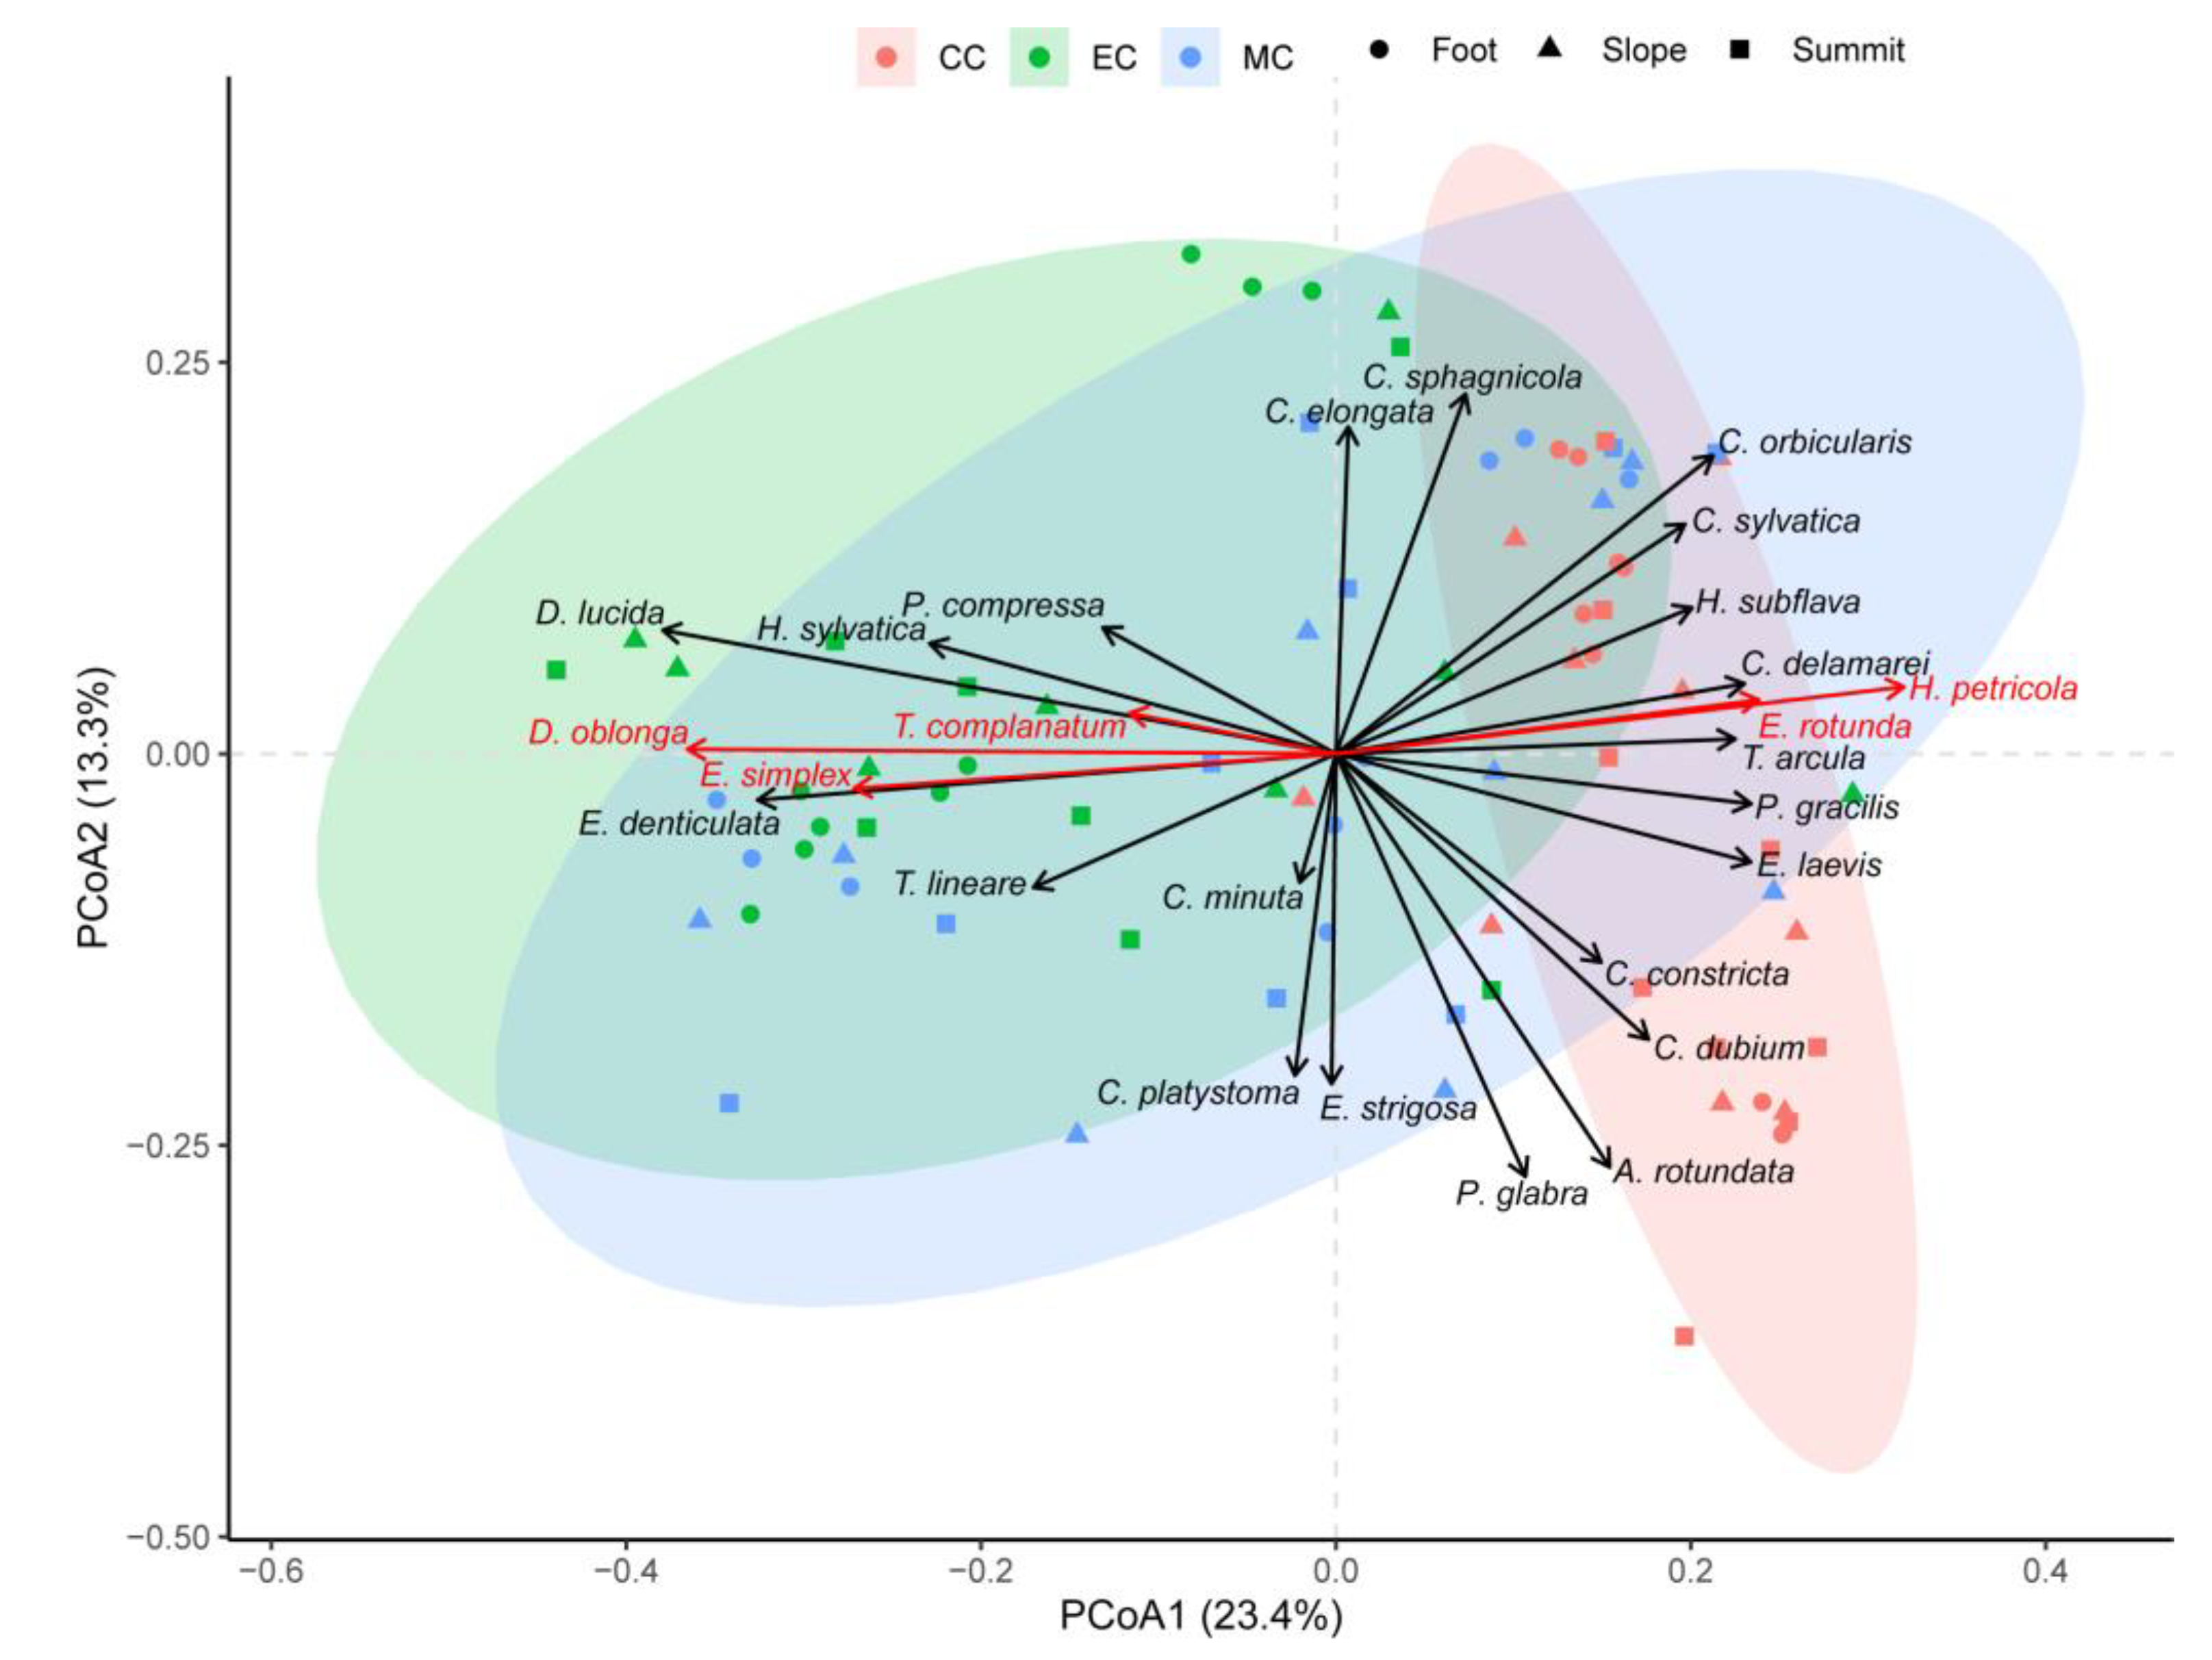
The principal coordinate analysis (PCoA) showed that TA communities can be separated into three distinct groups according to their under-crown position: CC, MC, and EC (Figure 9, Table 1). PCoA axes 1 and 2 explained 23.4 and 13.3% of the total variance, respectively. The results of PerMANOVA confirmed the significance of difference among these three groups (F = 7.24, p = 0.001). The results of the subsequent pairwise test (Table S8) showed significant differences in the community structure of TA between CC and MC (F = 8.41, p = 0.001), CC and EC (F = 13.24, p = 0.001), and MC and EC (F = 3.82, p = 0.001). The PCoA 1 axis showed that TA communities in the MC and EC had greater heterogeneity than those at the CC. In addition, the TA communities exhibited a considerable overlap between MC and EC on the PCoA axis 2. Additionally, PCoA and PERMANOVA indicated that the species structure of TA communities did not differ among the slope positions (F = 1.46, p = 0.087).
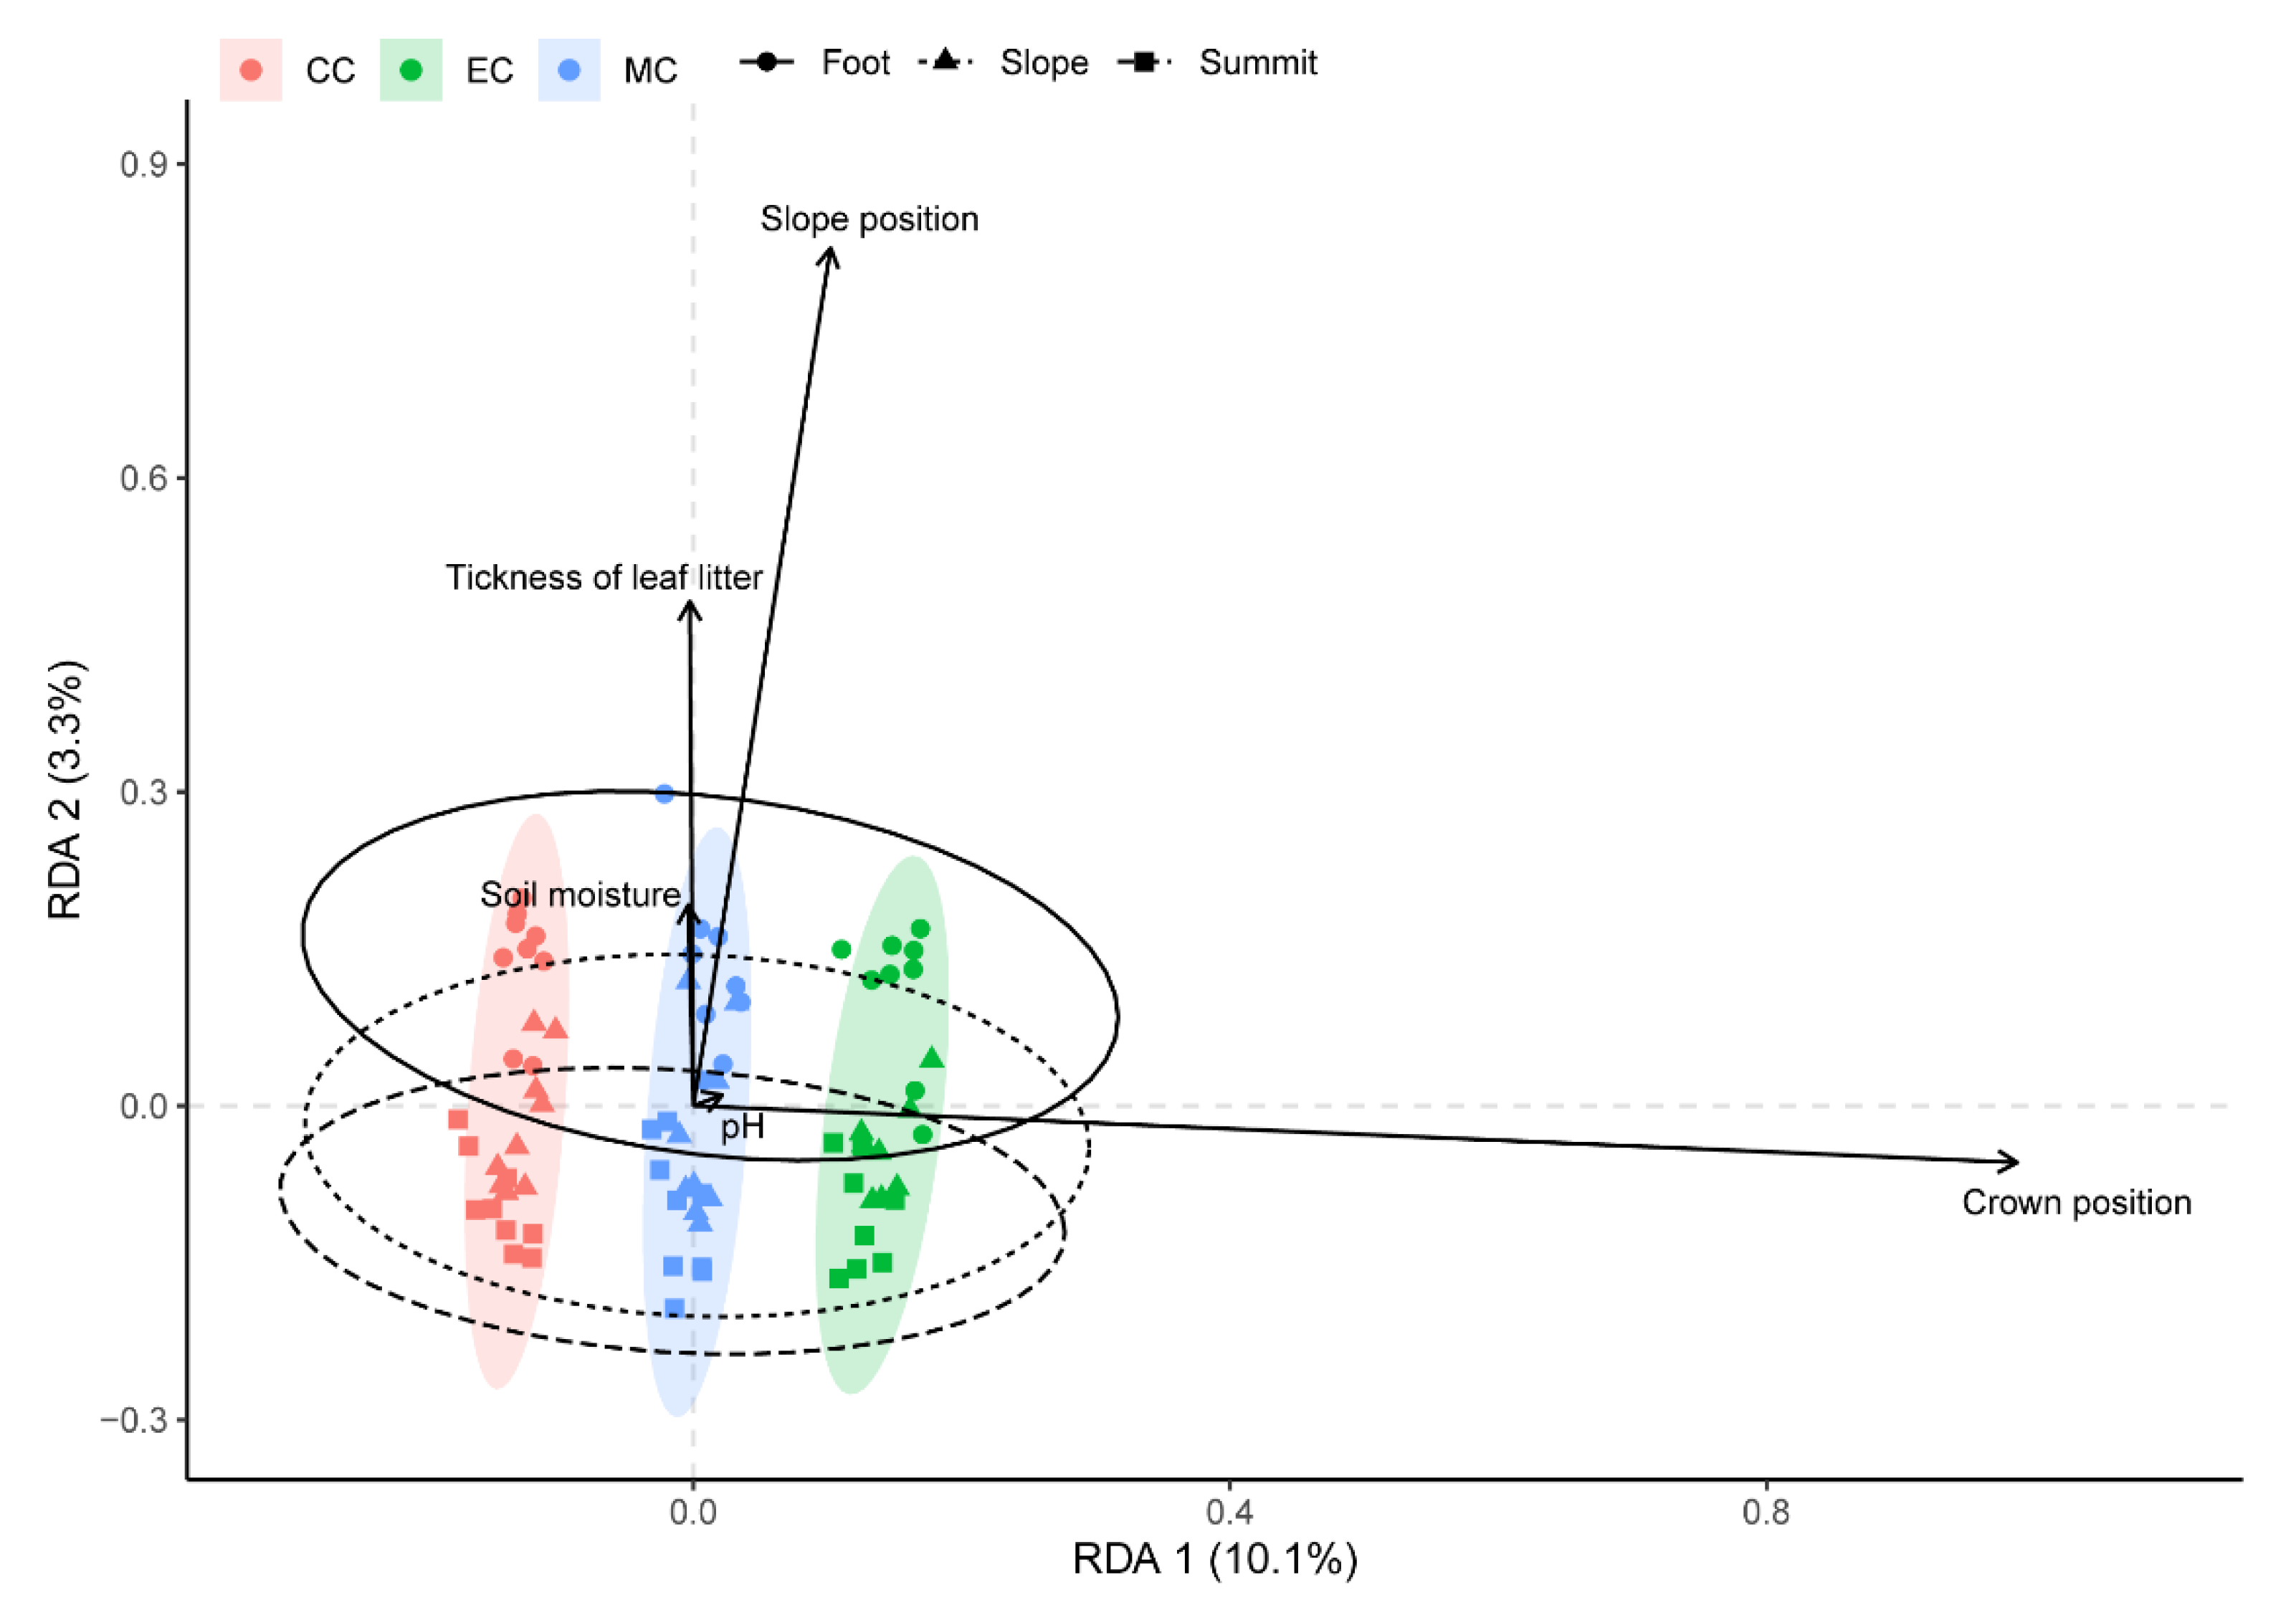
In redundancy analysis (RDA), the first RDA axis explained 10.1% of the constrained variance and showed apparent differences among the three crown positions (Figure 10). The second RDA axis accounted for 3.3% of the constrained variance and can be related to slope positions. The permutation test (n = 999) assessing the significance of the constraints in RDA, showed that three measured environmental factors (pH, moisture content, and thickness of leaf litter) did not affect the microspatial distribution of soil TA communities under tree crown (Table S9) while two complex factors—crown position and slope position—were significant constraints (F = 8.80, p = 0.001 and F = 2.34, p = 0.006, respectively). Nevertheless, the constrained variance accounted for only 16.35% of the total variance.
The result of indicator species analysis showed that Heleopera petricola had a preference for the CC (A = 0.73, B = 1, p = 0.005), and it had a comparatively high relative abundance in the CC (4.1%) and 100% occurrence (Table S2). The species combination of Cyclopyxis eurystoma + Trinema lineare marked the MC (A = 0.72, B = 0.56, p = 0.005) and had comparatively high joint occurrence (55.6%) with minimal relative abundance 3.4% (Table S2). Difflugia oblonga had a preference for the EC (A = 0.77, B = 0.76, p = 0.005), and it had high relative abundance (8.0%) and occurrence (76.0%) in the EC (Table S2). The result of PCoA confirmed these results as well. Trinema complanatum had a preference for the feet of hillsides (A = 0.74, B = 1, p = 0.005) with 100% occurrence and 5.6% relative abundance (Table S3). Euglypha rotunda preferred the slope biotopes (A = 0.55, B = 0.54, p = 0.01) with 53.9% occurrence and 4.5% relative abundance (Table S3). The species combination of Centropyxis minuta + Plagiopyxis callida + Trinema complanatum marked the summit hillside position (A = 0.86, B = 0.27, p = 0.005) with 26.9% joint occurrence and 1.0% minimal relative abundance (Table S3).

4. Discussion

Studies on the altitudinal distribution of different kinds of soil organisms provided contradictory evidence about general patterns and even about existing such general patterns [61,62]. For soil microorganisms, this consideration is supported as well [63].
Our results indicate decreasing abundance and diversity of TA assemblages from the foot to the summit biotopes that is consistent with the findings of a study conducted by Heger et al. [25] along an elevation gradient from 1770 to 2430 m a.s.l. in the Swiss Alps where the diversity and evenness of TA decreased with elevation. Similar findings were also reported by Todorov [64] who took samples from various soil types along an altitudinal gradient in SW Bulgaria and observed the species richness of soil TA decreased in the sub-alpine zone (from 2000 to 2500 m a.s.l) as compared with lower elevations (from 400 to 2000 m a.s.l). Additionally, Mazei et al. [65] found that the abundance and species richness of TA increased in the highest forest–tundra zone as compared with the nether broadleaf forest in Khamar-Daban mountain ridge (Lake Baikal region).
However, other elevation patterns in abundance and diversity of TA were also reported. For example, Krashevska et al. [66] found that the abundance and species richness of TA formed a unimodal pattern in respect of elevation and peaked at an intermediate elevation (2000 m a.s.l) in a rainforest of southern Ecuador. In one of the latest studies on the topic, Tsyganov et al. [26] showed that the species richness and diversity of TA communities had a bell-shaped relationship with elevation and the habitats on the middle elevation had the highest diversity along an elevation gradient spanned from 904 to 2377 m a.s.l. along Mount Fuji in Japan.
Altitudinal (or elevational) gradient is a complex factor. Regardless the absolute range of altitudes in particular studies, altitudinal gradient is commonly deemed to be related to altitudinal shifts in vegetation, in its composition [26] or functioning [66]. In high latitudes, rather narrow altitudinal range can cause shifting in vegetation types affecting the distribution of TA [30]. In tropical areas, as in our study, the similar altitudinal ranges (45–312 m a.s.l.) do not necessarily lead to changes in vegetation. Possibly, such a relatively narrow elevational range in low latitudes must be considered as a “relief” gradient, not an “altitudinal” one.
The cases where the elevational gradient does not match with vegetation shifts are also described by different authors; such “relief gradients” can be considered in meso- and micro-scales. Mesorelief gradient was reported as a significant factor of TA community differentiation [67] on rather small absolute distances (20–30 m). In another study, it was indicated that the total species richness increased from the upper to the lower catenary positions [23]. Microtopography was also indicated as a factor shaping TA composition by different authors. Klerk et al. [21] noted that the distribution of the TA was primarily determined by surface elevation. Additionally, Tsyganov et al. [24] found that the microtopography affected both the diversity and species structure of TA assemblages. Both altitudinal and “relief” gradients are complex factors, and their compound and particular mechanisms affecting TA communities demand further investigation.
Regarding the microscale distribution of TA, Bobrov [29] studied the spatial distribution of TA at the center, the middle, and the edge space under the crowns and found that the TA assemblage distribution was partially consistent with the microspatial structure in the pine forest; his conclusions are broadly consistent with ours. Mazei et al. [68] also found that the species richness and diversity of soil TA communities had a decreasing trend from the center of the crown to the inter-crown biotopes in an oak forest. The area under the center of the crown is close to the tree trunk, so stemflow or interactions with mycorrhizae can be used to explain why TA communities were more abundant and diverse there as was suggested by Payne et al. [69].
In our study we found that the mean absolute abundance of TA with the axial aperture position (i.e., centrostomic TA) decreases from the center of the crown to the edge (Figure 7). A similar result was obtained by Mazei et al. [68], who found that the abundance of centrostomic TA decreases from the tree butt through the sub-crown to the inter-crown biotopes in oak forests. In addition, the mentioned study also reported opposite patterns for the abundance of plagiostomic TA. Plagiostomic aperture is a morphological response to the low moisture content and probably low pH [70]. However, we did not find any distribution patterns for TA with other types of aperture positions that might be related to the low variability of soil moisture and pH in the under-crown biotopes investigated in this study.
Leaf litter chemistry, mainly Fe, Na, lignin, and C/N ratio, can affect the composition of TA communities by changing the habitat quality [71]. Hence, neighboring trees of different species producing leaf litter of various qualities can form a transitional zone between their crowns. Krashevska et al. [71] found that the biomass and density of TA were highest in single tree species leaf litter, while the transitional zone usually had various types of leaf litter. Therefore, the area at the edge of crown can be considered as an ecotone—the EC crown position in our study. Our findings of decreased abundance and diversity of TA amoebae in the ecotone biotopes correspond well with results of a study on meadow-spruce forest mesoecotone [72], which showed that the transitional zone had the lowest richness, diversity, and abundance of TA. On the contrary, at smaller scale it was found that the transitional zone between soil and moss carpet was characterized by higher abundance but lower richness of TA [73]. Another ecotone study on the distribution of protists found that the transitional zone between the open peatbogs and the peatbog catchment in eastern Poland represented an ecotone zone with high biodiversity, abundance, and species specificity of protists [74]. Overall, these results indicated that distribution patterns of soil eukaryotic microbes in ecotones are variable and might be affected by various factors, which should be studied in further research.
Our results indicated that elementary environmental factors (pH, soil moisture, and the thickness of leaf litter) poorly contributed to the explanation of the overall variation in the species structure of TA communities in comparison to the complex factors such as the position of biotopes under the crown and at the hillside. These findings are in line with the results of several studies discussed above, which showed strong effects of complex ecological factors such as microtopography on species richness of TA [23] or effects of relief on TA distribution in general [21].
Among other multi-factor effects, the influence of microbial community on TA assemblages can be mentioned since bacteria and fungi represent the main food supply for TA [75,76]. It was shown [77] that soil bacterial diversity was significantly higher in urban territories than in national parks. We found that TA communities in our studying of urban parks were more abundant and diverse than TA communities in a similar study conducted in the natural area [68]. Then, the higher abundance and diversity of TA in disturbed territories (urban parks) than in natural ones (natural forests) may be related to higher diversity of bacteria.
Other authors demonstrated various kinds of microspatial and mesospatial heterogeneity of soil microbial communities that could influence TA in leaf litter and soil. A study on the soil bacterial community structure of the inter-rhizosphere soil of acacia [78] showed that it had higher abundance and diversity in rhizosphere soil compared to the non-rhizosphere soil. In a study of soil microorganisms in mixed forest of Eucalyptus spp. and Acacia confusa, Zhang et al. [79] found that bacteria, fungi, and actinomycetes are mainly concentrated in the soil at the bottom of the slope, and their abundance decreases as the slope rises. Mentioned authors explained this by nitrogen fixation of acacia rhizosphere, which improved the utilization of soil nutrients and thus significantly increased the abundance of soil microorganisms. In a study on tropical montane rainforests, Krashevska et al. [71,80] found that leaf litter quality (e.g., lignin concentrations, litter pH) could shape the structure and density of soil testate amoebae assemblages by driving nitrogen cycle and affecting bacterial communities. It can be suggested that the tree canopy and micro- and mesorelief might affect TA not only through well-known physical environmental factors but also via influence of other biotic components of ecosystems, which requires further investigation.

5. Conclusions

The present study on the distribution patterns of TA communities at the microscale (crown position) and the mesoscale (hillside position) in three subtropical urban parks revealed 42 TA species belonging to 18 genera. Overall, the abundance and diversity of TA assemblages decreased from the center to the edge of the tree crown; however, the significance of the differences between biotopes varied depending on the certain community characteristics: significant trends were revealed for species richness, Shannon’s diversity index and total abundance. In addition, soil TA assemblages were most abundant and diverse at the foot of the hill while least abundant and diverse at the summit of the hill in three studied subtropical urban parks. The composition of soil TA assemblages under the center of the crown and the middle of the crown were different from those under the edge of the crown. Moreover, in three slope positions along hillsides, three distinct assemblages of TA were detected. However, we did not find any associations between the distribution pattern of TA and elementary environmental conditions (soil moisture, soil pH, and the thickness of leaf litter). On the contrary, the distribution of TA was mostly driven by complex factors at the microscale (crown position) and mesoscale (hillside position). Nevertheless, even those factors explained a rather small fraction of the total variance in species structure of TA assemblages. In contrast to our hypothesis, the microscale heterogeneity contributed the most to TA assemblage structure differences. Future studies on soil microbial eukaryotes should consider both micro- (i.e., sub-crown heterogeneity) and mesoscale gradients (i.e., the slope position) during sampling and include measurements of a wider range of biotic (e.g., a forest stand density, particular tree species both from the taxonomical position and functional trait position (e.g., crown diameter), bacteria, fungi (including mycorrhizae), and other microorganisms) and abiotic (e.g., carbon-nitrogen ratio, phosphorous content, leaf litter chemistry, and soil aggregate structure) characteristics of environmental conditions.

Supplementary Materials

The following supporting information can be downloaded at: https://www.mdpi.com/article/10.3390/land11122250/s1, Table S1: Brief characteristics of the sampling sites in three urban parks (BA—Baoan, NS—Nanshan, YAL—Yanziling); Table S2: Species relative abundance (%) and occurrence (%) under three crown positions; Table S3: Species relative abundance (%) and occurrence (%) at three hillside positions; Table S4: Environmental characteristics of the samples; Table S5: TA species functional traits; Table S6: Environmental characteristics (mean ± SE) at the three crown positions (CC—center of the crown, MC—middle of the crown, EC—edge of the crown); Table S7: Environmental characteristics (mean ± SE) at the three hillside positions; Table S8: Pairwise PerMANOVA results for differences in TA assemblage composition at three crown positions; Table S9: The significance of RDA constraints.

Author Contributions

Conceptualization, A.I. and Y.M.; methodology, A.I. and J.C.N.; formal analysis, Y.Z.; field investigation, Y.Z., J.C.N. and D.S.; testate amoeba analysis, Y.Z., J.C.N. and K.B.; writing—original draft preparation, Y.Z.; writing—review and editing, Y.Z., A.I., J.C.N., A.N.T., Y.M. and K.B.; visualization, Y.Z.; supervision, A.I.; project administration, D.S.; funding acquisition, Y.M. All authors have read and agreed to the published version of the manuscript.

Funding

This research was funded by the Shenzhen Natural Science Foundation (20200828181231001) and the Russian Science Foundation, grant number 19-14-00102. This research was performed according to the Development Program of the Interdisciplinary Scientific and Educational School of Lomonosov Moscow State University “The future of the planet and global environmental change”.

Acknowledgments

We gratefully acknowledge our three anonymous reviewers, whose critical notes sufficiently improved our manuscript, particularly in the description of future amending of this and similar studies.

Conflicts of Interest

The authors declare no conflict of interest. The funders had no role in the design of the study; in the collection, analyses, or interpretation of data; in the writing of the manuscript; or in the decision to publish the results.

References

  1. Brown, A.L. Increasing the Utility of Urban Environmental Quality Information. Landsc. Urban Plan. 2003, 65, 85–93. [Google Scholar] [CrossRef]
  2. Caruso, T.; Migliorini, M.; Rota, E.; Bargagli, R. Highly Diverse Urban Soil Communities: Does Stochasticity Play a Major Role? Appl. Soil Ecol. 2017, 110, 73–78. [Google Scholar] [CrossRef] [Green Version]
  3. Milano, V.; Cortet, J.; Baldantoni, D.; Bellino, A.; Dubs, F.; Nahmani, J.; Strumia, S.; Maisto, G. Collembolan Biodiversity in Mediterranean Urban Parks: Impact of History, Urbanization, Management and Soil Characteristics. Appl. Soil Ecol. 2017, 119, 428–437. [Google Scholar] [CrossRef]
  4. Park, S.-J.; Taylor, R.A.J.; Grewal, P.S. Spatial Organization of Soil Nematode Communities in Urban Landscapes: Taylor’s Power Law Reveals Life Strategy Characteristics. Appl. Soil Ecol. 2013, 64, 214–222. [Google Scholar] [CrossRef]
  5. Salinitro, M.; Alessandrini, A.; Zappi, A.; Melucci, D.; Tassoni, A. Floristic Diversity in Different Urban Ecological Niches of a Southern European City. Sci. Rep. 2018, 8, 15110. [Google Scholar] [CrossRef] [Green Version]
  6. Fu, Q.; Shao, Y.; Wang, S.; Liu, F.; Tian, G.; Chen, Y.; Yuan, Z.; Ye, Y. Soil Microbial Distribution Depends on Different Types of Landscape Vegetation in Temperate Urban Forest Ecosystems. Front. Ecol. Evol. 2022, 10. [Google Scholar] [CrossRef]
  7. Korneykova, M.V.; Vasenev, V.I.; Nikitin, D.A.; Dolgikh, A.V.; Soshina, A.S.; Myazin, V.A.; Nakhaev, M.R. Soil Microbial Community of Urban Green Infrastructures in a Polar City. Urban Ecosyst. 2022, 25, 1399–1415. [Google Scholar] [CrossRef]
  8. Santos, M.N.; Delabie, J.H.C.; Queiroz, J.M. Biodiversity Conservation in Urban Parks: A Study of Ground-Dwelling Ants (Hymenoptera: Formicidae) in Rio de Janeiro City. Urban Ecosyst. 2019, 22, 927–942. [Google Scholar] [CrossRef]
  9. Yang, T.; Shi, Y.; Zhu, J.; Zhao, C.; Wang, J.; Liu, Z.; Fu, X.; Liu, X.; Yan, J.; Yuan, M.; et al. The Spatial Variation of Soil Bacterial Community Assembly Processes Affects the Accuracy of Source Tracking in Ten Major Chinese Cities. Sci. China Life Sci. 2021, 64, 1546–1559. [Google Scholar] [CrossRef]
  10. Mitchell, E.A.D.; Borcard, D.; Buttler, A.J.; Grosvernier, P.; Gilbert, D.; Gobat, J.-M.; Ecol, M. Horizontal Distribution Patterns of Testate Amoebae (Protozoa) in a Sphagnum Magellanicum Carpet. Microb. Ecol. 2000, 39, 290–300. [Google Scholar] [CrossRef]
  11. Carballeira, R.; Pontevedra-Pombal, X. Diversity of Testate Amoebae as an Indicator of the Conservation Status of Peatlands in Southwest Europe. Diversity 2021, 13, 269. [Google Scholar] [CrossRef]
  12. Jassey, V.E.J.; Chiapusio, G.; Mitchell, E.A.D.; Binet, P.; Toussaint, M.-L.; Gilbert, D. Fine-Scale Horizontal and Vertical Micro-Distribution Patterns of Testate Amoebae Along a Narrow Fen/Bog Gradient. Microb. Ecol. 2011, 61, 374–385. [Google Scholar] [CrossRef] [Green Version]
  13. Qin, Y.; Xie, S.; Smith, H.G.; Swindles, G.T.; Gu, Y. Diversity, Distribution and Biogeography of Testate Amoebae in China: Implications for Ecological Studies in Asia. Eur. J. Protistol. 2011, 47, 1–9. [Google Scholar] [CrossRef]
  14. Qin, Y.; Xie, S.; Gu, Y.; Wang, J.; Zhou, X. An Excellent Indicator for Quaternary Paleoenvironmental Reconstructions - Advances in the Study of Testate Amoebae (Thecamoebians, Arcellacean). Adv. Earth Sci. 2008, 23, 803–812, (In Chinese with English abstract). [Google Scholar] [CrossRef]
  15. Ettema, C.H.; Wardle, D.A. Spatial Soil Ecology. Trends Ecol. Evol. 2002, 17, 177–183. [Google Scholar] [CrossRef]
  16. Wang, Y.; Long, Y.; Li, Y.; Wang, Y.; Lu, G.; Yang, J.; Gao, X.; Chang, S.; Yang, X. Relationships of Soil Physicochemical Properties to the Distribution and the Composition of Microbial Community under Populus Euphratica’s Crown. Acta Ecol. Sin. 2021, 41, 5669–5684, (In Chinese with English abstract). [Google Scholar] [CrossRef]
  17. Hybholt, T.K.; Aamand, J.; Johnsen, A.R. Quantification of Centimeter-Scale Spatial Variation in PAH, Glucose and Benzoic Acid Mineralization and Soil Organic Matter in Road-Side Soil. Environ. Pollut. 2011, 159, 1085–1091. [Google Scholar] [CrossRef]
  18. Michelland, R.; Thioulouse, J.; Kyselková, M.; Grundmann, G.L. Bacterial Community Structure at the Microscale in Two Different Soils. Microb. Ecol. 2016, 72, 717–724. [Google Scholar] [CrossRef]
  19. Booth, R.K.; Sullivan, M.E.; Sousa, V.A. Ecology of Testate Amoebae in a North Carolina Pocosin and Their Potential Use as Environmental and Paleoenvironmental Indicators. Ecoscience 2008, 15, 277–289. [Google Scholar] [CrossRef]
  20. Escobar, J.; Brenner, M.; Whitmore, T.J.; Kenney, W.F.; Curtis, J.H. Ecology of Testate Amoebae (Thecamoebians) in Subtropical Florida Lakes. J. Paleolimnol. 2008, 40, 715–731. [Google Scholar] [CrossRef]
  21. Klerk, P.; Bobrov, A.; Theuerkauf, M.; Joosten, H. Short-Distance Distribution Patterns of Testate Amoebae in an Arctic Ice-Wedge Polygon Mire (Berelekh-Indigirka Lowlands, NE Siberia). Polar Biol. 2020, 43, 1321–1340. [Google Scholar] [CrossRef]
  22. Sim, T.G.; Swindles, G.T.; Morris, P.J.; Baird, A.J.; Charman, D.J.; Amesbury, M.J.; Beilman, D.; Channon, A.; Gallego-Sala, A.V. Ecology of Peatland Testate Amoebae in Svalbard and the Development of Transfer Functions for Reconstructing Past Water-Table Depth and PH. Ecol. Indic. 2021, 131, 108122. [Google Scholar] [CrossRef]
  23. Tsyganov, A.; Mazei, Y. Distribution of Soil Testate Amoeba Assemblages Along Catenas in the Northern Taiga Zone (Karelia, Russia). Protistology 2012, 7, 71–78. [Google Scholar]
  24. Tsyganov, A.N.; Temmerman, S.; Ledeganck, P.; Beyens, L. The Distribution of Soil Testate Amoebae under Winter Snow Cover at the Plot-Scale Level in Arctic Tundra (Qeqertarsuaq/Disko Island, West Greenland). Acta Protozool. 2012, 51, 155–167. [Google Scholar] [CrossRef]
  25. Heger, T.J.; Derungs, N.; Theurillat, J.P.; Mitchell, E.A.D. Testate Amoebae Like It Hot: Species Richness Decreases Along a Subalpine-Alpine Altitudinal Gradient in Both Natural Calluna Vulgaris Litter and Transplanted Minuartia Sedoides Cushions. Microb. Ecol. 2016, 71, 725–734. [Google Scholar] [CrossRef] [Green Version]
  26. Tsyganov, A.; Bobrov, A.; Shimano, S.; Mitchell, E.; Hagiwara, Y.; Wall, A.; Mazei, N.; Chernyshov, V.; Wanner, M.; Zhong, Y.; et al. Distribution of Soil Testate Amoeba Assemblages along an Elevation Gradient on Mount Fuji (Japan). Eur. J. Protistol. 2022, 84, 125894. [Google Scholar] [CrossRef]
  27. Vogt, J.C.; Olefeld, J.L.; Bock, C.; Boenigk, J.; Albach, D.C. Patterns of Protist Distribution and Diversification in Alpine Lakes across Europe. Microbiologyopen 2021, 10, e1216. [Google Scholar] [CrossRef]
  28. Lamentowicz, M.; Mitchell, E.; Lamentowicz, M.; Bragazza, L.; Buttler, A.; Jassey, V.E.J.; Mitchell, E.A.D. Seasonal Patterns of Testate Amoeba Diversity, Community Structure and Species-Environment Relationships in Four Sphagnum-Dominated Peatlands along a 1300 m Altitudinal Gradient in Switzerland. Soil Biol. Biochem. 2013, 67, 1–11. [Google Scholar] [CrossRef]
  29. Bobrov, A.A. Ecological and Geographic Patterns of Distribution and Community Structure of Testate Amoebae (Protozoa: Testacea). Ph.D. Thesis, Lomonosov Moscow State University, Moscow, Russia, 1999. (In Russian). [Google Scholar]
  30. Tsyganov, A.N.; Komarov, A.A.; Mitchell, E.A.D.; Shimano, S.; Smirnova, O.V.; Aleynikov, A.A.; Mazei, Y.A. Additive Partitioning of Testate Amoeba Species Diversity across Habitat Hierarchy within the Pristine Southern Taiga Landscape (Pechora-Ilych Biosphere Reserve, Russia). Eur. J. Protistol. 2015, 51, 42–54. [Google Scholar] [CrossRef]
  31. Yang, J.; Xu, J.; Cai, J.; Wang, H.; Dai, Y.; Shi, Z.; Feng, S. Study on Soil Physical and Chemical Properties of Shenzhen Park Greenland. J. Anhui Agric. Sci. 2019, 47, 52–55, (In Chinese with English abstract). [Google Scholar] [CrossRef]
  32. Liu, J.; Guo, W.; Luo, L.; Wu, G.; Liao, W.; Zhu, B. Vegetation Types and Their Ecological Landscape Planning in Nanshan Park, Shenzhen. Sun Yatsen Univ. Forum 2007, 27, 238–243. (In Chinese) [Google Scholar]
  33. Wei, H. Study on the Plant Species Disposing in Bao’an Park, Shenzhen City. For. Environ. Sci. 2009, 25, 31–38. (In Chinese) [Google Scholar]
  34. Zhang, J. Exploration on the Plant Configuration of Shenzhen Parks. Mod. Hortic. 2012, 71–73. (In Chinese) [Google Scholar] [CrossRef]
  35. Feng, X. Major Soil Types and Their Utilization in Ecological Landscape Forests in Shenzhen City. J. For. Eng. 2001, 15, 16–18. (In Chinese) [Google Scholar]
  36. Mazei, Y.A.; Chernyshov, V.A. Testate Amoebae Communities in the Southern Tundra and Forest-Tundra of Western Siberia. Biol. Bull. 2011, 38, 789–796. [Google Scholar] [CrossRef]
  37. Mazei, Y.A.; Tsyganov, A.N. Freshwater Testate Amoebae; KMK: Moscow, Russia, 2006. [Google Scholar]
  38. Mazei, Y.; Warren, A. A Survey of the Testate Amoeba Genus Difflugia Leclerc, 1815 Based on Specimens in the E. Penard and CG Ogden Collections of the Natural History Museum, London. Part 1: Species with Shells That Are Pointed Aborally and/or Have Aboral Protuberances. Protistology 2012, 7, 121–171. [Google Scholar]
  39. Mazei, Y.; Warren, A. A Survey of the Testate Amoeba Genus Difflugia Leclerc, 1815 Based on Specimens in the E. Penard and CG Ogden Collections of the Natural History Museum, London. Part 2: Species with Shells That Are Pyriform or Elongate. Protistology 2014, 8, 133–171. [Google Scholar]
  40. Mazei, Y.; Warren, A. A Survey of the Testate Amoeba Genus Difflugia Leclerc, 1815 Based on Specimens in the E. Penard and CG Ogden Collections of the Natural History Museum, London. Part 3: Species with Shells That Are Spherical or Ovoid. Protistology 2015, 9, 3–49. [Google Scholar]
  41. Ogden, G.G.; Hedley, R.H. An Atlas of Freshwater Testate Amoebae. Soil Sci. 1980, 130, 176. [Google Scholar] [CrossRef]
  42. Siemensma, F.J. Microworld, World of Amoeboid Organisms; World-Wide Electronic Publication: Kortenhoef, The Netherlands, 2019. [Google Scholar]
  43. Todorov, M.; Bankov, N. An Atlas of Sphagnum-Dwelling Testate Amoebae in Bulgaria; Pensoft Publishers: Sophia, Bulgaria, 2019; ISBN 978-954-642-973-5. [Google Scholar]
  44. Tsyganov, A.N.; Babeshko, K.V.; Mazei, Y.A. A Guide to Testate Amoebae with the Keys to Genera; Publishing House PGU: Penza, Russia, 2016. [Google Scholar]
  45. Cavalier-Smith, T.; Chao, E.E.-Y.; Oates, B. Molecular Phylogeny of Amoebozoa and the Evolutionary Significance of the Unikont Phalansterium. Eur. J. Protistol. 2004, 40, 21–48. [Google Scholar] [CrossRef]
  46. Cavalier-Smith, T. The Phagotrophic Origin of Eukaryotes and Phylogenetic Classification of Protozoa. Int. J. Syst. Evol. Microbiol. 2002, 52, 297–354. [Google Scholar] [CrossRef]
  47. Meisterfeld, R. Arcellinida. In The Illustrated Guide to the Protozoa; Society of Protozoologists: Lawrence, KS, USA, 2000; Volume 2, pp. 827–859. [Google Scholar]
  48. Meisterfeld, R.; Lee, J.J.; Leedale, G.F.; Bradbury, P. Testate Amoebae with Filopodia. In An Illustrated Guide to the Protozoa; Society of Protozoologists: Lawrence, KS, USA, 2002; pp. 1054–1084. [Google Scholar]
  49. Marcisz, K.; Jassey, V.; Kosakyan, A.; Krashevska, V.; Fournier, B. Testate Amoeba Functional Traits and Their Use in Paleoecology. Front. Ecol. Evol. 2020, 8, 1–28. [Google Scholar] [CrossRef]
  50. Payne, R.J.; Mitchell, E.A.D. How Many Is Enough? Determining Optimal Count Totals for Ecological and Palaeoecological Studies of Testate Amoebae. J. Paleolimnol. 2009, 42, 483–495. [Google Scholar] [CrossRef]
  51. R Core Team. R: A Language and Environment for Statistical Computing 2021; R Foundation for Statistical Computing: Vienna, Austria, 2021. [Google Scholar]
  52. Oksanen, J.; Blanchet, F.; Friendly, M.; Kindt, R.; Legendre, P.; McGlinn, D.; Minchin, P.; O’Hara, R.; Simpson, G.; Solymos, P.; et al. Vegan: Community Ecology Package 2020. Available online: https://github.com/vegandevs/vegan (accessed on 6 December 2022).
  53. Fox, J.; Weisberg, S. An R Companion to Applied Regression, 3rd ed.; Sage: Thousand Oaks, CA, USA, 2019; ISBN 978-1-5443-3647-3. [Google Scholar]
  54. Signorell, A.; Aho, K.; Alfons, A.; Anderegg, N.; Aragon, T.; Arachchige, C. DescTools: Tools for Descriptive Statistics 2022, R package version 0.99.47. Available online: https://cran.r-project.org/package=DescTools (accessed on 6 December 2022).
  55. Legendre, P.; Gallagher, E.D. Ecologically Meaningful Transformations for Ordination of Species Data. Oecologia 2001, 129, 271–280. [Google Scholar] [CrossRef]
  56. Paradis, E.; Schliep, K. Ape 5.0: An Environment for Modern Phylogenetics and Evolutionary Analyses in R. Bioinformatics 2019, 35, 526–528. [Google Scholar] [CrossRef]
  57. Zhou, X.; Zuo, X.; Zhao, X.; Wang, S.; Liu, C.; Zhang, J.; Lv, P.; Zhang, J. Comparison Analyses of DCA, CCA and DCCA on Relationships Between Plant Community Distribution and Soil Properties of Horqin Sandy Land. Chin. J. Ecol. 2015, 34, 947–954, (In Chinese with English abstract). [Google Scholar] [CrossRef]
  58. Arbizu, P.M. pairwiseAdonis. Available online: https://github.com/pmartinezarbizu/pairwiseAdonis (accessed on 6 December 2022).
  59. de Cáceres, M.; Legendre, P. Associations between Species and Groups of Sites: Indices and Statistical Inference. Ecology 2009, 90, 3566–3574. [Google Scholar] [CrossRef]
  60. Cáceres, M.; Legendre, P.; Wiser, S.K.; Brotons, L. Using Species Combinations in Indicator Value Analyses. Methods Ecol. Evol. 2012, 3, 973–982. [Google Scholar] [CrossRef]
  61. Gaston, K.J. Global Patterns in Biodiversity. Nature 2000, 405, 220–227. [Google Scholar] [CrossRef]
  62. Lomolino, M.V.; Riddle, B.R.; Whittaker, R.J.; Brown, J.H. Biogeography, 4th ed.; Sinauer Associates: Sunderland, MA, USA, 2010; ISBN 978-0-87893-494-2. [Google Scholar]
  63. Fierer, N.; Mccain, C.M.; Meir, P.; Zimmermann, M.; Rapp, J.M.; Silman, M.R.; Knight, R. Microbes Do Not Follow the Elevational Diversity Patterns of Plants and Animals. Ecology 2011, 92, 797–804. [Google Scholar] [CrossRef] [Green Version]
  64. Todorov, M.T. Observation on the Soil and Moss Testate Amoebae (Protozoa: Rhizopoda) from Pirin Mountain (Bulgaria). Acta Zool. Bulg. 1998, 50, 19–29. [Google Scholar]
  65. Mazei, Y.A.; Marfina, O.V.; Chernyshov, V.A. Distribution of Soil-Inhabiting Testate Amoebae along a Mountain Slope (Baikal Lake Region, Khamar-Daban Ridge, Cherskii Peak). Biol. Bull. 2012, 39, 800–804. [Google Scholar] [CrossRef]
  66. Krashevska, V.; Bonkowski, M.; Maraun, M.; Scheu, S. Testate Amoebae (Protista) of an Elevational Gradient in the Tropical Mountain Rain Forest of Ecuador. Pedobiologia 2007, 51, 319–331. [Google Scholar] [CrossRef]
  67. Mazei, Y.A.; Trulova, A.; Mazei, N.G.; Payne, R.J.; Tsyganov, A.N. Contributions of Temporal and Spatial Variation to the Diversity of Soil-Dwelling Testate Amoeba Assemblages in a Swampy Forest. Pedobiologia 2020, 81–82, 150660. [Google Scholar] [CrossRef]
  68. Mazei, Y.A.; Blinokhvatova, Y.V.; Embulaeva, E.A. Specific Features of the Microspatial Distribution of Soil Testate Amoebae in the Forests of the Middle Volga Region. Arid. Ecosyst. 2011, 1, 46–52. [Google Scholar] [CrossRef]
  69. Payne, R.J.; Belyakova, O.; Mazei, Y. Diversity and Community Ecology of Forest Epiphyte Testate Amoebae from European Russia. Eur. J. Protistol. 2015, 51, 450–459. [Google Scholar] [CrossRef] [Green Version]
  70. Marcisz, K.; Colombaroli, D.; Jassey, V.E.J.; Tinner, W.; Kołaczek, P.; Gałka, M.; Karpińska-Kołaczek, M.; Słowiński, M.; Lamentowicz, M. A Novel Testate Amoebae Trait-Based Approach to Infer Environmental Disturbance in Sphagnum Peatlands. Sci. Rep. 2016, 6, 33907. [Google Scholar] [CrossRef] [Green Version]
  71. Krashevska, V.; Sandmann, D.; Marian, F.; Maraun, M.; Scheu, S. Leaf Litter Chemistry Drives the Structure and Composition of Soil Testate Amoeba Communities in a Tropical Montane Rainforest of the Ecuadorian Andes. Microb. Ecol. 2017, 74, 681–690. [Google Scholar] [CrossRef]
  72. Balik, V. Testate Amoebae Community (Protozoa, Rhizopoda) in a Meadow-Spruce Forest Mesoecotone. Biol. Bratisl. 1996, 51, 117–124. [Google Scholar]
  73. Balik, V. Testate Amoebae Communities (Protozoa, Rhizopoda) in Two Moss-Soil Microecotones. Biol. Bratisl. 1996, 51, 125–133. [Google Scholar]
  74. Mieczan, T.; Tarkowska-Kukuryk, M.; Bielańska-Grajner, I. Hydrochemical and Microbiological Distinction and Function of Ombrotrophic Peatland Lagg as Ecotone between Sphagnum Peatland and Forest Catchment (Poleski National Park, Eastern Poland). Ann. De Limnol.—Int. J. Limnol. 2012, 48, 323–336. [Google Scholar] [CrossRef] [Green Version]
  75. Berg, M.P.; Bengtsson, J. Temporal and Spatial Variability in Soil Food Web Structure. Oikos 2007, 116, 1789–1804. [Google Scholar] [CrossRef]
  76. Potapov, A.M.; Rozanova, O.L.; Semenina, E.E.; Leonov, V.D.; Belyakova, O.I.; Bogatyreva, V.Y.; Degtyarev, M.I.; Esaulov, A.S.; Korotkevich, A.Y.; Kudrin, A.A.; et al. Size Compartmentalization of Energy Channeling in Terrestrial Belowground Food Webs. Ecology 2021, 102, e03421. [Google Scholar] [CrossRef] [PubMed]
  77. Yan, Z.Z.; Chen, Q.L.; Zhang, Y.J.; He, J.Z.; Hu, H.W. Industrial Development as a Key Factor Explaining Variances in Soil and Grass Phyllosphere Microbiomes in Urban Green Spaces. Environ. Pollut. 2020, 261, 114201. [Google Scholar] [CrossRef]
  78. Yuan, Z.S.; Liu, F.; He, S.B.; Zhou, L.L.; Pan, H. Community Structure and Diversity Characteristics of Rhizosphere and Root Endophytic Bacterial Community in Different Acacia Species. PLoS ONE 2022, 17, e0262909. [Google Scholar] [CrossRef]
  79. Zhang, M.H.; Huang, B.L.; Cheng, L.; Lv, C.Q.; Li, Z.X.; Wei, L.X. Features of Soil Microorganism in Mixed Forest of Eucalyptus Spp and Acacia Confusa. Guangxi Agric. Sci. 2009, 40, 681–685, (In Chinese with English abstract). [Google Scholar]
  80. Krashevska, V.; Maraun, M.; Scheu, S. How Does Litter Quality Affect the Community of Soil Protists (Testate Amoebae) of Tropical Montane Rainforests? FEMS Microbiol. Ecol. 2012, 80, 603–607. [Google Scholar] [CrossRef]
Figure 1. (a) Location of Shenzhen within China; (b) locations of three urban parks within Shenzhen; (c) distribution of sampling sites in Baoan Park; (d) distribution of sampling sites in Nanshan Park; (e) distribution of sampling sites in Yanziling Park. (Produced using ArcMap 10.2. Exact values for altitudes are specified in Table S1.)
Land 11 02250 g001
Figure 2. Sampling scheme: CC—the center of the crown, MC—the middle of the crown, EC—the edge of the crown.
Land 11 02250 g002
Figure 3. Sample-based species accumulation curve for the overall data set (Center bars are median values, color boxes are interquartile ranges (IQR), whisker lengths are ± 1.5 * IQR, and cross marks are outliers; shaded area is a min—max area).
Land 11 02250 g003
Figure 4. The environmental characteristics (mean ± SE) at the three crown positions (CC—the center of the crown, MC—the middle of the crown, EC—the edge of the crown) [(a) The soil pH at the three crown positions; (b) The soil moisture at the three crown positions; (c) The thickness of leaf litter at the three crown positions].
Land 11 02250 g004
Figure 5. The environmental characteristics (mean ± SE) at three slope positions [(a) The soil pH at the three slope positions; (b) The soil moisture at the three slope positions; (c) The thickness of leaf litter at the three slope positions].
Land 11 02250 g005
Figure 6. Overall community characteristics (mean ± SE) of the TA communities under the three crown positions (CC—the center of the crown, MC—the middle of the crown, EC—the edge of the crown) [(a) The abundance of TA communities at the three crown positions; (b) The species richness of TA communities at the three crown positions; (c) The Shannon’s diversity index of TA communities at the three crown positions; (d) The Pielou’s evenness index of TA communities at the three crown positions].
Land 11 02250 g006
Figure 7. The abundance (mean ± SE) of the three kinds of TA by aperture position under the three crown positions (CC—the center of the crown, MC—the middle of the crown, EC—the edge of the crown) [(a) The abundance of centrostomic TA communities at the three crown positions; (b) The abundance of plagiostomic TA communities at the three crown positions; (c) The abundance of acrostomic TA communities at the three crown positions].
Land 11 02250 g007
Figure 8. Overall community characteristics (mean ± SE) of the TA communities at the three slope positions [(a) The abundance of TA communities at the three slope positions; (b) The species richness of TA communities at the three slope positions; (c) The Shannon’s diversity index of TA communities at the three slope positions; (d) The Pielou’s evenness index of TA communities at the three slope positions].
Land 11 02250 g008
Figure 9. Principal coordinate analysis (PCoA) diagram indicates the differences in species structure of TA communities among three under-crown positions. Red arrows are indicator species obtained by indicator species analysis. CC—the center of the crown, MC—the middle of the crown, EC—the edge of the crown.
Land 11 02250 g009
Figure 10. Redundancy analysis (RDA) diagram indicates the differences in species structure among TA communities under three crown positions and at slope positions (see also Table 1 and Table 2). CC—the center of the crown, MC—the middle of the crown, EC—the edge of the crown.
Land 11 02250 g010
Table 1. The most abundant and the most common species under the three tree crown positions. (Relative abundance: the number of individuals of a species as a proportion of the total number of individuals of all species per gram of soil. Occurrence: the number of occurrences of a species in the samples as a proportion to the total number of samples).
CharacteristicsSpeciesCCMCEC
N = 27N = 27N = 25
Occurrence (>70%)Centropyxis sylvatica85.19%
Centropyxis platystoma74.07%
Corythion dubium74.07%
Cyclopyxis eurystoma 74.07%
Difflugia oblonga 76.00%
Euglypha rotunda85.19%
Euglypha ciliata81.48%
Euglypha compressa81.48%
Euglypha strigosa70.37%
Heleopera petricola100.00%
Heleopera sylvatica 81.48%72.00%
Hyalosphenia subflava77.78%
Pseudodifflugia gracilis96.30%
Pseudodifflugia compressa 81.48%
Plagiopyxis callida88.89% 80.00%
Trinema complanatum88.89%77.78%80.00%
Trinema enchelys85.19%88.89%80.00%
Trigonopyxis arcula92.59%
Relative abundance (>5%)Difflugia oblonga 8.04%
Heleopera sylvatica 6.66%8.48%
Hyalosphenia subflava5.31%5.15%
Pseudodifflugia gracilis6.50%
Pseudodifflugia compressa 6.34%5.53%
Plagiopyxis callida 6.31%
Trinema enchelys5.30%6.27%6.68%
Trinema complanatum 6.59%
Trinema lineare 5.05%
Trigonopyxis arcula5.48%
Table 2. The most abundant and the most common species at the three hillside positions. (Relative abundance: The number of individuals of a species as a proportion to the total number of individuals of all species per gram of soil. Occurrence: the number of occurrences of a species in the samples as a proportion to the total number of samples).
Characteristics SpeciesSummitSlopeFoot
N = 26N = 26N = 27
Occurrence (>70%)Centropyxis platystoma 70.37%
Centropyxis sphagnicola 77.78%
Euglypha compressa 74.07%
Galeripora arenaria 74.07%
Galeripora artocrea 81.48%
Heleopera sylvatica 77.78%
Hyalosphenia subflava 77.78%
Pseudodifflugia gracilis 77.78%
Pseudodifflugia compressa 88.89%
Plagiopyxis callida76.92% 88.89%
Trinema complanatum80.77% 100%
Trinema enchelys 88.46%100%
Trigonopyxis arcula 74.07%
Relative abundance (>5%)Heleopera sylvatica 5.92%
Pseudodifflugia compressa 6.27%
Plagiopyxis callida 5.15%
Trinema enchelys 5.96%6.07%
Trinema complanatum 5.57%
Publisher’s Note: MDPI stays neutral with regard to jurisdictional claims in published maps and institutional affiliations.