Abstract
Agricultural land use planning is based on the capacity of the soil to support different types of crops and is a prerequisite for better use of cultivated land. Land Suitability Analysis (LSA) is used to measure the level of suitability of growing a specific crop in the area and can also be used to evaluate future scenarios as a means for sustainable agriculture. LSA was employed to calculate current land suitability, as well as four scenarios of Soil-Improving Cropping Systems (SICS): (a) Conservation Tillage (CT), (b) Cover Crop (CC), (c) Crop Residue Management (CRM), and (d) Manure Application (MA). The scenarios of SICS were derived by increasing soil organic matter and cation exchange capacity values depending on the SICS hypothetically applied for a period of 100 years in the future. LSA was evaluated for maize in three sites: (a) Flanders (BE), (b) Somogy (HU), and (c) Hengshui (CH). LSA was performed using the Agricultural Land Use Evaluation System (ALUES) considering soil and climatic and topographic parameters. Weighing factors of input parameters were assigned using the Analytical Hierarchy Process (AHP). The results show that in Flanders, the highly suitable (S2) class covered 3.3% of the total area, and the best scenario for improving current LS was CRM, in which S2 expanded to 9.1%. In Somogy, the S2 class covered 18.3% of the total area, and the best scenarios for improving current land suitability were CT and CC, in both of which the S2 class expanded to 70.5% of the total area. In Hengshui, the S2 class covered 64.7% of the total area, and all SICS scenarios performed extremely well, converting almost all moderately suitable (S3) areas to S2. The main limiting factor that was recognized from a limiting factor analysis in all cases was the climatic conditions. This work proves that LSA can evaluate scenarios of management practices and recognize limiting factors. The proposed methodology is a novel approach that can provide land suitability maps to efficiently evaluate SICS scenarios by projecting soil characteristics and LSA in the future, thus facilitating management decisions of regional policy makers.
1. Introduction
As the world population continues to grow, much more effort and innovation will be needed to increase agricultural production, improve global supply chain, and achieve sustainability. Sustainable Development Goals (SDGs) move towards that direction through supporting sustainable agriculture, empowering small farmers, and tackling climate change. The growing scarcity of soil resources in many parts of the world makes it vital to use and manage them sustainably. Concerning the current extent of land degradation and limited land resources, the need to optimize land use while preserving the ecosystem is crucial.
Sustainable land management requires the application of various techniques combined with local knowledge to achieve sustainability of the agroecosystems [1,2,3]. Soil management along with ecosystem, environmental interactions, and climate change severely affect soil quality and soil organic matter (SOM), which are essential to maintain healthy and productive soils. Developing ecological agricultural practices is the key to maintaining high levels of soil organic matter to keep the soil fertile and thus achieve long-term sustainability. Magdoff and Van Es [4] aimed to identify and evaluate Soil-Improving Cropping Systems (SICS) that would increase the profitability and sustainability of agriculture. The concept of SICS was applied by Van De Vreken et al. [5], aiming to identify the interaction between residue management and soil properties on carbon sequestration. Selected SICS using modeling and Europe-wide data were monitored and evaluated for environmental, sociocultural, and economic effects to determine profitability and sustainability [6]. The results show a small positive impact on environment and soil with variations across Europe, which suggests a better understanding of the local dynamics Europe-wide. In a detailed review, the suggestions for monitoring included only the soil indicators that could be used as point measurements without any spatial information related to crops [7]. Another synthesis of reviews has analyzed the knowledge gained in literature reviews on SOC changes in long-term experiments (LTEs) and evaluated the results regarding interactions with pedo-climatological factors [8]. All these studies use point measurements and legacy databases without any spatial analysis of the information and relation to crops, thus inserting errors when extrapolating to the regional scale.
Land suitability evaluation can contribute to agricultural land use optimization, as it used to determine the most appropriate spatial plan for current and future land uses [9,10] and constitutes a useful tool to achieve sustainable use of the available resources and limit land degradation. The Food and Agriculture Organization (FAO) approach has been used as a major Land Suitability Analysis (LSA) framework, which gives the basic guidelines in agriculture to carry out a land evaluation process [11,12]. Furthermore, LSA can be used to evaluate scenarios of agricultural management practices that contribute to increased productivity, while reducing agricultural inputs, conserving natural resources, and mitigating climate change impacts. Such management practices are those aiming at carbon sequestration in the soil, including manure application and crop residue incorporation, and contributing to reduced fertilizer input, soil quality improvement, and soil erosion amelioration.
LSA methods are classified as traditional, where biophysical characteristics are used to assess crop options using qualitative, quantitative, and parametric methods [13], as well as modern methods combining GIS and machine learning algorithms [14], where most of them are multi-criteria decision-making methods. Examples of traditional methods reported for the assessment of several scenarios of agricultural management practices in several crops are the following: (a) Parametric Methods used for wheat; (b) Boolean Logic, Maximum Limiting factor, and Weighed Overlay methods used for rice; (c) Weighted Linear Combination used for rice and soybean; (d) Square root mean used for cereal crops; (e) Expert Knowledge and FAO method used for Chemoriya; (f) Qualitative approaches for maize, potato, and vegetables; and (g) Computer overlay used for canola, soybean, and others. Respectively, the main modern methods used in Land Suitability Assessment to evaluate different scenarios of agricultural management practices are: (a) Analytical Hierarchy Process—AHP used for maize, potato, saffron, rice, grapes, wheat, and sugarcane; (b) fuzzy methods used for groundnut, maize, rice, soybean, sorghum, barley, spinach, wheat, rye, oats, sugarbeet, and more; (c) methods based on the use of crop models (mainly used for cereals); GIS-based Environmental Policy Integrated Climate (EPIC) model, Almagra, ECOCROP, CROPWAT; and (d) machine-learning-related methods (also used for cereals), such as Artificial Neural Networks, TOPSIS, Bayesian Networks (BNs), and Goal programming Species distribution models. In both cases, the thematic factors considered are “Climate”, “Soil and Landscape”, “Socio-Economic”, and “Land Use Land Cover (LULC)” [14].
The main advantage of modern methods over the traditional is that they succeed in mapping areas with homogenous characteristics considering several variables and, therefore, they can provide solutions to more complicated scenarios. As a result, modern LSA methods compared with traditional methods might use more time-consuming or complex algorithms and procedures [14], and can subsequently be applied to complex environmental challenges such as land degradation [15] and landscape attractiveness in highly populated areas [16]. The main LSA methods are usually classified as: (i) computer-assisted overlay mapping; (ii) artificial intelligence (AI) methods; and (iii) multi-criteria evaluation (MCE) or multi-criteria decision making (MCDM) [17].
AHP contributes to complicated decisions when dealing with a mix of qualitative and quantitative factors (e.g., [18,19,20]). According to Malczewski [10], it can be used in two distinctive ways within the GIS environment. Firstly, it can be employed to derive the weights associated with suitability map layers for individual attribute properties. Secondly, the weights can be combined with the attribute map layers in a way similar to the additive Weighted Linear Combination (WLC).
Until now, there has been limited research conducted on how SICS could be integrated into LSA scenarios, except for the approach of an optimal scenario under the improvement of manageable limiting factors such as soil salinity [21]. In this work, two scenarios were considered to assess and map soil suitability after applying the “Almagra” model: the current situation (CS), where management options were proposed to reduce some limiting factors (soil salinity and sodium saturation), and the optimum scenario (OS) (with a predefined fixed value of 2 dSm−1 for soil salinity and 5% for sodium saturation). The results show a noticeable increase in the area classified as a highly suitable area for annual and semi-annual crops. Moreover, a marked increase was observed (about 70% for CS and 50% for OS) for perennial crops shifting from the marginal class to moderate suitability class. The results of this work indicate that proper management can contribute to soil suitability in the context of the sustainable land use of a fertile agro-ecosystem [21]. For Belgium, Vanwindekens et al. [22] studied the vulnerability of arable cropping and grassland to extreme weather events using a combination of expert knowledge derived from interviews, fuzzy inference systems, and geomatics. The factors underlying agro-ecosystem vulnerability clearly revealed that SICS such as crop rotation, cover crops, grassland species composition, and organic matter added to resilience.
The main objective of the current study is to investigate the use of Land Suitability Analysis (LSA) as a tool to evaluate Soil-Improving Cropping Systems (SICS). The suitability of land was assessed for maize in Flanders (BE), Somogy (HU), and Hengshui (CH) under the current situation, as well as after a hypothetical 100-year application of four scenarios: (a) Conservation Tillage, (b) Crop Cover, (c) Crop Residue Management, and (d) Manure Application.
2. Materials and Methods
The proposed methodology uses the FAO framework for LSA [11,12] as a tool to evaluate the level of current land suitability for growing maize and to evaluate the principal limiting factors. The FAO framework differentiates between land suitable for crops (S) and not suitable for crops (N). Suitable land is classified in three suitability classes: (S1) highly suitable, (S2) moderately suitable, which requires several inputs on the land to sustain the crop, and (S3) marginally suitable, which requires significant inputs on the land [9,10]. The FAO framework is also used to predict the future land suitability based on scenarios of applying four Soil-Improving Cropping Systems (SICS) for 100 years. The final product is the comparison between the current and future LS to evaluate the potential performance of the SICS.
The main steps in the current work are the following: (1) selection of the crop of interest (maize) in the three sites (Flanders—BE, Somogy—HU, and Hengshui—CH); (2) selection of the categories of Input Parameters (soil, water, climatic, topographic, environmental, and management properties); (3) determination of their threshold values; (4) calculation of the Input Parameters’ (IP) performance via Agricultural Land Use Evaluation System (ALUES software) by mapping land units of each IP into FAO classes; (5) determination of weighing factors for each IP via Analytical Hierarchy Process (AHP) based on local experts’ opinions; (6) calculation of a combined performance for each Category of Input Parameters (CIPs); (7) investigation of the IP as limiting factors (Limiting Factor Analysis); (8) validation of the LSA by comparing the results with the existing LUCAS microdata database; (9) selection of four Soil-Improving Cropping Systems (SICS): (a) Conservation Tillage (CT), (b) Cover Crop (CC), (c) Crop Residue Management (CRM), and (d) Manure Application (MA), which aimed to increase SOM and CEC to enhance soil quality, crop productivity, and carbon sequestration in soil; (10) adopted scenarios of 100-year application of management practices with re-calculation of new values for SOC and CEC; (11) calculation of a combined performance for each SIC scenario; and (12) cross-examination of the LSA classes with the existing LUCAS microdata database. Finally, via LSA maps and data, the comparison between current LS and SICS performance after 100 years of application can provide a projection of the land suitability in the future depending on the different agricultural practices adopted. The method of using LSA provides a quantification of the changes and a visual way to locate the areas most affected (Figure 1).
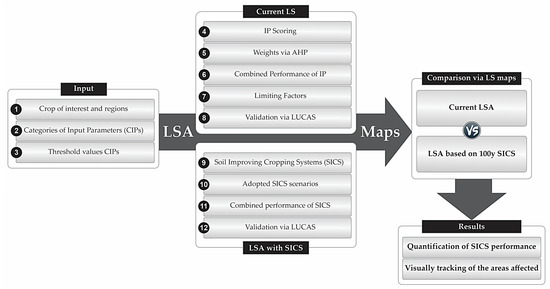
Figure 1.
Steps (1–12) for using LSA as a tool to evaluate the level of current land suitability compared with future SICS.
2.1. Test Sites
The methodology was tested on three regional test sites, two in Europe and one in China. These were Flanders in Belgium, Somogy in Hungary, and Hengshui in China.
Flanders is located in the northern part of Belgium, sharing borders with France and the Netherlands (Figure 2a). Geographically, Flanders is mainly flat, and has a small section of coast on the North Sea. The total area is 13,265 km2 and is densely populated, and the soils are formed mainly on sedimentary and loess deposits. The main arable crops in the area are wheat, potato, maize, grass, and sugar beets. The climate is temperate and is characterized by high precipitation and water scarcity during summer. Winters are mild and rainy according to the Köppen climate classification. The mean annual temperature is 10.5 °C, mean annual lowest and highest temperature are 6.9 and 14.2 °C, respectively, and mean annual precipitation is 852.4 mm.
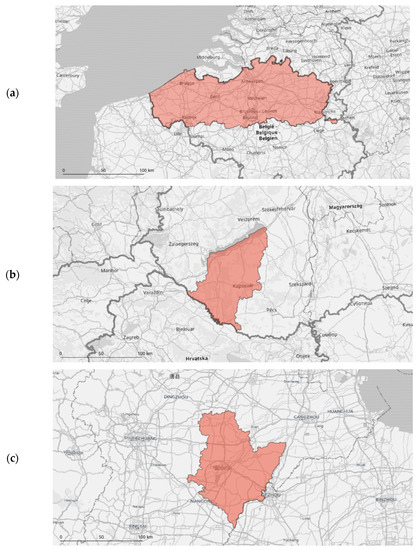
Figure 2.
Location of test sites: (a) Flanders (BE), (b) Somogy (HU), and (c) Hengshui (CH).
Somogy is an administrative county that lies in south-western Hungary, on the border with Croatia, with an area of 6064 km2 (Figure 2b). The main crops in the area are wheat, potato, maize, alfalfa, and sugar beets. Somogy constitutes two distinct regional units: the northern region, known as Outer Somogy, and the flatter, forested, and southern region, known as Inner Somogy, while Lake Balaton and the Drava River may also be regarded as geographically distinct regions. Clay and sandy soils are characteristic of this region. Peat and swampy forest floors indicate that this area was covered with extensive forests, swamps, and bogs in the past. The proportion of the county’s forest area remains very high (Somogy is the third most forested county), while the proportion of arable land, gardens, and orchards is below the national average. Somogy has a marine west coast and warm summer climate (classification: Cfb). Moving eastwards, the climate becomes more continental.
Hengshui is a prefecture-level city division in southern Hebei province (Figure 2c). The Hengshui prefecture is located in the lowest part of the province’s terrain, with a total area of 8836.95 km2. The climate in Hengshui is known as a local steppe climate (classified as BSk by the Köppen–Geiger system). There is little rainfall throughout the year. In Hengshui, the average annual temperature is 14.4 °C, and the average precipitation ranges between 500 and 900 mm, of which 60% is in the summer. The topography of this region is characterized by alluvial plains with low elevation. The main food crops are wheat, corn, grain, and sorghum, while the prevailing cropping pattern is winter wheat in rotation with summer corn. The soil is mostly tidal loam, two-combined soil, and sandy loam, fertile and moderate in texture [22].
2.2. Input Parameters
Data used in the specific test sites were (a) soil resources properties, (b) climatic properties, and (c) topographic properties. The LSA tool’s input parameters were grouped in the following Categories of Input Parameters (CIPs):
- Soil resources properties;
- Water resources properties;
- Climatic properties;
- Topographic properties;
- Environmental properties;
- Management properties.
Soil data used were taken from SoilGrids (https://data.isric.org/geonetwork/srv/eng/catalog.search, accessed on 5 August 2021) after integrating values across soil depth up to 60 cm (Table 1) using Equation (1).
where is the number of depths, is the range of k depth, and is the value of the soil parameter in the depth.

Table 1.
Soil depth levels in SoilGrids.
Climate data were acquired from ERA5-Land, TerraClimate, and WorldClim 2, while terrain data were from the European Digital Elevation Model (EU-DEM) version 1.0 and Shuttle Radar Topography Mission (SRTM).
2.3. LSA Software
LSA was performed using the Agricultural Land Use Evaluation System (ALUES), which is an R programming (open-source statistical software) package developed for evaluating the land suitability of different crops. ALUES assesses suitability by classifying the land units using fuzzy logic. The assessment is based on the standards of the crop requirements from Sys et al. [23]. The computations of the suitability scores and classes are based on the land use suitability evaluation tool [24] with extended options for the membership function. The mathematics behind the computations are detailed in https://cran.r-project.org/package=ALUES accessed on 12 November 2021.
Using ALUES, the task of evaluating land suitability becomes a task to map input characteristics of a land unit into the suitability class of the target factor by checking whether this characteristic is within any of the suitability classes. For example, suppose that an input land unit has terrain with a slope of 1 degree. The suitability classes used are s1—highly suitable, s2—suitable, and s3—marginally suitable. To complete the computation of the suitability scores, ALUES uses fuzzy logic (Triangular, Trapezoidal, and Gaussian functions) to evaluate the suitability of a land unit based on inputs (such as rainfall, temperature, topography, and soil properties). The methods for computing the overall suitability of an area (Minimum, Maximum, and Average) are also included. ALUES is a highly optimized library with core algorithms written in C++.
2.4. Analytical Hierarchy Process
The Analytical Hierarchy Process (AHP) is a multiple criteria decision-making method that was originally developed by Saaty [25]. The method is widely used in many scientific fields to provide measures of judgement consistency. Using pair-wise comparisons, it successfully derives priorities among criteria and alternatives. The result of the AHP (setting ratings after pair-wise comparisons of the factors) can be evaluated via Consistency Index and Ratio and via Sensitivity Analysis. In a nutshell, the method of AHP simplifies preference ratings among decision criteria. AHP was implemented in the R computational environment, utilizing available resources from the online repository at https://github.com/gluc/ahp, accessed on 14 September 2021.
2.5. Selection of Threshold Values
Threshold values for available input parameters are presented in Table 2 and were adopted according to Sys, Van Ranst, Debaveye, and Beernaert [23]. The table was customized for each site. Five soil parameters were used, which were the same for all sites, namely: CEC, SOC, pH, texture, and coarse fragments. All values were numerical, apart from texture, which was grouped in classes. Concerning topography, detailed Digital Elevation Models were available and provided slope maps that were the most important factor to be considered. For climate, Precipitation and Temperature were used after customization for the local growing cycle.

Table 2.
Threshold values for available input parameters for maize.
2.6. SICS Scenarios for 100 Years
To account for SICS scenarios, we adopted four cases of 100-year application of management practices, as seen in Table 3. Scenarios in the study areas were adopted after Aertsens et al. [26], Van De Vreken, Gobin, Baken, Van Holm, Verhasselt, Smolders, and Merckx [5], Nadeu et al. [27], Vanwindekens, Gobin, Curnel, and Planchon [22], and personal communication with local experts. These scenarios were incorporated in the LSA procedure by calculating new values for SOC and CEC. The conversion of SOC values to soil organic matter values was achieved using a factor of 1,72, while the value of CEC for soil organic matter was assumed to be 200 cmol/kg.

Table 3.
Increase in SOC per year in kg/ha for four SICS scenarios.
2.7. Field Data
The LSA results were compared with the location of existing maize fields according to the LUCAS microdata database, which includes 27 locations in Flanders and 28 locations in Somogy. In Hengshui, due to lack of data, the LSA results were only examined by local experts.
3. Results
3.1. Flanders, BE
3.1.1. Weighing Factors in Flanders
The weighing factors were derived after applying the AHP for maize. In the soil CIP, Soil Texture received the highest value (0.331), while CF had the lowest (0.073). In the climate CIP, Mean Minimum Temperature had the highest weight (0.245) and Precipitation in August had the lowest (0.058). Across CIPs, soil and climate received the same weight (0.429), meaning that local experts attribute an equal and more dominant role to soil and climate, while topography was assessed as less important for maize.
3.1.2. Land Suitability in Flanders
For maize in Flanders, as seen in Figure 3, climate CIP received the lowest scores across the region. On the other hand, topographic CIP (slope) appears to be very favorable for maize. For soil CIP, the highest score is observed in the west, north-west, and south-east parts, while the rest of the area received lower scores, with the lowest values located in the northeast. In Figure 4, the current LS is presented, where the most favorable soil conditions are in the north-west and south-east parts. Almost all of the area was classified in the S3 class (S2 area: 3.3% and S3 area: 96.7%). The absence of the S1 and S2 classes shows that conditions for cultivating maize in the area are marginally suitable.
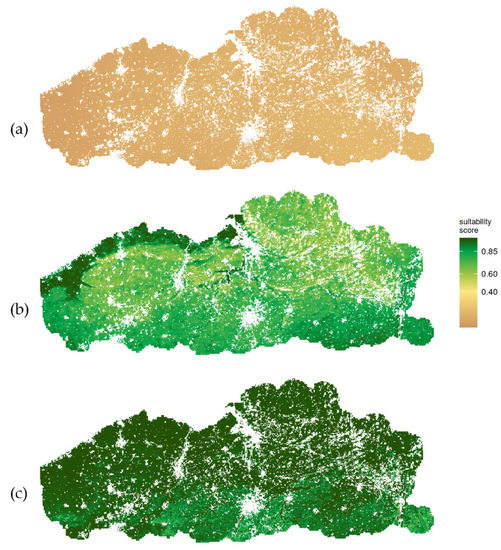
Figure 3.
Suitability score maps for maize in Flanders: (a) climatic factors; (b) soil factors; (c) topographic factors.
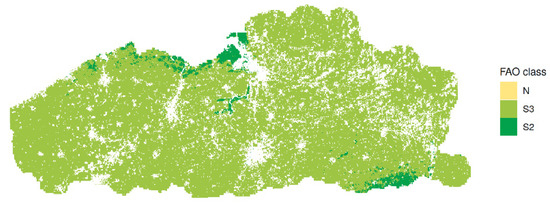
Figure 4.
LS classes for maize in Flanders.
Grain maize is an important crop for pigs, while silage maize is cultivated for cattle. Overall, maize is sensitive to climate variables. Many different maize varieties exist, and if weather conditions during the growing season are unfavorable, the crop is then used for silage or feed. The northeast is characterized by a sandy soil with a low water-holding capacity and low suitability; the same holds for the middle belt of Flanders. Due to the location of animal husbandry in this region, maize production is very large. In the drought-prone area of the northeast, irrigation is sometimes applied to alleviate this constraint.
Regarding maize, validation was performed with 2018 LUCAS microdata, which included 173 sampling points with maize cover. As seen in Figure 4, almost all sampling points fell in the S3 class (marginally suitable).
3.1.3. Limiting Factors in Flanders
Climate (precipitation) is the main limiting factor for maize in Flanders, while soil pH has the lowest score (covering almost 60% of the area) inside the soil CIP (Figure 5). Precipitation has the lowest scores, whether it is precipitation of the growing cycle or precipitation of each month (especially August). Texture restricts productivity to the northwest and northeast, mainly due to the presence of sandy soils. SOC restricts LS in the western part and CEC in the northwest and southeast parts. Low CEC scores in these areas are the result of the integration of CEC values of up to 60 cm (from SoilGrids), which decreases average values, although the surface soil up to 10 cm has higher values. The sandy soil in the northeast is not resilient to the climatic conditions, so irrigation is increasingly applied to support maize productivity. Near the coast, polder clay occurs and, in the southeast loess, both favoring maize cultivation. pH is the limiting factor in Podzols in the northeast, where after many years of manure and plaggen application the soils have become Anthrosols. The topography (slope) does not appear at all in the limiting factors analysis, probably due to the smooth relief. Climate (Temperature or Precipitation) plays an important role concerning the outcome of LS for maize, rendering the area vulnerable to climate impacts.
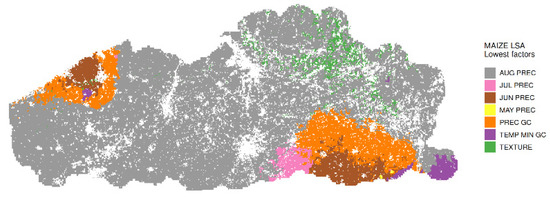
Figure 5.
Input parameters with the lowest score for maize in Flanders.
3.1.4. SICS Scenarios in Flanders
In Flanders, the areas most affected are those close to the areas classified as S2 in the north and south. SICS improve LS, as they affect soil parameters (SOC and CEC), especially in the areas that have low SOC and CEC scores (Figure 6). SOC restricts LS to the western part of the region and CEC to the northwest and southeast parts. Among SICS, CRM increases the S2 class by a factor of 3. However, the upgrade to S2 class is small, as climatic conditions have a higher weighing factor and lower scores. Based on current LS, the S2 area covers 3.3% of the total area. The best scenario for improving current LS is CRM, in which S2 expanded to 9.1%. The other three SICS, CT, CC, and MA, achieved a lower performance compared with CRM, with the S2 class covering 6.9%, 8.3%, and 8.1% of the total area, respectively (Table 4).
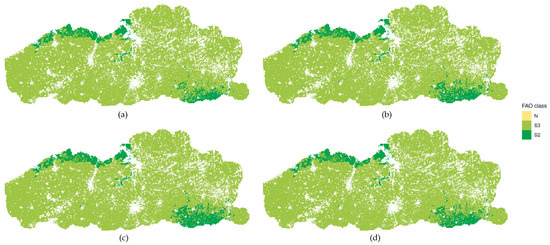
Figure 6.
LS classes (S1, S2, S3, N) after 100 years of SICS for maize in Flanders, where (a) Conservation Tillage (CT); (b) Cover Crop (CC); (c) Crop Residue Management (CRM); (d) Manure Application (MA).

Table 4.
Frequencies (number of pixels) and area (% of total region area) for S2-classified areas per test site under current LS and various SICS scenarios.
Generally, in Flanders, the intensive cropping systems and abundant presence of animal manure in combination with a strict environmental legislation on nutrient management has led to a decline in soil organic matter content, an increase in soil erosion and compaction, and high phosphorus content. Soil quality and soil-improving practices are therefore a strong recommendation to farmers. The agricultural, environmental, and climate policies have converging effects towards improving soil quality. Increasing the effective organic carbon content of arable land through crop rotation and farming practices is one of the most important eco-regulations in the area.
3.2. Somogy, HU
3.2.1. Weighing Factors in Somogy
For maize, in the soil CIP, Soil Texture received the highest value (0.353), while CEC had the lowest (0.067). In the climate CIP, Mean Minimum Temperature and Precipitation in June had the highest weight (0.235) and Precipitation in August had the lowest (0.058). Across CIPs, climate received a higher weight (0.481) compared with soil and topography, meaning that local experts attribute a more dominant role to climate, while topography was assessed as less important for maize in Somogy.
3.2.2. Land Suitability in Somogy
Regarding maize in Somogy, climate appears to be the least favorable CIP (Figure 7) compared with the other two, although soil CIP does not perform well, either. Maize is grown on about 1,000,000 hectares in Hungary, of which 67,000 are in Somogy County. Its national economic importance is great, but at the same time, the decline in maize production has accelerated due to the increasing periods of drought. Unfortunately, irrigation is not typical in southwestern Hungary. Unlike in the past, maize can no longer be produced effectively on 300–400 thousand hectares in Hungary, which has been replaced by wheat, sunflower, and sorghum. In Somogy County, too, rainfall distribution mostly determines the success of cultivation, which in sandy areas is extremely limited nowadays.
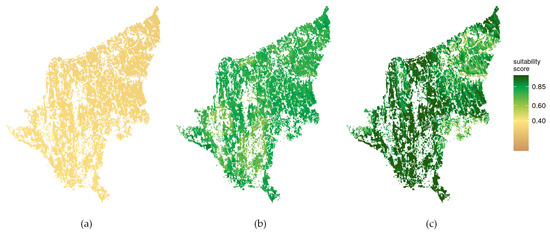
Figure 7.
Suitability score maps of input parameters for maize in Somogy, where: (a) climatic factors; (b) soil factors; (c) topographic factors.
Based on current LS, the S2 class covers an area of only 18.3%, while S3 is the prevailing class, covering 81.7% of the total area (Figure 8). In Somogy, LSA results control was performed based on 2018 LUCAS 28 sampling points, where maize was observed. Most of the locations were classified as S3 suitability class (marginally suitable), while the rest belonged to the S2 class (moderately suitable).
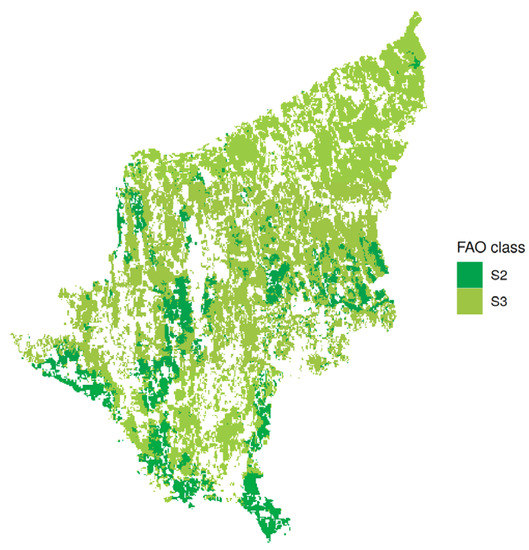
Figure 8.
LS classes for maize in Somogy.
3.2.3. Limiting Factors in Somogy
The parameters that restrict the LS score in each pixel were investigated. As seen in Figure 9a, the prevailing limiting factor is Precipitation in July and June, covering the whole area. A separate analysis was performed to define the limiting factor inside the soil CIP, as seen in Figure 9b. The results show that soil organic carbon is mostly restricting LS for maize, covering almost the whole area, while pH is the limiting factor in the northern corner. Other limiting factors, but to a smaller extend, are Texture and CEC.
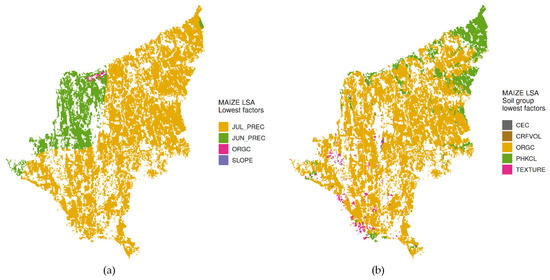
Figure 9.
Input parameters with the lowest score for maize in Somogy (a), considering only the soil group (b).
The soil properties of the Somogy microregions are extremely diverse. In western Somogy, sand and loess alternate mostly on the north–south ridges. In eastern Somogy, there are brown forest soils with good fertility and chernozem soils, which are the most valuable in terms of organic matter. Within the 253,000 ha of arable land in Somogy, 100,000 ha are especially vulnerable to soil erosion. Due to erosion, the humus soil layer is getting thinner, the supply of organic matter in the arable land is decreasing, and as a result, the yield of cultivated plants is declining.
3.2.4. SICS Scenarios in Somogy
In Somogy, the areas most affected are those in the central and southern parts of the region, while the northern areas were less affected. In Figure 10a, the results for CT and CC are presented, which shows that there is a profound enhancement of LS for maize, as more than 50% of the area moved from the S3 to S2 class. LS improvement is noticeable for CRM and MA as well, as almost 37% and 18% of the area moved from the S3 to S2 class, respectively. Based on current LS, the S2 area covers 18.3% of the total area. The best scenario for improving current LS was CT, as well as CC, in both of which the S2 area expanded to 70.5% (quadrupled). The other two SICS, CRM and MA, achieved a lower performance compared with CC or CT. In the cases of CRM and MA, the S2 area was expanded 55.2% (tripled) and 36.4% (doubled), respectively (Table 4).
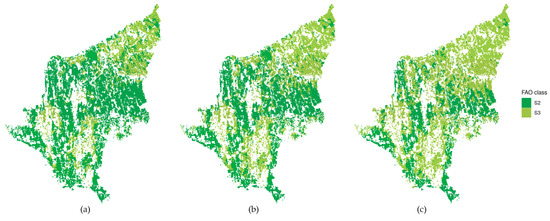
Figure 10.
LS classes and validation after implementing SICS for 100 years (maize) in Somogy: (a) Cover Crop (CC) and Conservation Tillage (CT); (b) Crop Residue Management (CRM); (c) Manure Application (MA).
The erosion vulnerability of Somogy county determines the soil cultivation methods that can be carried out. Based on this, contour-tillage is commonly used in this area, and it is better to use densely seeded crops such as rape and cereals instead of sunflowers or maize. The most important thing is that the soil organic matter must be increased, which is why it is recommended to incorporate plant residues. More and more farmers realize the importance of cover crops and green manure, and farmers are introducing crops such as phacelia and crimson clover into the crop rotation.
3.3. Hengshui, CH
3.3.1. Weighing Factors in Hengshui
For maize, the Soil Texture received the highest value (0.331), while pH and SOC received the same value (0.235), and CF had the lowest (0.073). In the climate CIP, Mean Temperature and Precipitation had the highest weight (0.245), and Precipitation in July had the lowest (0.058). Across CIPs, soil and climate received the same weight (0.429), meaning that local experts attribute an equal and more dominant role to soil and climate, while topography was assessed as less important for maize in Hengshui.
3.3.2. Land Suitability in Hengshui
Regarding maize in Hengshui, climate appears to be the least favorable CIP (Figure 11) compared with the other two. Previous studies in the Hengshui region showed that the temperature was closely associated with maize growth and yield. The non-technical efficiency of maize production increased with the temperature. From mid-June to early August, the historical meteorological data elucidated that high temperatures continued, subjecting maize to the dual stress of heat and drought. While maize varieties and management measures remain unchanged, the increase in temperature advances the critical developmental period, shortens the reproductive period as a whole, and reduces the accumulation time of dry matter [28]. Topographic parameters were optimal with high scores, and soil parameters received a lower score of around 0.6. The results of LS for maize (Figure 12) show that the area to the south is better for maize crops and that there is an absence of the S1 class. The absence of the S1 class is probably caused by low values of rainfall during the growing season.
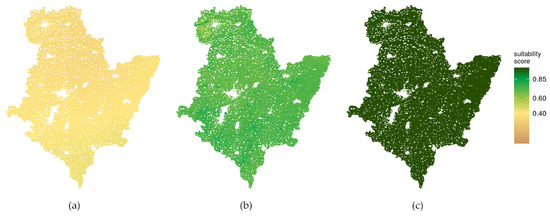
Figure 11.
Suitability score maps for maize in Hengshui: (a) climatic factors; (b) soil factors; (c) topographic factors.
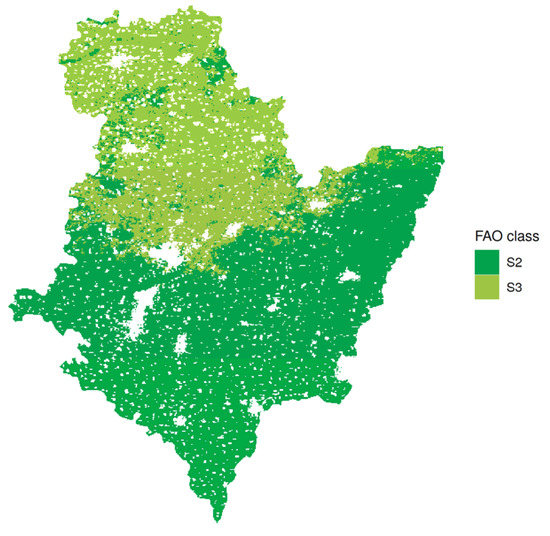
Figure 12.
LS classes for maize in Hengshui.
3.3.3. Limiting Factors in Hengshui
The overall limiting factor for maize in Hengshui (including soil, climate, and topography parameters) is again precipitation (Figure 13a). Inside the soil category of input parameters, the limiting factor for maize is SOC (Figure 13b), meaning that although the soil organic matter is low (around 1%), the climate is more restrictive and, unless there is some short in irrigation, the improvement of SOC will have almost no effect on maize production.
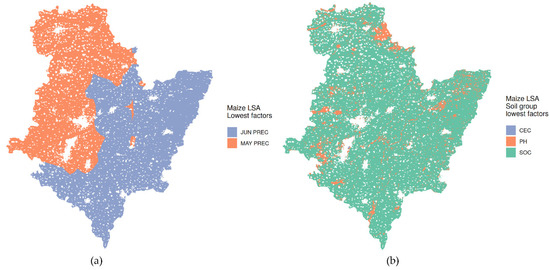
Figure 13.
Input parameters with the lowest score for maize in Hengshui (a), considering only the soil group (b).
3.3.4. SICS Scenarios in Hengshui
In Hengshui, the areas most affected are those in the northern part, while all the region moved to the S2 class. The application of SICS improved LS for maize in all cases, moving from the S3 class to S2 (Figure 14). The S2 class of CC, CRM, and MA covered all the region of Hengshui (Figure 14b). This improvement is probably due to the current low values of Soil Organic Carbon, as the selected SICS add carbon to the soil. The reduction in chemical fertilizer and application of organic or integrated organic and inorganic fertilizers have increasingly been adopted. Recent studies have shown that the addition of organic fertilizer significantly improved soil fertility, such as improvement in soil organic matter, soil total carbon, and nitrogen content, as well as soil nutrient bioavailability. Moreover, the application of organic fertilizer also enhanced the soil biological properties, for instance, the composition and diversity of soil microorganisms. Consequently, the crop yield and nitrogen uptake was increased due to the organic fertilizer application by altering soil physiochemical and biological properties [29]. The absence of the S1 class is caused by low values of rainfall during the growing season.
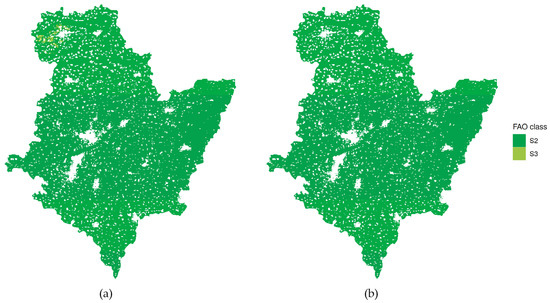
Figure 14.
LS classes and validation after SICS implementation for maize in Hengshui: (a) Conservation Tillage (CT); (b) Cover Crop (CC); Crop Residue Management (CRM); Manure Application (MA).
Based on the current LS, the S2 area covered 64.7% of the total area. All SICS scenarios performed extremely well, moving almost all the S3 areas to S2 (covering 100% of the total area).
In a nutshell, the results concerning the different SICS of agricultural management practices show that in all cases SICS improve LS, because they mostly affect SOC and CEC.
4. Discussion and Implications for Land Management
The current study showed that the proposed methodology can produce LS maps to evaluate SICS scenarios by projecting soil characteristics and LS 100 years in the future. To our knowledge, this is the first use of LSA for evaluation of SICS scenarios. The use of LS maps (both limiting factor maps and SICS performance maps) was crucial to locate the exact areas that have the highest potential for improvement. The spatial information that these maps provide can give insights for better land use management and the selection of the proper SICS in the future for a specific region depending on local conditions. As a result, using the proposed methodology, the evaluation of SICS scenarios can be performed seamlessly using LSA as a tool to achieve high-quality results with reduced bias, instead of the previously common practice of evaluating the performance of scenarios in an empirical manner.
Concerning the determination of weighting factors for each input parameter (via AHP), it must be noted that across CIPs and regions (Flanders, Somogy, and Hengshui), soil and climate received higher weighting values than topography. This means that local experts attributed a less important role to topography in all cases. Comparing soil and climate CIPs, the weights received were similar (equal values for Flanders and Hengshui and a bit higher values for climate in Somogy), meaning that local experts attributed an almost equal role to soil and climate across regions. Regarding the socio-economic factors, it should be noted that relative information was not available for all regions; thus, to maintain a balanced result, this information was not included in the analysis. However, it is recommended to include socio-economic factors when available.
The limiting factor analysis recognized climate (precipitation) as the main limiting factor in all three test sites. As maize is a crop that requires a lot of water during summer, both in Flanders and Somogy precipitation turned out to be the main limiting factor, implying that productivity depends on the availability of water for supplementary irrigation. Investments in irrigation are not always justified for every soil type, whereas soil and water conservation measures are [30]. Climate adaptation through land use changes that include less vulnerable crops can compensate for crop yield loss and lead to utility gains [30].
The prevailing limiting factors in soil CIP were SOC (Somogy, Hengshui, western part of Flanders) and pH in Flanders. Moreover, soil CIP in Flanders had the highest spatial variability for maize, highlighting the usefulness of the proposed approach. Texture affected the northwestern part of Flanders, and CEC the northwestern and southeastern parts of Flanders, while both restricted LS. Within the soil limiting factors, SOC and CEC were the most important (and Texture and CF were less). However, SICS that add organic matter to the soil certainly improve soil conditions. The LSA–SICS analysis showed that an increase in SOC, and especially CRM in Flanders and CT and CC in Somogy, could enhance suitability, contributing to the greenhouse phenomenon.
The prevailing LS class in Flanders and Somogy is the S3 class (marginally suitable), contrary to Hengshui, where most areas were classified as S2 (moderately suitable). Based on the FAO classes identified, the total absence of the S1 class in all regions (and the limited areas classified as S2) indicates that the conditions for cultivating maize in the area can be considered as not optimal, and it is caused by the limiting factors identified in each site. This, however, does not mean that maize should not be cultivated in these sites but that significant resources should be committed to achieve a high yield, or that the highest potential yield may not be harvested.
Comparing results from current LSA and the examined scenarios of the 100-year application of management practices, all three regions showed an improvement in LS by moving several areas classified as S3 into the S2 class (Table 4). Land suitability analysis was used as a tool to evaluate the change in the most suitable areas (namely S2 class areas because S1 class is absent) based on the current LS. For Flanders, MA was the SICS with the highest impact on LS (16.6%), while even the least impactful scenario (CC) doubled the S2 area (12.6%). For Somogy, the best scenario was CC (32.8%), where the S2 areas were almost quadrupled in size. For Hengshui, all SICS led to completely improving LS, maximizing the S2 areas to fully cover all the region. In addition to quantifying the results, LSA maps provide a visual way to locate the areas most affected.
The percentage increase in LS score after the application of the best SICS was estimated for each site through per pixel comparison of the SICS with the current LS (Figure 15). SICS implementation in Flanders provided a mild improvement in maize suitability; the upgrade to the S2 class is small, as climatic conditions have a higher weighing factor and lower scores. CRM in Flanders accounted for the biggest overall increment in maize suitability score. SICS implementation in Somogy had a profound enhancement of LS for maize, as more than 50% of the area moved from S3 to the S2 class. CC as well as CT accounted for the biggest overall increment in maize suitability scores. Class separation was marginal though: less than 10% suitability rise led to 50% of cells upgrading classes. SICS implementation in Hengshui had a significant enhancement of LS for maize. CRM accounted for the biggest overall increment in maize suitability, upgrading at least 1/3 of the area to the S2 class by inducing a score rise no bigger than 12%. In all sites, suitability rise appeared substantial in the areas where organic carbon exhibited the lowest suitability score for maize.
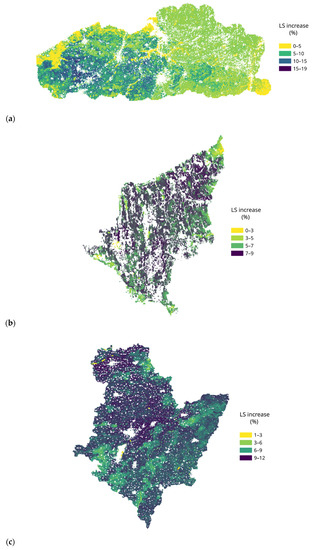
Figure 15.
Percentage increase in LS score after the application of the best SICS per site: Crop Residue Management in Flanders (a), Cover Crop in Somogy (b), and Crop Residue Management in Hengshui (c).
The proposed methodology, by providing future scenarios, proves to be a valuable tool in the hands of national and regional authorities for planning and implementing management measures according to the visions of EU soil strategy, which includes improving soil health, achieving climate neutrality, and becoming resilient to climate change [31]. Moreover, in the frame of the EC Mission Area—Soil Health and Food [32], the ability to evaluate SICS scenarios contributes to mapping the most prominent measures and soil management practices against their potential contribution towards the goals identified. Finally, the method can facilitate the achievement of Land Degradation Neutrality (LDN) targets [33], and especially setting LDN baselines, assessing land degradation trends, and identifying measures addressing the drivers of land degradation.
5. Conclusions
The implementation of the FAO LS analysis managed to model land suitability in the selected regions, producing useful user-friendly maps that provided the spatial information of the SICS performance. In addition, limiting factor maps provided useful insights for better planning of agricultural management practices considering improvement of soil, climate, or topography factors. Moreover, the process of LSA can be applied to different regions with different local and environmental conditions by incorporating local experts’ opinions that are valuable for defining the actual condition for a crop apart from available databases.
Therefore, the main conclusions of the current study are the following:
- The procedure of FAO LSA leads to the production of user-friendly maps that provide spatial information of the suitability performance of possible agricultural management practices.
- Limiting factor maps can facilitate the planning of management practices to ameliorate limiting soil, climate, or topographic characteristics.
- The procedure enables the application to other geographical locations by considering local crops, data, and expertise.
Based on the above analysis, it can be concluded that LSA maps can be used as a tool for evaluating Soil-Improving Cropping Systems as possible scenarios of agricultural management practices by projecting soil characteristics and future LS. The proposed methodology is a novel approach that can evaluate SICS scenarios in order to improve management plans, and it can effectively replace the empirical methods used so far.
Author Contributions
Conceptualization, T.K.A.; methodology, G.B., N.K, A.G. and K.M.; software, N.K. and K.M.; validation, A.G., G.T., T.H., Y.W. and L.L.; writing—original draft preparation, G.B., N.K., A.G., T.M.K. and T.K.A.; all authors participated in writing—review and editing; visualization, N.K.; supervision, T.K.A.; funding acquisition, D.M. All authors have read and agreed to the published version of the manuscript.
Funding
This research was conducted in the frame of “Sino-EU Soil Observatory for intelligent Land Use Management (SIEUSOIL)” project, funded from the European Union’s Research and Innovation Programme, under Grant Agreement No. 818346.
Data Availability Statement
Soil data used were taken from SoilGrids, climate data were acquired from ERA5-Land, TerraClimate and WorldClim 2, while terrain data from the European Digital Elevation Model (EU-DEM) version 1.0 and Shuttle Radar Topography Mission (SRTM).
Conflicts of Interest
The authors declare no conflict of interest.
References
- Altieri, M.A. Agroecology: The science of natural resource management for poor farmers in marginal environments. Agric. Ecosyst. Environ. 2002, 93, 1–24. [Google Scholar] [CrossRef]
- Dumont, B.; Basso, B.; Bodson, B.; Destain, J.-P.; Destain, M.-F. Assessing and modeling economic and environmental impact of wheat nitrogen management in Belgium. Environ. Model. Softw. 2016, 79, 184–196. [Google Scholar] [CrossRef]
- Mdee, A.; Wostry, A.; Coulson, A.; Maro, J. A pathway to inclusive sustainable intensification in agriculture? Assessing evidence on the application of agroecology in Tanzania. Agroecol. Sustain. Food Syst. 2019, 43, 201–227. [Google Scholar] [CrossRef]
- Magdoff, F.; Van Es, H. Building soils for better crops: Ecological management for healthy soils, Sustainable Agriculture Research and Education (SARE) program. In Handbook Series Book 10; USDA: Washington, DC, USA, 2021. [Google Scholar]
- Van De Vreken, P.; Gobin, A.; Baken, S.; Van Holm, L.; Verhasselt, A.; Smolders, E.; Merckx, R. Crop residue management and oxalate-extractable iron and aluminium explain long-term soil organic carbon sequestration and dynamics. Eur. J. Soil Sci. 2016, 67, 332–340. [Google Scholar] [CrossRef]
- Hessel, R.; Wyseure, G.; Panagea, I.S.; Alaoui, A.; Reed, M.S.; Van Delden, H.; Muro, M.; Mills, J.; Oenema, O.; Areal, F. Soil-Improving Cropping Systems for Sustainable and Profitable Farming in Europe. Land 2022, 11, 780. [Google Scholar] [CrossRef]
- Oenema, O.; Heinen, M.; Peipei, Y.; Rietra, R.; Hessel, R. A Review of Soil-Improving Cropping Systems; SoilCare project; EU: Wageningen, The Netherlands, 2017; p. 55. [Google Scholar]
- Bolinder, M.A.; Crotty, F.; Elsen, A.; Frac, M.; Kismányoky, T.; Lipiec, J.; Tits, M.; Tóth, Z.; Kätterer, T. The effect of crop residues, cover crops, manures and nitrogen fertilization on soil organic carbon changes in agroecosystems: A synthesis of reviews. Mitig. Adapt. Strateg. Glob. Change 2020, 25, 929–952. [Google Scholar] [CrossRef]
- Collins, M.G.; Steiner, F.R.; Rushman, M.J. Land-use suitability analysis in the United States: Historical development and promising technological achievements. Environ. Manag. 2001, 28, 611–621. [Google Scholar] [CrossRef]
- Malczewski, J. GIS-based land-use suitability analysis: A critical overview. Prog. Plan. 2004, 62, 3–65. [Google Scholar] [CrossRef]
- FAO. Guidelines: Land Evaluation for Rainfed Agriculture; FAO: Rome, Italy, 1976. [Google Scholar]
- FAO. Land Evaluation: Towards a Revised Framework; Food Agriculture Organization of the United Nations: Rome, Italy, 2007. [Google Scholar]
- Akpoti, K.; Kabo-bah, A.T.; Zwart, S.J. Agricultural land suitability analysis: State-of-the-art and outlooks for integration of climate change analysis. Agric. Syst. 2019, 173, 172–208. [Google Scholar] [CrossRef]
- Mugiyo, H.; Chimonyo, V.G.; Sibanda, M.; Kunz, R.; Masemola, C.R.; Modi, A.T.; Mabhaudhi, T. Evaluation of land suitability methods with reference to neglected and underutilised crop species: A scoping review. Land 2021, 10, 125. [Google Scholar] [CrossRef]
- Gobin, A.; Hien, L.T.T.; Hai, L.T.; Linh, P.H.; Thang, N.N.; Vinh, P.Q. Adaptation to land degradation in Southeast Vietnam. Land 2020, 9, 302. [Google Scholar] [CrossRef]
- Vannoppen, A.; Degerickx, J.; Gobin, A. Evaluating Landscape Attractiveness with Geospatial Data, A Case Study in Flanders, Belgium. Land 2021, 10, 703. [Google Scholar] [CrossRef]
- Bera, S.; Ahmad, M.; Suman, S. Land suitability analysis for agricultural crop using remote sensing and GIS-A case study of Purulia District. IJSRD-Int. J. Sci. Res. Dev. 2017, 5, 999–1024. [Google Scholar]
- Hai, L.T.; Gobin, A.; Hens, L. Risk assessment of desertification for Binh Thuan province, Vietnam. Hum. Ecol. Risk Assess. Int. J. 2013, 19, 1544–1556. [Google Scholar] [CrossRef]
- Hai, L.T.; Gobin, A.; Hens, L. Uncovering causes and effects of desertification using a Leopold matrix in Binh Thuan Province, Vietnam. Chin. J. Popul. Resour. Environ. 2014, 12, 57–67. [Google Scholar] [CrossRef]
- Hai, L.T.; Gobin, A.; Hens, L. Select indicators and prioritize solutions for desertification and drought in Binh Thuan, Vietnam. Chin. J. Popul. Resour. Environ. 2016, 14, 123–132. [Google Scholar] [CrossRef]
- Abd-Elmabod, S.K.; Bakr, N.; Muñoz-Rojas, M.; Pereira, P.; Zhang, Z.; Cerdà, A.; Jordán, A.; Mansour, H.; De la Rosa, D.; Jones, L. Assessment of soil suitability for improvement of soil factors and agricultural management. Sustainability 2019, 11, 1588. [Google Scholar] [CrossRef]
- Vanwindekens, F.; Gobin, A.; Curnel, Y.; Planchon, V. New approach for mapping the vulnerability of agroecosystems based on expert knowledge. Math. Geosci. 2018, 50, 679–696. [Google Scholar] [CrossRef]
- Sys, C.; Van Ranst, E.; Debaveye, J.; Beernaert, F. Land Evaluation. Part III: Crop Requirements; Agricultural Publications No. 7; GADC: Brussels, Belgium, 1993; 191p. [Google Scholar]
- Yen, B.; Pheng, K.; Hoanh, C. LUSET (Land Use Suitability Evaluation Tool): User’s Guide; International Rice Research Institute: Laguna, Philippines, 2006. [Google Scholar]
- Saaty, T. The Analytical Hierarchy Process; McGraw-Hill: New York, NY, USA, 1980. [Google Scholar]
- Aertsens, J.; De Nocker, L.; Gobin, A. Valuing the carbon sequestration potential for European agriculture. Land Use Policy 2013, 31, 584–594. [Google Scholar] [CrossRef]
- Nadeu, E.; Gobin, A.; Fiener, P.; Van Wesemael, B.; Van Oost, K. Modelling the impact of agricultural management on soil carbon stocks at the regional scale: The role of lateral fluxes. Glob. Chang. Biol. 2015, 21, 3181–3192. [Google Scholar] [CrossRef]
- Wu, Z.; Hua, W.; Luo, L.; Tanaka, K. Technical Efficiency of Maize Production and Its Influencing Factors in the World’s Largest Groundwater Drop Funnel Area, China. Agriculture 2022, 12, 649. [Google Scholar] [CrossRef]
- Wang, C.; Ma, H.; Feng, Z.; Yan, Z.; Song, B.; Wang, J.; Zheng, Y.; Hao, W.; Zhang, W.; Yao, M. Integrated organic and inorganic fertilization and reduced irrigation altered prokaryotic microbial community and diversity in different compartments of wheat root zone contributing to improved nitrogen uptake and wheat yield. Sci. Total Environ. 2022, 842, 156952. [Google Scholar] [CrossRef] [PubMed]
- de Frutos Cachorro, J.; Gobin, A.; Buysse, J. Farm-level adaptation to climate change: The case of the Loam region in Belgium. Agric. Syst. 2018, 165, 164–176. [Google Scholar] [CrossRef]
- EC. EU Soil Strategy for 2030—Reaping the Benefits of Healthy Soils for People, Food, Nature and Climate; European Commission: Brussels, Belgium, 2021. [Google Scholar]
- Giuffré, G.; Ricci, A.; Bisoffi, S.; Dönitz, E.; Voglhuber-Slavinsky, A.; Helming, K.; Evgrafova, A.; Ratinger, T.; Robinson, D.A. Mission Area: Soil Health and Food—Foresight on Demand Brief in Support of the Horizon Europe Mission Board, Directorate-General for Research and Innovation; European Commission, Directorate-General for Research and Innovation: Brussels, Belgium, 2021. [Google Scholar]
- UNCCD. Land Degradation Neutrality Target Setting Programme, Land Degradation Neutrality Target Setting—A Technical Guide; UNCCD: Bonn, Germany, 2016. [Google Scholar]
Publisher’s Note: MDPI stays neutral with regard to jurisdictional claims in published maps and institutional affiliations. |
© 2022 by the authors. Licensee MDPI, Basel, Switzerland. This article is an open access article distributed under the terms and conditions of the Creative Commons Attribution (CC BY) license (https://creativecommons.org/licenses/by/4.0/).