Article

Community Structure and Distribution Pattern of Woody Vegetation in Response to Soil properties in Semi-Arid Lowland District Kasur Punjab, Pakistan

1
Department of Botany, University of Okara, Okara 56300, Pakistan
2
Department of Botany, University of Gujrat, Hafiz Hayat Campus, Gujrat 50700, Pakistan
3
Department of Botany, Government College, Women University, Sialkot 51310, Pakistan
4
Department of Zoology, Faculty of Natural Sciences, Shah Abdul Latif University, Khairpur 66111, Pakistan
5
Department of Geography, College of Arabic Language and Social Studies, Qassim University, Buraydah 51452, Saudi Arabia
6
Department of Geography, College of Arts, Princess Nourah Bint Abdulrahman University, Riyadh 11671, Saudi Arabia
7
Geography Department, Faculty of Arts and Humanities, University of Tartous, Tartous P.O. Box 2147, Syria
8
Geography Department, Faculty of Arts and Humanities, Damascus University, Damascus P.O. Box 30621, Syria
9
Geography Department, Faculty of Arts and Humanities, Tishreen University, Lattakia P.O. Box 2237, Syria
*
Author to whom correspondence should be addressed.
Land 2022, 11(12), 2145; https://doi.org/10.3390/land11122145
Submission received: 25 October 2022 / Revised: 25 November 2022 / Accepted: 26 November 2022 / Published: 28 November 2022

Abstract

:
Plant diversity is lower in arid regions around the world. However, semi-arid regions have very high species richness and are notable in terms of vegetation structure and plant diversity. The major goal of this study was to assess the composition and diversity of woody species with respect to edaphic properties in semi-arid lowlands of Kasur, Punjab Pakistan. Comprehensive field surveys were conducted to study the botanical diversity of woody vegetation in Kasur district (Punjab) during 2020–2022. Based on geography and vegetation richness, 120 sampling sites were selected, with each site comprising 05 transects of 500 m2 randomly. Therefore, from each sampling site, 25 quadrats were taken for exploring the biological assortment of woody vegetation. Soil samples were collected at a depth of 9 to 12 cm and placed in a polythene bag. The soil samples were tested for soil pH, EC, OM, macronutrients (N, P, and K), and cation exchange capacity (CEC). A total of 86 woody species belonging to 61 genera and 26 families were documented from diverse habitats of semi-arid lowland of Kasur, Punjab, Pakistan. The leading family was Leguminosae having 13 genera and 21 species, followed by Moraceae, including four genera and nine species, and Bignoniaceae with seven genera and 09 species. Overall, five woody plant communities were renamed by means of the maximum indictor-valued plant species, such as those listed below; 1. EDM: Eucalyptus-Dalbergia-Morus community; 2. PBM: Populus-Bombax-Morus community; 3. ZTZ: Ziziphus-Tamarix- Ziziphus community; 4. PAP: Prosopis-Acacia-Prosopis community, and 5. BCR: Broussonetia-Conocarpus-Ricinus community. The CCA ordination makes it apparent that appropriate edaphic aspects, such as pH, organic matter, N, P, K, soil texture (silt, sand, and clay), and cation exchange capacity (CEC), have a significant influence on how woody species are distributed. The current effort provides a fundamental layout to realize the influences of environmental variables on the arrangement, variety, and relations of woody vegetation, which is useful to improve the conservation and management events for the ecological restoration of degraded habitation in the studied district.

1. Introduction

Crucial information may be achieved from the biological richness of a vegetation pattern for the planning and management of protected areas, which are prerequisite for sustainable use of biodiversity, particularly due to global variations which are especially caused by anthropogenic factors [1,2]. However, in the field of ecology, identifying and understanding the mechanisms underlying these patterns remains a difficult task. In biological diversity, species richness which is an important aspect of vegetation has been formerly used widely in environmental studies [3,4]. Several theories have been tested and planned, particularly the hypothesis concerning the environment and niche conservation to understand the mechanism effecting species richness and vegetation pattern [5,6].
The vegetation, its compositional distinctions and the co-existence of species is effectively represented by the prime environment and ecological variables [7] governing the occurrence of species in any geographical landscape. Vegetation is the aggregation of plant species along with its structure, composition, distribution, and classification in relation to edaphic, climatic, and other several anthropogenic influences [8]. Vegetation is repented by the total plant species in a certain region under its environmental influences [9], with relation to the physiognomic, synthetic, analytical and quantifiable characteristics and is influenced by abiotic and biotic features. The present study was conducted with the aims to explore the ecological features, e.g., habit, life form, leaf size spectra, life cycle, and flowering phenology of wild woody flora. Studying and exploring the biological spectra (life form, leaf size) are helpful measures to comprehend eco-physiological establishment of communities which elaborates the underlying climatic conditions [10].
Woody vegetation [2], especially trees, plays a central role in the effectiveness and sustainability of ecosystems, particularly forest habitats. Because phytodiversity influences the structure, composition, and richness of allied biota, having a high degree of tree species diversity is beneficial for conserving forest ecosystems from catastrophic losses caused by illnesses and pests, as well as ensuring the enhanced functioning of ecosystem services. Although several explorations have been carried out to assess the hypotheses, researchers in the field of ecology remain unsuccessful in finding an agreement about the comparative relation of these hypotheses of species richness patterns [11,12].
Previous studies have shown that plants with varied development patterns (herbs, shrubs, and trees) have a variety of features, ecological adaption, evolutionary degrees, and evolutionary niche conservation. [13]. Furthermore, species with a diversity in size tend to have a different ability for dispersal to adapt to ecological conditions, and they may exhibit distinct responses to their environment. [14]. It can be suggested from the present findings that the results of various measures on the wide range configurations of plant types with varied range size and development patterns could be disparate for distinct life forms. The distinction in the relative impacts of several hypotheses suggested for species abundance patterns through species range in size and growth forms probably one of the most important causes for the hurdle to gain achievement in the prior investigations and it is still in pending evaluation in ecological studies [15]. Despite widespread awareness for the vitality of forest diversity, knowledge on the distribution pattern of tree diversity is still lacking. The district Kasur has a lush, wild, woody, floristic diversity due to varied topography and climate. Previously, only few preliminary research has been undertaken in this semi-arid lowlands of Punjab, Pakistan [16,17]. Therefore, widespread classification along with ordination are valuable tools to understand the local dynamics of species association along with uses, planning and conservation. As conserving trees is so critical, this study was planned to highlight the following objectives: (i) to compile the taxonomic diversity of the wild woody flora of the area; (ii) to comprehend the developing tendencies within applied taxonomic diversity to document taxa, and lastly (iii) to realize whether ecological factors impact the structure, diversity, and associations of species in this region. Due to the economic value of tree species in this region, the findings from the present study will provide sustainable management policies and habitat restoration measures particularly for the local landscape in relation to the rest of the biosphere.

2. Materials and Methods
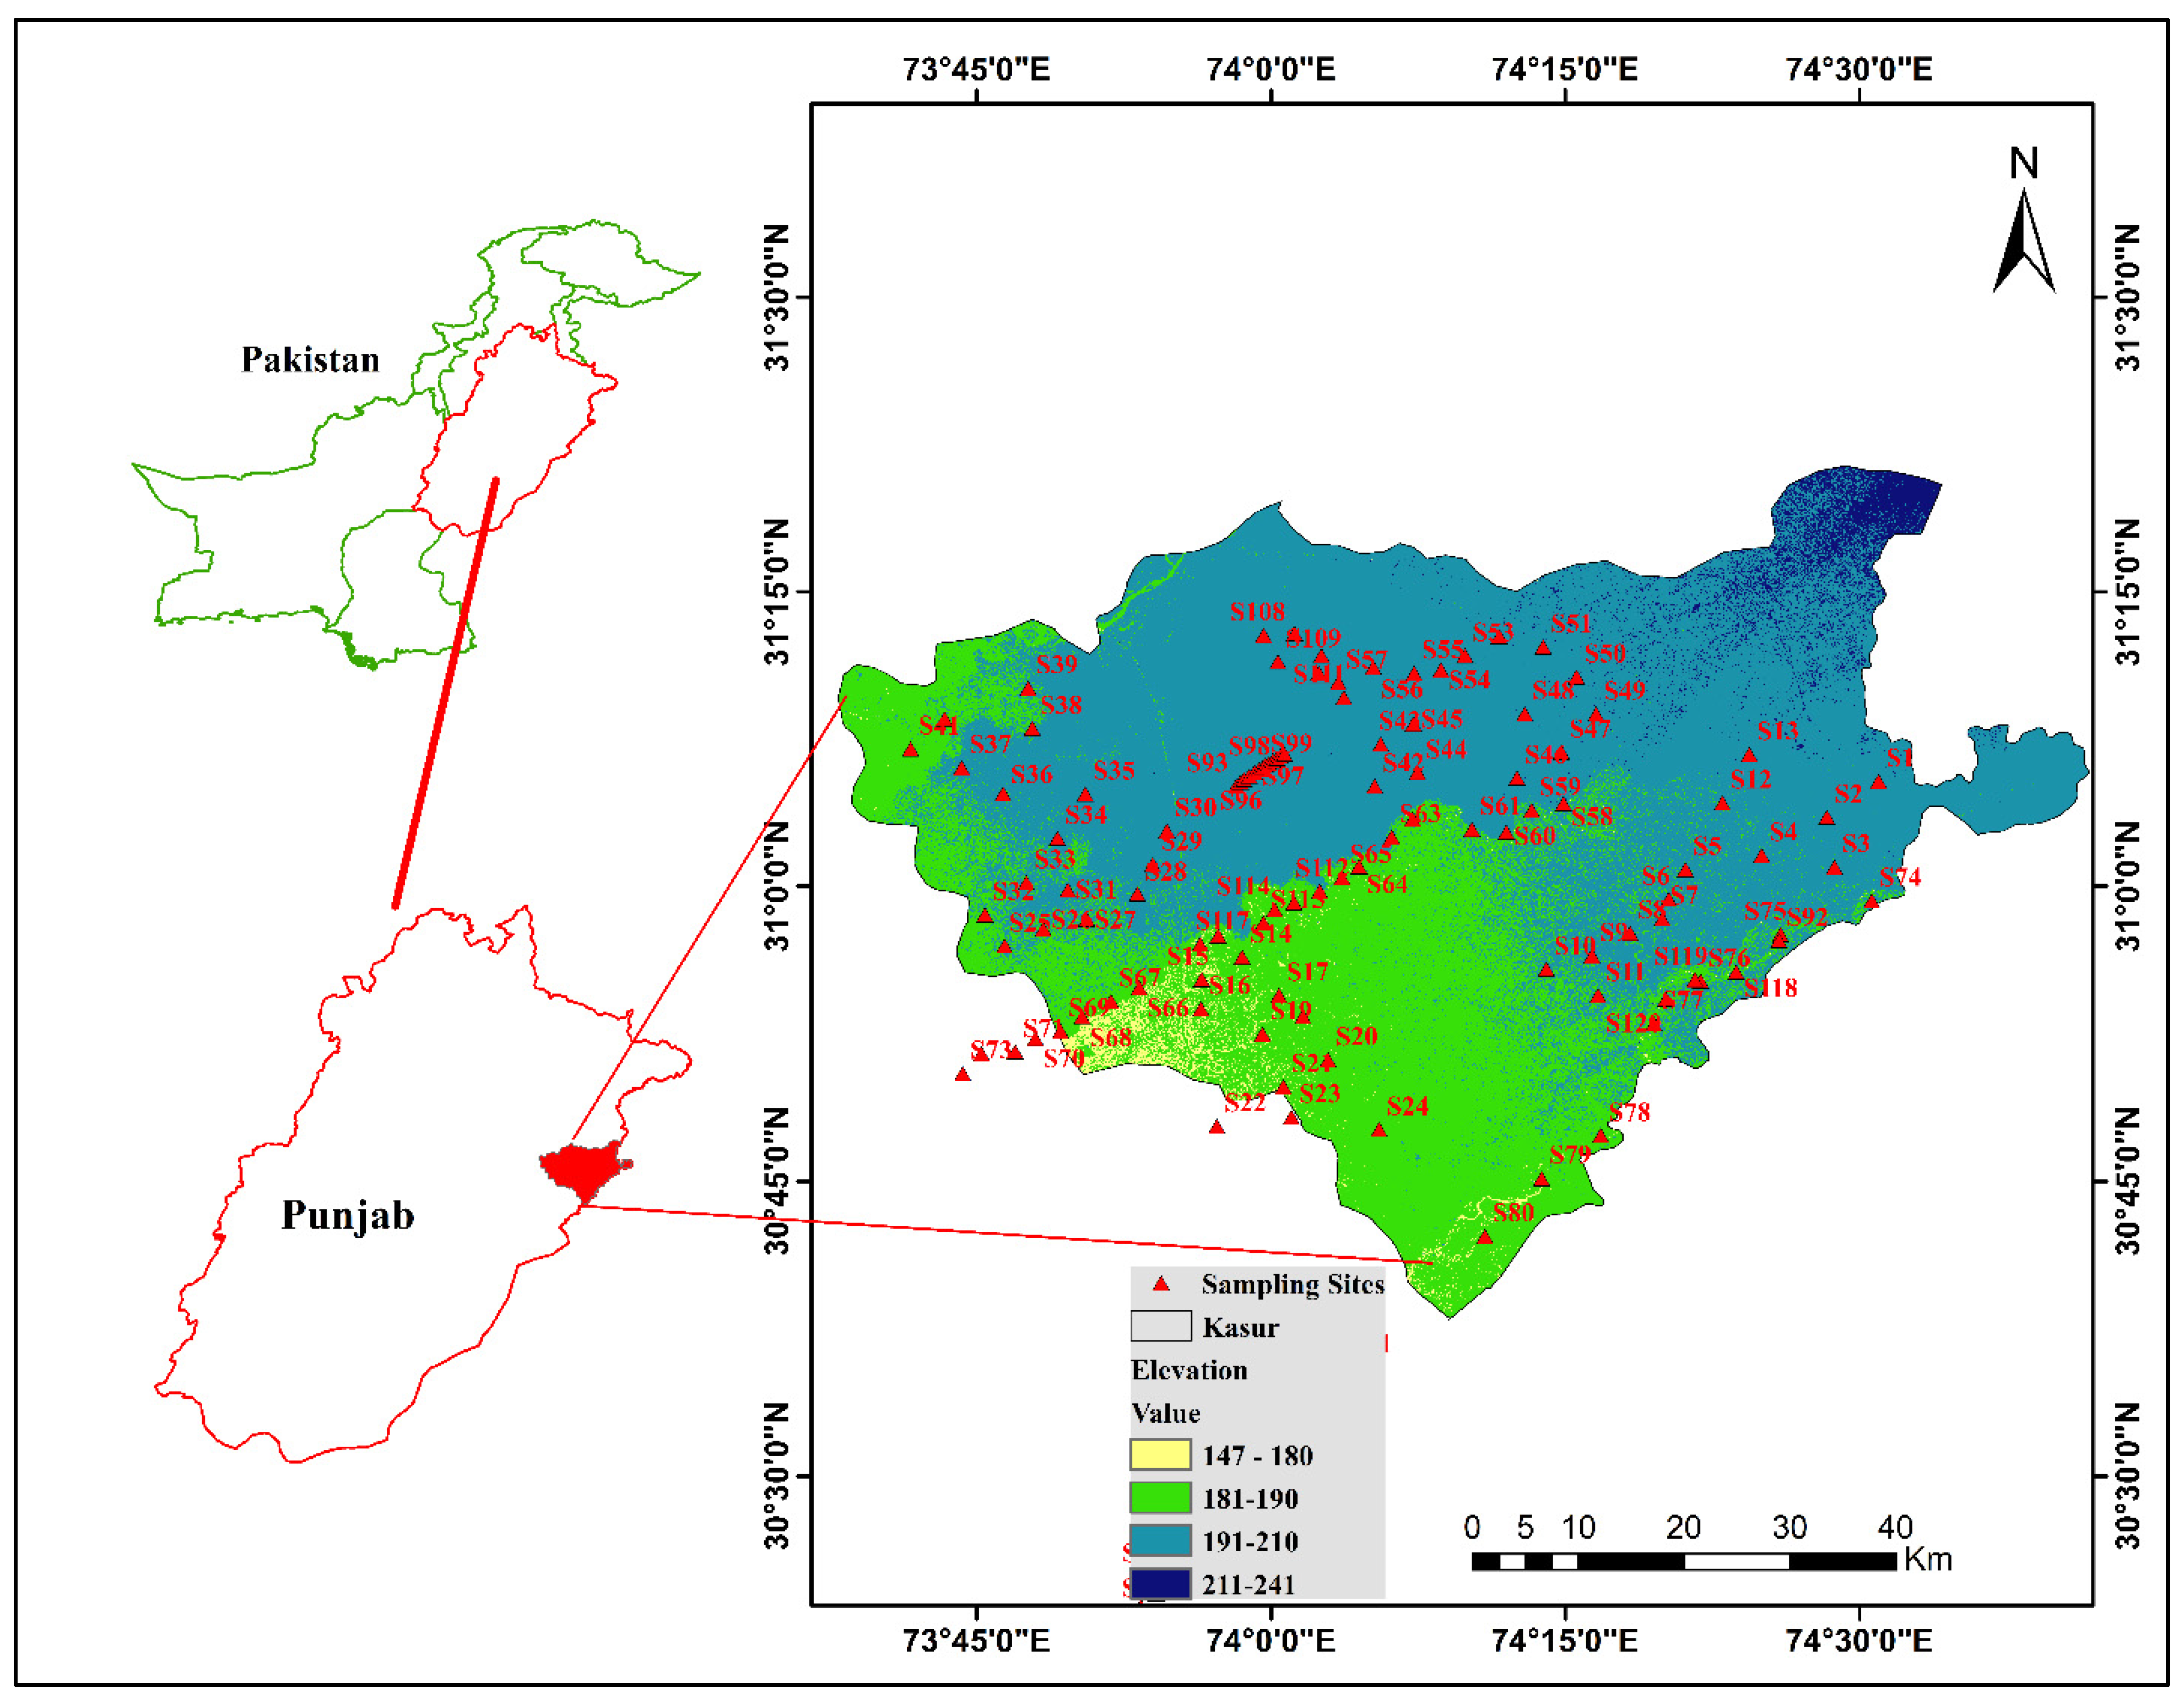
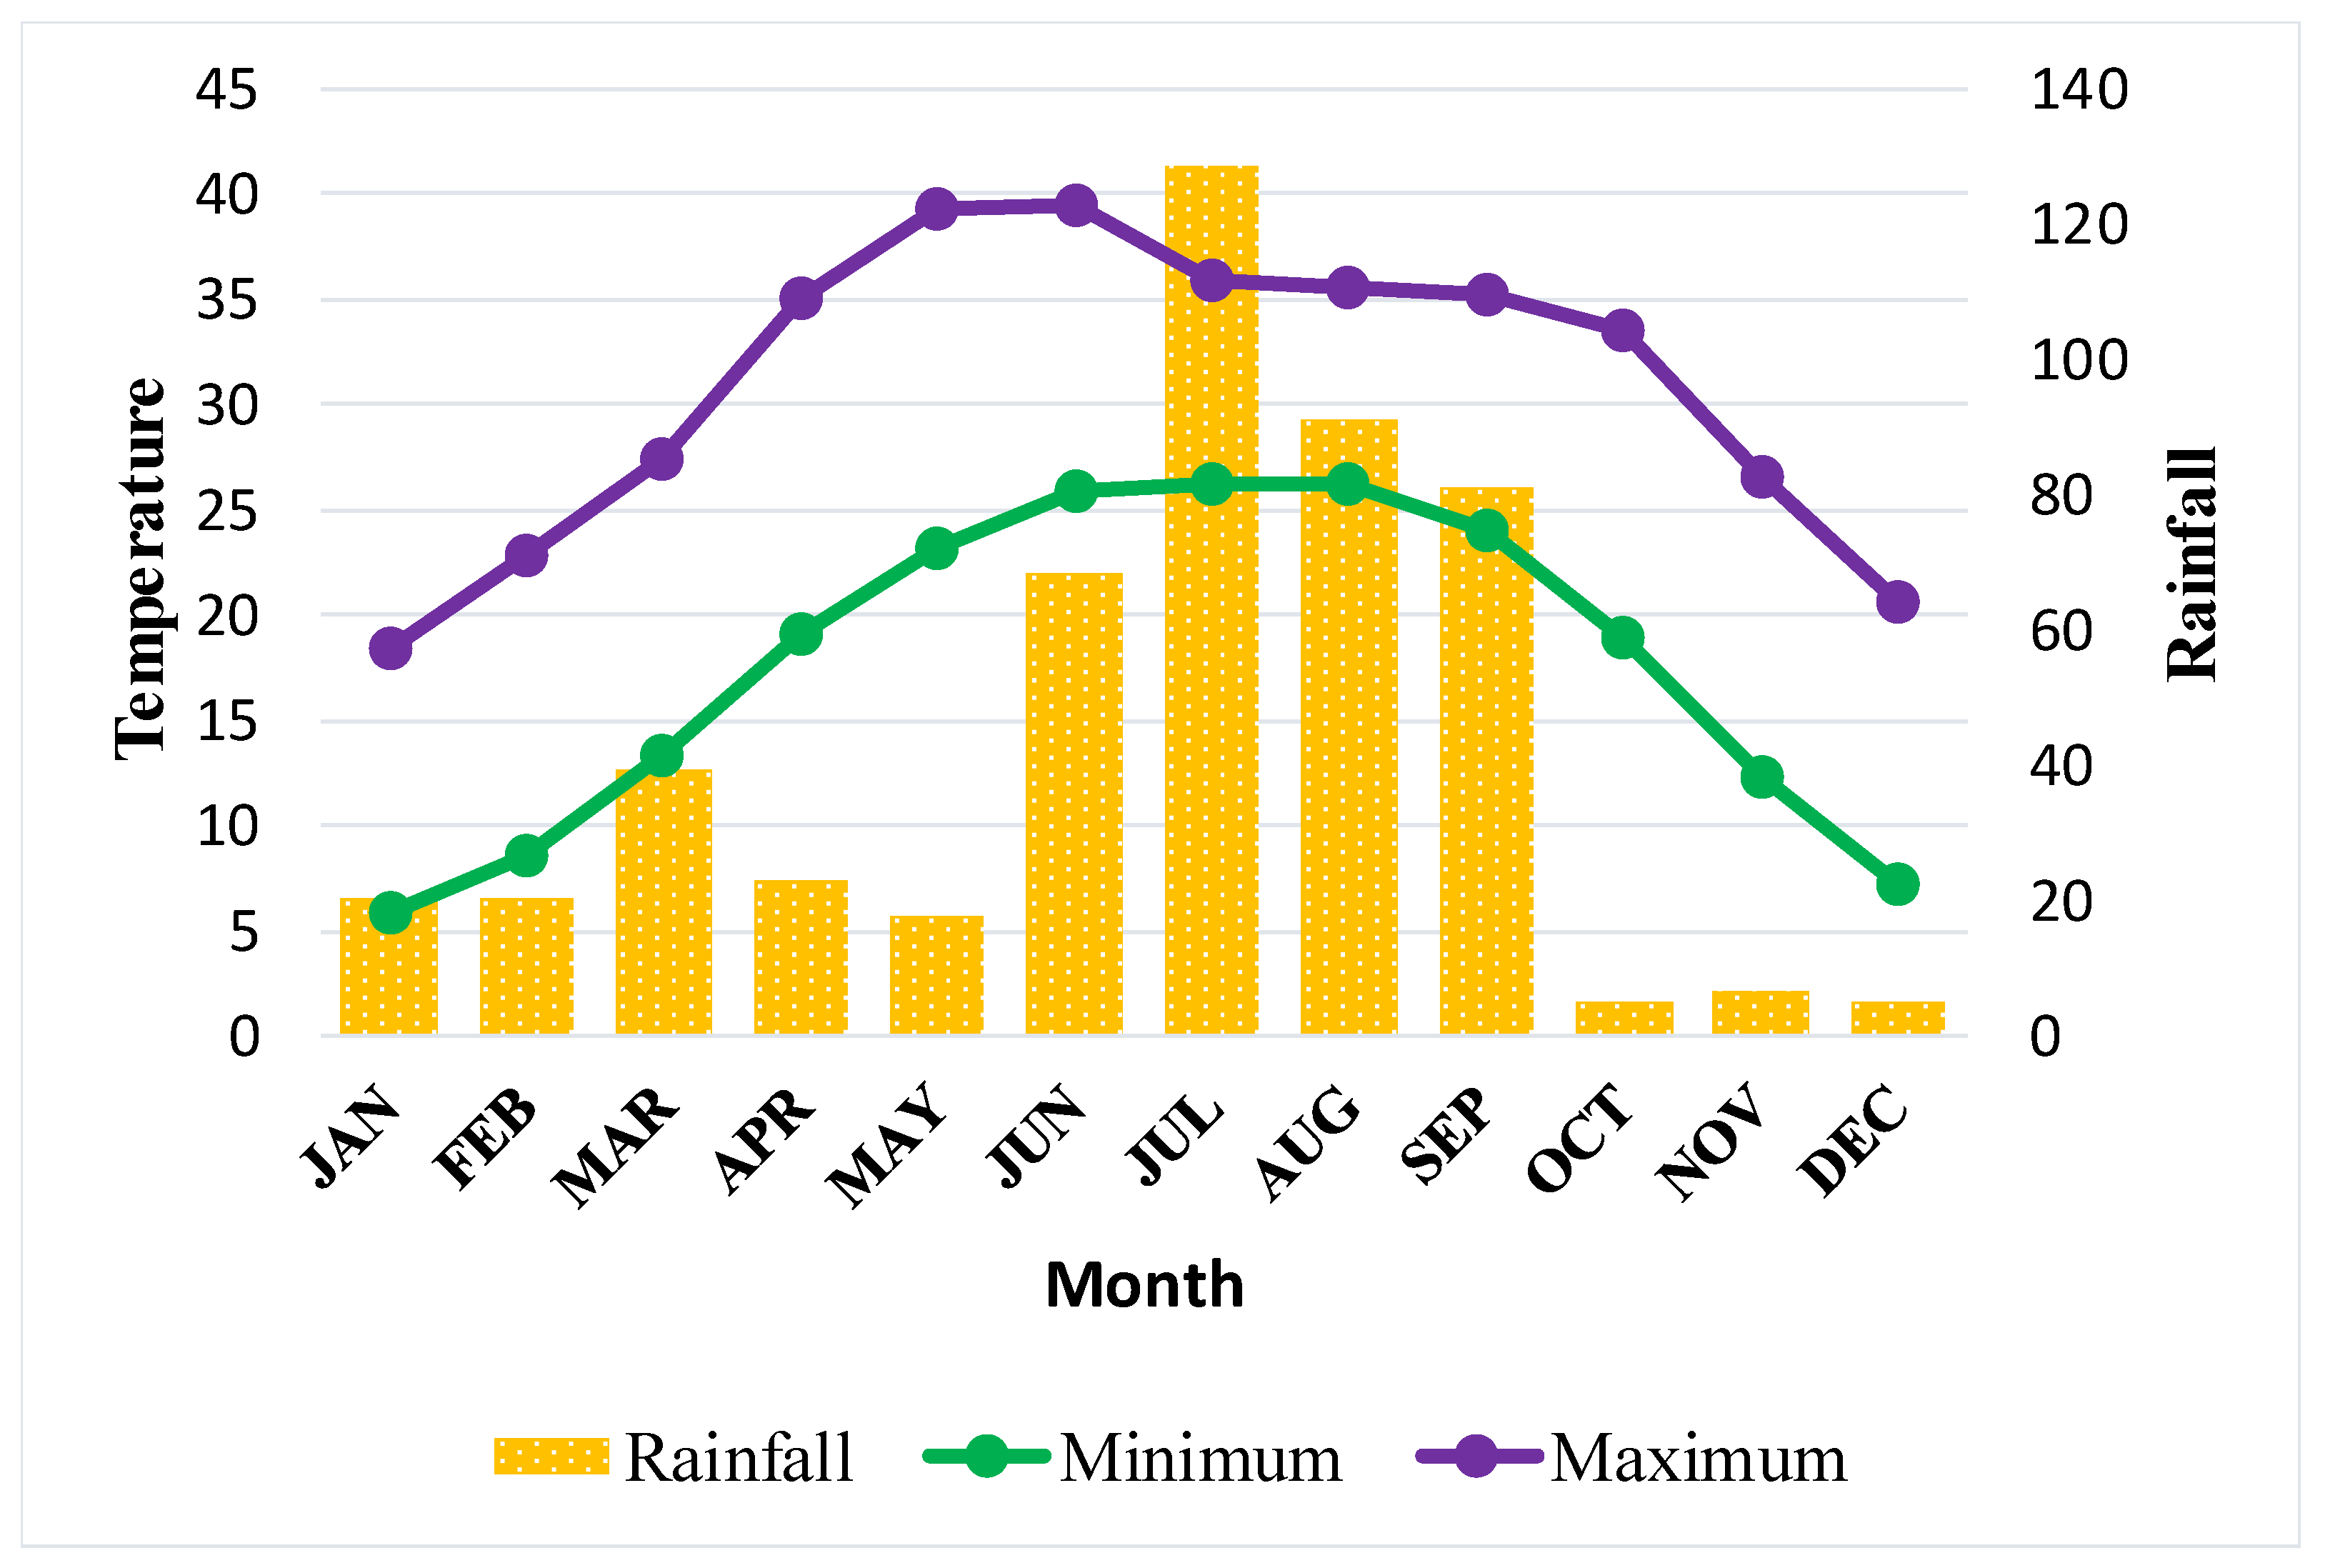
2.1. Study Area

District Kasur is situated 150 to 240 meters above sea level and located southeast of Lahore (31°12′ N and 74°44′ E). The total area of district Kasur is 3995 km2 and is surrounded by River Satluj in the South and Ravi in the North. It is bounded on the north by Lahore district, on the east and south-east by India, on the south-west by Okara district, and on the north-west by Nankana Sahib District Tehsils, namely Kasur, Chunian, Pattoki, and Kot Radha Kishan. Topographically, Kasur district is a semi-arid plain and basin area of Sutlej riverine District Kasur is famous for Changa Manga National Forest, Balloki Headworks, and Ganda Singh Border (Figure 1). The climate of district Kasur is moderate [16]. During summer, the climate is hot, and the temperature rises above 40 °C. The highest temperature was noted during the month of June and the lowest temperature was noted during the month of January. The highest rainfall was recorded during the month of July, more than 120 mm. The winter session extends from December to February. The temperature fluctuates between 20 and 6 °C. The average annual rainfall is 500 mm [17].
The climate data (precipitation, wind speed, humidity, and temperature) of district Kasur were acquired from the Pakistan Metrological Department (PMD) (Figure 2). Floristically, it falls in the Sahara Sindian region and hosts a significant number of plant species. The vegetation includes xerophytic and thermophilic species in the open and arid areas, but riverine belts host several macrophytes. The agricultural lands host weeds and ruderal species, e.g., Ageratum conyzoides, Amaranthus Viridis, Coronopus didymus, Chenopodium album, Convolvulus arvensis, Cypreus rotundus, Cynodon dactylon, Oxalis corniculata, Rumex dentatus, Melilotus parviflora, and Eragrostis poaeoides [17].

2.2. Field Sampling

A detailed field investigation was conducted to investigate the botanical variety of woody vegetation in Kasur district (Punjab) during 2020–2022. During field surveys, samples were collected from the forest, riparian zones, arable land, graveyard, roadside, home gardens, scrubland, sandy places, and canal bank habitats. Based on topography and vegetation richness, 120 sampling sites were selected from different habitats. At each sampling site, 5 transects of 500 m2 in size were placed randomly. From each 500 m2 transect, 5 quadrats of 10 m2 were placed systematically [14]. So, from each sampling site, 25 quadrats were taken for exploring the ecological diversity of woody vegetation. Only woody vegetation was considered in the current study since it is more frequent in semi-arid lowlands. Individual woody plants diameter at breast height DBH ≥ 2.5 cm and height ≥ 2.5 m were measured from each sample plot. In the examined plots, each plant species’ density, frequency, and diameter at breast height (DBH ≥ 2.5 cm) were recorded, and the average values for each of the sample quadrates were computed. A Garmin eTrex Global Positioning System was used to determine the geographic elements of each site, such as altitude, latitude, and longitude (GPS) [14]. Plant specimens were collected during field surveys, pressed, dried, photographed, and eventually mounted as international standard-sized herbarium sheets [18]. Following identification, all samples were cross-referenced with floristic literature using the Flora of Pakistan online (http://www.efloras.org/ accessed on 16 May 2021) [19]. To minimize confusion when identifying species, binomials and family nomenclature were employed after preliminary identification of specimens using the plant list ver. 1.1 (URL: http://www.theplantlist. org/ accessed on 16 May 2021) [18].

2.3. Soil Sampling

The position data for the plots under examination was recorded using a portable Global Positioning Equipment (GPS) system. The geographical distribution of plant groupings is influenced by the physicochemical qualities of the soil [20]. Soil sample was gathered from each sampling location with a level at a depth of 9 to 12 cm and placed in a polythene bag. The samples were thoroughly mixed, then air-dried, and rock, trash, and gravel particles greater than 2 mm in size were removed by sifting the soil samples. The soil samples were tested for soil moisture, pH, electrical conductivity, organic carbon, macronutrients (N, P, and K), and cation exchange capacity (CEC). The electrical conductivity of soil samples was measured using a conductivity meter (Wilson et al., 2012), and the soil texture (clay, sand, and silt) by hydrometer (Koehler et al., 1984), pH was measured using a pH meter [21]. The total nitrogen (N) was determined following the Kjeldahl method [22], and the soil organic carbon (SOC) was determined using the Walkley–Black method [23]. The levels of phosphorus (P) and potassium (K) were calculated [24], and CEC was measured through [25].

2.4. Indicator Species Analysis

The indicator species analysis was carried out to define indicators for each of the ecosystems in the semi-arid lowland region. This provided information regarding species’ fidelity to a specific ecosystem. After determining the Indicator Values of each species using a method, a Monte Carlo Assess was performed to test for statistical significance [26]. During indicator species analysis, the relative abundance of a species in forest, riparian zones, arable land, graveyard, roadside, home gardens, scrubland, sandy places, and canal bank habitats was calculated using the following formula:
R e l a t i v e   a b u n d a n c e   ( R A j k ) = x k j k = 1 g x k j
where RAjk means relative abundance,
Xkj is the abundance of species j in group k,
and g means the total number of groups.
R e l a t i v e   f r e q u e n c y   ( R F k j ) = i = 1 n k b I ˙ j k n k
where RFkj is the relative frequency of plant j in group k,
bijk is the presence or absence of plant j in group k sample I,
and I is the sample unit.
I n d i c a t o r   v a l u e   ( I V K j ) = 100 ( R A × R F )
As a cutoff value for determining indicator species, a threshold level of 25% indication and 95% significance (p ≤ 0.05) was employed. Furthermore, the indicator species with (p ≤ 0.05) value were represented graphically with the help of PAST software (version 4.10).

2.5. Data Analysis

The acquired phytosociological data for plants and environmental conditions were organized and further processed in Microsoft Excel 2016 for subsequent analyses. To identify the biologically significant number of woody communities in the research area, the species abundance data was first analyzed using the Monte Carlo permutation test (ecological distance method: relative Euclidean; linkage method: Ward’s) [27]. An agglomerative hierarchical clustering dendrogram was subsequently created to show how the 120 sampling sites under consideration were grouped. To establish the relative importance of each plant species in the identified woody communities (i.e., the species makeup of each community type). The hierarchical cluster analysis, chord diagram, and ternary plot were prepared using Origin Pro software. PAST software (version 4.10) [28] was used to calculate the diversity indices for each ecosystem. Finally, we calculated the Pearson correlation coefficient between the soil parameters. The data were plotted in a correlogram using the ‘corrplot’ package. CANOCO software (Version 4.5) [29] was applied to perform CCA [18].

3. Results

3.1. Woody Vegetation of Study Area

A total of 86 woody species belonging to 61 genera and 26 families were recorded from different habitats of semi-arid lowland of Punjab, Pakistan. The most leading families were Leguminosae with 21 species (24%), followed by Moraceae and Bignoniaceae with nine species each (10%), Apocynaceae, Combretaceae, Myrtaceae, and Salicaceae, including four species each. The remaining families have either one or two species in each (Figure 3). The number of species recorded from forest habitat was much higher than in the other habitats with 42 species (48.27%) followed by home gardens with 32 species (36.78%), arable land with 29 species (33.33%), roadside with 20 species (22.98%), riparian zones with 19 species (21.83%), canal banks with 15 species (17.24%), graveyards with 13 species (14.94%), scrubland with 12 species (13.79%), and sandy places with 10 species (11.49%) (Table 1). The distribution of woody species in different habitats is depicted in the chord diagram with different colors (Figure 4).

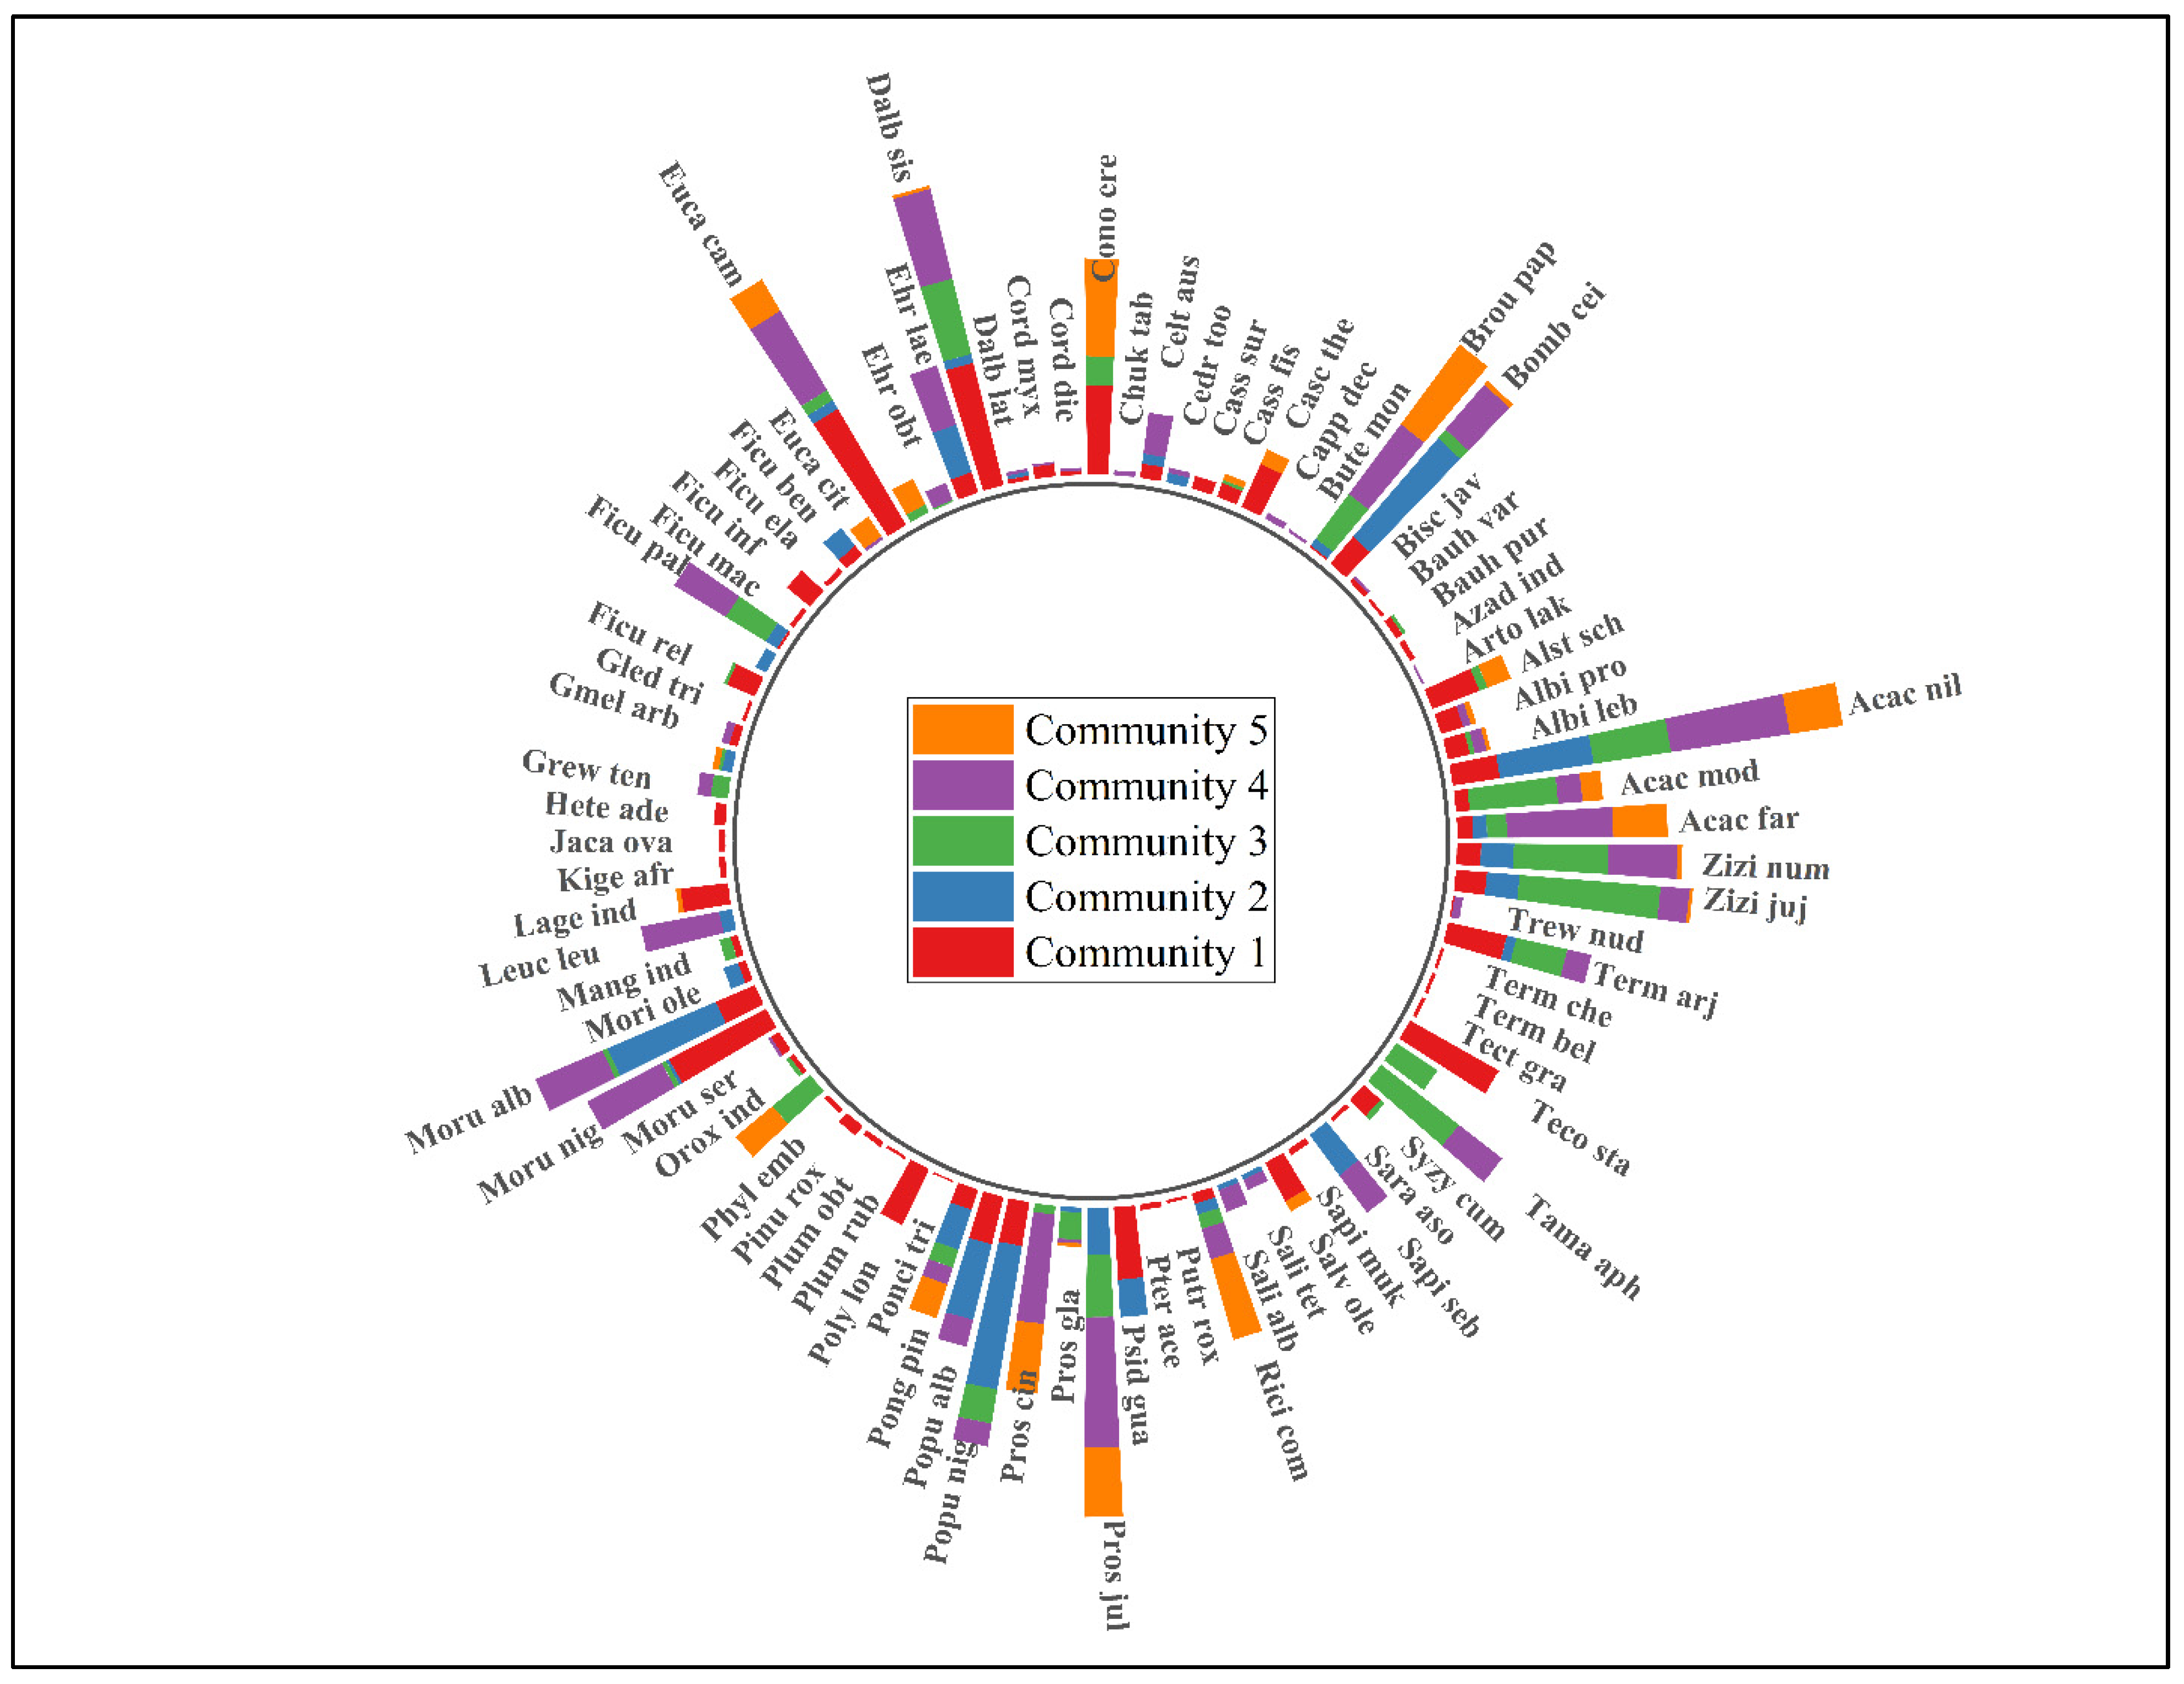
3.2. Classification of Woody Vegetation

Using Ward’s agglomerative clustering method, the 86 woody species recorded from 120 sampling sites from semi-arid lowland were classified into 5 major community types (Table 1). The five woody plant communities were renamed using the highest indictor-valued plant species, such as those listed below; 1. EDM: Eucalyptus-Dalbergia-Morus community; 2. PBM: Populus-Bombax-Morus community; 3. ZTZ: Ziziphus-Tamarix- Ziziphus community; 4. PAP: Prosopis-Acacia-Prosopis community, and 5. BCR: Broussonetia-Conocarpus-Ricinus community.
The grouping pattern and sample size of each plant community is shown in an agglomerative hierarchical clustering tree of the 120 examined woody vegetation samples (Figure 5). The dendrogram tree shows that the closely related vegetation samples (those with the least difference in species composition) clustered together and were represented by the same color coding. Overall, this graph shows that the district Kasur possessed five woody plant communities comprised of different plant species. The results of this study also indicate that the majority of the examined sampling sites (53) belong to community 1, whereas community 3 contains the lowest number of sampling sites (11).
Color Coding: Red = 1. EDM: Eucalyptus-Dalbergia-Morus community;
Yellow = 2.PBM: Populus-Bombax-Morus community;
Purple = 3. ZTZ: Ziziphus-Tamarix- Ziziphus community;
Green = 4. PAP: Prosopis-Acacia-Prosopis community;
Blue = 5. BCR: Broussonetia-Conocarpus-Ricinus community.

3.3. Community 01 (EDM: Eucalyptus-Dalbergia-Morus Community)

This plant community was found in forest, arable land, canal banks, home gardens, and roadside plantations sampling sites. The community comprised of 53 sampling sites and 66 (76.7%) woody species from the study area. The indicator species in this community have significant p-value include Eucalyptus camaldulensis, Dalbergia sisso, and Morus nigra. The other leading species in this community include Terminalia arjuna, Tecoma stans, Psidium guajava, Populus alba, Polyalthia longifolia, Albizia lebbek, Alstonia scholaris, Cascabela thevetia, and Conocarpus erectus. Higher Shannon’s diversity (3.7 ± 0.36), Simpson diversity (0.96 ± 0.29), Margalef’s richness (9.19 ± 1.32), and Pielou’s evenness (0.88 ± 0.03) were recorded in this community.

3.4. Community 02 (PBM: Populus-Bombax-Morus Community)

This plant community was also recorded from arable land, plantations, canal banks, and roadside sampling sites. The community comprised of 18 sampling sites and 31 (36%) woody species from the semi-arid lowland district Kasur Punjab, Pakistan. The indicator species in this community with significant p-value include Populus nigra, Bombax ceiba, and Morus alba. The other leading species in this community include Acacia nilotica, Broussonetia papyrifera, Dalbergia sisso, Ehretia laevis, Populus alba, Prosopis juliflora, Terminalia. arjuna, Sapium sebiferum, Prosopis juliflora, Pongamia pinnata, and Acacia farnesiana. Higher Shannon’s diversity (3.04 ± 0.33), Simpson diversity (0.94 ± 0.23), Margalef’s richness (4.43 ± 1.13), and Pielou’s evenness (0.77 ± 0.02) were recorded in this community.

3.5. Community 03 (ZTZ: Ziziphus-Tamarix- Ziziphus Community)

This woody community was recorded from riparian zones and sandy places sampling sites. The community comprised of 11 sampling sites and 34 (40.69%) woody species from the semi-arid lowland district Kasur Punjab, Pakistan. The indicator species in this community with significant p-value include Ziziphus jujuba, Tamarix aphylla, and Ziziphus nummularia. The other leading species in this community include Tamarix dioica, Prosopis juliflora, Parkinsonia aculeata, Ficus palmata, Dalbergia sisso, Broussonetia papyrifera, Acacia modesta, Acacia nilotica, Grewia tenax, Prosopis glandulosa, and Prosopis cineraria. Higher Shannon’s diversity (3.08 ± 0.24), Simpson diversity (0.94 ± 0.24), Margalef’s richness (5.14 ± 1.21), and Pielou’s evenness (0.84 ± 0.03) were recorded in this community.

3.6. Community 04 (PAP: Prosopis-Acacia-Prosopis Community)

The sampling sites of this community mainly comprised of scrubland, dry places, and along the roadsides. The community comprised of 17 sampling sites and 44 (51.16%) woody species from the semi-arid lowland district Kasur Punjab, Pakistan. The indicator species in this community with significant p-value include Prosopis juliflora, Acacia nilotica, and Prosopis cineraria. The other notable species in this community include Acacia farnesiana, Broussonetia papyrifera, Celtis australis, Ehretia laevis, Eucalyptus camaldulensis, Ficus palmata, Leucaena leucocephala, Sapium sebiferum, Tamarix aphylla, Ziziphus nummularia, and Ricinus communis. Higher Shannon’s diversity (3.36 ± 0.15), Simpson diversity (0.95 ± 0.31), Margalef’s richness (6.09 ± 1.31), and Pielou’s evenness (0.886 ± 0.02) were recorded in this community.

3.7. Community 05 (BCR: Broussonetia-Conocarpus-Ricinus Community)

The sampling sites of this community mainly comprised of scrubland, home gardens, arable land, and along the roadsides. The community comprised of 21 sampling sites and 26 (30.23%) woody species from the semi-arid lowland district Kasur Punjab, Pakistan. The indicator species in this community with significant p-value include Broussonetia papyrifera, Conocarpus erectus, and Ricinus communis. The other notable species in this community include Alstonia scholaris, Erythrina suberosa, Eucalyptus camaldulensis, Parkinsonia aculeata, Salvadora oleoides, Prosopis juliflora, Pongamia pinnata, Acacia farnesiana, Cascabela thevetia, and Acacia modesta. Higher Shannon’s diversity (2.83 ± 0.13), Simpson diversity (0.92 ± 0.18), Margalef’s richness (3.98 ± 1.12), and Pielou’s evenness (0.72 ± 0.01) were recorded in this community.

3.8. Community 05 (BCR: Broussonetia-Conocarpus-Ricinus Community)

The importance value of all recorded woody species is depicted in Figure 6. The species Acacia nilotica, Dalbergia sisso, Broussonetia papyrifera, Bombax ceiba, Eucalyptus camaldulensis, and Ziziphus nummularia were the most frequent species in semi-arid lowland recorded from all five community types with different IV values (Figure 6).

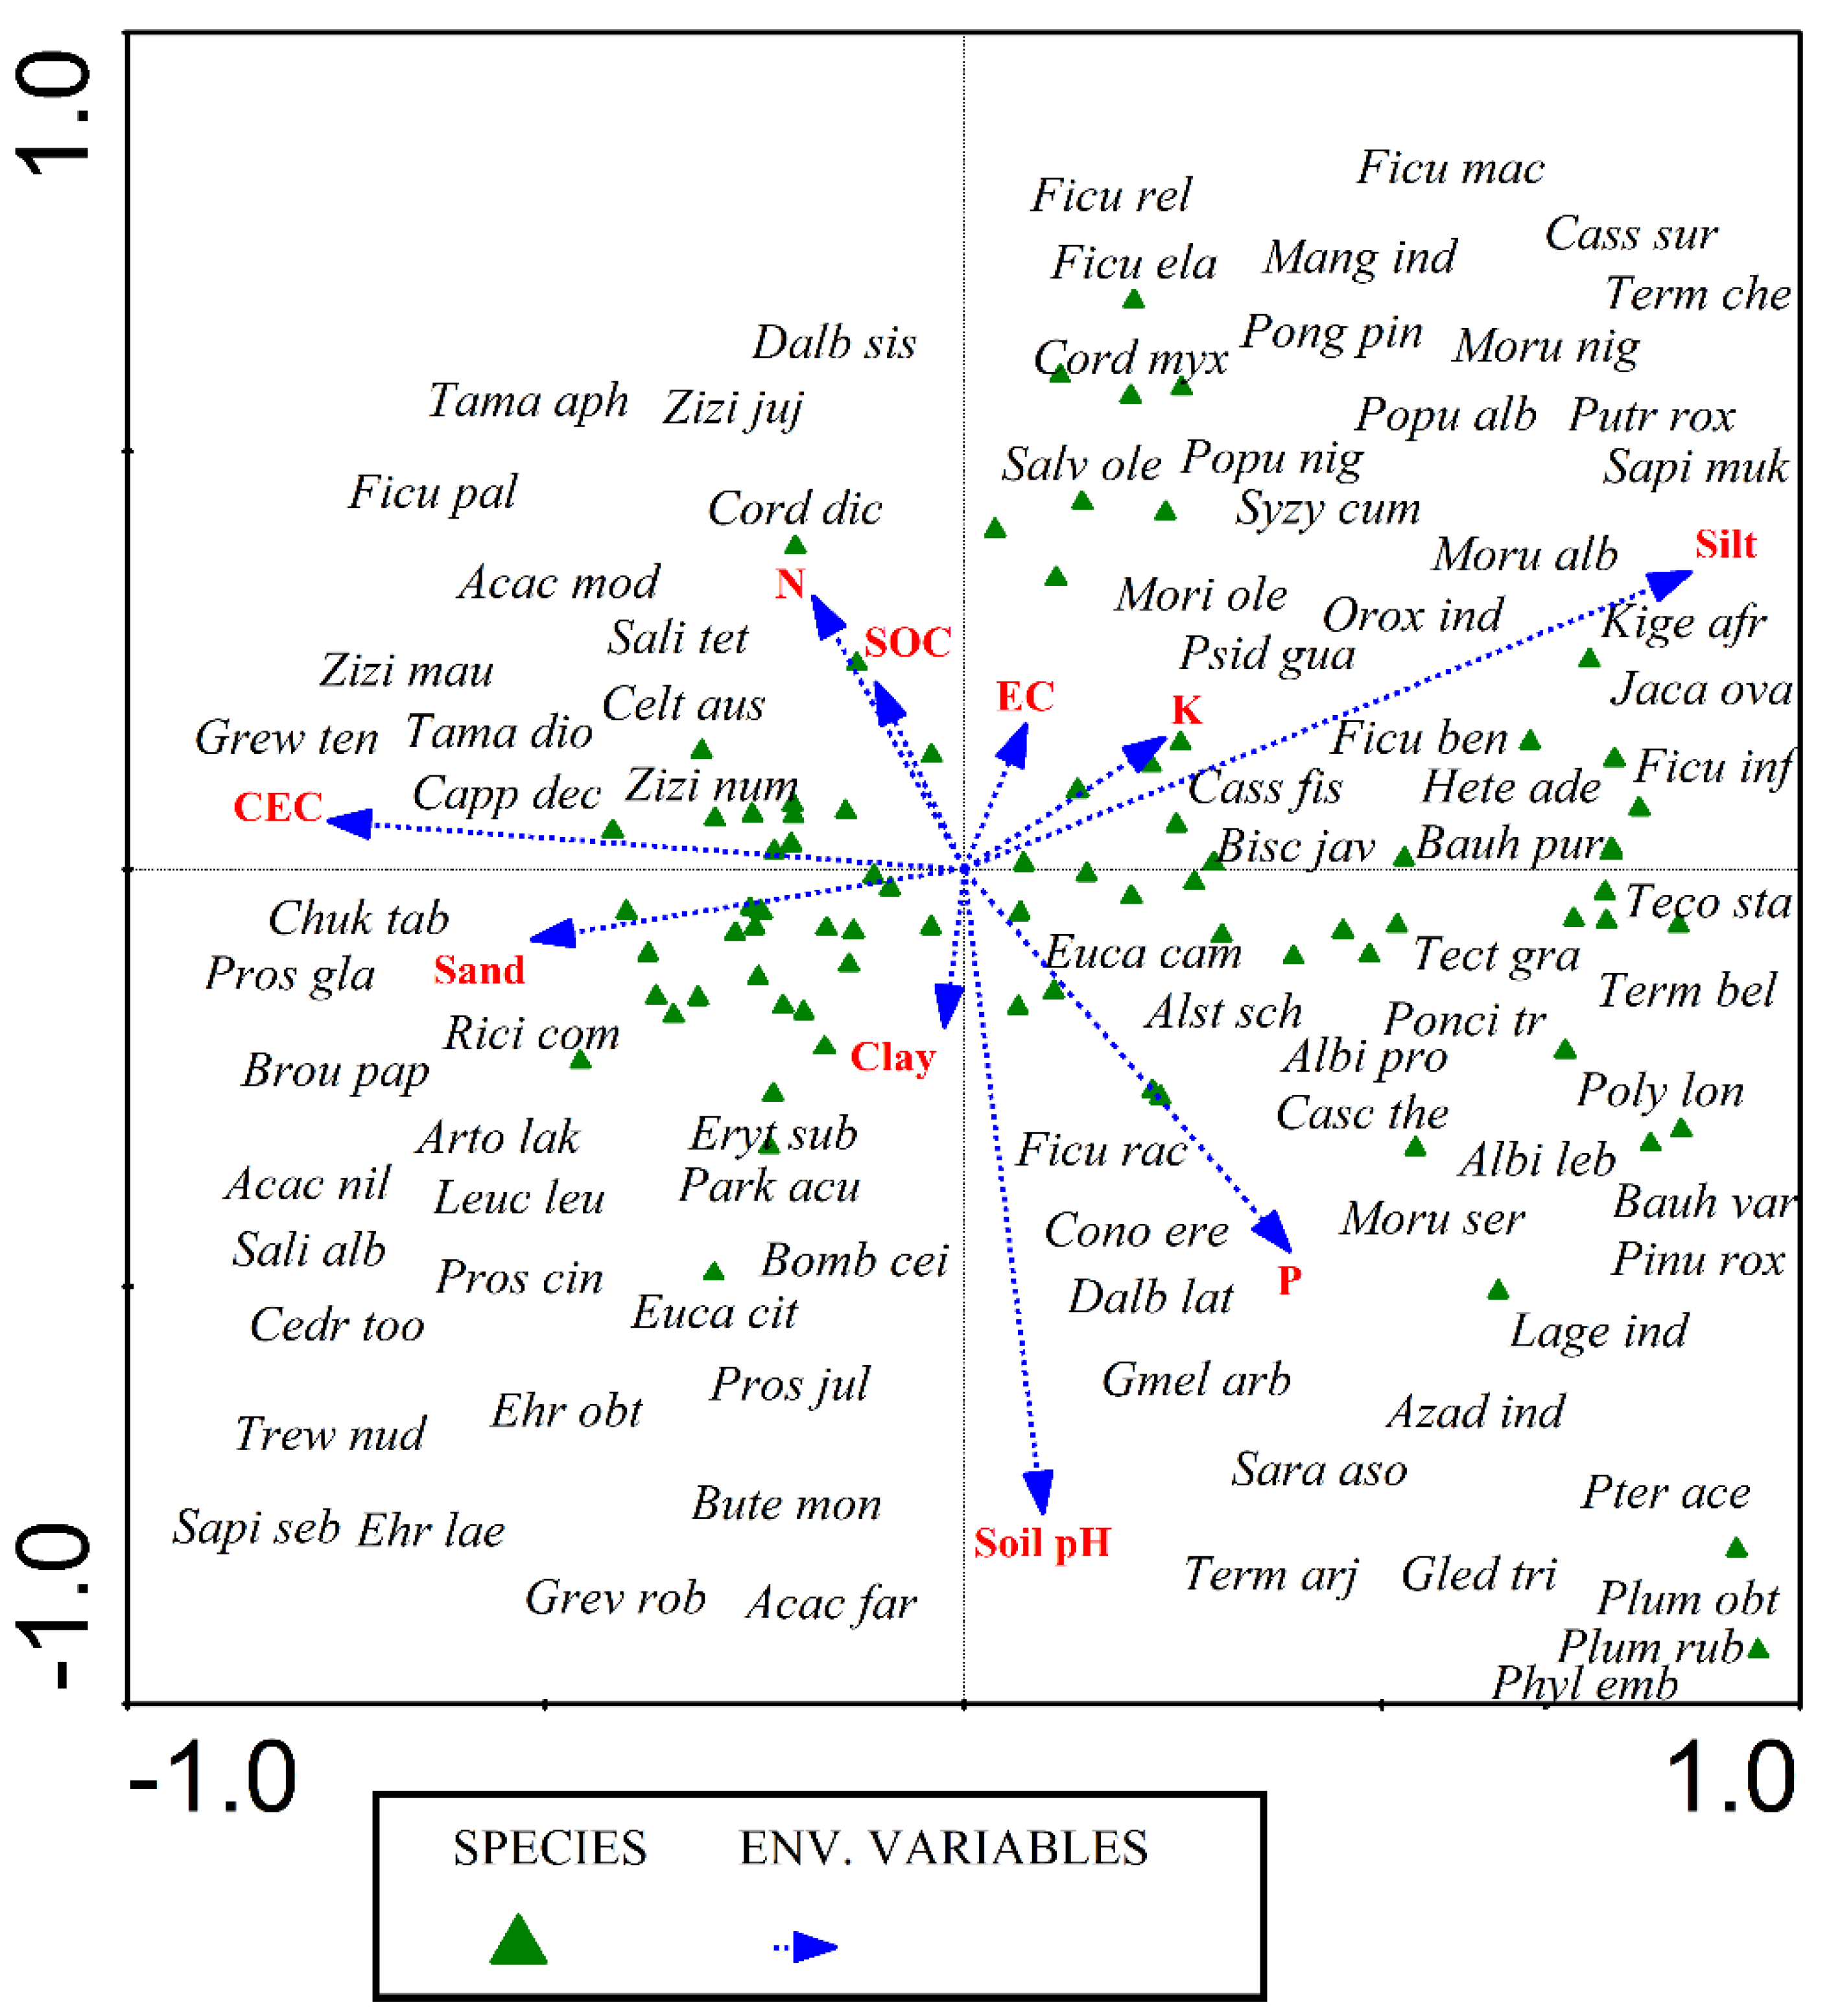
3.9. Role of Soil Properties on Distribution of Woody Vegetation

The CCA ordination makes it evident that applicable edaphic factors, such as pH, moisture, organic matter, N, P, K, soil texture (silt, sand, and clay), and cation exchange capacity (CEC), have a significant impact on how woody species are distributed. Each triangle represented a distinct species of woody vegetation, with the distance between them showing how similar they are to one another. The species in the first quadrat were under the influence of silt, potassium (K), and electrical conductance (EC), while the species in second quadrat were influenced by soil organic carbon (SOC), cation exchange capacity (CEC), and nitrogen (N). The distribution of woody species in third quadrat was impacted by sand, clay, and moisture. The distribution of woody species found in fourth quadrat of CCA diagram was controlled by soil pH and phosphorus concentration in soil (Figure 7). The first axis identified 6.3 variations, the second, 9.7, and the third and fourth, 12.4–14.8 of the total variation, indicating that soil pH, soil moisture, sand, clay, and phosphorus have a strong relationship with the third and fourth axes and have a significant impact on the diversity patterns of wild grass species (Table 2).
The woody species that are sensitive to pH and phosphorus (P) include Albizia procera, Alstonia scholaris, Bischofia javanica, Cascabela thevetia, Albizia lebbek, Gleditsia triacanthos, Plumeria obtusa, Plumeria rubra, Phyllanthus emblica, Lagerstroemia indica, Gmelina arborea, Conocarpus erectus, Tecoma stans, Saraca asoca, Tectona grandis, and Polyalthia longifolia. Soil moisture and soil texture (sand and clay) also have an impact of distribution of grasses. However, the woody species that are positively associated with their values comprise Acacia farnesiana, Bombax ceiba, Prosopis cineraria, Butea monosperma, Erythrina suberosa, Ehretia laevis, Acacia nilotica, Prosopis cineraria, Sapium sebiferum, Cedrela toona, Eucalyptus citriodora, Leucaena leucocephala, Parkinsonia aculeate, Broussonetia papyrifera, Grevillea robusta, Prosopis glandulosa, Chukrasia tabularis, Ehretia obtusifolia, Trewia nudiflora, and Salix alba. The species impacted by nitrogen (N), soil organic carbon (SOC), and cation exchange capacity (CEC) include Dalbergia sisso, Ziziphus jujuba, Ziziphus nummularia, Acacia modesta, Celtis australis, Salix tetrasperma, Tamarix aphylla, Tamarix dioica, Cordia dichotoma, Capparis decidua, and Grewia tenax. The species that were sensitive to electrical conductance (EC), potassium (K), and silt include Bauhinia purpurea, Heterophragma, Ficus elastica, Ficus infectoria, Ficus religiosaMangifera indica, Putranjiva roxburghii, Cordia myxa, Ficus macrophylla, Salvadora oleoides, Syzygium cumini, Kigelia africana, Cassia surattensis, Morus alba, Morus nigra, Cassia fistula, Pongamia pinnata, and Terminalia chebula (Figure 7).
Silt, sand, and clay were significantly associated with woody community distribution and the relationship between EDM, PBM, ZTZ, PAP, and BCR woody communities was shown in a ternary with the aforementioned three edaphic factors (Figure 8). According to the soil composition based on these three variables, it was also possible to clearly see a clustering in the woody communities. EDM-community was hosted by soil having sandy texture and PAP-community hosted by soil having silty texture. The other three communities (PBM, BCR, and ZTZ) were hosted by soil having equal percentages of silt, sand, and clay (Figure 8).

3.10. Correlation of Soil Factors

The interrelationship between several soil factors was calculated using Pearson correlation. Silt is positively correlated with potassium (K), soil organic carbon (SOC) and clay are positively correlated with nitrogen (N), and clay is also positively correlated with the cation exchange capacity (CEC) of soil. Sand and silts are negatively correlated with cation exchange capacity (CEC) (Figure 9).

4. Discussion

Our findings emphasize the significance of the semi-arid lowlands of Punjab, Pakistan for the conservation of native flora in diverse landscapes. Our findings are critical for the development and application of management techniques in rural environments to enhance biodiversity protection without halting livestock production. The field survey results showed that study region has a high species diversity. The current study identified 86 woody species belonging to 61 genera and 26 families from diverse habitats of semi-arid lowland of Kasur, Punjab, Pakistan. The most leading families were Leguminosae with 21 species. Healso reported Leguminosae as dominant family in Margalla Foothills Pakistan [30]. The other leading families were Moraceae and Bignoniaceae which are well-known in the tropics for their diversity, variety, and abundance [16]. Home gardens host a higher number of species as compared to scrublands, canal banks, roadside, graveyard, arable land, and riparian zones. Several woody species that were either rare or non-existent in the other habitats were found in the home gardens. Tolera et al. also reported higher diversity of woody species from south-central highlands of Ethopia [31]. Some of these species included exotic trees, e.g., Eucalyptus spp. and Broussonetia papyrifera, and fruit trees, e.g., Syzygium cumini and Mangifera indica, all of which are economically or nutritionally important to farmers. The majority of the species found in the home gardens, on the other hand, were indigenous tree species brought from either other areas or other countries.
Various types of analysis have been utilized in the current ecological inquiry to quantify the recorded data of all species and stands in relation to geographic and environmental gradients. Plant community structure and distribution patterns in Himalayan forests are poorly understood. The results presented in this study clearly explain the distribution pattern of woody species composition in these microhabitats using the quantitative classification method (Ward’s method) and the ordination approach (CCA). Five woody plant communities were found in the semi-arid lowlands of Pakistan based on the results of the hierarchical cluster analysis. The three community types (EDM, PBM, and BCR) were distributed in forest, roadside, arable land, home garden, and canal banks microhabitat. The floristic composition of the recognized five woody communities distinguishes them. This could be due to changes in environmental conditions. According to [14,32,33], the variation in species composition within plant communities is most likely caused by environmental conditions. Nonetheless, species diversity and richness varied between plant habitats. For example, the EDM-community has the highest species richness and diversity. The BCR-community, on the other hand, has the lowest species richness and diversity among the other community types. The great species variety and richness of EDM-community may be attributed to the community’s largest microhabitat ranges. Furthermore, the BCR-community is the most troubled community due to settlement, agricultural growth, animal overgrazing, and land degradation.
In different aspects, as mentioned in this study, consistent to our hypothesis, shrubby vegetation had higher specialization than tree vegetation [34]. In other words, shrubs had high precise preferences as that of trees in various aspects. Broadly tree species distribution was chiefly affected by climatic conditions like temperature and rainfall. As shrubs are shallow feeders as that of tress, so are vulnerable to native ecological factors such as soil and precipitation. In spite of topography and soil features (physical and chemical), canopy cover also affects shrubs. Hence, shrubs largely displayed more specific distribution preferences than trees in different aspects of the forest ecosystem [35,36].
Understanding the communities of woody species in a particular environment depends on the interaction between plant communities, soil characteristics, and topography [20,37]. Our findings indicate that the distribution of woody plant species within the identified communities is significantly influenced by the spatial diversity in soil properties and topography across the semi-arid lowlands Punjab Pakistan. The main indicator species were Dalbergia sisso, Eucalyptus camaldulensis, Populus alba, Prosopis cineraria, Prosopis juliflora, Ricinus communis, Tamarix dioica, and Ziziphus nummularia. A similar pattern of woody species was recorded from another arid region of Pakistan [14,20,27,38]. In the studied region, the distribution of woody communities reflects the impact of soil characteristics. Although certain community types overlap, soil texture was shown to be the main environmental variable that explained variations in plant species distribution and patterns of plant community development. Other researchers in Pakistan have also found that soil texture is the most important soil variable in determining vegetation composition [26,27,39]. Furthermore, potassium (K) is significant in identifying the ecological groupings and species richness in the current study since it regulates photosynthesis, carbohydrate transport, protein synthesis, and other physiological functions [40]. The indicator species positively associated with potassium (K) include M. alba, M. nigra, and P. alba. Ahmad et al. also reported P. alba and M. alba as indicator species in marble polluted ecosystem of Pakistan [41].
In the arid tropical regions, ecological studies, in particular vegetation analysis, are crucial to understanding the actual picture of species compositional variations and their underlying environmental drivers throughout both time and geographic scales [42,43]. Documenting changes in species abundance over various environmental gradients can aid in determining the value of the various predictors [27,44]. In many biological processes, nitrogen is a crucial nutrient, and it is also the primary driver of plant development. It also has a significant impact on the fauna and flora of the soil, which can either increase the availability of nutrients to plants or bind them in biological processes and growth, leading to temporary deficits in plants. The leaching of nitrogen occurs as well, especially in well-drained soils [45,46]. The key soil components that have an impact on the distribution of the ZTZ-community were nitrogen and soil organic carbon (SOC). The indicator species positively associated with nitrogen and soil organic carbon include Z. jujube, Z. nummularia, D. sisso, and T. aphylla.
Anthropogenic impacts [47,48] upon the spreading of the invading species in distinct surroundings can be described by the physical shape of the landscape. For example, those landscapes that are moderate in advance nations have been revealed to have better plant diversity due to a more heterogeneous landscape [49,50]. There are several zones that have scarce habitat niches for supporting the diversity and abundance to other regions. Our findings are consistent with these observations with richness of targeted species and overall abundance significantly less in the urban sector. The physical features of the landscape elucidate part of the observed patterns. Other potentially key factors are dispersal mechanism, introduction histories, and current along with past human uses and preferences. The rest of this section discusses plausible descriptions for the spatial pattern of occurrence and abundance of the species found in this study.

5. Conclusions

This study found that the district of Kasur in semi-arid lowland Pakistan supports a total of five woody vegetative communities that are notably different from one another. This exhaustive first-ever survey reports 86 woody plants, illustrating a highly diversified, semi-arid tropical region. The five woody plant communities were identified using the indicator species analysis, such as; 1. EDM: Eucalyptus-Dalbergia-Morus community; 2. PBM: Populus-Bombax-Morus community; 3. ZTZ: Ziziphus-Tamarix- Ziziphus community; 4. PAP: Prosopis-Acacia-Prosopis community, and 5. BCR: Broussonetia-Conocarpus-Ricinus community. Numerous environmental factors play a key role in regulating the species distribution in the studied area. The most important factors are the soil pH, soil moisture, sand, clay, and phosphorus. The mapping of species diversity was performed, and the data can be utilized to identify conservation hotspots. Overall, this study found that a range of variables are impairing the ecosystem’s ability to function normally in this Pakistani part of the semi-arid tropics. Based on the findings of this study, soil and vegetation assessment analysis may be helpful in determining the most appropriate habitat manipulation techniques, such as planting, top-soiling, and irrigation techniques for the rehabilitation of degraded lands in the semi-arid region. To preserve this priceless local biodiversity and avert the potential extinction of the rare plant species, sustainable resource management and the implementation of conservation programs are necessary.

Author Contributions

Conceptualization, M.W. and M.M.; methodology, M.W. and M.M.; software, M.W. and M.M.; validation, F.A., S.F. and R.A..; formal analysis, M.W. and M.M.; investigation, M.W., N.M. and M.M.; resources, M.M. and W.M.M.; data curation, M.W. and W.M.M.; writing—original draft preparation, M.W., N.M. and F.A.; writing—review and editing, M.M., A.A.A.D., H.G.A., H.A. and M.A.-M.; visualization, F.A., H.A., S.F., W.M.M., H.G.A. and R.A.; supervision, F.A.; project administration, M.M.; funding acquisition, M.M., A.A.A.D., M.A.-M., H.A. and H.G.A. All authors have read and agreed to the published version of the manuscript.

Funding

This project was funded by Princess Nourah bint Abdulrahman University Research Supporting Project Number PNURSP2022R241, Princess Nourah bint Abdulrahman University, Riyadh, Saudi Arabia. The article processing charge was funded by the Deanship of Scientific Research, Qassim University.

Data Availability Statement

Species occurrence data are available on request to the first author.

Acknowledgments

The researchers would like to thank the Deanship of Scientific Research, Qassim University for funding the publication of this project.

Conflicts of Interest

The authors declare no conflict of interest.

References

  1. Dar, J.A.; Sundarapandian, S. Patterns of plant diversity in seven temperate forest types of Western Himalaya, India. J. Asia-Pacific Biodivers. 2016, 9, 280–292. [Google Scholar] [CrossRef] [Green Version]
  2. Khan, A.M.; Qureshi, R.; Saqib, Z. Multivariate analyses of the vegetation of the western Himalayan forests of Muzaffarabad district, Azad Jammu and Kashmir, Pakistan. Ecol. Indic. 2019, 104, 723–736. [Google Scholar] [CrossRef]
  3. Nafeesa, Z.; Haq, S.M.; Bashir, F.; Gaus, G.; Mazher, M.; Anjum, M.; Rasool, A.; Rashid, N. Observations on the floristic, life-form, leaf-size spectra and habitat diversity of vegetation in the Bhimber hills of Kashmir Himalayas. Shengtai Xuebao/Acta Ecol. Sin. 2021, 41, 228–234. [Google Scholar] [CrossRef]
  4. Rahman, I.U.R.; Afzal, A.; Iqbal, Z.; Ijaz, F.; Ali, N.; Asif, M.; Alam, J.; Majid, A.; Hart, R.; Bussmann, R.W. First insights into the floristic diversity, biological spectra and phenology of manoor valley, Pakistan. Pak. J. Bot. 2018, 50, 1113–1124. [Google Scholar]
  5. Byrne, K.M.; Lauenroth, W.K.; Adler, P.B. Contrasting Effects of Precipitation Manipulations on Production in Two Sites within the Central Grassland Region, USA. Ecosystems 2013, 16, 1039–1051. [Google Scholar] [CrossRef]
  6. Coroi, M.; Skeffington, M.S.; Giller, P.; Smith, C.; Gormally, M.; O’Donovan, G. Vegetation diversity and stand structure in streamside forests in the south of Ireland. For. Ecol. Manag. 2004, 202, 39–57. [Google Scholar] [CrossRef]
  7. Akhlaq, R.; Amjad, M.S.; Qaseem, M.F.; Fatima, S.; Chaudhari, S.K.; Khan, A.M.; Khan, S.; Malik, N.Z.; Gardazi, S.M.H.; Bibi, A.; et al. Species diversity and vegetation structure from different climatic zones of Tehsil Harighel, Bagh, Azad Kasmir, Pakistan analysed through multivariate techniques. Appl. Ecol. Environ. Res. 2018, 16, 5193–5211. [Google Scholar] [CrossRef]
  8. Khan, A.M.; Qureshi, R.; Saqib, Z.; Munir, M.; Shaheen, H.; Habib, T.; Dar, M.E.U.I.; Fatimah, H.; Afza, R.; Hussain, M.A. A first ever detailed ecological exploration of the western himalayan forests of sudhan gali and ganga summit, azad Jammu and Kashmir, Pakistan. Appl. Ecol. Environ. Res. 2019, 17, 15477–15505. [Google Scholar] [CrossRef]
  9. Poulos, H.M.; Camp, A.E. Topographic influences on vegetation mosaics and tree diversity in the Chihuahuan Desert Borderlands. Ecology 2010, 91, 1140–1151. [Google Scholar] [CrossRef]
  10. Husain, T.; Hussain, A.; Ahmed, M. Studies of vegetative behavior and climatic effects on some pasture grasses growing wild in Pakistan. Pak. J. Bot. 2009, 41, 2379–2386. [Google Scholar]
  11. Schnitzler, A.; Amigo, J.; Hale, B.; Schnitzler, C. Patterns of climber distribution in temperate forests of the Americas. J. Plant Ecol. 2016, 9, 724–733. [Google Scholar] [CrossRef] [Green Version]
  12. Pueyo, Y.; Alados, C.L.; Maestro, M.; Komac, B. Gypsophile vegetation patterns under a range of soil properties induced by topographical position. Plant Ecol. 2007, 189, 301–311. [Google Scholar] [CrossRef]
  13. Dray, S.; Pélissier, R.; Couteron, P.; Fortin, M.J.; Legendre, P.; Peres-Neto, P.R.; Bellier, E.; Bivand, R.; Blanchet, F.G.; De Cáceres, M.; et al. Community ecology in the age of multivariate multiscale spatial analysis. Ecol. Monogr. 2012, 82, 257–275. [Google Scholar] [CrossRef]
  14. Majeed, M.; Bhatti, K.H.; Amjad, M.S. Impact of Climatic Variations on the Flowering Phenology of Plant Species in Jhelum District, Punjab, Pakistan. Appl. Ecol. Environ. Res. 2021, 19, 3343–3376. [Google Scholar] [CrossRef]
  15. Tassadduq, S.S.; Akhtar, S.; Waheed, M.; Bangash, N.; Nayab, D.; Majeed, M.; Abbasi, S.; Muhammad, M.; Alataway, A.; Dewidar, A.Z.; et al. Ecological Distribution Patterns of Wild Grasses and Abiotic Factors. Sustainability 2022, 14, 11117. [Google Scholar] [CrossRef]
  16. Waheed, M.; Arshad, F.; Iqbal, M.; Fatima, K.; Fatima, K. Ethnobotanical assessment of woody flora of district Kasur (Punjab), Pakistan. Ethnobot. Res. Appl. 2020, 20, 1–13. [Google Scholar] [CrossRef]
  17. Arshad, F.; Waheed, M.; Fatima, K.; Harun, N.; Iqbal, M.; Fatima, K.; Umbreen, S. Predicting the Suitable Current and Future Potential Distribution of the Native Endangered Tree Tecomella undulata (Sm.) Seem. in Pakistan. Sustainability 2022, 14, 7215. [Google Scholar] [CrossRef]
  18. Majeed, M.; Lu, L.; Haq, S.M.; Waheed, M.; Sahito, H.A.; Fatima, S.; Aziz, R.; Bussmann, R.W.; Tariq, A.; Ullah, I. Spatiotemporal Distribution Patterns of Climbers along an Abiotic Gradient in Jhelum District, Punjab, Pakistan. Forests 2022, 13, 1244. [Google Scholar] [CrossRef]
  19. Zeb, U.; Ali, S.; Li, Z.H.; Khan, H.; Shahzad, K.; Shuaib, M.; Ihsan, M. Floristic diversity and ecological characteristics of weeds at Atto Khel Mohmand Agency, KPK, Pakistan. Acta Ecol. Sin. 2017, 37, 363–367. [Google Scholar] [CrossRef]
  20. Majeed, M.; Tariq, A.; Haq, S.M.; Waheed, M.; Anwar, M.M.; Li, Q.; Aslam, M.; Abbasi, S.; Mousa, B.G. A Detailed Ecological Exploration of the Distribution Patterns of Wild Poaceae from the Jhelum District (Punjab), Pakistan. Sustainability 2022, 14, 3786. [Google Scholar] [CrossRef]
  21. Paudel, S.; Sah, J.P. Physiochemical characteristics of soil in tropical sal (Shorea robusta Gaertn.) forests in eastern Nepal. Himal. J. Sci. 1970, 1, 107–110. [Google Scholar] [CrossRef] [Green Version]
  22. Lü, X.T.; Hu, Y.Y.; Wolf, A.A.; Han, X.G. Species richness mediates within-species nutrient resorption: Implications for the biodiversity–productivity relationship. J. Ecol. 2019, 107, 2346–2352. [Google Scholar] [CrossRef]
  23. Saeed, S.; Irfan Ashraf, M.; Ahmad, A.; Rahman, Z. The bela forest ecosystem of district jhelum, a potential carbon sink. Pak. J. Bot. 2016, 48, 121–129. [Google Scholar]
  24. Soltanpour, P.N. Determination of Nutrient Availability and Elemental Toxicity by AB-DTPA Soil Test and ICPS. In Advances in Soil Science; Springer: New York, NY, USA, 1991; Volume 16, pp. 165–190. [Google Scholar] [CrossRef]
  25. Hepper, E.N.; Buschiazzo, D.E.; Hevia, G.G.; Urioste, A.; Antón, L. Clay mineralogy, cation exchange capacity and specific surface area of loess soils with different volcanic ash contents. Geoderma 2006, 135, 216–223. [Google Scholar] [CrossRef]
  26. Rasheed, S.; Khan, S.M.; Ahmad, Z.; Mustafa, G.; Haq, Z.U.; Shah, H.; Ansari, L.; Jatt, T. Ecological assessment and indicator species analyses of the Cholistan desert using multivariate statistical tools. Pak. J. Bot. 2022, 54, 683–694. [Google Scholar] [CrossRef] [PubMed]
  27. Majeed, M.; Mahmood, A.; Habib, T.; Mushahid, M.; Ali, H.; Khan, N.; Ali, K. Vegetation analysis and environmental indicators of an arid tropical forest ecosystem of Pakistan. Ecol. Indic. 2022, 142, 109291. [Google Scholar] [CrossRef]
  28. Khan, S.A.; Khan, S.M.; Ullah, Z.; Ahmad, Z.; Alam, N.; Shah, S.N.; Khan, R.; Zada, M. Phytogeographic classification using multivariate approach; a case study from the Jambil valley swat, Pakistan. Pak. J. Bot. 2020, 52, 279–290. [Google Scholar] [CrossRef]
  29. Ilyas, M.; Qureshi, R.; Akhtar, N.; Ziaul-Haq, Z.; Khan, A.M. Floristic diversity and vegetation structure of the remnant subtropical broad leaved forests from Kabal Valley, Swat, Pakistan. Pak. J. Bot. 2018, 50, 217–230. [Google Scholar]
  30. Iqbal, M.; Khan, S.M.; Ahmad, Z.; Hussain, M.; Shah, S.N.; Kamran, S.; Manan, F.; Ul Haq, Z.; Ullah, S. Vegetation classification of the margalla foothills, islamabad under the influence of edaphic factors and anthropogenic activities using modern ecological tools. Pak. J. Bot. 2021, 53, 1831–1843. [Google Scholar] [CrossRef]
  31. Tolera, F.F.; Moa, M.S.; Tilahun, B.H.; Tena, R.; Nebiyu, K.K. Ethnobotanical study of ethnoveterinary plants in Kelem Wollega Zone, Oromia Region, Ethiopia. J. Med. Plants Res. 2017, 11, 307–317. [Google Scholar] [CrossRef] [Green Version]
  32. Sang, W. Plant diversity patterns and their relationships with soil and climatic factors along an altitudinal gradient in the middle Tianshan Mountain area, Xinjiang, China. Ecol. Res. 2009, 24, 303–314. [Google Scholar] [CrossRef]
  33. Majeed, M.; Bhatti, K.H.; Pieroni, A.; Sõukand, R.; Bussmann, R.W.; Khan, A.M.; Chaudhari, S.K.; Aziz, M.A.; Amjad, M.S. Gathered wild food plants among diverse religious groups in Jhelum District, Punjab, Pakistan. Foods 2021, 10, 594. [Google Scholar] [CrossRef] [PubMed]
  34. Burnside, N.G.; Joyce, C.B.; Puurmann, E.; Scott, D.M. Use of vegetation classification and plant indicators to assess grazing abandonment in Estonian coastal wetlands. J. Veg. Sci. 2007, 18, 645–654. [Google Scholar] [CrossRef]
  35. Charles Goebel, P.; Palik, B.J.; Pregitzer, K.S. Structure and composition of riparian forests in an old-growth northern hardwood-hemlock watershed. For. Ecol. Manag. 2012, 280, 52–61. [Google Scholar] [CrossRef]
  36. Nowak, D.J.; Greenfield, E.J.; Hoehn, R.E.; Lapoint, E. Carbon storage and sequestration by trees in urban and community areas of the United States. Environ. Pollut. 2013, 178, 229–236. [Google Scholar] [CrossRef] [Green Version]
  37. Majeed, M.; Tariq, A.; Anwar, M.M.; Khan, A.M.; Arshad, F.; Mumtaz, F.; Farhan, M.; Zhang, L.; Zafar, A.; Aziz, M.; et al. Monitoring of land use–Land cover change and potential causal factors of climate change in Jhelum district, Punjab, Pakistan, through GIS and multi-temporal satellite data. Land 2021, 10, 1026. [Google Scholar] [CrossRef]
  38. Hassan, M.; Haq, S.M.; Majeed, M.; Umair, M.; Sahito, H.A.; Shirani, M.; Waheed, M.; Aziz, R.; Ahmad, R.; Bussmann, R.W.; et al. Traditional Food and Medicine: Ethno-Traditional Usage of Fish Fauna across the Valley of Kashmir: A Western Himalayan Region. Diversity 2022, 14, 455. [Google Scholar] [CrossRef]
  39. Wazir, S.M.; Dasti, A.A.; Saima, S.; Shah, J.; Hussain, F. Multivariate analysis of vegetation of Chapursan valley: An alpine meadow in Pakistan. Pak. J. Bot. 2008, 40, 615–626. [Google Scholar]
  40. Adel, M.N.; Pourbabaei, H.; Dey, D.C. Ecological species group-Environmental factors relationships in unharvested beech forests in the north of Iran. Ecol. Eng. 2014, 69, 1–7. [Google Scholar] [CrossRef]
  41. Ahmad, S.S.; Erum, S.; Khan, S.M.; Nawaz, M. An appraisal of ecological distribution of herbaceous flora at Changa Manga park Lahore, Pakistan. Pak. J. Bot. 2014, 46, 19–25. [Google Scholar]
  42. Salama, F.; Abd El-Ghani, M.; Gadallah, M.; El-Naggar, S.; Amro, A. Characteristics of desert vegetation along four transects in the arid environment of southern Egypt. Turk. J. Bot. 2014, 40, 59–73. [Google Scholar] [CrossRef]
  43. Zheng, Z.; Zeng, Y.; Schneider, F.D.; Zhao, Y.; Zhao, D.; Schmid, B.; Schaepman, M.E.; Morsdorf, F. Mapping functional diversity using individual tree-based morphological and physiological traits in a subtropical forest. Remote Sens. Environ. 2021, 252, 112170. [Google Scholar] [CrossRef]
  44. Khan, A.M.; Li, Q.; Saqib, Z.; Khan, N.; Habib, T.; Khalid, N.; Majeed, M.; Tariq, A. MaxEnt Modelling and Impact of Climate Change on Habitat Suitability Variations of Economically Important Chilgoza Pine (Pinus gerardiana Wall.) in South Asia. Forests 2022, 13, 715. [Google Scholar] [CrossRef]
  45. Abella, S.R.; Covington, W.W. Forest ecosystems of an Arizona Pinus ponderosa landscape: Multifactor classification and implications for ecological restoration. J. Biogeogr. 2006, 33, 1368–1383. [Google Scholar] [CrossRef]
  46. Mahmood, A.; Mahmood, A.; Naveed, I.; Memon, M.M.; Bux, H.; Younas Majeed, M.; Mujtaba, G.; Saqlain Mumtaz, M. Indigenous medicinal knowledge of common plants used by local people of Hattian Bala District, Azad Jammu and Kashmir (AJK), Pakistan. J. Med. Plant Res. 2011, 5, 5517–5521. [Google Scholar]
  47. Divakara, B.N.; Nikitha, C.U.; Nölke, N.; Tewari, V.P.; Kleinn, C. Tree Diversity and Tree Community Composition in Northern Part of Megacity Bengaluru, India. Sustainability 2022, 14, 1295. [Google Scholar] [CrossRef]
  48. Shaheen, H.; Khan, S.M.; Harper, D.M.; Ullah, Z.; Allem Qureshi, R. Species Diversity, Community Structure, and Distribution Patterns in Western Himalayan Alpine Pastures of Kashmir, Pakistan. Mt. Res. Dev. 2011, 31, 153. [Google Scholar] [CrossRef] [Green Version]
  49. Furusawa, T.; Sirikolo, M.Q.; Sasaoka, M.; Ohtsuka, R. Interaction between forest biodiversity and people’s use of forest resources in Roviana, Solomon Islands: Implications for biocultural conservation under socioeconomic changes. J. Ethnobiol. Ethnomed. 2014, 10, 10. [Google Scholar] [CrossRef] [PubMed] [Green Version]
  50. Qureshi, H.; Arshad, M.; Bibi, Y.; Ahmad, R.; Osunkoya, O.O.; Adkins, S.W. Multivariate impact analysis of parthenium hysterophorus invasion on above-ground plant diversity in pothwar region of Pakistan. Appl. Ecol. Environ. Res. 2018, 16, 5799–5813. [Google Scholar] [CrossRef]
Figure 1. Study area with elevation and sampling location in the various ecosystem (riparian ecosystem, wetland ecosystem, urban ecosystem, forest ecosystem, and agro-ecosystem).
Land 11 02145 g001
Figure 2. Climograph showing the average temperature and rainfall in district Kasur.
Land 11 02145 g002
Figure 3. Chord diagram showing the number of species and genera in each family recorded from semi-arid lowland of Punjab, Pakistan.
Land 11 02145 g003
Figure 4. Chord diagram showing the woody species distribution in different habitat types of semi-arid lowland of Punjab, Pakistan.
Land 11 02145 g004
Figure 5. An agglomerative hierarchical clustering dendrogram of the 120 sampling sites, illustrating the five woody plant communities in the semi-arid lowland Punjab, Pakistan.
Land 11 02145 g005
Figure 6. Radial stack bar plot showing the IV of woody species in different communities recorded from semi-arid lowland Kasur Punjab, Pakistan.
Land 11 02145 g006
Figure 7. CCA analysis of woody vegetation in semi-arid lowland district Kasur Punjab, Pakistan.
Land 11 02145 g007
Figure 8. Ternary plot showing the distribution of five woody vegetation communities in semi-arid lowlands of Kasur, Punjab Pakistan. Ternary plot based on soil texture (silt, clay, and sand). (See Figure 5 description for full name of woody communities).
Land 11 02145 g008
Figure 9. Pearson correlation between soil variables in semi-arid lowland district Kasur, Punjab Pakistan.
Land 11 02145 g009
Table 1. overall woody plants of the five communities from the study area of semi-arid lowland district Kasur Punjab, Pakistan.
Plant NameSpecies CodeCommunity 1Community 2Community 3Community 4Community 5
Acacia farnesiana (L.) WildAcac far10.239.3213.0869.6435.66
Acacia modesta WallAcac mod9058.2415.9913.56
Acacia nilotica (L.) Delile.Acac nil31.2362.0551.3978.5635.25
Albizia lebbek (L.) Benth.Albi leb14.6703.457.792.79
Albizia procera (Roxb.) Benth.Albi pro15.11005.33.57
Alstonia scholaris (L.) R. Br.Alst sch32.7905.67016.66
Artocarpus lakucha Buch. Ham.Arto lak0001.450
Azadirachta indica (L.) A. JussAzad ind3.790000
Bauhinia purpurea L.Bauh pur5.0702.4300
Bauhinia variegata L.Bauh var2.510000
Bischofia javanica BlumeBisc jav3.1002.120
Bombax ceiba L.Bomb cei2385.137.5438.83.45
Broussonetia papyrifera (L.) L’Herit. ex Vent.Brou pap1.235.7836.0757.165.01
Butea monosperma (Lain.) Taubert.Bute mon0002.310
Capparis decidua (Forssk.) Edgew.Capp dec0004.320
Cascabela thevetia (L.) LippoldCasc the31.0200010.33
Cassia fistula L.Cass fis9.6802.1104.32
Cassia surattensis Burn. f.Cass sur8.650000
Cedrela toona Roxb.ex Wild.Cedr too06.403.430
Celtis australis L.Celt aus9.436.5027.250
Chukrasia tabularis Adr. Juss.Chuk tab0003.2340
Conocarpus erectus L.Cono ere58.66018.89063.86
Cordia dichotoma G.Forst.Cord dic2.46002.150
Cordia myxa L.Cord myx8.03001.650
Dalbergia latifolia Roxb.Dalb lat2.982.3302.340
Dalbergia sisso Roxb.Dalb sis82.665.8850.8860.452.34
Ehretia laevis Roxb.Ehr lae14.0732.79040.690
Ehretia obtusifolia Hochst. ex A.DC.Ehr obt001.2312.110
Erythrina suberosa Roxb.Eryt sub005.64018.91
Eucalyptus camaldulensis Dehnh.Euca cam88.226.647.4860.3124.05
Eucalyptus citriodora Hook.Euca cit0002.3415.66
Ficus benghalensis L.Ficu ben7.7915000
Ficus elastica Roxb. ex Hornem.Ficu ela3.660000
Ficus infectoria Roxb.Ficu inf19.680000
Ficus macrophylla Huegel ex Miq.Ficu mac3.210000
Ficus palmata Forssk.Ficu pal1.688.6530.7139.790
Ficus racemosa L.Ficu rac08.01000
Ficus religiosa L.Ficu rel19.7702.3400
Gmelina arborea Roxb. ex Sm.Gmel arb5.53005.430
Grevillea robusta A. Cunn. ex R. Br.Grev rob06.542.3404.3
Grewia tenax (Forssk.) FioriGrew ten0011.179.070
Heterophragma adenophylla (Wall. ex G. Don) DopHete ade7.770000
Jacaranda ovalifolia R. BrJaca ova4.320000
Kigelia africana (Lam.) Benth.Kige afr4.320000
Lagerstroemia indica L.Lage ind31.050003.41
Leucaena leucocephala (Lam.) de WitLeuc leu08.54052.130
Mangifera indica L.Mang ind4.6907.7800
Moringa oleifera Lam.Mori ole5.1110.32000
Morus alba L.Moru alb27.7777.433.3547.990
Morus nigra L.Moru nig71.572.33.2354.960
Morus serrata Roxb.Moru ser6.43002.110
Oroxylum indicum (L.) KurzOrox ind3.2103.100
Parkinsonia aculeata L.Park acu0031.91031.69
Phyllanthus emblica L.Phyl emb3.210000
Pinus roxburghii SargentPinu rox7.550000
Plumeria obtusa L.Plum obt3.740000
Plumeria rubra L.Plum rub2.120000
Polyalthia longifolia Benth, & Hook. f.Poly lon40.390000
Poncirus trifoliate (L.) RafPonci tri1.320000
Pongamia pinnata (L.) Merrill.Pong pin13.8727.6412.2111.5523.32
Populus alba L.Popu alb31.9850.88018.180
Populus nigra L.Popu nig29.1195.2822.5615.190
Prosopis cineraria (L.) DrucePros cin005.6172.2145.57
Prosopis glandulosa Torr.Pros gla03.2317.682.542.23
Prosopis juliflora (Sw.) DC.Pros jul030.7940.8985.3245.78
Psidium guajava L.Psid gua47.6524.77000
Pterospermum acerifolium (L.) WilldPter ace3.960000
Putranjiva roxburghii (Wall.) HurusawaPutr rox2.340000
Ricinus communis L.Rici com6.97.659.4321.0254.66
Salix alba L.Sali alb03.45015.20
Salix tetrasperma Roxb.Sali tet03.2507.540
Salvadora oleoides Decne.Salv ole27.920007.77
Sapindus mukorossi GaertnSapi muk4.220000
Sapium sebiferum (L.) Roxb.Sapi seb032.9030.240
Saraca asoca (Roxb.) De Wilde.Sara aso3.230000
Syzygium cumini (L.) SkeelsSyzy cum14.7603.5600
Tamarix aphylla (Linn.) Karst.Tama aph0064.6835.80
Tamarix dioica Roxb. ex RothTama dio0032.3400
Tecoma stans L.Teco sta66.870000
Tectona grandis L. f.Tect gra2.540000
Terminalia belerica Roxb.Term bel2.340000
Terminalia chebula Retz.Term che2.110000
Terminalia. arjuna (Roxb. Ex DC) Wt. & Arn.Term arj39.646.3634.216.290
Trewia nudiflora L.Trew nud1.23005.620
Ziziphus jujuba Mill.Zizi juj20.3321.4592.6319.42.12
Ziziphus nummularia (Burm.f.) Wight & Arn.Zizi num15.8321.4361.8345.33.23
Table 2. Summary of CCA analysis of woody vegetation in semi-arid lowland of Punjab, Pakistan.
Axes1234
Eigen values0.4370.240.180.167
Species-environment associations0.9070.7680.8210.755
Accumulative percentage variance of wild grass species data6.39.812.414.8
Accumulative percentage variance of species-environment relation26.140.451.261.2
Total inertia6.912
Sum of all eigen values6.912
Sum of all canonical eigenvalues1.675
Monte-Carlo test
Test of significance of first canonical axis: eigenvalue0.437
F-ratio3.240
p-value0.0020
Test of significance of total canonical axes; Trace1.675
F-ratio1.396
p-value0.0020
Publisher’s Note: MDPI stays neutral with regard to jurisdictional claims in published maps and institutional affiliations.

