Article

Aging Industries in the Regional Economy: How to Support an Aging China?

1
School of Economic and Management, and Center for Industrial Economics, Wuhan University, Wuhan 430072, China
2
China Institute of Development Strategy and Planning, and Center for Industrial Economics, Wuhan University, Wuhan 430072, China
3
School of Business, Shandong Management University, Jinan 250357, China
*
Authors to whom correspondence should be addressed.
Land 2022, 11(11), 2096; https://doi.org/10.3390/land11112096
Submission received: 28 August 2022 / Revised: 30 September 2022 / Accepted: 12 October 2022 / Published: 20 November 2022

Abstract

:
This study investigates the law, distribution characteristics, and changing trend of the coordinated development of China’s aging industry and regional economy, as well as the factors which influence the degree of coordination between the aging industry and economic development on the provincial level. In doing so, we construct a comprehensive evaluation index system of the aging industry and regional economy development, introduce an entropy weight coupling model, and measure the coupling and coordinated development level of the two systems using data of 31 selected Chinese provinces (municipalities) from 2009 to 2019. The spatial Dubin model is then used to empirically analyze the influencing factors and spatial effect decomposition of the coordinated development of the aging industry and regional economy. We reach the following main results: (1) China’s aging industry is developing unevenly, with substantial regional differences, but these differences have narrowed in recent years. (2) China’s regional economic disparities have widened. The eastern regions have the highest level of development, while the northeast region’s growth rate of GDP has declined since 2014. (3) The coordinated development of the aging industry and regional economy in one region of China has a positive impact on its neighboring regions, and all Chinese regions exhibits high–high, low–low agglomeration characteristics in terms of their degree of coordination. (4) A variety of socioeconomic and demographic factors affect the coordinated development of the aging industry and regional economy. An important implication of these findings is that, China should improve population structure, population quality, and economic development quality in order to achieve a high-level coordinated development of the aging industry and regional economy.

1. Introduction

According to the data of seventh census in 2020, China’s population of people aged 65 and above was 190.64 million, accounting for 13.50% of the total population, indicating that the country is rapidly aging [1]. China found itself in a challenging position of “getting old before getting rich” [2]. Dealing with the problem of population aging is critical in determining a country’s long-term economic growth momentum, and is also a key factor in great power competition in the 21st century. China is confronted with unprecedented challenges in rural and urban setting [3]. The “14th Five-Year Plan for National Aging Development and Elderly Care Service System Plan” was promulgated in 2021, officially listing active response to population aging as a national strategy [4]. The development of the aging industry will have a significant and far-reaching impact on China’s economic and social development during the “14th Five-Year Plan” period, as well as the overall process of building a socialist modernized country.
In recent years, the importance of high-quality development1 in China has been emphasized [5,6]. There is a significant relationship between regional economy and the aging industry, which promote and develop in tandem. Therefore, the coordinated development of the regional economy and the aging industry becomes an important part of the regional economy’s high-quality development. However, what does not match the rapid development of China’s economy is that China’s aging industry is still in its infancy and is unable to meet the rapidly growing demand for elderly care service, which induced by the rapid population aging [7]. There are regional imbalances and deficiencies in China’s economic development and aging industry [8]. For example, the eastern coastal regions of China are economically developed but have a serious problem with aging, while the western regions are underdeveloped despite having a more favorable population structure than the east [9]. At the same time, the elderly care issue is a problem in large cities such as Beijing, Tianjin, and Shanghai [10]. Therefore, studying the status quo and relationship between the regional aging industry and economic development, as well as analyzing the main factors affecting the coordinated development of them, not only solves the aging problem, develops and strengthens the aging industry, but also provides impetus to the high-quality economic development.
To this end, we pursue three objectives in this study. First, we aim to gauge the law of coordinated development of the coupling between the aging industry and regional economy development, as well as the distribution characteristics and variation trend of the coupling coordination degree. Our second objective is to explore the spatial effects of coordinated development between the aging industry and economic development, and to conduct in-depth analysis of related influencing factors. Third, we hope to provide valuable empirical results and theoretical exploration for the formulation of relevant policies.
The remainder of the study is organized as follows. Section 2 provides a review on relevant literatures. Section 3 presents the data sources and the theoretical framework, while Section 4 analyzes the coupling and coordinated development of aging industry and regional economy. Section 5 empirically studies the influencing factors of coupling coordination between aging industry and regional economic development and Section 6 contains our conclusions.

2. Literature Review

Western academic circles were more mature in studying the ageing problem than Chinese academic circles because most European and American countries entered the aging society with various degrees around the 1980s. They generally refer to elderly-related industries, such as the “health industry” and “silver hair industry”, but they have no clear concept of the aging industry. While research on the aging industry in China gradually appeared in papers, academic works, policies, and regulations since developing the undertaking of the elderly was clearly proposed in the 1980s [11], but the concept and connotation of the aging industry are not unified. Some scholars proposed that the aging industry is driven by the increase in demand from the elderly consumer market. Tian believed that the “aging industry” is a general term for the non-governmental profit-making activities that provide goods and services to the elderly with the goal of meeting the needs of high-level life and culture for the elderly [12]. In 2020, the National Bureau of Statistics issued the “Statistical Classification of the Aging Industry (2020)”, which defined the aging industry as a collection of production activities that ensure and improve the life, health, safety, and participation of the elderly in social development, and provide the public with the production of various elderly care and related products.
China’s economy is currently transitioning from a stage of high-speed growth to a stage of high-quality development. Sun Zhijun et al. believed that high-quality development research is still in its early stages, and that high-quality economic development is guided by the concept of coordination and balance to improve economic stability [13]. From the perspective of economic theory, Jin Bei proposed that high-quality development requires implementation of a comprehensive strategy, as well as balance and coordination of various policy objectives to achieve the multi-dimensional and desirable goal of high-quality development [14]. Therefore, coordinated and balanced development is the core content of high-quality economic development. High-quality development is inclusive and a “co-evolution” in nature, achieving economic, social, and natural synchronization and coordination [15]. High-quality development is reflected in the optimization of industrial structure, the synergy, integrity, inclusiveness, and openness of industrial and regional economic development, as well as production efficiency, technological innovation, and green development at the enterprise level [16]. As an industry meeting the needs of specific groups, the aging industry plays a pivotal role in promoting economic development in China. High-quality development of the aging industry is also an important part of high-quality economic development.
The aging of the population stimulated the development of the aging industry, which is closely linked to economic development. Clark Tibbits, known as the father of gerontology in the United States, published the book Handbook of Social Gerontology in 1960, which revealed the interaction between population aging and social and economic development, and explained the importance of aging issues [17]. With western countries entering the aging society, economists and demographers began to pay attention to the aging industry, pension issues and its economic effects [18]. Western academics carried out research on elderly consumption, aging policies and systems, the development of the aging industry chain, and the relationship between elderly care and society. It is argued that establishing the government welfare planning system on the basis of the market would be more efficient [19]. In the case of Japan, the aging industry is classified into three categories: standard industry, related industry, and derivative industry [20]. The old-to-young dependency ratio was found to be positively correlated with residents’ consumption [21]. Furthermore, the rising consumption rate reflects the impact of the aging population on the social economy [22]. The EU has a similar impact on population aging and fiscal solvency policy responses [23].
In China, the aging industry was studied for more than 30 years. Initially, the study was based on foreign (western) research results. The research on aging industry was gradually expanded to include the perspective of development mode, path, development trend, and economic benefits [24]. In comparison to the early days of qualitative analysis and research on aging industry, Chinese scholars have conducted more and more quantitative research in recent years, with the gradual enrichment and improvement of data. Using a panel data model, Huang Qian et al. examined the impact of population aging on innovation [25]. Li Xinguang et al. employed the dual-zone spatial Dubin model (SDM) to analyze the space of China’s population aging on economic growth from the perspective of deep aging [26].
Hou and Liao constructed an econometric model using spatial panel data from 30 provinces in China from 2004 to 2018 to examine the relationship between population aging, innovation, and industrial structure transformation [27]. He and Yang used a coupling index system to empirically analyze the degree of coupling coordination between the broadened health industry and the aging industry [28]. In general, research on the aging industry progressed from qualitative to quantitative, and the research content gradually expanded into other fields and industries of the social economy. However, little research has been conducted on the relationship between the aging industry and regional economy development. Based on the coupling coordination degree model, He and Wang took Jiangsu province as an example and analyzed the spatial–temporal evolution of the aging industry, regional economy, and their coupling coordination in Jiangsu Province in 2005, 2010, and 2015, then put forward some policy suggestions [29].
It is therefore imperative to construct a comprehensive evaluation index system of the aging industry and regional economy development to measures the coupling and coordinated development level of the two systems in order to determine the coordinated development level of the aging industry and regional economy in various provinces and cities in China.
Our study contributes to the existing body of literature in two ways. First, to the best of our knowledge, we provide the first comprehensive analysis of the evolution characteristics, influencing factors and spatial effects of the coordinated development of China’s provincial aging industry and regional economy on the basis of provincial panel data. Second, we construct the spatial Dubin model to examine the influencing factors and spatial effect decomposition of the coordinated development of the aging industry and regional economy, which enriches the existing research in this topic and enable us to provide targeted policy guidance on how to make a high-quality development of both aging industry and regional economy.

3. Methods and Data

3.1. Data Sources

In this study, data about the aging industry and economic development are collected from China Civil Affairs Statistical Yearbook [30], China Statistical Yearbook [31], and the official website of the National Bureau of Statistics. The data that cannot be obtained directly are calculated and sorted. Additionally, the proportion and interpolation methods are used to make up for the missing data. For the convenience of discussion, according to the National Bureau of Statistics in 2011, China’s economic regions are divided into four regions: the east, the central, the west, and the northeast. The details are as follows2: the eastern region includes Beijing, Tianjin, Hebei, Shanghai, Jiangsu, Zhejiang, Fujian, Shandong, Guangdong, and Hainan; the central region includes Shanxi, Anhui, Jiangxi, Henan, Hubei, and Hunan; the western region includes Inner Mongolia, Guangxi, Chongqing, Sichuan, Guizhou, Yunnan, Tibet, Shaanxi, Gansu, Qinghai, Ningxia, and Xinjiang; Northeast China includes Liaoning, Jilin, and Heilongjiang [32].

3.2. Theoretical Framework

3.2.1. Evaluation Index System

Based on the principles of systems, representative, hierarchy, and data availability, and with the reference to previous studies about indicators of the aging industry and economic development [28,29], this study selects different evaluation indicators to construct an evaluation system for the development level of the aging industry and regional economy (See Table 1).
(1)
The aging industry system includes 3 primary and 9 secondary indicators as follows:
A1 = the proportion of the elderly population aged 65 and above, (population over 65/total population) 100%
A2 = the old-age dependency ratio (ODR), (population over 65/population aged 15–64) 100%
A3 = the old-to-young ratio, (population over 65/population aged 0–14) 100%
A1, A2, A3 reflect the demographic structure. Those three indicator are inverse indicators, which means the larger the data, the higher the degree of aging, and the greater the pressure on elderly care.
A4 = the number of pension insurance participants
A5 = the total income of the basic pension insurance fund
These two indicators represent the level of basic pension security.
A6 = the number of elderly care institutions
A7 = the number of employees in elderly care institutions
A8 = the number of elderly care beds per thousand elderly people
A9 = the quality of aging industry practitioners, (the proportion of college and above personnel)
A4–A9 are used to measure the ability of basic elderly care, which are all positive indicators.
(2)
The regional economy system consists of 3 primary and 7 secondary indicators:
B1 = the regional GDP
B2 = the local fiscal revenue
B3 = the whole society’s fixed asset investment
B1, B2, B3 are the indicators of economy development scale.
B4 = the per capita GDP
B5 = the per capita disposable income
B4, B5 are used to reflect the economy development quality.
B6 = the tertiary industry added value
B7 = tertiary industry’s share of GDP, (B6/GDP)100%
B6, B7 are used to measure the pros and cons of the industrial structure.
B1–B7 are all positive indicators.

3.2.2. Standardization and Weights of Indicators

(1)
Standardization of indicators
Since each index has a different measurement unit and dimension and cannot be directly compared, the extreme value method needs to be used to normalize the original data of each index. Based on the attributes of indexes, the larger the value of the positive index, the better, whereas the smaller the value of the inverse index, the better. Therefore, we adopt different calculation methods for the normalization of the positive and inverse indexes. Details are as follows:
x i j t = { x i j t min ( x i j t ) max ( x i j t ) min ( x i j t ) × 0.95 + 0.05 ,             positive max ( x i j t ) x i j t max ( x i j t ) min ( x i j t ) × 0.95 + 0.05 ,               inverse     i = ( 1 , 2 , , n )
where i represents the province, j represents the evaluation index, x i j t is the value of the j index of the i province in year t. max ( x i j t ) , min ( x i j t ) , respectively, represent the maximum and minimum values of the index; x i j t is the dimensionless index value after normalization. In order to avoid the occurrence of zero in the data processing, a coefficient of 0.95 and a constant term of 0.05 are added to the formula [33].
(2)
Determination of weights
There are several ways to determine indicator weights. In this study, the entropy value method is adopted, and the weight is determined by the principle of information entropy, which can objectively represent the evaluation index of the research object. The entropy method uses the discrete degree of the index to determine the weight of the index. We collect data of 31 selected provinces from 2009 to 2019 and calculate the weight of each index each year utilizing the entropy method.
First, calculate the proportion p i j of the j index value in province i,
p i j = x i j / i x i j .
Since p i j is calculated respectively by each year, for simplicity, x i j in Formula (2) is used to represent x i j t in (1).
Then, calculate the entropy value e j of the j index
e j = k i p i j l n p i j
In Formula (3), k > 0 ,   k = 1 / l n ( n ) , n is the number of provinces.
Next, calculate the difference coefficient (information utility value) g j of the j indicator
g j = 1 e j .
Finally, calculate the weight w j of each indicator
w j = g j / j g j .

3.2.3. Calculation of Coupling Coordination Evaluation Index

(1)
Aging industry and regional economy development index
U 1 = j w j x i j ;   U 2 = j w j y i j
where w j and w j are the weight coefficients of the aging industry and regional economy, respectively. x i j and y i j are the dimensionless values of the aging industry and regional economy indicators, respectively, and U 1 and U 2 are the composite scores of the aging industry and the regional economy.
(2)
Coupling Index
C = 2 [ U 1 × U 2 ( U 1 + U 2 ) 2 ] 1 2
The concept of coupling originated from physics and was later introduced into the field of regional economy. The synergistic influence between regional systems or between elements within the system is usually measured by the degree of coupling, which reflects the strength of the interaction between the two parties.
In the above Formula (7), C represents the coupling index, C ∈ [0, 1]. When C is close to 0, the systems are independent of each other and are in an irrelevant state. The larger the value of C, the stronger the interaction and the greater the correlation. When C is close to 1, it indicates that the degree of coupling between systems is higher, and the dispersion between systems is minimum. However, the coupling index C can only indicate the strength of the interaction between the systems, that is, the degree of correlation between the two. It cannot reveal the level of coordinated development between the regional economy and the aging industry. Therefore, it is necessary to introduce the coupling coordination index that can measure the development degree of the relationship between the two for analysis.
(3)
Coupling coordination index
D = C × T ,   among   T = α U 1 + β U 2
The degree of coupling coordination is mainly used to analyze the level of coordinated development between different systems (or things). The degree of coordination reflects the benign degree of the coupling relationship between the two parties, and can represent whether the systems promote each other at a high level or restrict each other at a low level. A high degree of coupling indicates that there is a strong interaction between the two parties, while a high degree of coordination indicates that there is a benign and high-level mutual promotion between the two.
In the above Formula (8), C is the coupling index, T is the comprehensive index of the aging industry and regional economy development, and α and β are undetermined coefficients, which, respectively, represent the contribution of the two systems in the coordinated operation. In this study, the two systems are regarded as equally important, then α = β = 1/2. D represents the coordination index, D ∈ [0, 1], the larger D is, the more coordinated the system is, and vice versa, the smaller D is, the less coordinated. In order to further understand the state of coordinated development of various regions in China, within the value range of the coordination index, with the reference to the classification criteria [29], the coupling coordination degree between the aging industry and the regional economy is divided into 15 categories in five levels, as shown in Table 2.

3.2.4. Kernel Density Estimation Method

As a non-parametric estimation method, kernel density estimation usually fits sample data through a smooth peak function and uses a continuous density curve to describe the distribution of random variables, which has the characteristics of strong robustness and weak model dependence [34], and is a commonly used method to describe the dynamic evolution trend of random variables. The estimation formula of the kernel density function is:
f h ( x ) = 1 n h i = 1 n K ( x x i h )
K ( x ) is the kernel density function, and h (>0) is the smoothing parameter, which is called bandwidth. In this study, we choose the optimal bandwidth set by Stata software and use Gaussian kernel function to estimate the kernel density function:
K ( x ) = 1 2 π e ( x 2 2 )

4. Coupling and Coordinated Development and Evolution

4.1. Overall Coupling Coordinated Development and Evolution

4.1.1. Space-Time Evolution of Aging Industry Development

Based on the development index of the aging industry, this study used software to draw a spatial-temporal evolution map of the aging industry development of 31 selected Chinese provinces for the years 2009, 2012, 2016 and 2019, as displayed in Figure 1. As shown, the development of the aging industry in different regions of China in 2009 varied significantly. Four provinces had a development index below 0.25, while five provinces had a development index greater than 0.6. By 2019, the aging industry development index of all provinces was greater than 0.25, while only two provinces exceeded 0.6. These findings indicate that the development of the aging industry is improving in most regions of China, especially in less developed western regions where aging industry developed fast, while the aging industry in developed eastern regions (except Guangdong and Jiangsu) deteriorated. Except Liaoning Province in northeast China, the aging industry in the other two provinces in the northeastern made progress.
From a spatial perspective, China’s aging industry has large regional differences. During 2009-2019, the higher level of aging industry were in developed provinces and cities in the central and eastern regions (Figure 1). The value of Guangdong Province, ranked first in 2009 with 0.7778, was 3.8 times that of Hainan Province with the smallest value of 0.2074. In 2019, the value of Guangdong Province, ranked first with 0.7812, was 2.8 times that of Gansu Province with the smallest value of 0.2824. The tendency indicates that the regional differences in the development of the aging industry became narrow, and the development of the aging industry in less developed areas accelerated.
From the perspective of sub-regions, as shown in Figure 2, the development of the aging industry in the eastern and central regions is above the national average. There is indication that the overall development trend of the aging industry in the western region gradually improved, the eastern region has a slight decline, and the central and the northeast improved from 2017 after experiencing a large decline.

4.1.2. Space-Time Evolution of Regional Economy Development

China’s regional economy developed steadily from 2009 to 2019. The economic development indices of Yunnan and Jiangxi provinces greatly improved. There are three provinces experiencing economic recession, namely Shanxi, Jilin and Liaoning. Among them, the economic development index of Liaoning Province dropped the most, by approximately 40%, from 0.3829 in 2009 to 0.2289 in 2019.
With the development index of the regional economy, this study used software to draw a spatial-temporal evolution map of the regional economy development of 31 selected Chinese provinces for the years 2009 and 2019, as displayed in Figure 3. As shown, the development of China’s regional economies varies greatly across the country from a spatial perspective. Over the past decade, the indexes of regional economic development above 0.4 was concentrated in the eastern regions (coastal provinces). In 2009, the value of Guangdong Province, ranked first with 0.6948 in 2009,, was 5.8 times that of Tibet with the smallest value of 0.1193; the value of Guangdong Province, ranked first in 2019 with 0.6836, was 7.3 times that of Tibet with the smallest value of 0.0936. The tendency indicates the disparity in regional economy became larger, and the polarization became more and more serious.
From the perspective of the sub-regions, the economic development level of the eastern region is the highest, far exceeding the national average, but it gradually declined in recent years (Figure 4). The development of the central and western regions was relatively stable. While the central region steadily rose and gradually approached the national average level; the western region was stable with a slight decline, and continued to lag far behind the national average. The economy of the northeast region began to decline in 2014, falling down from the same level of the central region to the level of the western region, far below the national average.

4.1.3. Space-Time Evolution of the Coordination Index

From 2009 to 2019, the coordination between the aging industry and regional economy development was good, and there was no incoordination. There was little change in recent years, and the quality of coordinated development was not high. Basic coordinated provinces still hold the majority, with 19 in 2009 and 18 in 2019; well-coordinated provinces remained largely unchanged over the 10-year period, with Guangdong first and Jiangsu second; moderately coordinated provinces in 2009 were 10, and 11 in 2019, of which, Liaoning dropped from moderate coordination to basic coordination, while Anhui and Fujian improved from basic coordination to moderate coordination.
According to the division of the coupling coordination type, this study used software to draw a spatial-temporal evolution map of the coordination development between aging industry and regional economy of the 31 selected Chinese provinces for the years 2009 and 2019 as shown in Figure 5. From a spatial perspective, there are regional differences in the coordination between China’s aging industry and regional economy development, which is basically positively related to the degree of economic development. As can be found from Figure 5, in the past 10 years, the provinces with better-coordinated development were also the provinces with a higher regional economy level. The coordination index of Guangdong Province, ranked first in 2009 with 0.8574, was 2.1 times that of Tibet with the smallest value of 0.4077. The coordination index of Guangdong Province, ranked first in 2019 with 0.8549, was twice that of Gansu Province with the smallest value of 0.4220. Therefore, the overall coordination level of each region did not change much, and the regional differences in the coordination were less polarized than the regional economy conditions.
From the perspective of the sub-regions, as shown in Figure 6, the eastern region had the highest level of coordination, the central region was basically close to the average, and slightly exceeded the average in the last two years. The western region had the lowest level of coordinated development with little improvement, while the coordination status of the northeast region dropped from close to the average in 2009 and approached the level of the western region in 2019. If this tendency continues, the northeast region may become the region with the worst level of coordination.

4.2. Mean Value Analysis

From 2009 to 2019, the mean values of the aging industry development index, regional economy development index, comprehensive development index, coupling index, and coordination index of each province (directly administered) city are shown in Table 3.
Table 4 indicates that the coupling and coordination between the development of the aging industry and economic development in China’s 31 provinces was generally acceptable. Guangdong and Jiangsu were in a state of good coordination. Guangdong ranked first and the regional economy development slightly lagged the development of the aging industry. Jiangsu ranked second and the aging industry slightly lagged the development of the regional economy; Shandong, Henan, Sichuan, Hubei, Liaoning, Hebei, Hunan, Zhejiang, Beijing, and Shanghai were moderately coordinated. Among them, Zhejiang manifested the most balanced development. The development of the aging industry in Beijing and Shanghai lagged the economic development, and the economic development of the rest provinces lagged the development of the aging industry. Anhui, Inner Mongolia, Jiangxi, Shaanxi, Chongqing, Jilin, Shanxi, Guangxi, Xinjiang, Yunnan, Heilongjiang, Guizhou, Hainan, Ningxia, Tibet, Qinghai, Gansu, Fujian, and Tianjin were in a state of basic coordinate. In Fujian and Tianjin, the aging industry development lagged, and economic development in other provinces lagged. In general, although there was no incoordination between the aging industry and economic development, most (over 60%) provinces or municipalities were in a state of basic coordinate. What is more, basic coordinate usually occurred in provinces in the western and northeastern regions

4.3. Dynamic Evolution Analysis

In order to objectively reflect the distribution changes of China’s aging industry and regional economy development coordination index from 2009 to 2019, this study compared the kernel density maps of the coordination index in 2009, 2014, and 2019 (Figure 7). In general, the kernel curve basically remained unchanged, indicating that the coordination level of aging industry and regional economy development did not change significantly; from the distribution shape, the right tail is longer, indicating that there are obvious regional differences in the coordination index. From 2009 to 2014, the peak value became higher, from single peak to double peak, and the width became larger. Therefore, the difference in the coordinated index of provinces became larger during the period, and polarization was intensified. From 2014 to 2019, the peak value became lower, the double peak turned into a single peak, and the width of the curve narrowed, indicating that the differences and polarization were lessened to some extent.

5. Analysis of Influencing Factors of Coupling Coordination

According to the first law of geography, all things are related, and the closer the distance, the greater the connection [35]. Since the Dutch economist Paelinck proposed the term “spatial econometrics” in 1975 [36], after the pioneering work of [37,38], etc., the research on spatial correlation and spatial difference finally formed a framework for qualitative spatial metrology. The branch of econometrics that deals with spatial data is called “spatial econometrics” [39]. Nowadays, spatial econometrics is widely recognized as a mainstream applied econometrics research method and is applied in many fields, such as urban economics, regional economics, real estate economics, and economic geography.
China has a vast territory, and the economic development of the east–west and the north–south is obviously different. The relationship between the aging industry and economic development in a region is also affected by other regions. But traditional econometric methods only consider the linear structure without considering the spatial factors. Utilizing traditional econometric methods to study relationship concerned with spatial factors will easily lead to deviations in the model estimation results. Therefore, it is necessary for us to further explore whether the coordinated development of the aging industry and regional economy in China is affected by neighboring regions. If there is an impact, what are the factors which affect the coordinated development and the extent of the impact? To this end, we introduce spatial correlation analysis to conduct a comprehensive analysis.

5.1. Selection and Description of Variables

The theme of this study is the coordinated development of the aging industry and the regional economy. Therefore, based on the previous indicator system and calculation results, the coordination index D is selected as the explained variable, denoted as (CID); the explanatory variables are selected from the evaluation indicators of the aging industry and regional economy described in the above sections. Above all, among these indicators, indicators with large absolute values not only have relatively large fluctuations, but also have a large degree of dispersion. Therefore, to reduce the possible heteroscedasticity and the difference between the estimated coefficients, the logarithm is used for the index variables with large absolute values; secondly, the variables with severe multicollinearity are eliminated through the VIF test, and finally, nine explanatory variables are obtained:
FROG = proportion of local fiscal revenue of GDP
FAOG = proportion of investment in fixed assets of GDP
LnPCG = logarithm of per capita GDP
ODR = elderly dependency ratio
LnIP = logarithm of the number of people insured in the basic pension insurance
LnINS = logarithm of the number of elderly care institutions
LnBED = logarithm of elderly care beds per one thousand people
EDU = the proportion of elderly care service personnel with college and above
OYR = the ratio of old and young
The descriptive statistics of each variable are shown in Table 5.

5.2. Spatial Correlation Analysis

In order to test the spatial correlation of each variable, we use Stata software to calculate the global Moran’s index and Geary’s C index for verification. For various spatial weight matrices commonly used at present, the geographic distance (latitude and longitude, inverse of geographic distance) spatial weight matrix w1 is selected for calculation, ** and the results are shown in Table 6.
Table 6 indicates that from 2009 to 2019, the Moran indices of the coordination indices of China’s provinces all passed the 1% significance test, and the Geary C index mostly passed the 1% significance test. The Moran index values were all greater than 0, and the Geary C index values were all less than 1, indicating that the overall coordination between the aging industry and regional economy in various provinces manifested positive spatial autocorrelation characteristics.
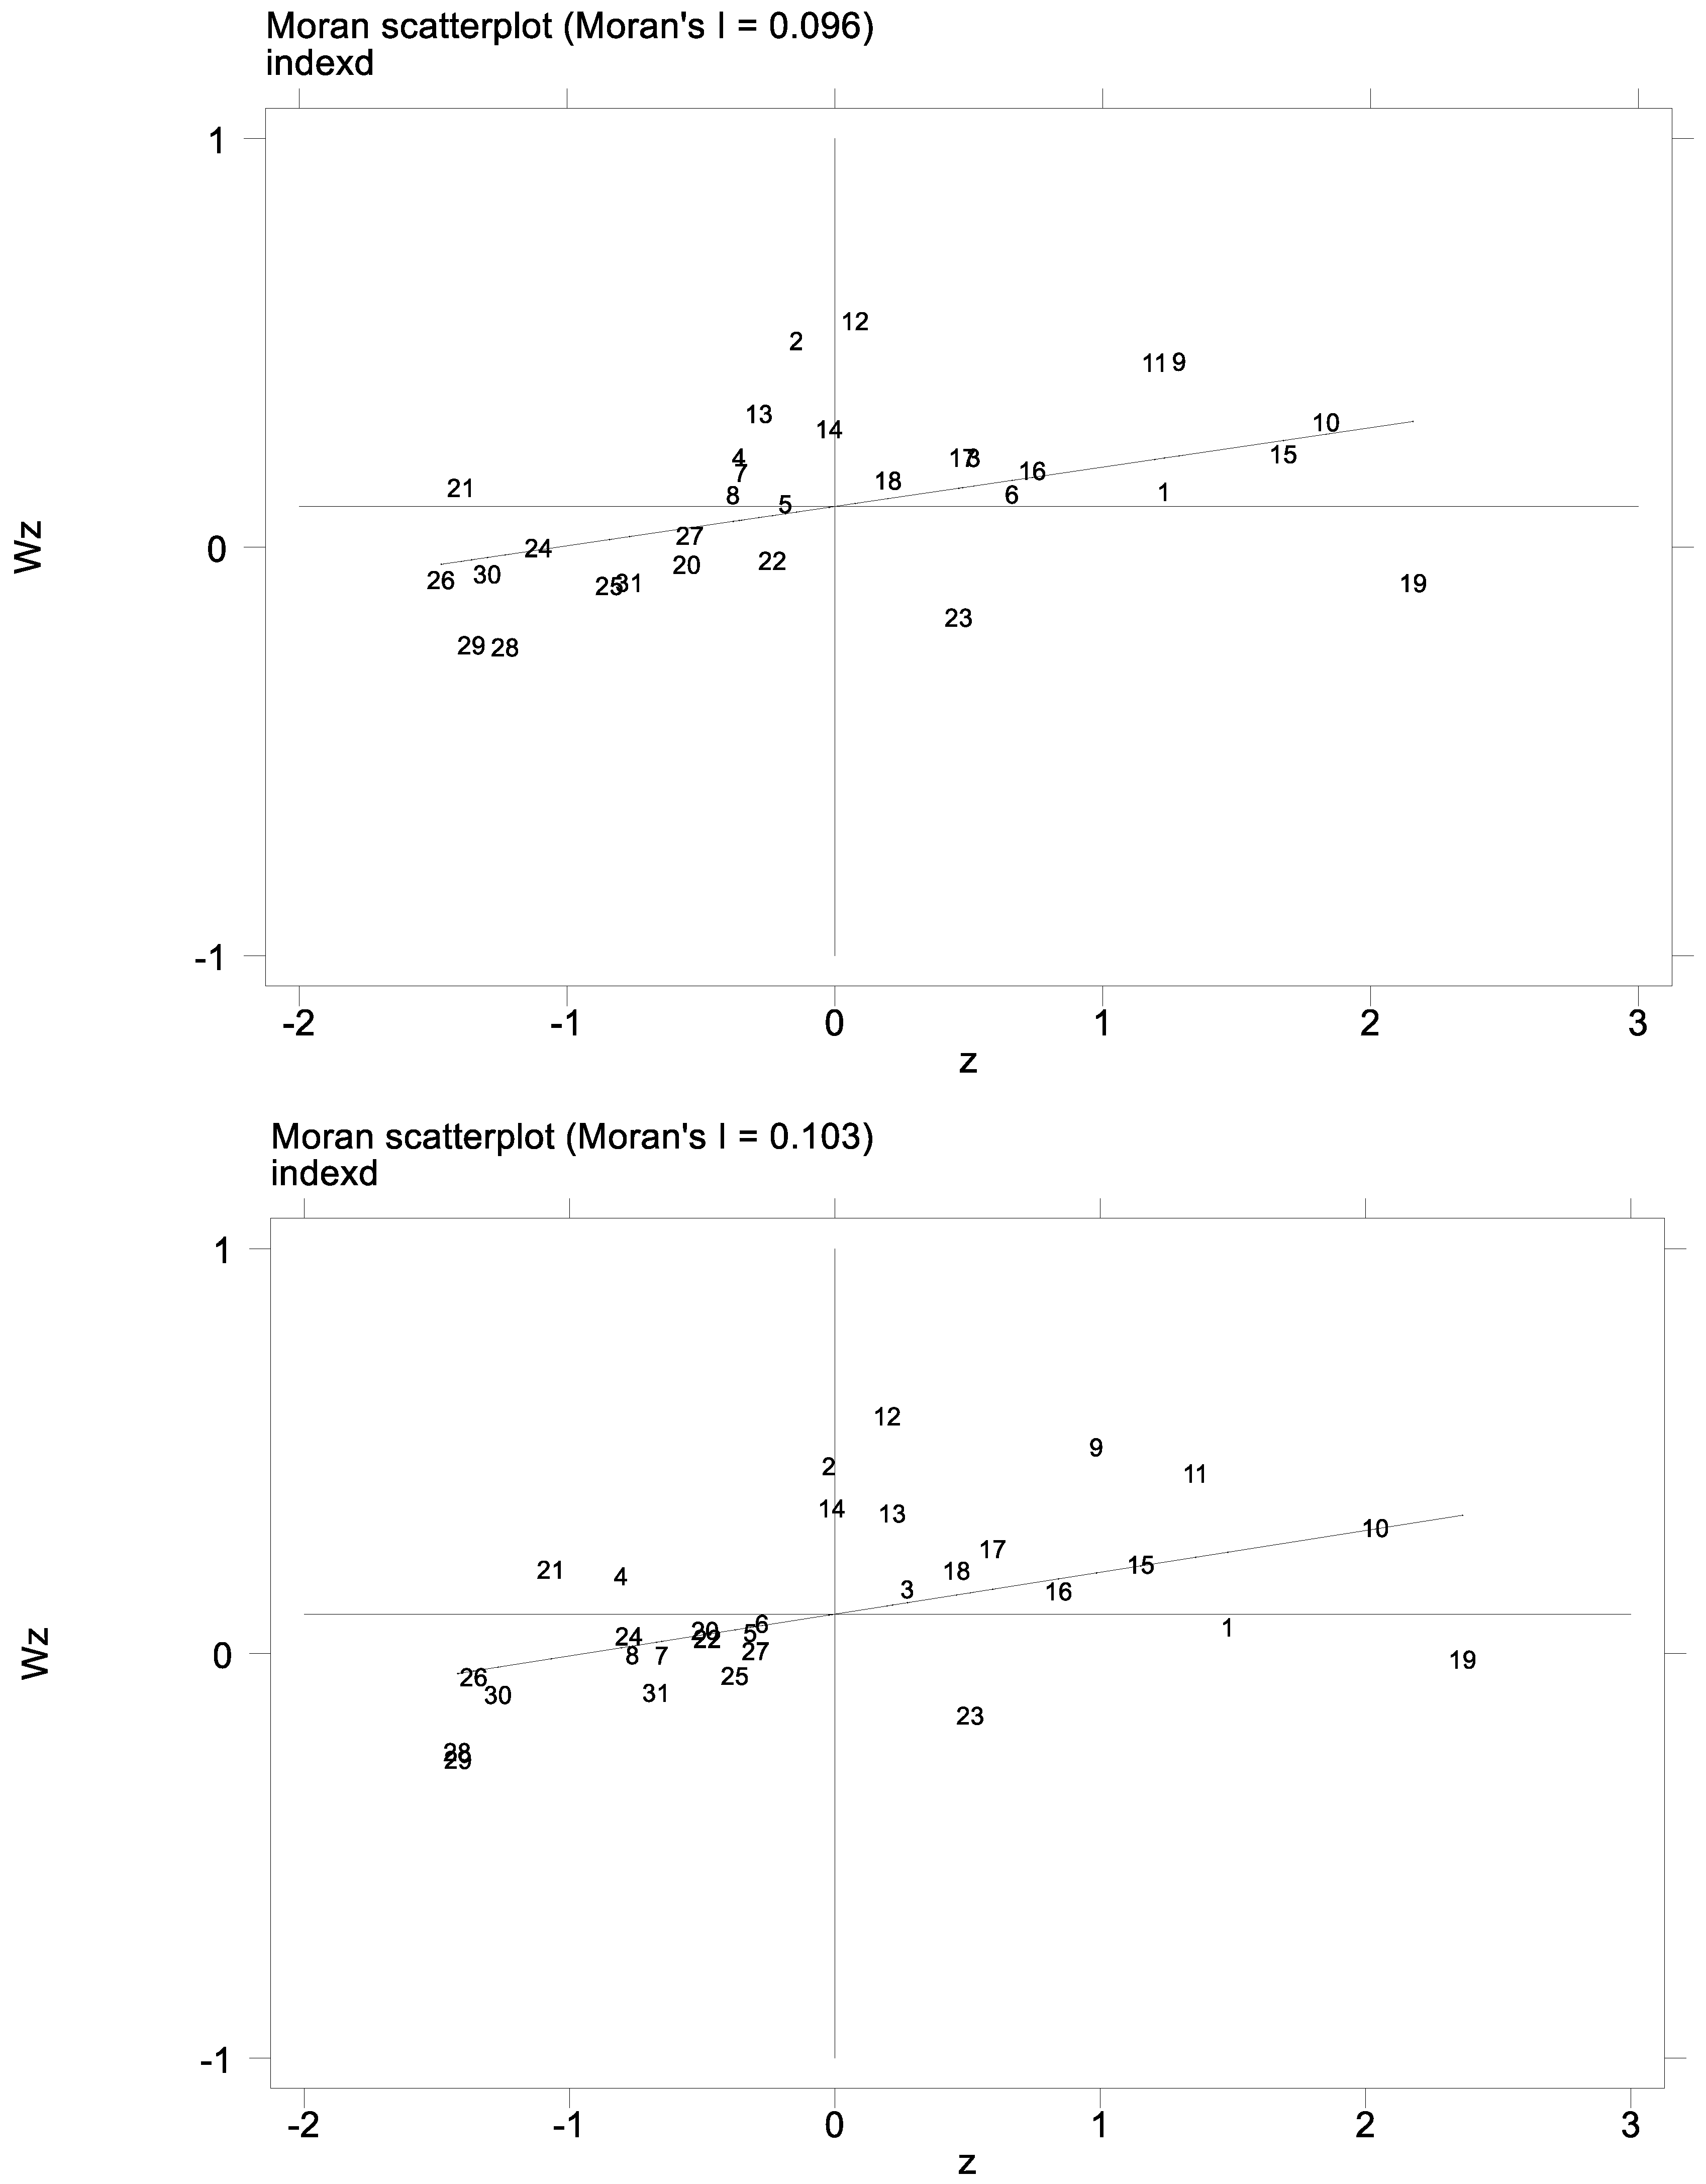
From the Moran scatter plot of the coordination index in 2009 and 2019 (Figure 8), most provinces were concentrated in the first (HH) and third (LL) quadrants, that is, showing high and low aggregate characteristics. From 2009 to 2019, the number of provinces falling into the first and third quadrants increased, indicating that the spatial correlation of the coordination index was gradually significant. Figure 8 also indicates that the developed provinces in the eastern and central regions fell into the first quadrant with high coordination(HH), while most of the western provinces fell into the third quadrant with low coordination (LL) (see Table 7 for the region codes).

5.3. Model Constructing and Testing

5.3.1. Model Constructing

Due to the obvious spatial correlation between coupling and coordination indices of various provinces and municipalities, referring to relevant experience [39], the general expression of the spatial panel model is as follow:
Y i t = ρ j = 1 n w i j Y j t + β X i t + δ j = 1 n w i j X j t + u i + γ t + ε i t
ε i t = λ j = 1 n w i j ε i t + v i t
The explained variable Y i t is the coupling coordination index between the aging industry and regional economy development in the i region in year t; ρ   is the spatial autocorrelation coefficient of the explained variable; X i t is the set of explanatory variables in the i region in year t; β is the regression coefficient of the explanatory variable; δ is the spatial autocorrelation coefficient of each explanatory variable; w i j is the spatial weight matrix element; u i and γ t are the spatial and temporal fixed effects, respectively; ε i t represents the random disturbance termis; λ is the spatial autocorrelation coefficient of each disturbance term; when λ = 0, the above model is transformed into a spatial Durbin model; when λ   = 0 and δ = 0, the model is transformed into a spatial autoregressive model (SAR); when ρ   = 0 and δ = 0, the model is transformed into a spatial error model (SEM).

5.3.2. Model Testing

Because the panel data in this study are about 31 selected provinces (municipalities) from 2009 to 2019, which belongs to short panel data, the unit root test is not needed. Through the LM test results, we found that the three tests for spatial error all rejected the null hypothesis of “no spatial autocorrelation”, and the two tests for spatial lag one rejected the null hypothesis. These results once again demonstrate that spatial econometric analysis should be utilized [40].
The spatial panel model is generally divided into two types: random effect and fixed effect. According to the results of the Hausman test, the null hypothesis is rejected, indicating that there are significant differences between individual coefficients. Therefore, it is better to choose the fixed effect model. Since there are different types of spatial econometric models, LR and Wald tests are utilized to make choices. The results of LR (p value) obviously reject the null hypothesis, indicating that the SDM model cannot degenerate into the SAR and SEM models, and the results of the Wald test also basically support the test results of the LR (see Table 8 for detailed results).
Through the above tests, this study finally chooses the fixed effects of the optimal SDM for spatial econometric analysis.

5.4. Empirical Results Analysis

The analysis of fixed effects in spatial measurement includes three forms: spatial fixed, temporal fixed, and spatial and temporal double fixed. According to the estimation results of the SDM model in Table 9, the spatial correlation under the spatial fixed effect passed the significance test, the R-square result is 0.3448, and the log-likelihood value is large, so the model has a high degree of fit with high reliability. This study will conduct a comprehensive analysis based on the estimation results of the spatial fixed effects model.

5.4.1. Model Results

In Table 9, the spatial autoregression coefficient of the explained variable (coordination index) ρ = 0.515 is a positive value, and the p value is significant at the 1% level, indicating that the explained variable has a positive spatial spillover effect on itself, which is completely consistent with the above-mentioned results verified by the Moran index, that is, the coordinated development of the aging industry and the regional economy in this region promotes the coordinated development of surrounding areas. From the statistical results of column Main (indicating the influence of explanatory variables on the explained variables in the same region), the coefficients of the ratio of old and young (OYR) and the ratio of old-age dependency (ODR) are negative, and reach the 1% level of significance, indicating that the two variables have a negative impact on the coordination index of the aging industry and regional economy in the region, that is, the smaller these two variables are, the more the regional coordination index will increase. Because these two variables are important indicators of population aging, the smaller the indicator’s value, the lower the degree of aging in the region, and the less pressure on the aging industry. The result also supports the rationality of the inverse index in the evaluation index system table of regional economy development level (see Table 1). The coefficients, the proportion of local fiscal revenue (FROG), the proportion of fixed asset investment (FAOG), the logarithm of per capita GDP (LnPCG), the logarithm of old-age beds per one thousand person (LnBED), and the proportion of senior college and above pension service personnel (EDU), are positive and passed the 1% significance test, indicating that these variables have a significant positive impact on the coordinated development of the aging industry and the regional economy in the region.
From the statistical results of column Wx (which represents the spatial lag term of the explanatory variable), the logarithm of per capita GDP (LnPCG) and the elderly dependency ratio (ODR) reached the 1% level of significance, the proportion of elderly care service personnel with college and above (EDU) reached the 5% level of significance, the proportion of local fiscal revenue (FROG) and the ratio of old and young (OYR) reached the 10% level of significance, indicating that these variables have obvious spatial effect characteristics. Among them, variables FROG, LnPCG, EDU and OYR have a negative conduction effect on the explained variables in the surrounding areas, while the variable ODR has a positive conduction effect on the surrounding areas. In other words, high local fiscal revenue, high per capita GDP, high quality of elderly care service personnel, and low dependency ratio of the elderly population play a positive role in promoting local economic growth, which will attract various resources (labor population, capital, etc.) from neighbor areas to flow into the discussed area. It will have an adverse impact on the economic development of its neighbor, and then negatively affect the coordinated development of its neighbor.

5.4.2. Spatial Effect Decomposition

In the analysis of spatial econometric models, regression coefficients are unable to fully and accurately reflect the spatial spillover effects of explanatory variables, because the regression coefficients include direct effects and indirect effects, and the coefficients of the spatial lag terms of explanatory variables will also impact the indirect effects [41]. Many scholars regard the estimated coefficient of the spatial lag variable as the “spatial spillover effect” of the variable, which easily causes misjudgment.
Therefore, based on the method of LeSage and Pace, this study reveals the influence of each explanatory variable on the coordination index of the aging industry and regional economy development through direct effects, indirect effects, and total effects [42]. The direct effect represents the average impact of the explanatory variable on the explained variable (coordination index) in the region, the indirect effect represents the average effect of the explanatory variable on the explained variable (coordination index) in other regions, and the total effect represents the average effect of the explanatory variable on the explained variable (coordination index) in all regions. Table 10 shows the estimated results of the direct and indirect effects.
From the results in Table 10, the direct effect coefficients of ODR and OYR are negative, and both reach the 1% level of significance, indicating that the population aging has a significant negative impact on the coordinated development of the aging industry and the regional economy in the region. The higher the indexes, the more restrictive the coordinated development of the region. Moreover, the ODR has a significant (5% level) spatial spillover effect, which has a positive impact on the coordinated development of the neighbor regions. The possible explanation is that the increase of dependency ratio of the local elderly population will restrict local economic development, resulting in the outflow of labor and capital into its surrounding areas. Therefore, the level of coordination between the aging industry and economic development in the surrounding areas will be promoted.
The direct effect coefficients of FROG, FAOG, LnPCG, LnBED, and EDU are positive, and all passed the 1% significance test (EDU is 5% significance), indicating that these factors significantly affect the development of the aging industry and regional economy in its own region. Among these coefficients, LnPCG, EDU, and OYR significantly inhibit the coordinated development of the aging industry and regional economy in neighboring areas through indirect effects.

6. Conclusions

This study investigated the law, distribution characteristics, and changing trend of the coordinated development of China’s aging industry and regional economy, and the factors which affect the degree of coordination between the aging industry and economic development on the provincial level. In doing so, we constructed a comprehensive evaluation index system of the aging industry and regional economy development, introduced a coupling model based on the entropy weight method, and measured the coupling and coordinated development level of the two systems using data of 31 selected provinces (municipalities) in China from 2009 to 2019. The comprehensive analysis of the study reached the following conclusions:
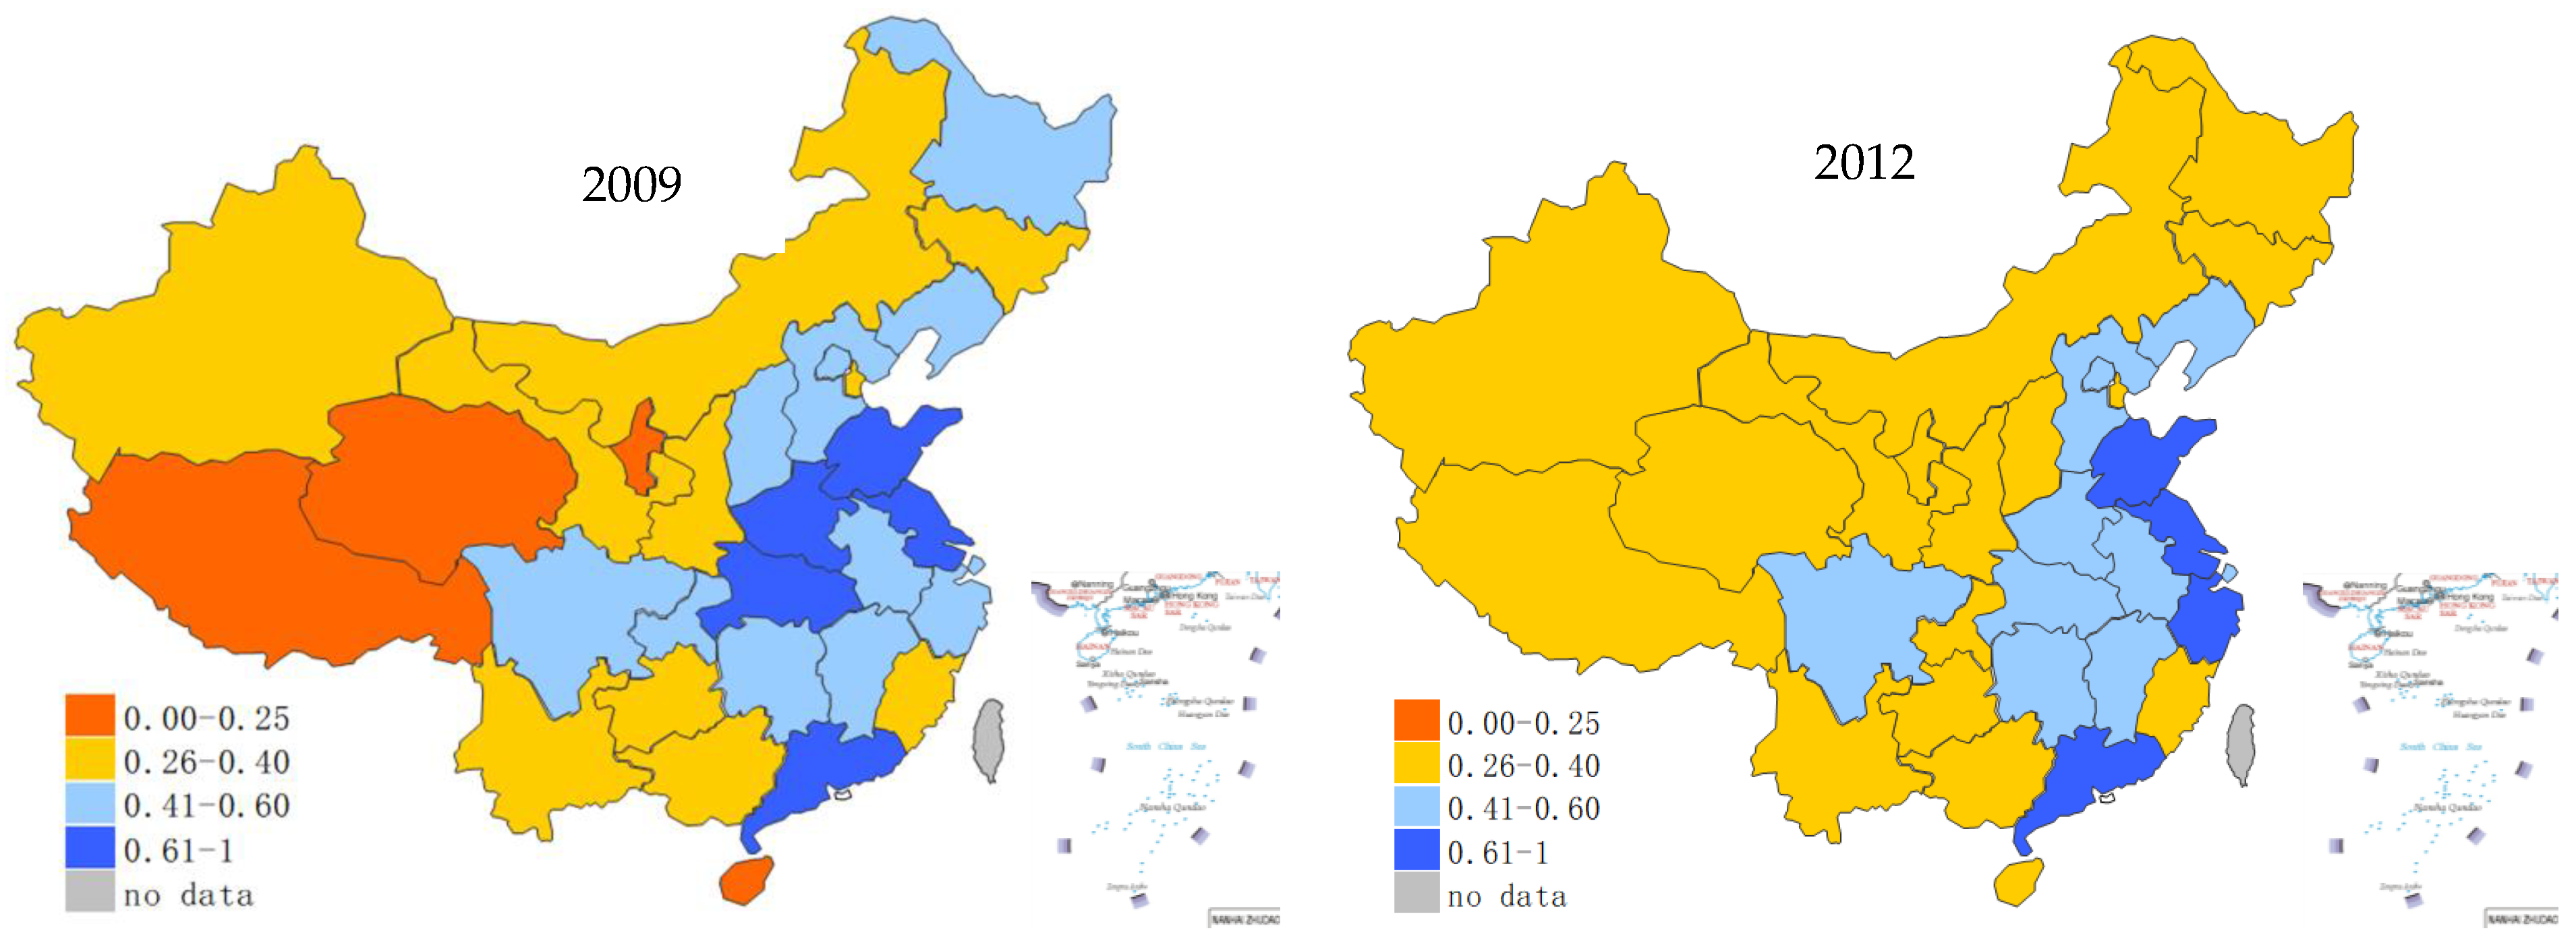
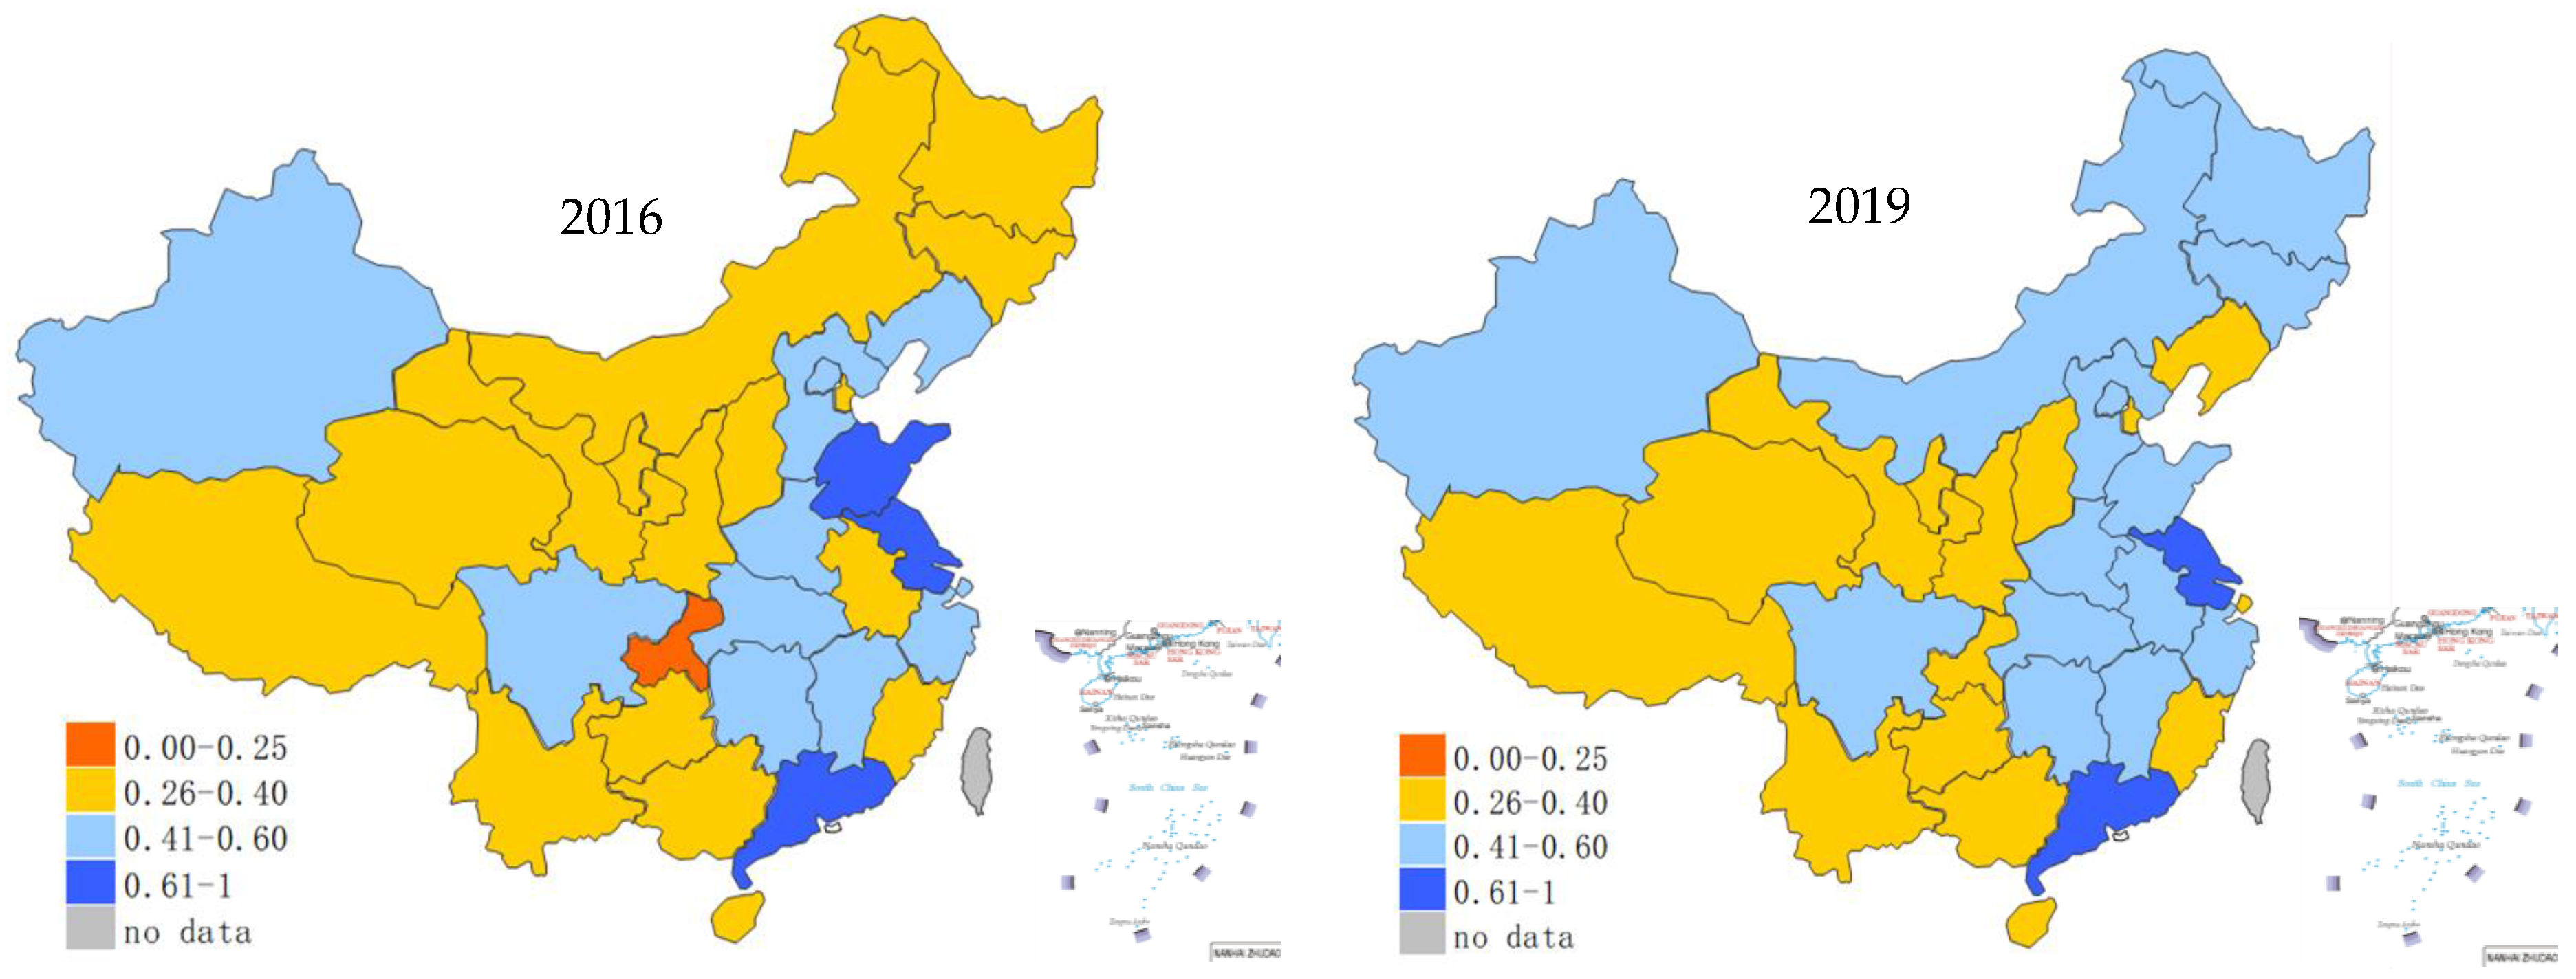
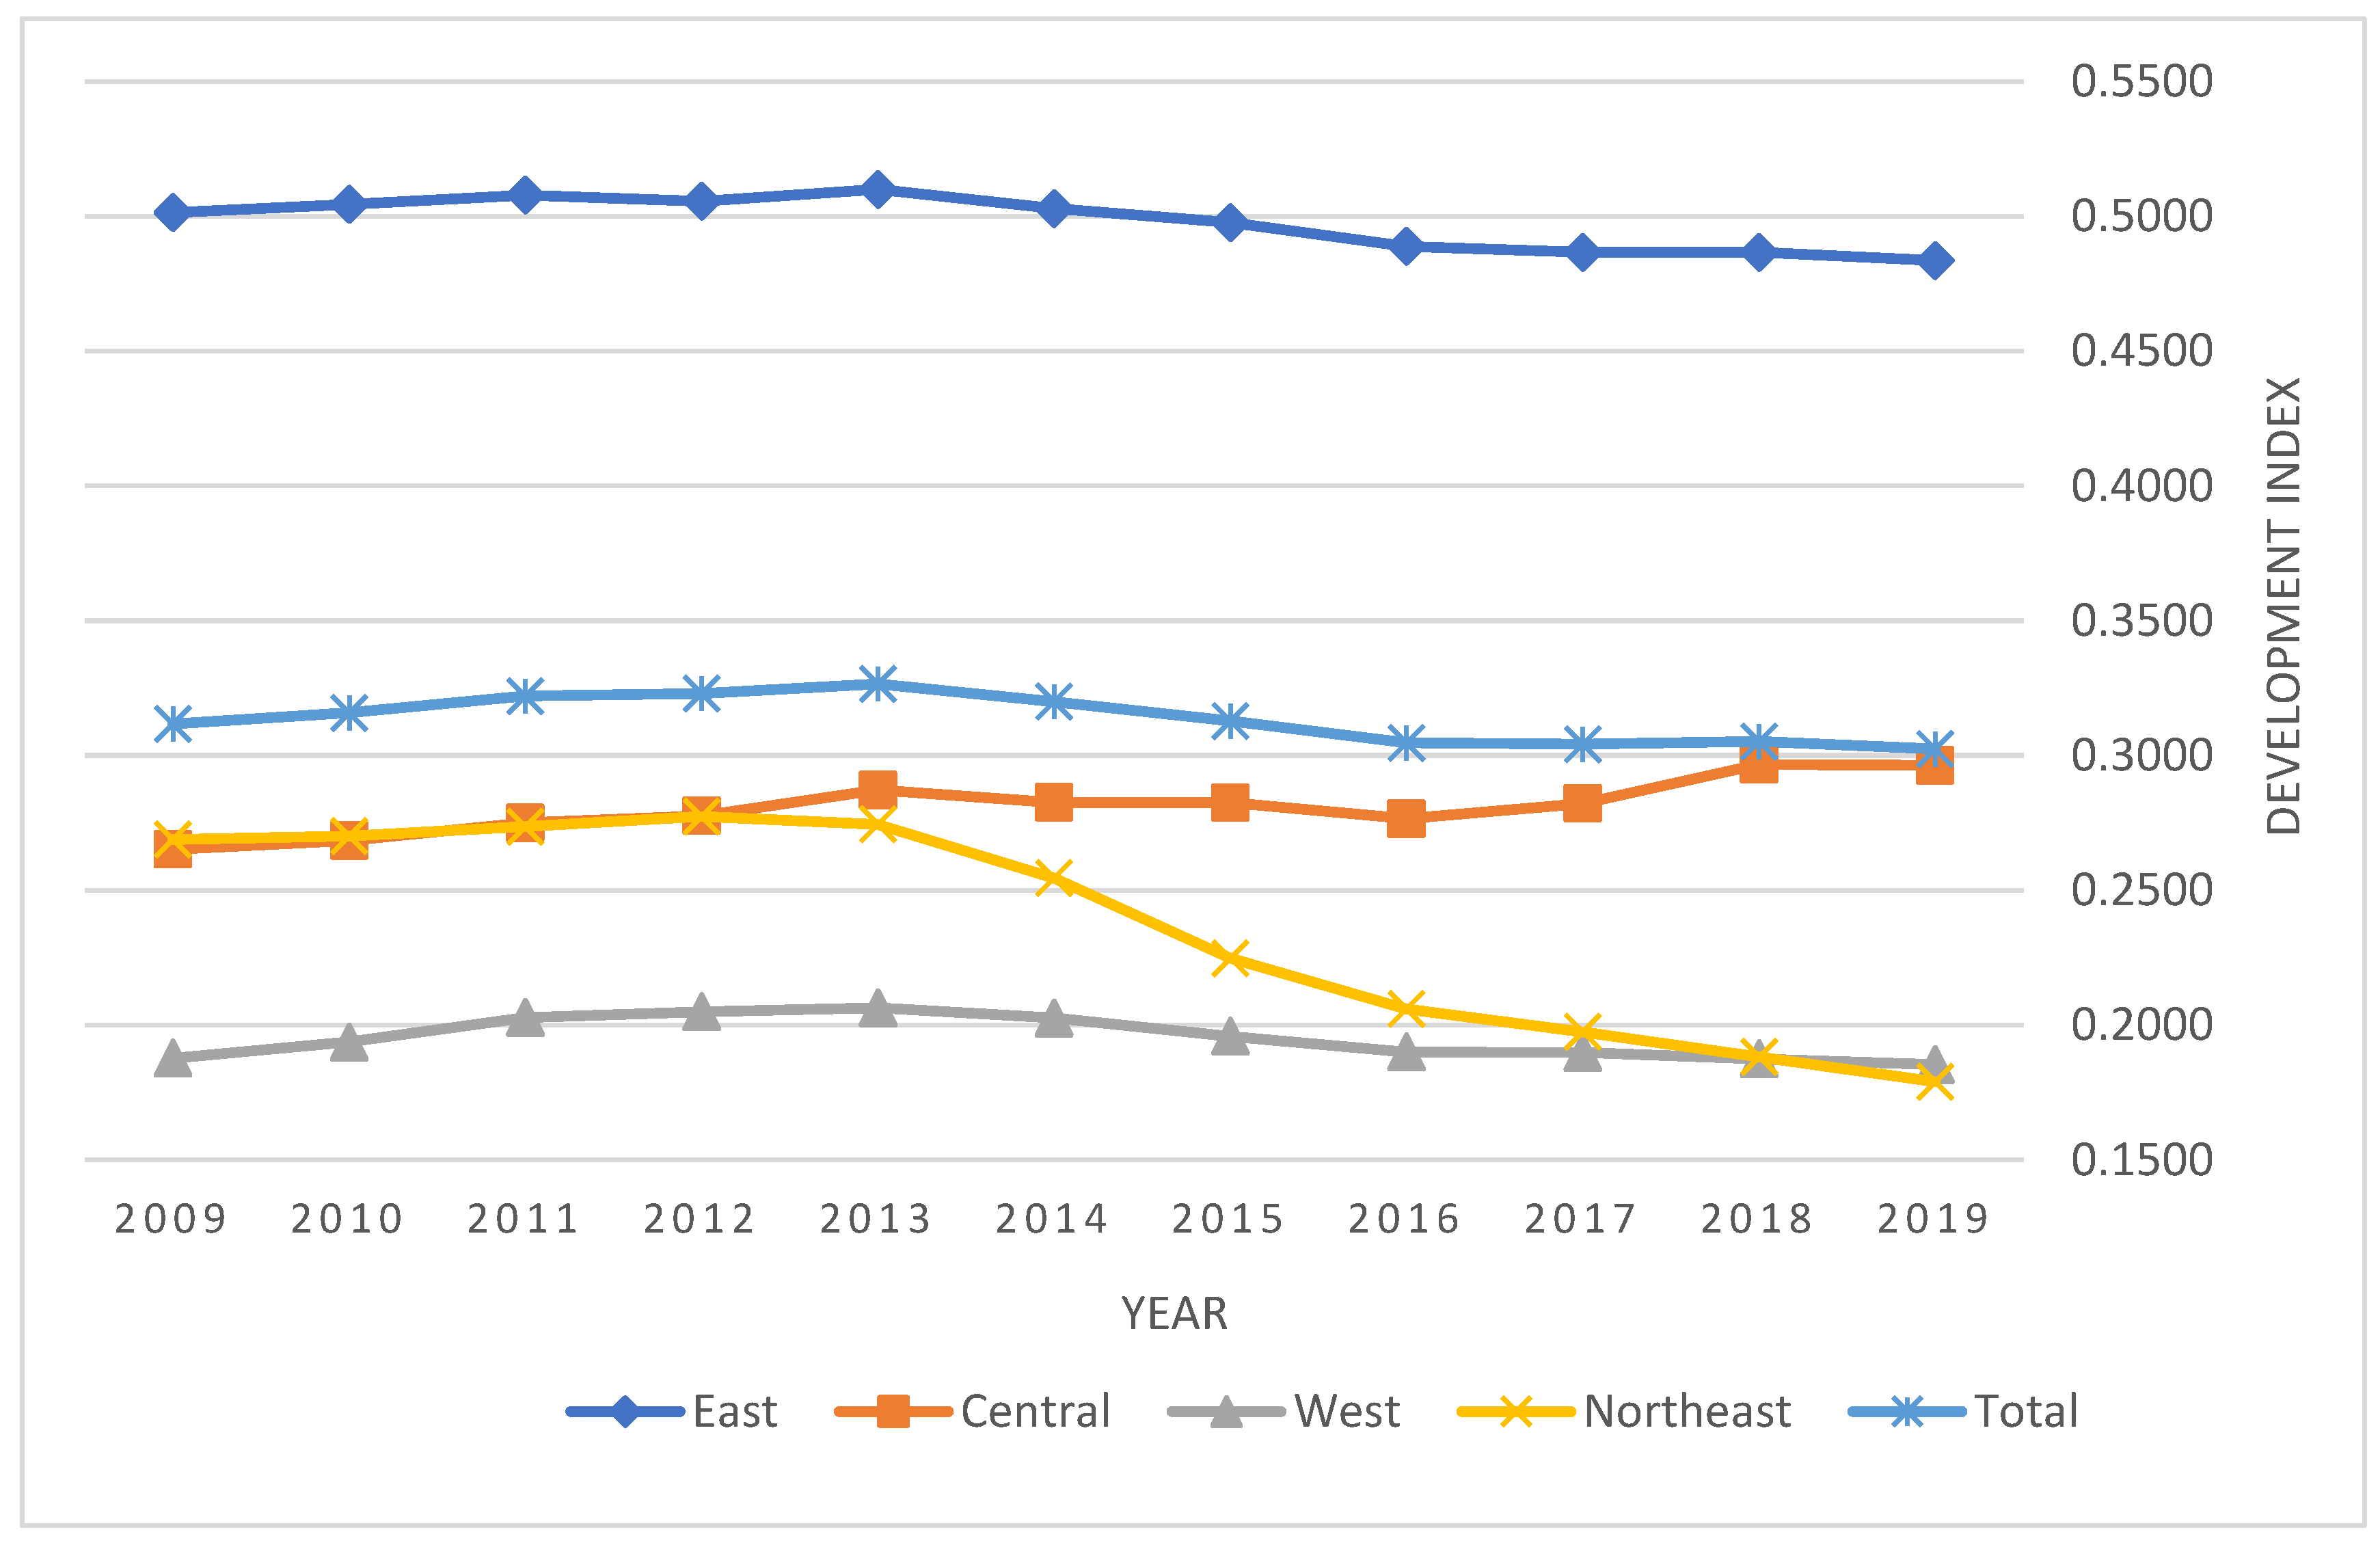
Firstly, China’s aging industry developed unevenly. In the eastern and central regions, the aging industry was more developed than the national average. There were significant regional variations in the aging industry. In recent years, the regional differences narrowed, indicating that the development of the aging industry in underdeveloped regions accelerated.
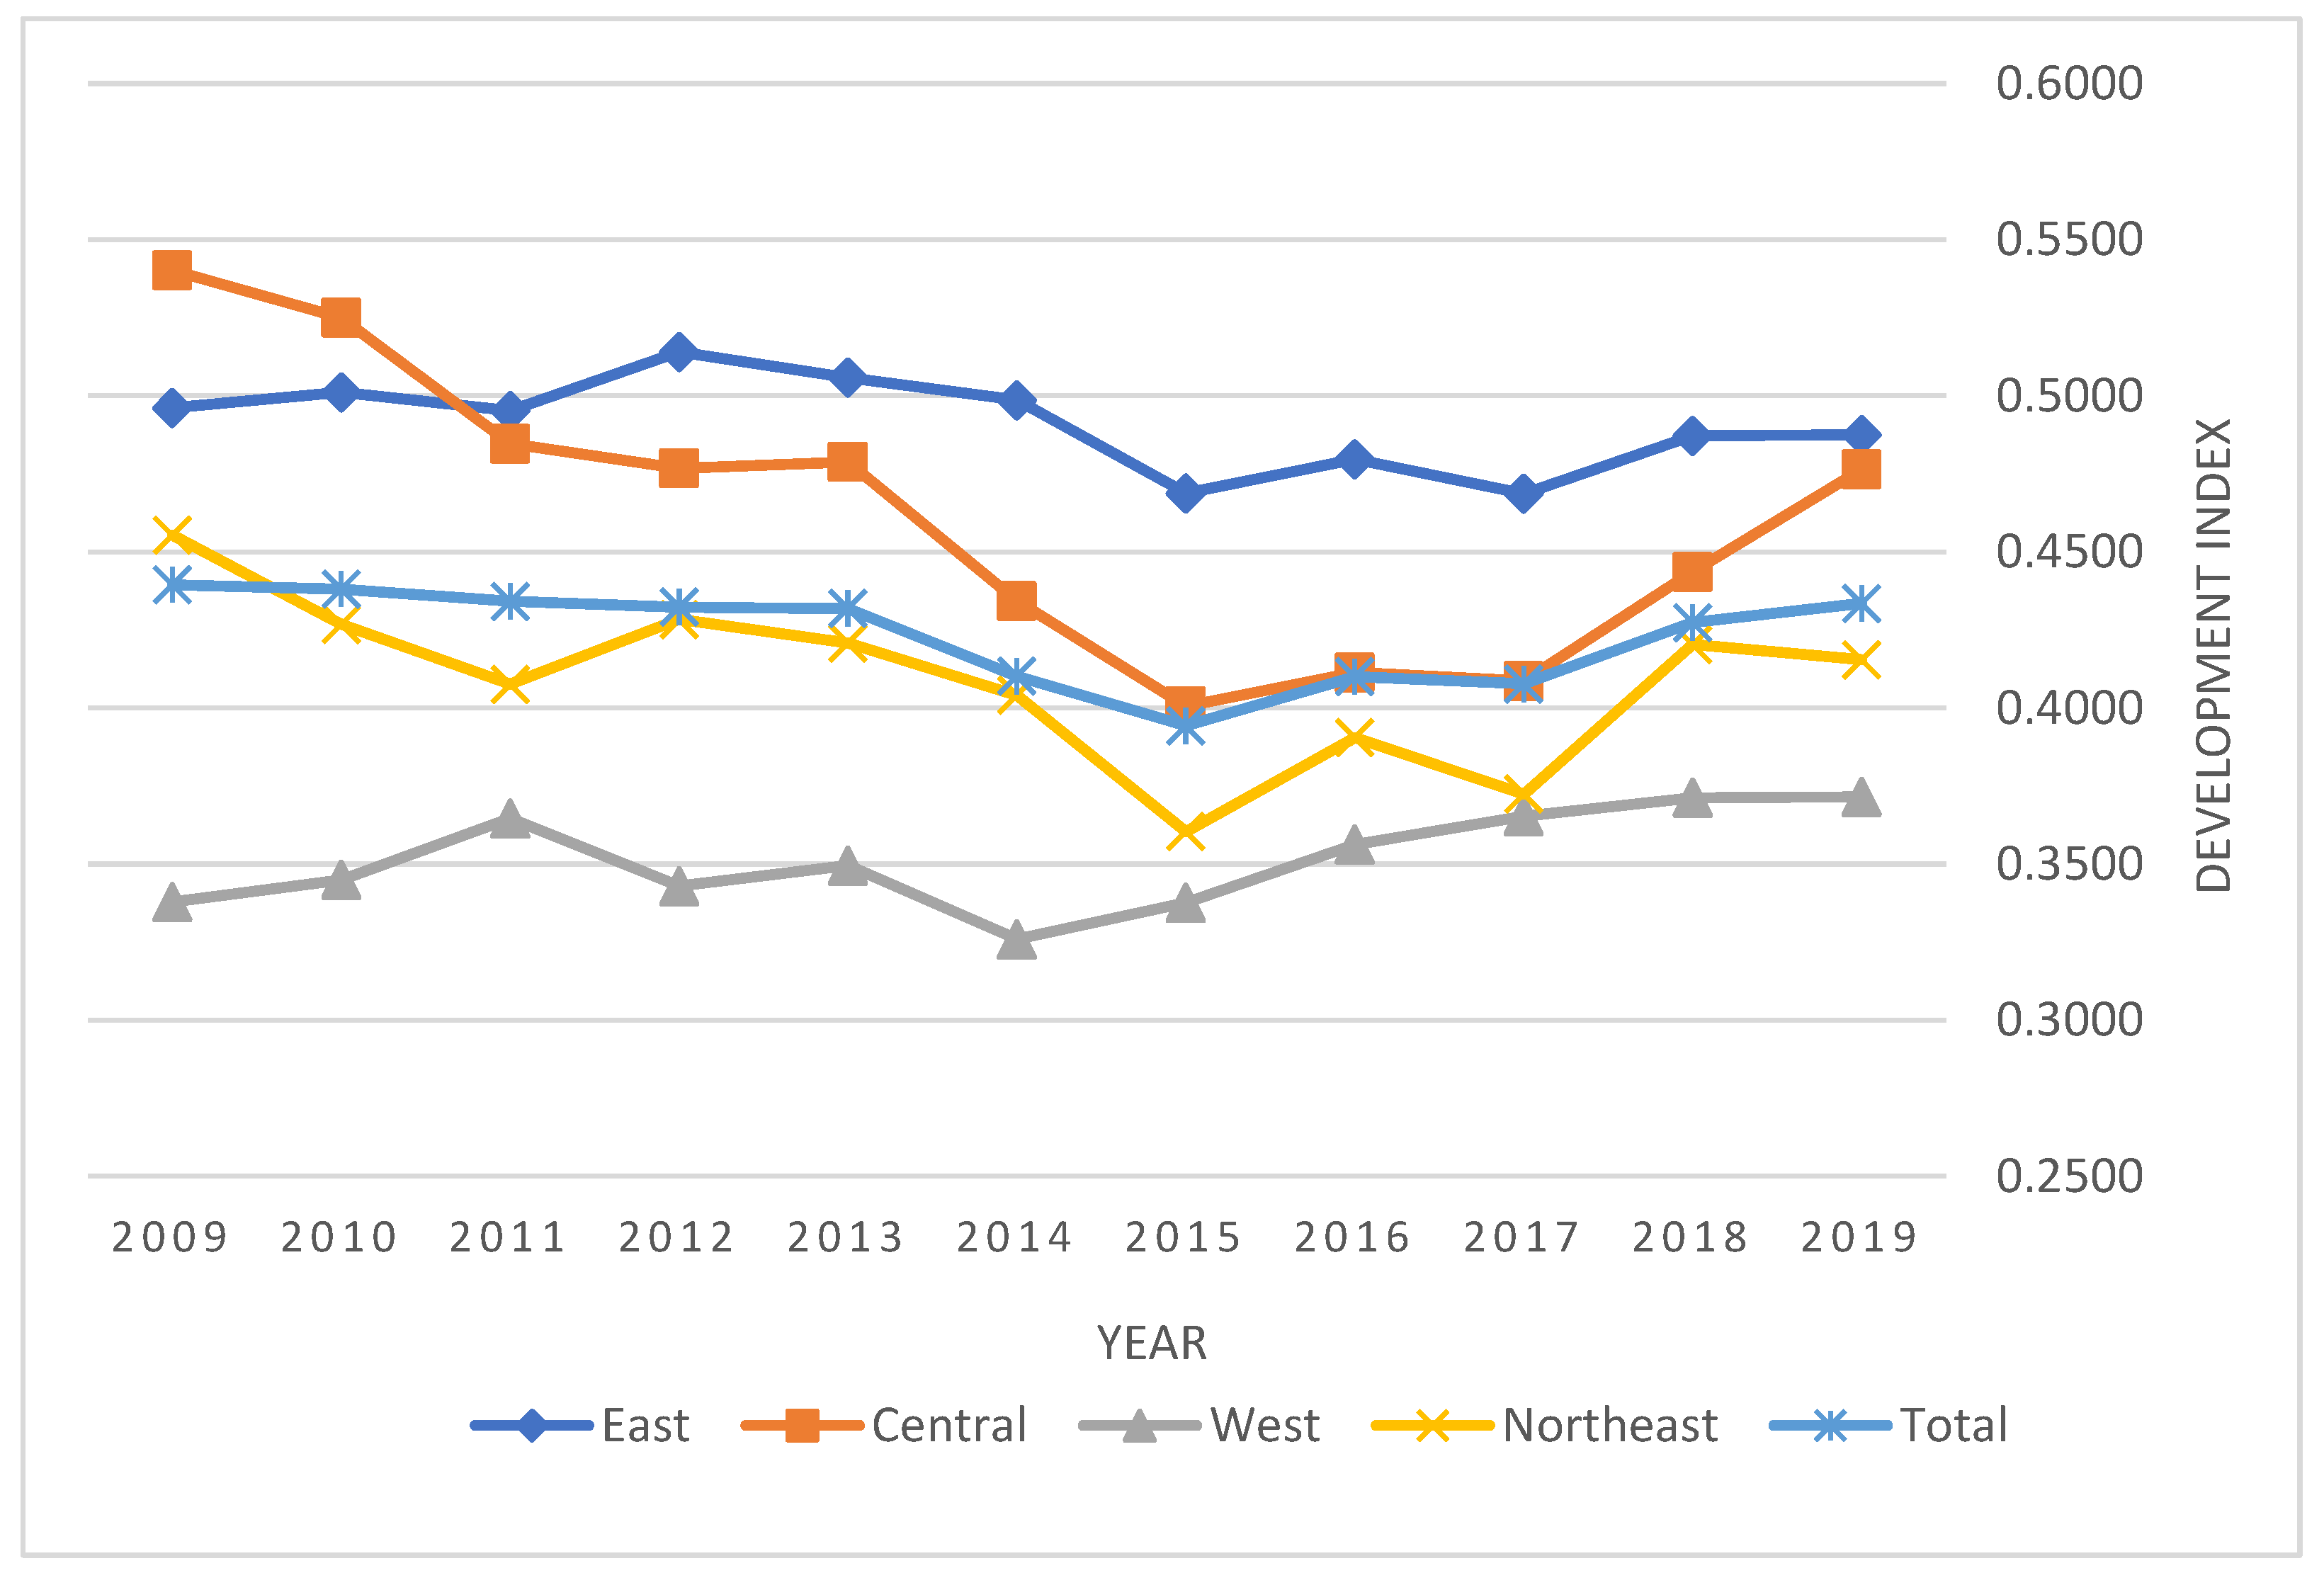
Secondly, China’s eastern region had the highest level of development, far exceeding those of other regions. The economy of the northeast region has declined since 2014, and there was still no sign of improvement. Moreover, the differences in regional economy development widened, and the polarization increased.
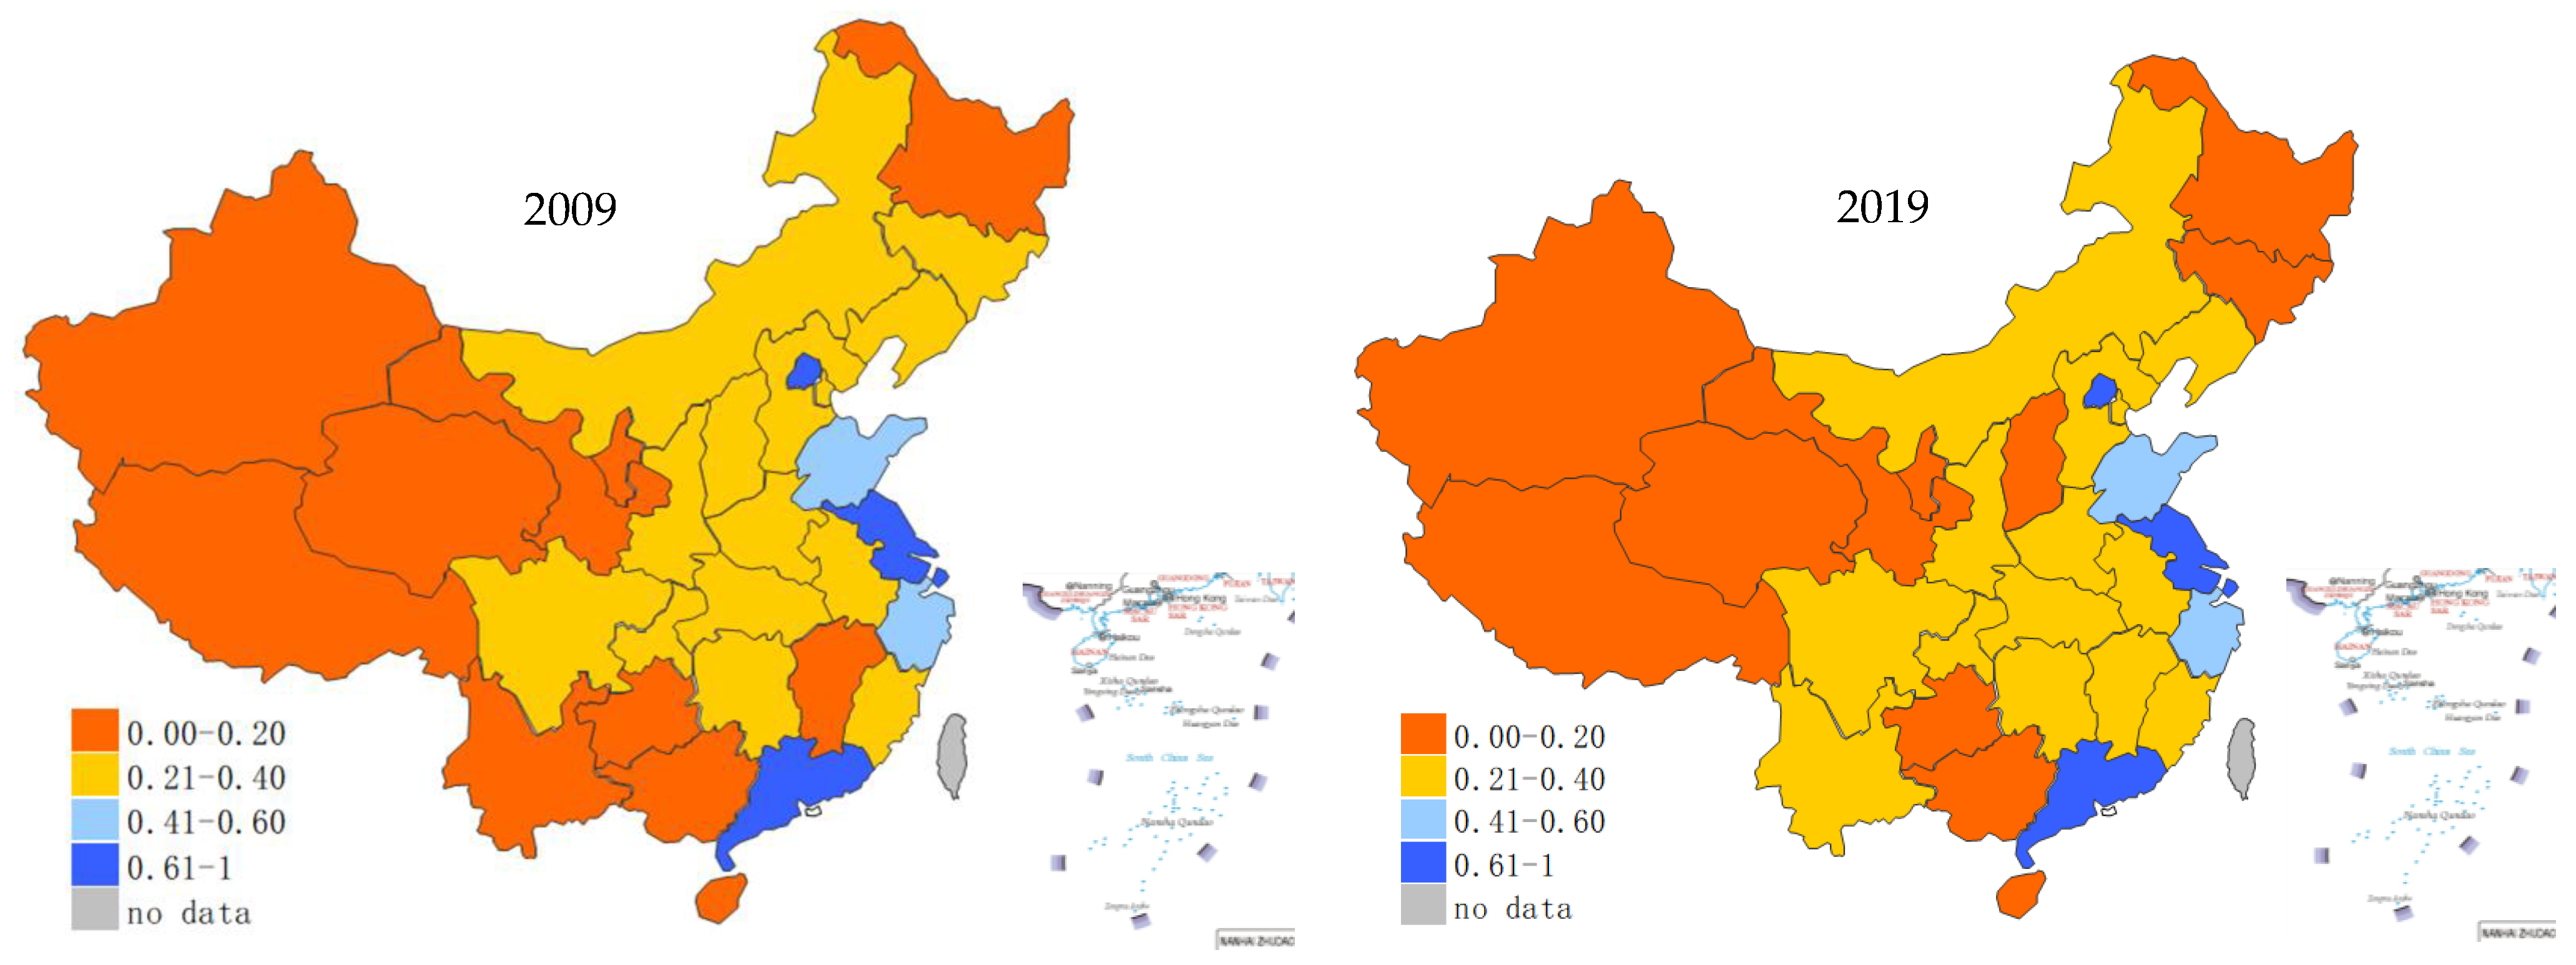
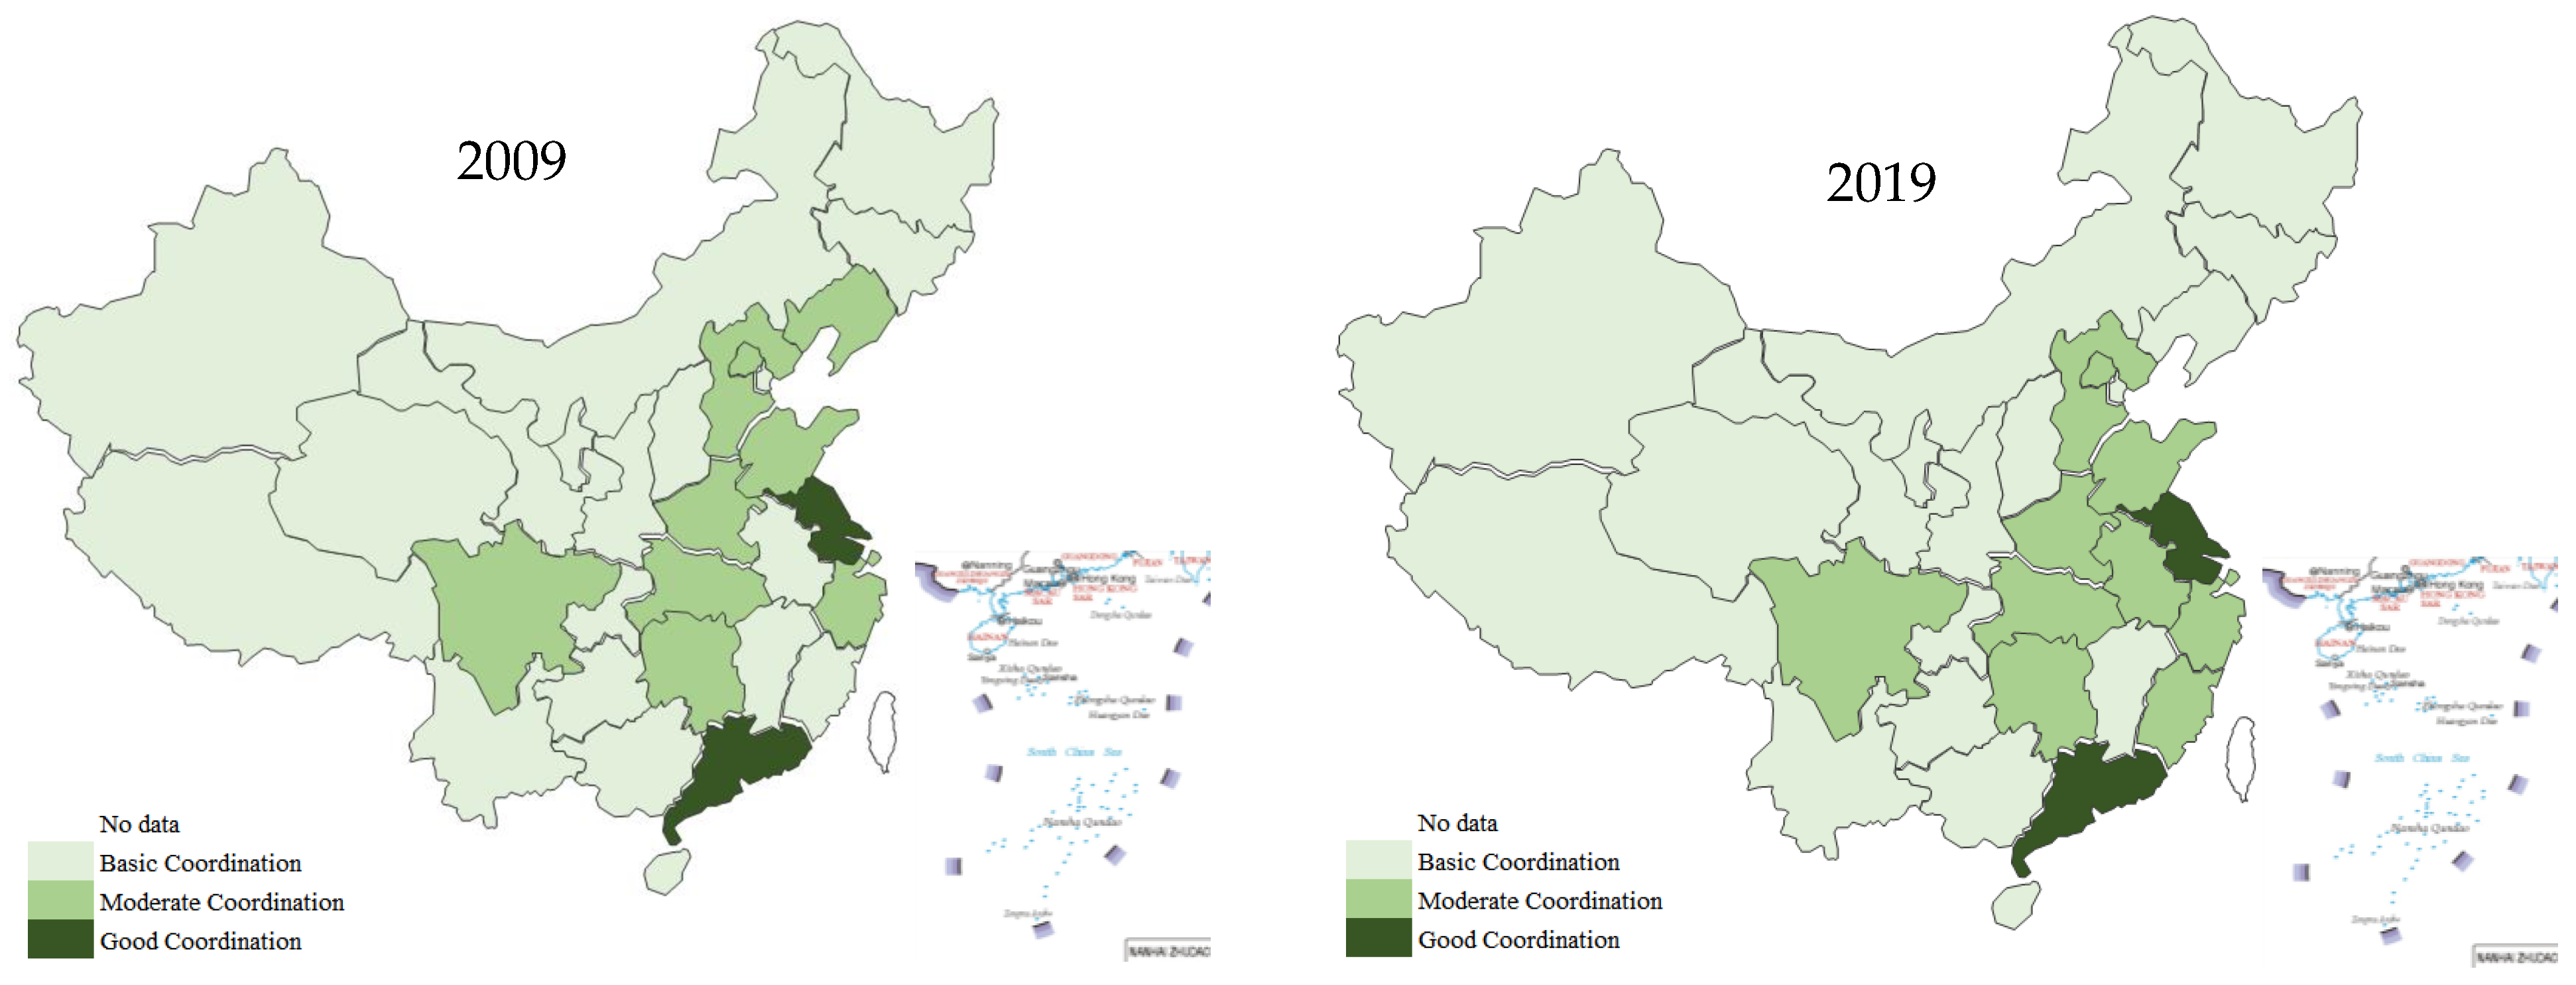
Thirdly, the coordination between the aging industry and regional economy development in all provinces is good, and there is no imbalance, but the quality of the overall coordinated development is not high. The western region has the lowest level of coordinated development, and the coordination level of the northeast region gradually decreased.
Fourthly, a variety of socioeconomic and demographic factors affect the coordinated development of the aging industry and the regional economy, including local fiscal revenue, fixed asset investment, per capita GDP, elderly care beds, quality of elderly care service personnel, elderly dependency ratio, and the old-to-young ratio.
Finally, we found that the characteristics of spatial correlation became high–high and low–low agglomerations. Moreover, the coordinated development of the aging industry and the regional economy in a region can promote the coordinated development of its neighbor regions. Per capita GDP, the dependency ratio of the elderly population, the quality of elderly service personnel and the old-to-young ratio have obvious spatial transmission effects, especially the dependency ratio. The increase in the dependency ratio in one region will promote the coordinated development of its neighbor regions.
To support its aging population, China needs take actions in the following aspects:
Above all, to enhance policy and financial support to less developed regions, such as the western region and northeast region, and prevent further polarization of regional economic development.
In addition, in view of the spatial non-equilibrium distribution characteristics of the coordination between the aging industry and economic, especially the low coordination phenomenon in the western region, a differentiated development strategy should be developed to support low coordinated regions.
What is more, to improve the population structure and the quality of the population. To this end, the adjustment of the fertility policy and the implementation of the delayed retirement policy are conducive to the optimization of the age structure of the population (that is, to reduce the old-to-young ratio and the dependency ratio of the elderly), which in turn significantly promotes the coordination of regional aging industry and economic development. The improvement of the national education level, especially the education level of the elderly service personnel, will effectively improve the coordination level. Therefore, on the one hand, the government should increase investment in basic education, and on the other hand, it should increase efforts and policy support in the professional training of elderly service personnel.
Fourthly, the increase in local fiscal revenue and investment in fixed assets will also effectively improve the level of coordination. It is necessary to improve the gaps in public infrastructure and basic public services between regions, strengthen the construction of infrastructure, especially elderly care facilities including elderly beds, and make them match the regional economy development, so as to promote the good coordination between the aging industry and the regional economy.

Author Contributions

Conceptualization, Y.H.; methodology, F.X.; software, F.X.; validation, F.X., Y.H. and Q.W.; formal analysis, Q.W.; investigation, F.X.; resources, Y.H.; data curation, F.X.; writing—original draft preparation, F.X. and Q.W.; writing—review and editing, F.X. and Q.W.; visualization, F.X.; supervision, Y.H.; project administration, F.X.; funding acquisition, Y.H. All authors have read and agreed to the published version of the manuscript.

Funding

This work is supported by The National Social Science Foundation Project of China (No.21BJL008).

Institutional Review Board Statement

This study does not require ethical approval.

Informed Consent Statement

Not applicable.

Data Availability Statement

The data presented in this study are available on request from the corresponding author.

Acknowledgments

The authors would like to thank Jamal Khan, all the reviewers and editors for their insightful comments.

Conflicts of Interest

The authors declare no conflict of interest.

Notes

1
From a macro perspective, high-quality development includes stable economic growth, balanced regional development, reasonable industrial layout, and green-sustainable development [5,6]
2
We have to mention, Hongkong, Macao, Taiwan are not included in this study because of the availability of data.

References

  1. NBS. Seventh National Census Communique; China Statistics Press: Beijing, China, 2021. (In Chinese) [Google Scholar]
  2. Di, X.; Wang, L.; Yang, L.; Dai, X. Impact of Economic Accessibility on Realized Utilization of Home-Based Healthcare Services for the Older Adults in China. Healthcare 2021, 9, 218. [Google Scholar] [CrossRef]
  3. Wang, Q.; Yang, Y. From Passive to Active: The Paradigm Shift of Straw Collection. Front. Ecol. Evol. 2022, 10, 3389. [Google Scholar] [CrossRef]
  4. The State Council Issued the “14th Five-Year Plan” National Old-Age Cause Development and Old-Age Service System Plan [N]. Xinhua Daily Telegraph, 2022-02-22(001). (In Chinese)
  5. Geng, B.; Zhang, X.; Liang, Y.; Bao, H.; Skitmore, M. Sustainable land financing in a new urbanization context: Theoretical connotations, empirical tests and policy recommendations. Resour. Conserv. Recycl. 2018, 128, 336–344. [Google Scholar] [CrossRef] [Green Version]
  6. Wang, Q.; Dogot, T.; Yang, Y.; Jiao, J.; Shi, B.; Yin, C. From “Coal to Gas” to “Coal to Biomass”: The Strategic Choice of Social Capital in China. Energies 2020, 13, 4171. [Google Scholar] [CrossRef]
  7. Pan, Y.; Wang, X.; Ryan, C. Chinese seniors holidaying, elderly care, rural tourism and rural poverty alleviation programmes. J. Hosp. Tour. Manag. 2021, 46, 134–143. [Google Scholar] [CrossRef]
  8. Fang, E.F.; Xie, C.; Schenkel, J.A.; Wu, C.; Long, Q.; Cui, H.; Aman, Y.; Frank, J.; Liao, J.; Zou, H.; et al. A research agenda for ageing in China in the 21st century (2nd edition): Focusing on basic and translational research, long-term care, policy and social networks. Ageing Res. Rev. 2020, 64, 101174. [Google Scholar] [CrossRef] [PubMed]
  9. Li, Z.; Zheng, X.; Sarwar, S. Spatial Measurements and Influencing Factors of Comprehensive Human Development in China. Sustainability 2022, 14, 5065. [Google Scholar] [CrossRef]
  10. Gu, H.; Jie, Y.; Lao, X. Health service disparity, push-pull effect, and elderly migration in ageing China. Habitat Int. 2022, 125, 102581. [Google Scholar] [CrossRef]
  11. Wang, Q.S. A Humble Opinion on My Country’s Aged Work; Shandong Social Sciences: Jinan, China, 1990; pp. 95–99+90. (In Chinese) [Google Scholar]
  12. Tian, X.L. A comparative study of aging business and aging industry, taking Japan aging business and aging industry as an example. J. Tianjin Univ. Soc. Sci. Ed. 2010, 12, 29–35. [Google Scholar]
  13. Sun, Z.J.; Chen, M. Xi Jinping’s thoughts on high-quality economic development in the new era and its value. Shanghai Econ. Res. 2019, 10, 25–35. [Google Scholar]
  14. Jin, B. Economic Research on “High-Quality Development”. China Ind. Econ. 2018, 4, 5–18. [Google Scholar]
  15. Feng, Q.B. Five Characteristics and Five Ways of China’s High-Quality Economic Development. China Party Gov. Cadres Forum (In Chinese). 2018, 1, 3. [Google Scholar]
  16. Zhao, D.Q. Reflections and Suggestions on Realizing High-quality Economic Development. Ref. Econ. Res. 2018, 1, 7–9+48. [Google Scholar]
  17. Clark, T. Handbook of Social Gerontology. Can. J. Public Health Rev. Can. Sante Publique 1961, 52, 133. [Google Scholar]
  18. Chen, C.; Maung, K.; Rowe, J.W.; Antonucci, T.; Berkman, L.; Börsch-Supan, A.; Carstensen, L.; Goldman, D.P.; Fried, L.; Furstenberg, F.; et al. Gender differences in countries’ adaptation to societal ageing: An international cross-sectional comparison. Lancet Healthy Longev. 2021, 2, e460–e469. [Google Scholar] [CrossRef]
  19. Tamai, T. Economic growth, equilibrium welfare, and public goods provision with intergenerational altruism. Eur. J. Political Econ. 2022, 71, 102068. [Google Scholar] [CrossRef]
  20. Horioka, C.Y. Japan’s public pension system: What’s wrong with it and how to fix it. Jpn. World Econ. 1999, 11, 293–303. [Google Scholar] [CrossRef]
  21. Leff, N.H. Dependency Rates and Savings Rates. Am. Econ. Rev. 1969, 59, 886–896. [Google Scholar]
  22. Liu, G.; Zhang, G. China’s carbon inequality of households: Perspectives of the aging society and urban-rural gaps. Resour. Conserv. Recycl. 2022, 185, 106449. [Google Scholar] [CrossRef]
  23. Otsu, K.; Shibayama, K. Population aging, government policy and the postwar Japanese economy. J. Jpn. Int. Econ. 2022, 64, 101191. [Google Scholar] [CrossRef]
  24. Wu, Y. China Aging Industry Development Report (2014); Social Science Literature Press: Beijing, China, 2014. (In Chinese) [Google Scholar]
  25. Huang, Q.; Li, X.; Li, J. The Impact of Population Aging on Innovation: An Empirical Study Based on China’s Macro and Micro Data. Discuss. Mod. Econ. 2018, 12, 25–32. [Google Scholar]
  26. Li, X.; Chen, Y.; Jiang, X.; Chang, J. Analysis of the Spatial Effect of China’s Population Aging on Economic Growth—Based on the Spatial Durbin Model of Dual Zone System. Popul. Dev. 2020, 26, 85–96. (In Chinese) [Google Scholar]
  27. Hou, M.; Liao, T. Population Aging, Innovation Driven and Industrial Structure Transformation and Upgrading—A Study Based on Spatial Durbin Model. J. Harbin Univ. Commer. Soc. Sci. Ed. 2021, 1, 72–84. (In Chinese) [Google Scholar]
  28. He, Q.; Yang, X. Analysis on the coupling coordination degree of big health industry and elderly care service. Soft Sci. 2019, 33, 45–49. (In Chinese) [Google Scholar]
  29. He, D.; Wang, Z.W. Research on the temporal and spatial evolution of the coupling coordination degree between the pension industry and the regional economy—Taking Jiangsu Province as an example. Manag. Mod. 2019, 39, 16–22. (In Chinese) [Google Scholar]
  30. MCA. China Civil Affairs and Economic and Social Development Statistical Database; China Statistics Press: Beijing, China, 2022. (In Chinese) [Google Scholar]
  31. NBS. China Statistical Yearbook; China Statistics Press: Beijing, China, 2022. (In Chinese) [Google Scholar]
  32. NBS. Statistical Zoning and Urban-Rural Division Codes; Beijing, China, 2021. (In Chinese) [Google Scholar]
  33. Ye, S. Research on the Spatio-temporal Coupling Relationship between China’s Basic Public Services and Economic Development; East China Jiaotong University: Nanchang, China, 2019. (In Chinese) [Google Scholar]
  34. Xin, C.; Chen, Z. Distribution Dynamics, Regional Differences and Convergence of China’s Basic Public Service Supply Level. Quant. Econ. Tech. Econ. Res. 2019, 36, 52–71. (In Chinese) [Google Scholar]
  35. Tobler, W.R. A Computer Movie Simulating Urban Growth in the Detroit Region. Econ. Geogr. 1970, 46, 234–240. [Google Scholar] [CrossRef]
  36. Paelinck, J. Simple linear planning models: Structure and implications. Economist 1975, 123, 385–396. [Google Scholar] [CrossRef]
  37. Anselin, L. A test for spatial autocorrelation in seemingly unrelated regressions. Econ. Lett. 1988, 28, 335–341. [Google Scholar] [CrossRef]
  38. Andrew, C.; Keith, O. Testing for Spatial Autocorrelation Among Regression Residuals. Geogr. Anal. 1972, 4, 267–284. [Google Scholar]
  39. Zeng, Y.; Jiang, C.; Cui, Z. The impact of digital finance on high-quality economic development: A study based on the spatial Durbin model. Tech. Econ. 2022, 41, 94–106. (In Chinese) [Google Scholar]
  40. Chen, Q. Advanced Econometrics and Stata Applications; Higher Education Press: Beijing, China, 2014. (In Chinese) [Google Scholar]
  41. Liu, C.; Zhao, X. The impact of population aging on economic growth and its spillover effect—Based on the spatial Durbin model. Explor. Econ. Issues 2018, 6, 21–32. (In Chinese) [Google Scholar]
  42. James, L.; Robert, K.P. Introduction to Spatial Econometrics; CRC Press: Boca Raton, FL, USA, 2009. [Google Scholar]
Figure 1. The development level of the aging industry.
Land 11 02096 g001aLand 11 02096 g001b
Figure 2. Sub-regional development index of the aging industry.
Land 11 02096 g002
Figure 3. The development level of the regional economy.
Land 11 02096 g003
Figure 4. Sub-regional development index of the regional economy.
Land 11 02096 g004
Figure 5. Coordination development level of the aging industry and regional economy.
Land 11 02096 g005
Figure 6. Coordination index of the aging industry and regional economy.
Land 11 02096 g006
Figure 7. The distribution dynamics of the coordinating development index of the aging industry and the regional economy.
Land 11 02096 g007
Figure 8. Moran scatter plot of the coordination index (CID) in 2009 (above) and 2019 (below).
Land 11 02096 g008
Table 1. Evaluation index system of the aging industry and regional economy development.
NameFirst-Level IndicatorSecondary IndicatorUnitCodeAttribute
Aging industry population structureproportion of the elderly population aged 65 and above%A1Inverse
old-age dependency ratio%A2Inverse
old-to-young ratio%A3Inverse
basic pension securitypension insurance participants10 KA4Positive
total income of the basic pension insurance fund100 MillionA5Positive
basic elderly carenumber of pension institutions-A6Positive
number of employees in pension institutions-A7Positive
number of pension beds per thousand elderly people-A8Positive
quality of pension practitioners (college and above)%A9Positive
regional economy developmentscaleregional GDP100 MillionB1Positive
local fiscal revenue100 MillionB2Positive
whole society’s fixed asset investment100 MillionB3Positive
development qualityper capita GDPYuan/personB4Positive
per capita disposable incomeYuan/personB5Positive
Industrial structuretertiary industry added value100 MillionB6Positive
tertiary industry’s share of GDP%B7Positive
Table 2. Classification standard of coupling coordination degree between the aging industry and regional economy development.
D TypeU1 and U2Feature
0.8 < D ≤ 1Good coordinationU1 > U2Regional economy development lags
U1 = U2Well-coordinated development of the two
U1 < U2Aging industry development lags
0.6 < D ≤ 0.8Moderate coordinationU1 > U2Regional economy development lags
U1 = U2Moderate coordinated development of the two
U1 < U2Aging industry development lags
0.4 < D ≤ 0.6Basic coordinationU1 > U2Regional economy development lags
U1 = U2Basic coordinated development of the two
U1 < U2Aging industry development lags
0.2 < D ≤ 0.4Moderate incoordinationU1 > U2Regional economy development lags
U1 = U2Moderately imbalanced development of the two
U1 < U2Aging industry development lags
0 < D ≤ 0.2Severe incoordinationU1 > U2Regional economy development lags
U1 = U2Severely imbalanced development of the two
U1 < U2Aging industry development lags
Table 3. Mean analysis table of the coupling coordination index between the aging industry and the regional economy (2009–2019).
NameAging Industry Index (U1)Regional Economy Index (U2)U1–U2Comprehensive Development Index (T)Coupling Index (C)Coordination Index (D)Coordination LevelRank
Beijing0.48380.6732−0.18940.57850.98650.7554Moderate4
Tianjin0.30280.3758−0.07310.33930.99420.5808Basic15
Hebei 0.48250.31200.17050.39730.97670.6229Moderate11
Shanxi0.38450.19800.18660.29130.94730.5253Basic21
Inner Mongolia0.38310.26610.11690.32460.98360.5651Basic16
Liaoning 0.46970.32260.14710.39620.98260.6239Moderate10
Jilin 0.36580.21210.15370.28900.96400.5278Basic20
Heilongjiang 0.39230.17840.21390.28530.92710.5143Basic25
Shanghai0.46010.6446−0.18450.55240.98600.7380Moderate6
Jiangsu 0.64360.6994−0.05580.67150.99910.8191Good2
Zhejiang 0.56700.54350.02360.55530.99980.7451Moderate5
Anhui 0.41510.28530.12980.35020.98270.5866Basic13
Fujian 0.32450.3554−0.03090.33990.99900.5827Basic14
Jiangxi 0.46540.21760.24780.34150.93190.5641Basic17
Shandong 0.63500.53290.10210.58400.99620.7627Moderate3
Henan 0.53320.34110.19210.43710.97560.6530Moderate7
Hubei 0.51480.33380.18100.42430.97700.6439Moderate9
Hunan 0.45800.30990.14820.38390.98120.6138Moderate12
Guangdong 0.74620.67370.07250.71000.99870.8420Good1
Guangxi0.35030.20340.14700.27690.96410.5167Basic22
Hainan0.26590.16710.09880.21650.97360.4591Basic27
Chongqing0.30910.26860.04050.28880.99750.5368Basic19
Sichuan 0.54620.31770.22840.43190.96440.6454Moderate8
Guizhou 0.33030.15750.17290.24390.93510.4776Basic26
Yunnan 0.33920.20670.13250.27300.97010.5146Basic24
Tibet0.31950.11760.20200.21850.88680.4402Basic29
Shaanxi 0.35120.24240.10870.29680.98310.5402Basic18
Gansu 0.28630.12690.15940.20660.92250.4365Basic31
Qinghai 0.29060.12620.16440.20840.91890.4376Basic30
Ningxia0.30740.13470.17260.22110.92060.4511Basic28
Xinjiang0.40640.17430.23210.29030.91660.5158Basic23
Table 4. Distribution of the mean value of the coupling coordination index between the aging industry and the regional economy in various provinces (2009–2019).
CoordinationProvinceFeature
Good coordinationGuangdongRegional economy development lags
JiangsuAging industry development lags
Moderate coordinationShandong, Henan, Sichuan, Hubei, Liaoning, Hebei, HunanRegional economy development lags
ZhejiangCoordinated development
Beijing, ShanghaiAging industry development lags
Basic coordinationAnhui, Inner Mongolia, Jiangxi, Shaanxi, Chongqing, Jilin, Shanxi, Guangxi, Xinjiang, Yunnan, Heilongjiang, Guizhou, Hainan, Ningxia, Tibet, Qinghai, GansuRegional economy development lags
-Coordinated development
Fujian, TianjinAging industry development lags
Moderate incoordination-
Severe incoordination-
Table 5. Descriptive statistics of variables.
VariableDefinitionObsMeanStd. Dev.MinMax
explained variable
CIDcoordination index D3410.58750.11340.40770.8574
explanatory variable
FROGproportion of local fiscal revenue of GDP3410.11490.03190.05870.2452
FAOGproportion of investment in fixed assets of GDP3410.83380.28310.21091.5965
LnPCGlogarithm of per capita GDP34110.63760.49409.288611.9940
ODRelderly dependency ratio3410.13530.03300.06700.2380
LnIPlogarithm of the number of people insured in the basic pension insurance3416.58921.07692.22258.5928
LnINSlogarithm of the number of elderly care institutions3416.63021.11721.60948.1342
LnBEDlogarithm of old-age beds per one thousand person3413.13170.50911.37534.3780
EDUproportion of elderly care service personnel with college and above3410.24270.08660.01620.4787
OYRratio of old and young3410.6540 0.2801 0.2072 1.8631
Table 6. Moran’s Index and Grary’s C Index.
Moran’s IGeary’s C
YearIzp-ValueYearczp-Value
20090.096 *** 3.718 0.000 20090.862 *** −3.353 0.001
20100.102 *** 3.890 0.000 20100.862 *** −3.352 0.001
20110.097 *** 3.746 0.000 20110.870 *** −3.097 0.002
20120.099 *** 3.784 0.000 20120.875 *** −3.025 0.002
20130.095 *** 3.687 0.000 20130.879 *** −2.947 0.003
20140.088 *** 3.486 0.000 20140.890 *** −2.663 0.008
20150.086 *** 3.449 0.001 20150.893 ** −2.466 0.014
20160.082 *** 3.332 0.001 20160.891 ** −2.531 0.011
20170.084 *** 3.402 0.001 20170.889 ** −2.536 0.011
20180.104 *** 3.969 0.000 20180.865 *** −3.125 0.002
20190.103 *** 3.939 0.000 20190.866 *** −3.151 0.002
Note: *** and ** indicate signifcance at the 1% and 5% levels, respectively.
Table 7. Provinces and cities code table.
1Beijing8Heilongjiang15Shandong22Chongqing29Qinghai
2Tianjin9Shanghai16Henan23Sichuan30Ningxia
3Hebei10Jiangsu17Hubei24Guizhou31Xinjiang
4Shanxi11Zhejiang18Hunan25Yunnan
5Inner Mongolia12Anhui19Guangdong26Tibet
6Liaoning13Fujian20Guangxi27Shaanxi
7Jilin14Jiangxi21Hainan28Gansu
Table 8. Spatial model testing results.
Name Statisticsp-ValueName Statisticsp-Value
LM testSpatial error: Hausman testHausman Fe Re1754.53 ***0.000
Moran’s I7.776 ***0.000LR test
Lagrange multiplier46.831 ***0.000 SDM-SAR182.56 ***0.000
Robust Lagrange multiplier67.047 ***0.000 SDM-SEM43.55 ***0.000
Spatial lag: Wald test
Lagrange multiplier0.5640.453 Test For SAR111.81 ***0.000
Robust Lagrange multiplier20.78 ***0.000 Test For SEM14.56 *0.068
Note: *** and * indicate significance at the 1% and 10% levels, respectively.
Table 9. SDM model estimation results.
Spatial FixedTemporal FixedDouble Fixed
CIDCIDCID
MainWxMainWxMainWx
FROG0.199 ***−0.306 *−0.1032.410 ***0.223 ***0.308
[0.0488][0.1766][0.1191][0.8399][0.0506][0.3830]
FAOG0.0303 ***−0.0234−0.01390.002590.0316 ***0.0543 *
[0.0042][0.0197][0.0139][0.0793][0.0041][0.0311]
LnPCG0.0749 ***−0.0972 ***0.143 ***0.05090.0629 ***−0.0633
[0.0104][0.0321][0.0130][0.1144][0.0104][0.0640]
ODR−0.420 ***0.970 ***0.08904.373 ***−0.455 ***0.437
[0.0737][0.3226][0.1720][1.6631][0.0775][0.6592]
LnIP0.003180.01930.0567 ***0.108 *0.004760.0252
[0.0059][0.0374][0.0061][0.0635][0.0058] [0.0479]
LnINS0.00328−0.01530.00559−0.141 **0.00472 *−0.0127
[0.0023] [0.0154][0.0069][0.0673] [0.0024][0.0237]
LnBED0.0309 ***0.0005080.0367 ***0.02190.0294 ***0.0175
[0.0029][0.0207][0.0084][0.0791][0.0029][0.0269]
EDU0.0424 ***−0.130 **−0.104 **−0.719 **0.0350 **0.0928
[0.0140][0.0563][0.0419][0.3001][0.0147][0.1095]
OYR−0.0333 ***−0.0966 *−0.0898 ***−0.410 ***−0.0240 **−0.0513
[0.0095][0.0552][0.0222] [0.1350] [0.0099][0.0627]
Spatial
rho0.515 *** −0.417 −0.246
[0.1013] [0.2681] [0.2173]
Variance
sigma2_e0.0000752 *** 0.00151 *** 0.0000687 ***
[0.0000] [0.0001] [0.0000]
N341 341 341
Standard errors in parentheses; * p < 0.1, ** p < 0.05, *** p < 0.01.
Table 10. Estimation results of spatial effect decomposition.
Direct EffectsIndirect EffectTotal Effects
FROG0.192 ***−0.392 −0.199
[0.0507][0.3629][0.3733]
FAOG0.0297 ***−0.01770.0121
[0.0043][0.0424][0.0440]
LnPCG0.0734 ***−0.120 *−0.0468
[0.0099][0.0653][0.0653]
ODR−0.387 ***1.530 **1.143
[0.0773][0.7087] [0.7442]
LnIP0.004040.0438 0.0478
[0.0059][0.0851][0.0872]
LnINS0.00277−0.0288 −0.0260
[0.0025] [0.0337] [0.0347]
LnBED0.0316 ***0.0336 0.0652
[0.0032][0.0454] [0.0468]
EDU0.0373 **−0.219 *−0.182
[0.0146][0.1178] [0.1231]
OYR−0.0381 ***−0.235 *−0.274 **
[0.0099][0.1205] [0.1246]
N341341341
Standard errors in parentheses; * p < 0.1, ** p < 0.05, *** p < 0.01.
Publisher’s Note: MDPI stays neutral with regard to jurisdictional claims in published maps and institutional affiliations.

