Impact of Human Disturbances on the Spatial Heterogeneity of Landscape Fragmentation in Qilian Mountain National Park, China
Abstract
:1. Introduction
2. Literature Review
2.1. The Effect of Human Disturbance on the Landscape Pattern
2.2. Landscape Fragmentation in Protected Areas (PA)
2.3. Conflict between Environmental Protection and Community Development in QLMNP
3. Materials and Methods
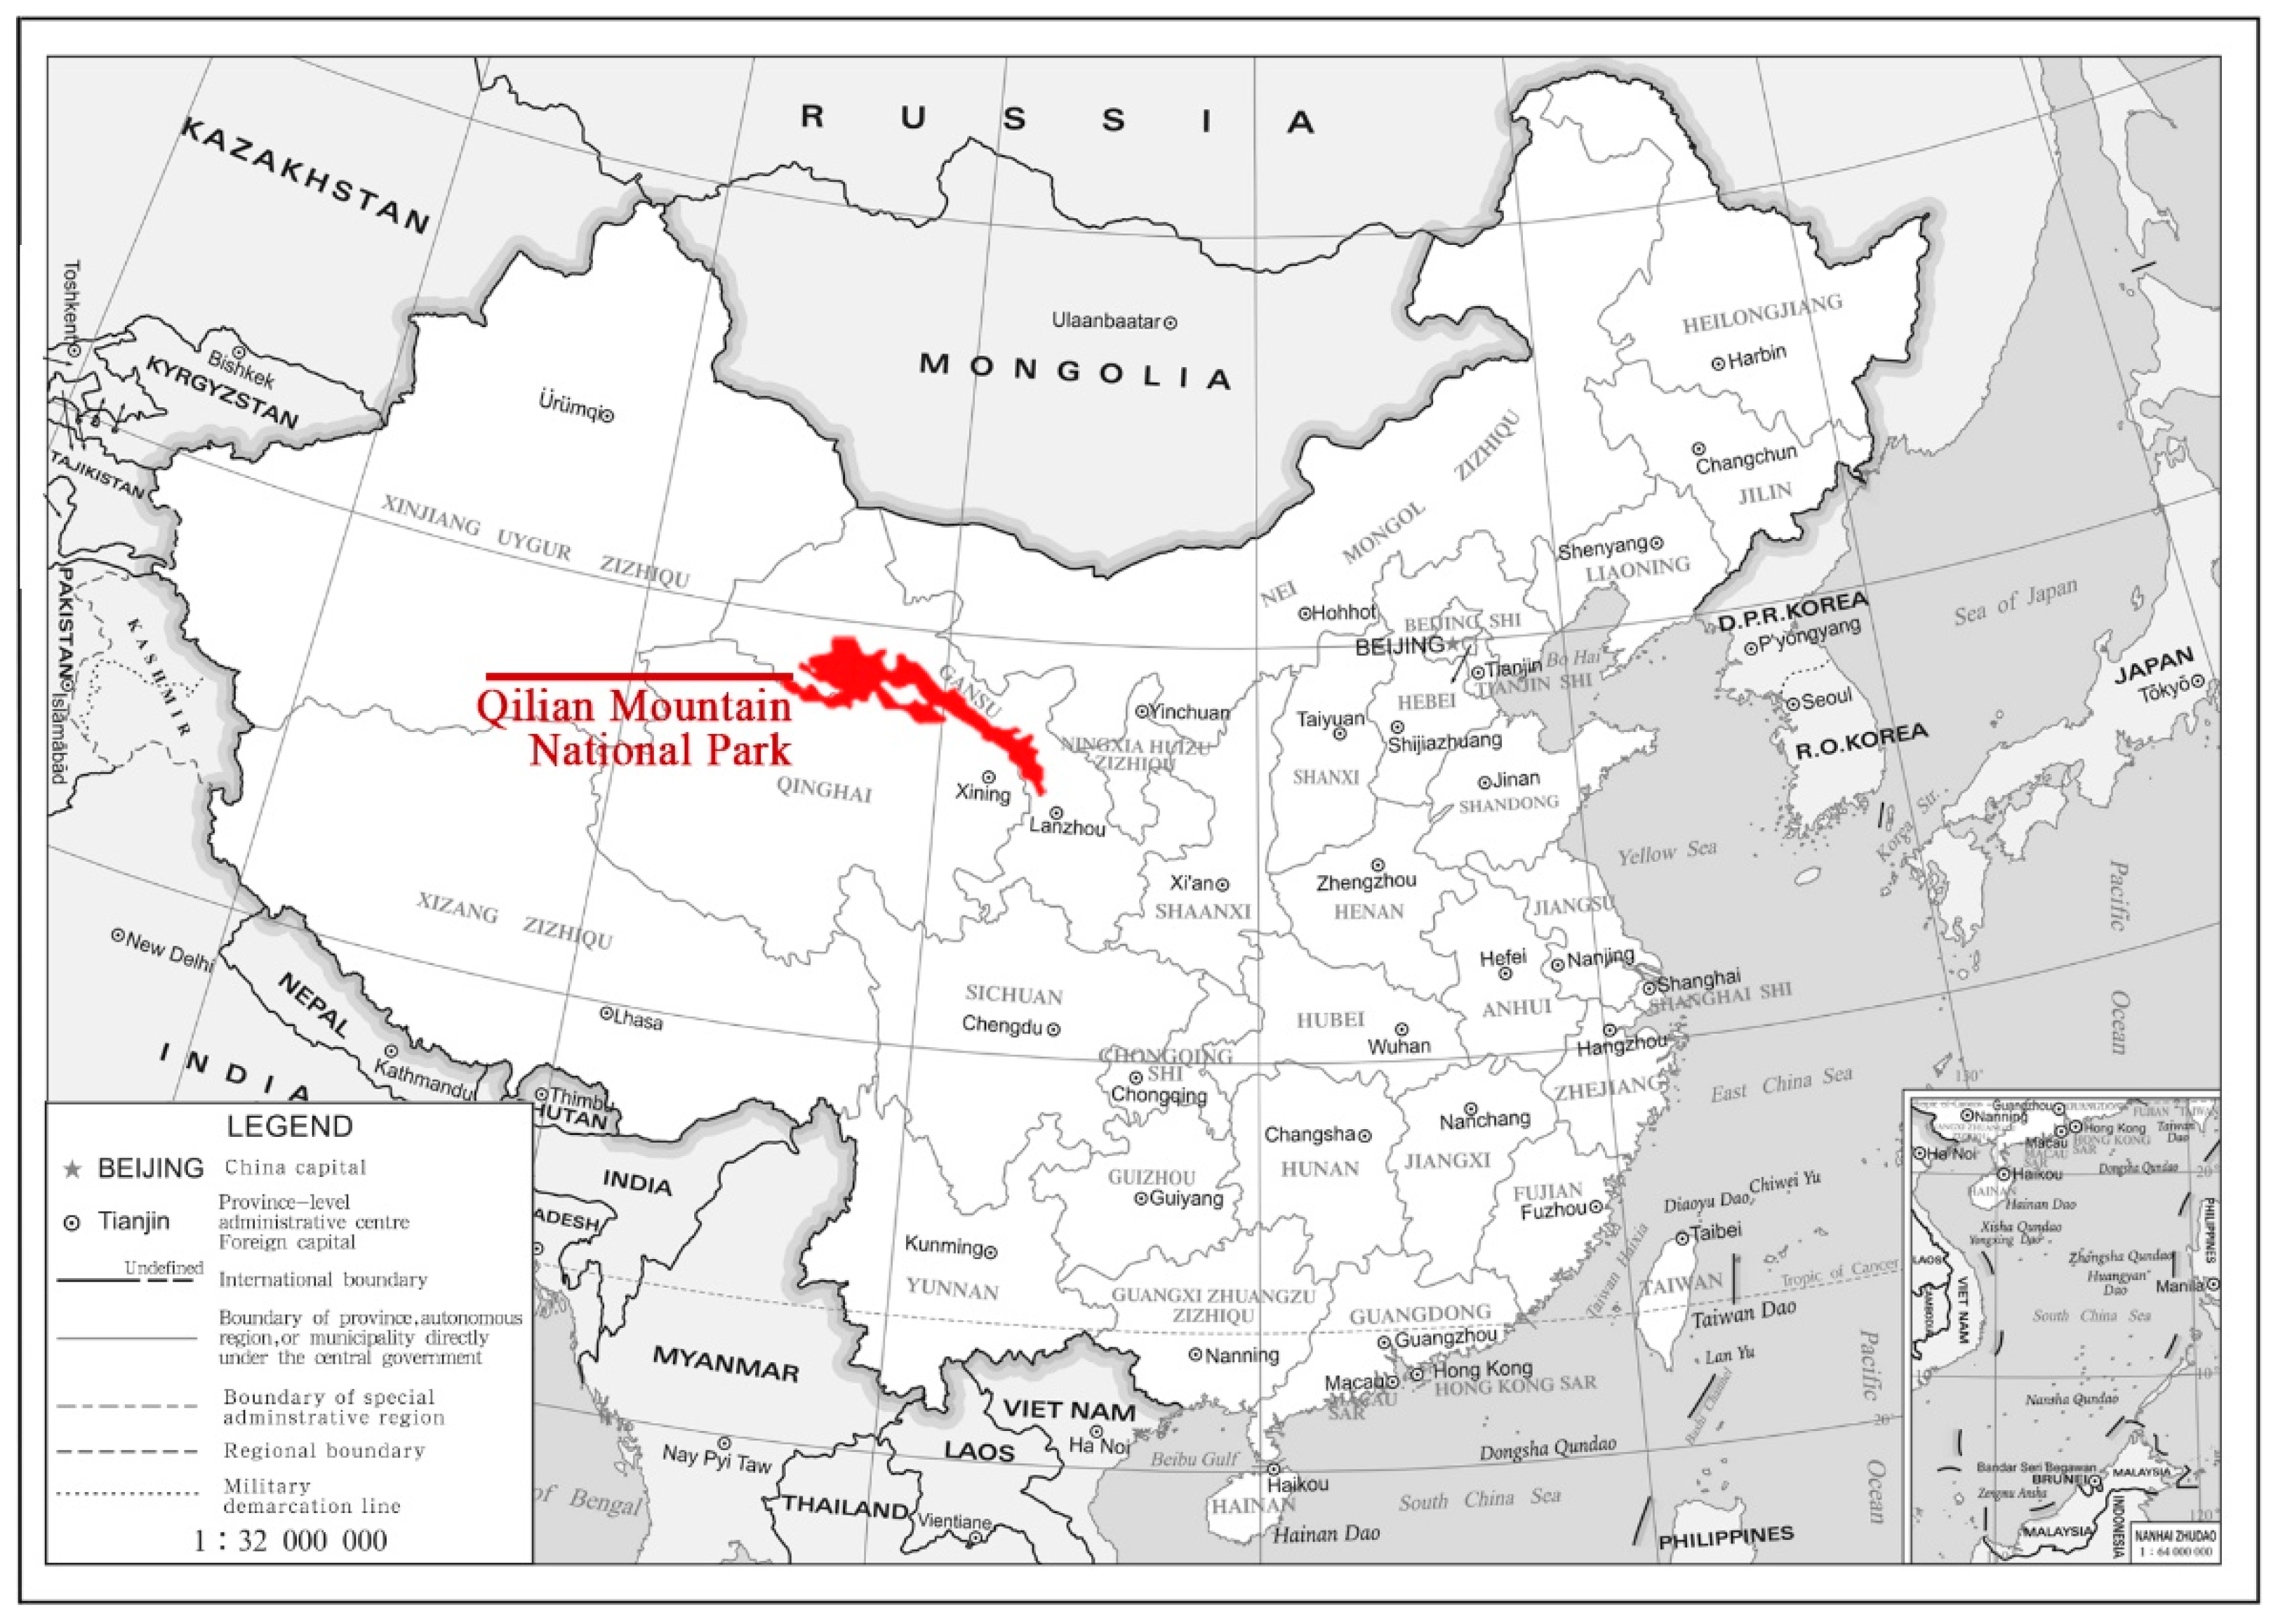
3.1. Research Area
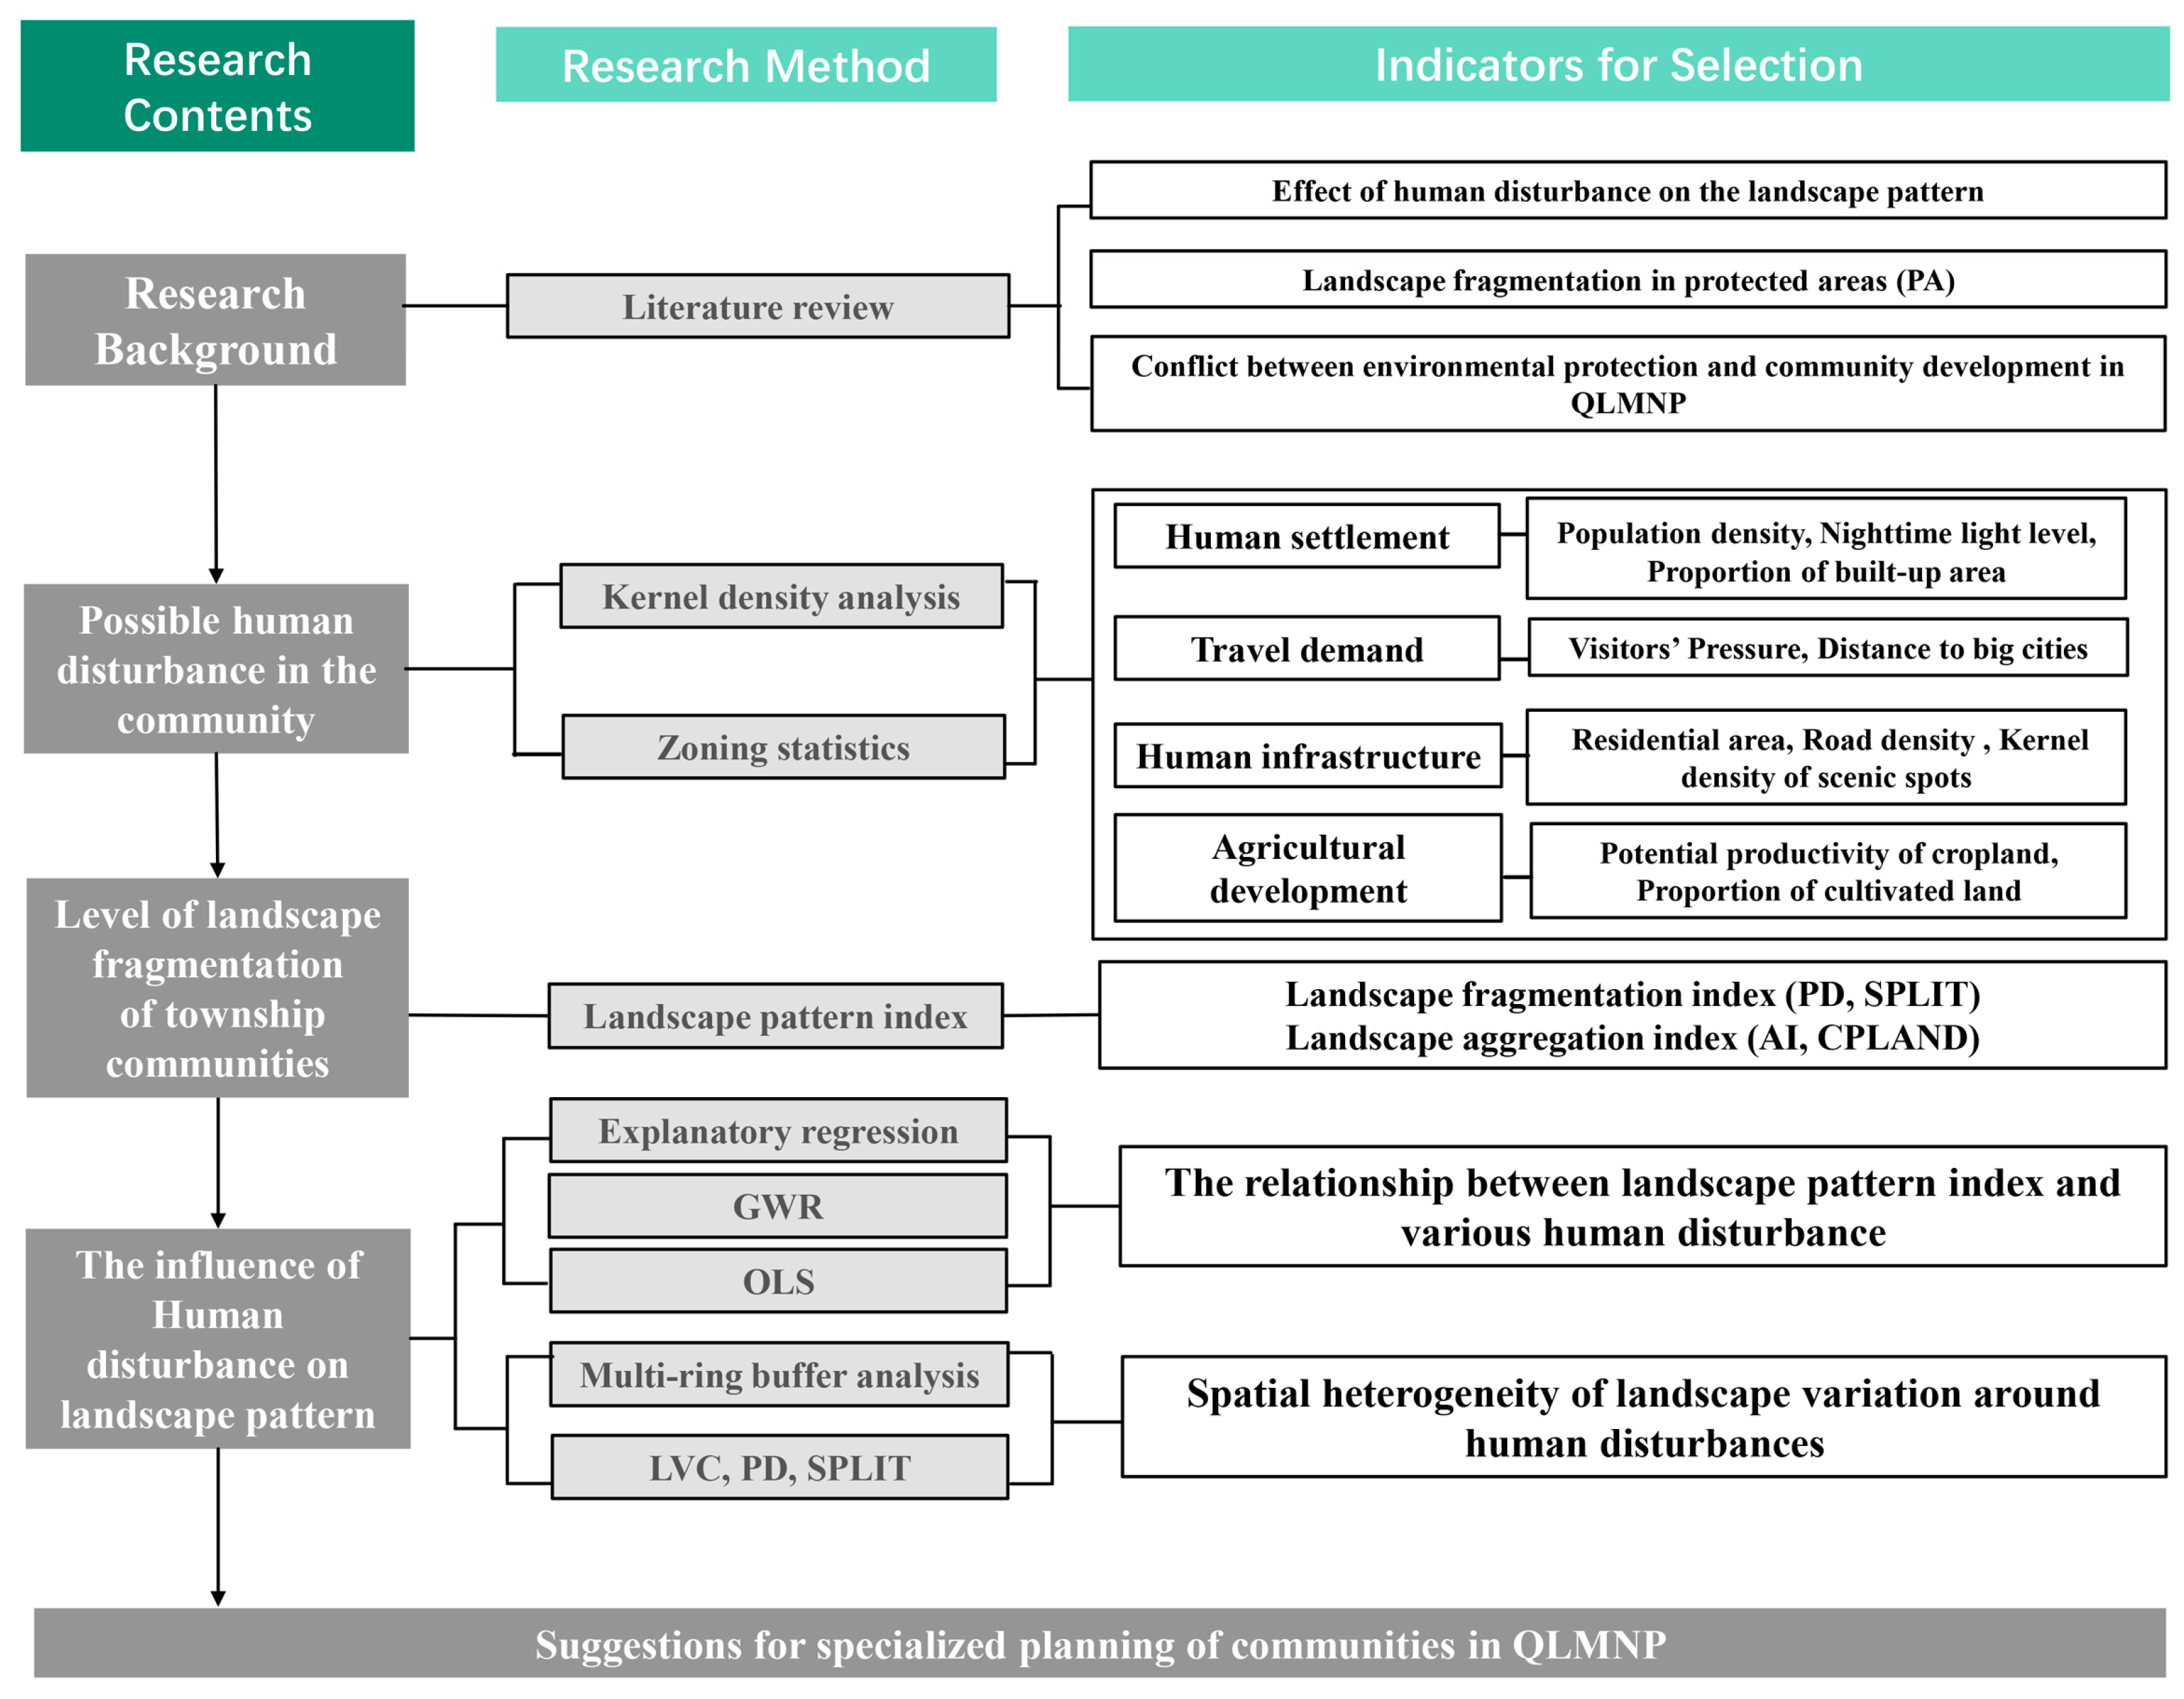
3.2. Overall Research Design
3.3. Research Methodology
3.3.1. Geographically Weighted Regression (GWR)
3.3.2. Indicators of Landscape Fragmentation
3.3.3. Disturbance Intensity Based on the Landscape Fragmentation Indexes
3.4. Data Sources
4. Results
4.1. Patterns of Human Activities and Other Drivers
4.1.1. Spatial Distribution of Transport and Travel Demand
- (1)
- Kernel density of tourist routes: The tourist routes are concentrated in the middle of QLMNP. Tourist resources such as ethnic minority towns, grasslands, and snowy mountains exist along the route. The tourist routes differ from the existing traffic lines. Many tourist routes pass through the core protected area of the national park (Figure 4a–c).
- (2)
- Distance to cities: The eastern edge of QLMNP is closer to provincial capitals and prefecture-level downtown areas, which are closer to the source of visitors, while the western communities of QLMNP are far from the sources (Figure 4).
4.1.2. Spatial Distributions of Human Settlements and Residential Areas
- (1)
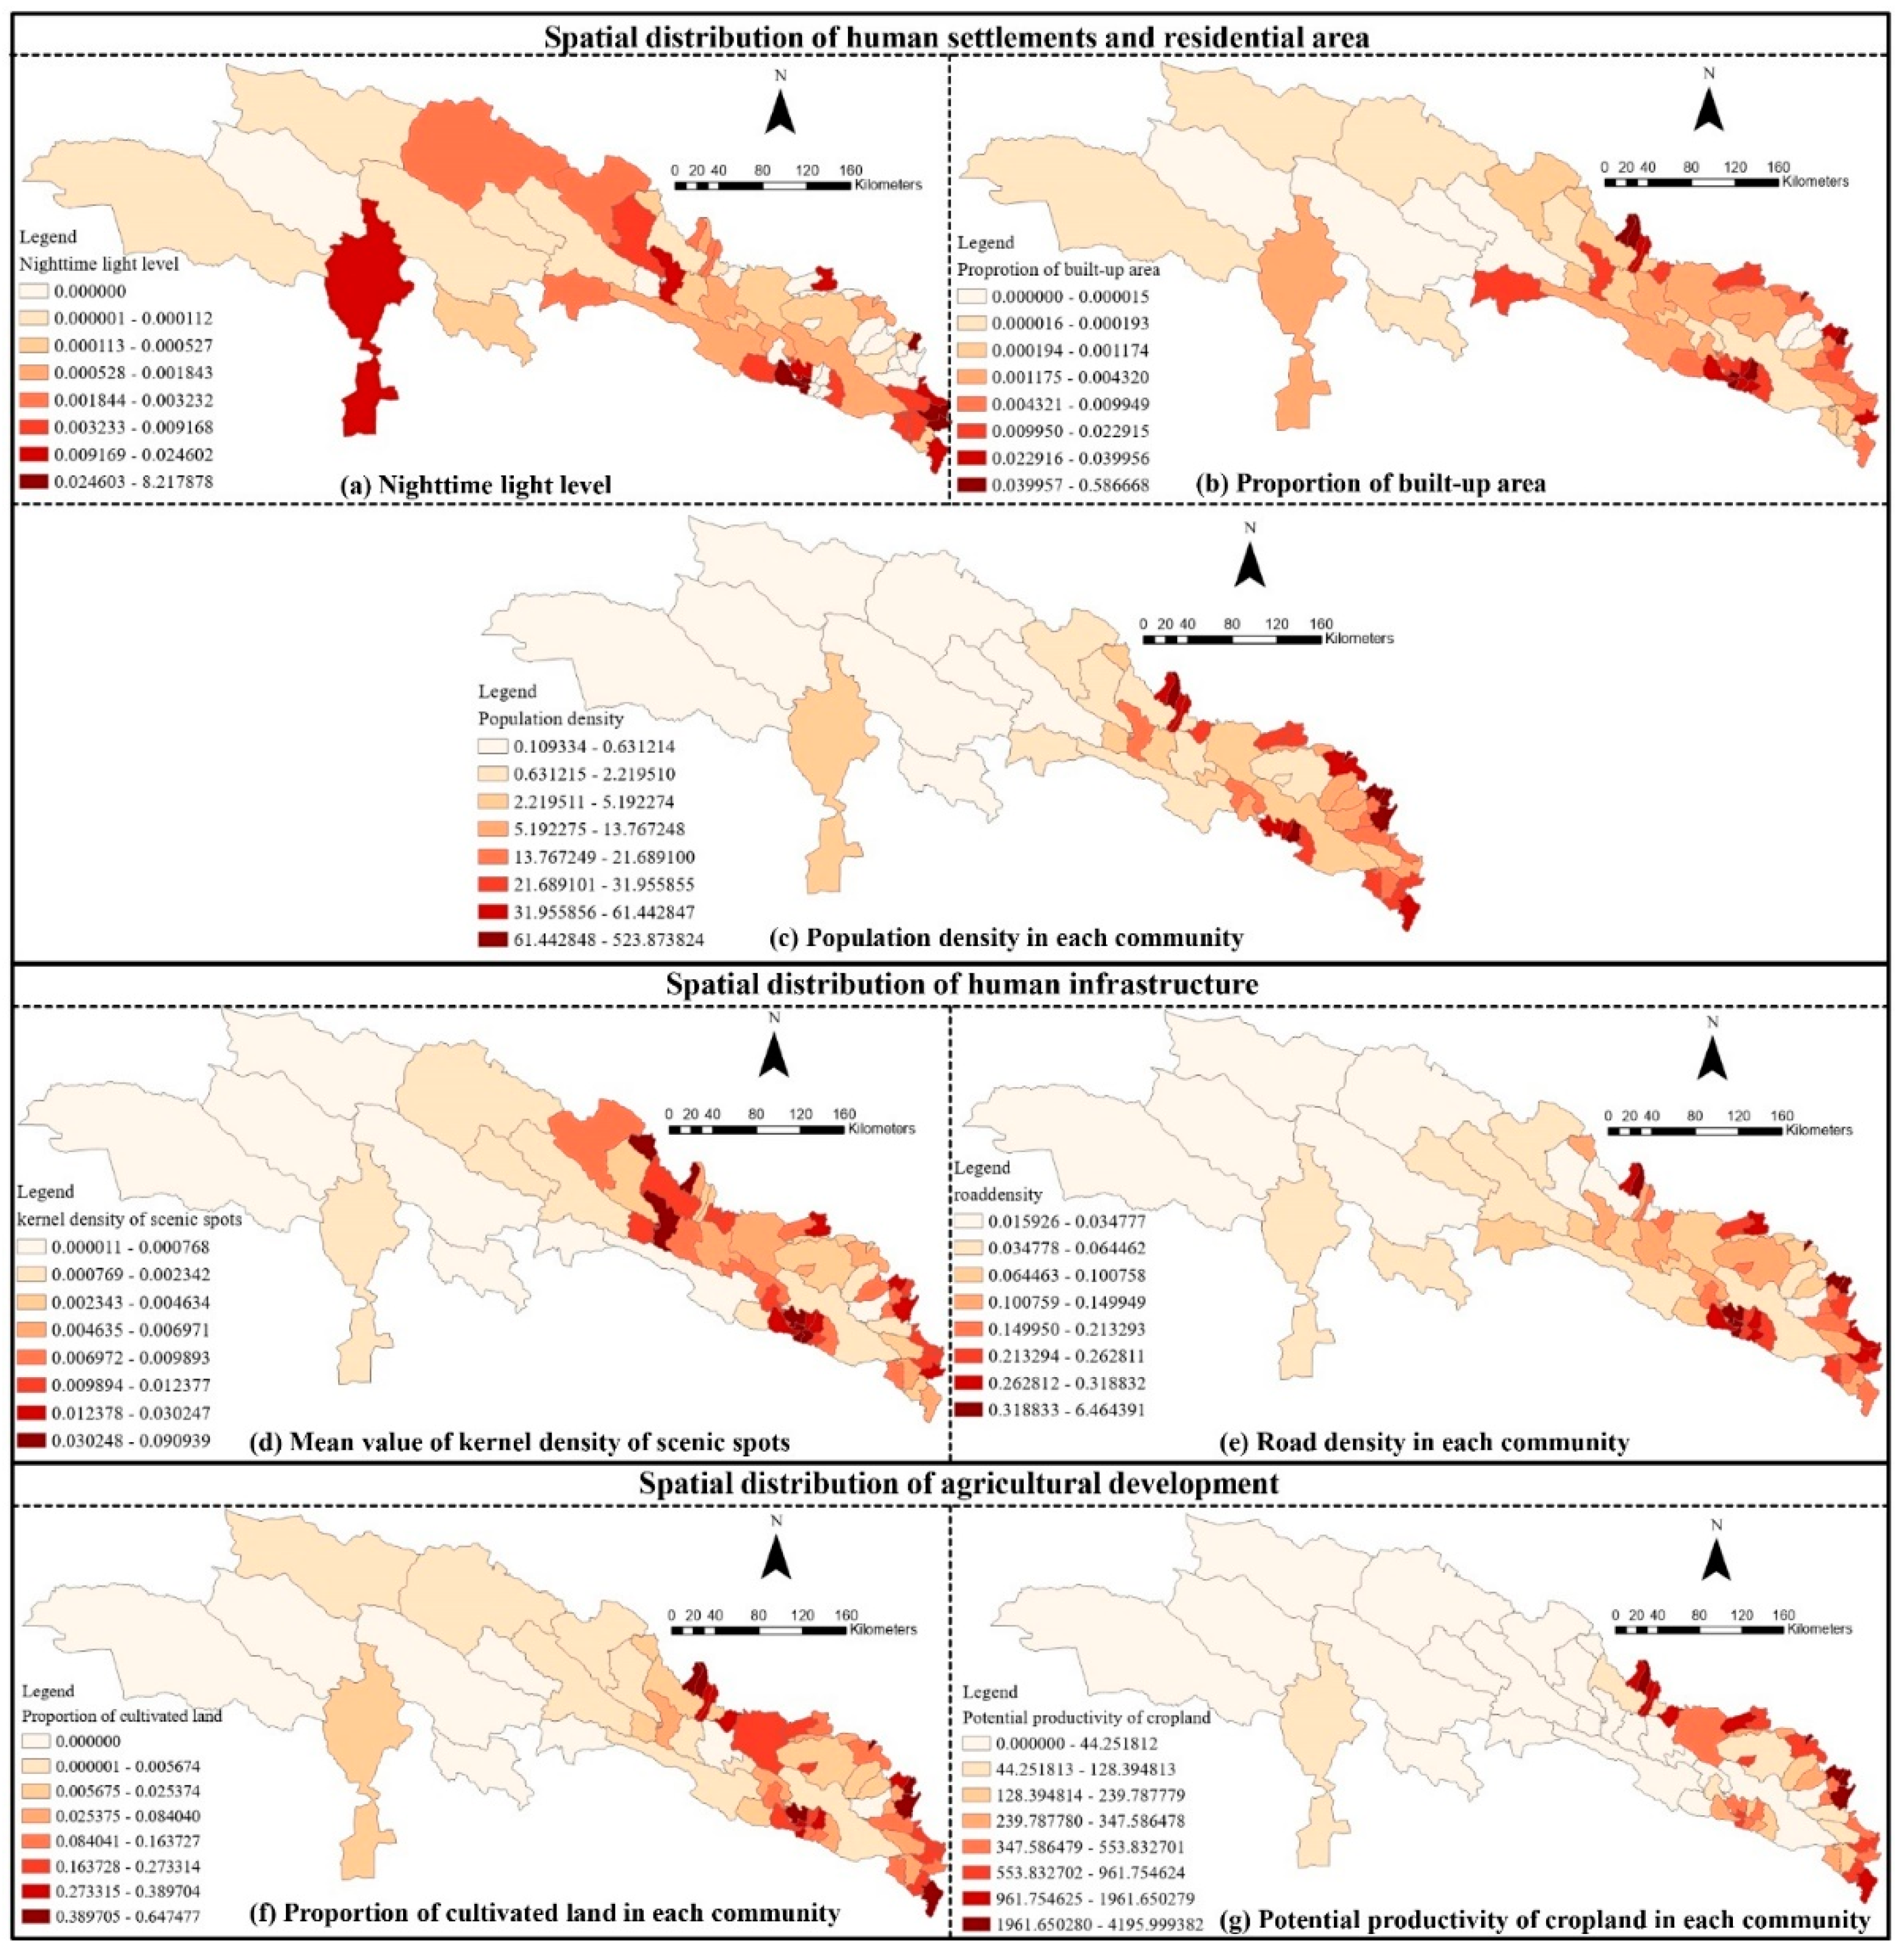
- Nighttime light level: The nighttime light has always been used to measure human activity [54]. The nighttime data shows that the eastern edge of the national park has the high brightness, reflecting increased human activity and socioeconomic attributes. The brightness values of the urban areas in the central and southern Qilian Mountains are also higher than those at the western edge (Figure 5a).
- (2)
- Population density: The densely populated communities are mainly concentrated on the eastern edge of QLMNP (Figure 5c).
- (3)
- Proportion of the built-up area: The communities with a higher proportion of the built-up area are mainly concentrated on the southern and eastern edges of QLMNP, while communities with a lower proportion of the built-up area are mainly located in the western portion of QLMNP (Figure 5b).
4.1.3. Spatial Distributions of Human Infrastructure
- (1)
- Density of scenic spots: The density of scenic spots and tourist attractions is higher on the northern slope of the eastern part of the Qilian Mountains than in other communities (Figure 5d).
- (2)
- Road network density: Communities with higher road network density are mainly concentrated on the eastern edge of QLMNP (Figure 5e).
4.1.4. Spatial Distribution of Agricultural Development
4.1.5. Spatial Distributions of Natural Factors
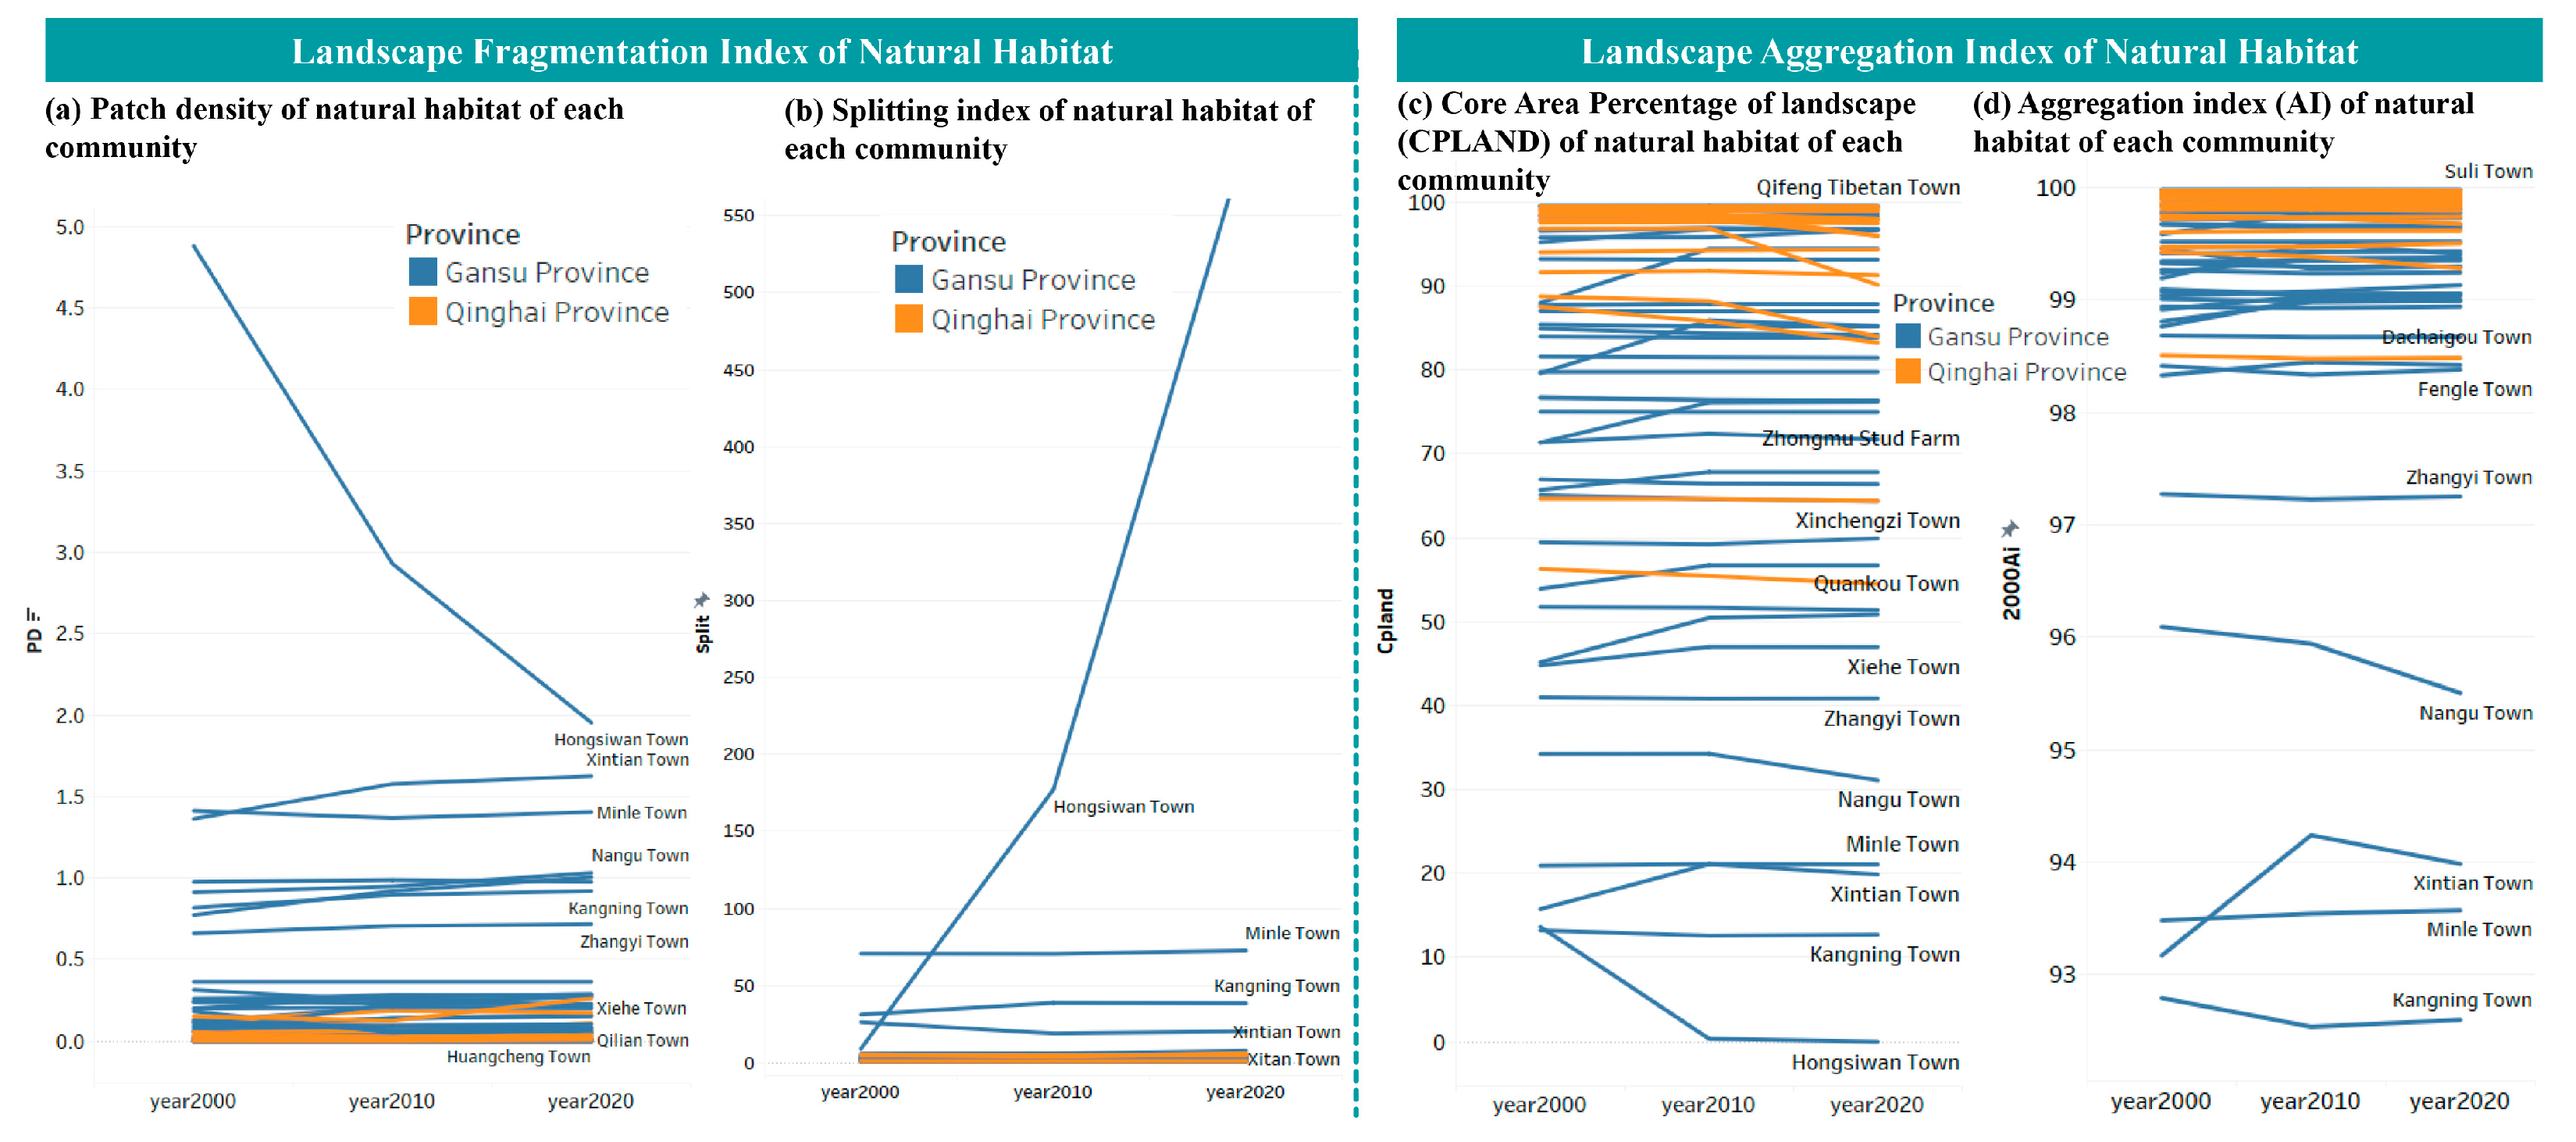
4.2. Patterns of Landscape Fragmentation
4.3. Association of Human Activities to Landscape Fragmentation
4.3.1. Results of the GWR Model of the Spatial Relationships between Landscape Fragmentation and Human Disturbance in Communities
4.3.2. Multi-Ring Buffer Analysis of Landscape Fragmentation around Human Disturbances
- (1)
- Spatial variations caused by different sources of disturbance
- (2)
- Changes in the impacts of various sources of human disturbance on landscape fragmentation between two periods (2000 and 2020)
5. Discussion
5.1. Spatial Heterogeneity of the Landscape Fragmentation in QLMNP
5.2. Impact of Human Disturbance on Landscape Fragmentation in QLMNP
5.3. Spatial Heterogeneity of the Drivers of Landscape Fragmentation in QLMNP
5.4. Sustainable Development of Communities in QLMNP: A Future Perspective
6. Conclusions
Author Contributions
Funding
Institutional Review Board Statement
Informed Consent Statement
Data Availability Statement
Conflicts of Interest
Appendix A
| Adj R2 | AICc | JB | K (BP) | VIF | SA | Model |
|---|---|---|---|---|---|---|
| 0.91 | −72.92 | 0 | 0 | 13.88 | 0.08 | +Proportion of cultivated land *** −Proportion of built-up area *** +Road density *** −Annual mean temperature *** |
| 0.91 | −72.32 | 0 | 0 | 20.66 | 0 | −Kernel density of scenic spots ** +Proportion of cultivated land ** −Proportion of the built-up area *** +Road density *** |
| 0.91 | −71.94 | 0 | 0 | 20 | 0 | +Proportion of cultivated land ** +Road density *** −Nighttime light level * −Population density *** |
| Adj R2 | AICc | JB | K (BP) | VIF | SA | Model |
|---|---|---|---|---|---|---|
| 0.99 | −379.07 | 0 | 0 | 32.18 | 0.57 | +Proportion of cultivated land * −Proportion of built-up area ** +Road density *** +Nighttime light level *** |
| 0.99 | −375.01 | 0 | 0 | 29.28 | 0.72 | +Potential productivity of cropland ** −Proportion of the built-up area ** +Road density ** +Nighttime light level *** |
| 0.99 | −373.48 | 0 | 0 | 24.01 | 0.75 | −Proportion of the built-up area ** +Road density *** +Average mean temperature +Nighttime light level *** |
| Adj R2 | AICc | JB | K (BP) | VIF | SA | Model |
|---|---|---|---|---|---|---|
| 0.64 | 8.08 | 0 | 0 | 1 | 0 | +Road density *** |
| 0.53 | 23.96 | 0 | 0 | 1 | 0 | +Proportion of cultivated land *** |
| 0.48 | 30.42 | 0 | 0.12 | 1 | 0 | +Population density *** |
| 0.36 | −40.37 | 0 | 0.77 | 1 | 0 | +Proportion of the built-up area *** |
| Adj R2 | AICc | JB | K (BP) | VIF | SA | Model |
|---|---|---|---|---|---|---|
| 0.98 | −327.14 | 0 | 0.87 | 1 | 0.67 | +Nighttime light level *** |
| 0.92 | −238.85 | 0 | 0.03 | 1 | 0 | +Proportion of built-up area *** |
| 0.88 | −210.43 | 0 | 0 | 1 | 0 | +Road density *** |
| 0.78 | −174.02 | 0 | 0 | 1 | 0 | +Population density *** |
| AICc | Adjusted R2 | ||
|---|---|---|---|
| GWR | OLS | GWR | OLS |
| −132.5720 | −129.2241 | 0.8916 | 0.8558 |
| AICc | Adjusted R2 | ||
|---|---|---|---|
| GWR | OLS | GWR | OLS |
| −375.9478 | −366.5200 | 0.9920 | 0.9914 |
References
- Kamusoko, C.; Aniya, M. Land Use/Cover Change and Landscape Fragmentation Analysis in the Bindura District, Zimbabwe. Land Degrad. Dev. 2007, 18, 221–233. [Google Scholar] [CrossRef]
- Sims, K.R.E. Do Protected Areas Reduce Forest Fragmentation? A Microlandscapes Approach. Environ. Resour. Econ. 2014, 58, 303–333. [Google Scholar] [CrossRef]
- Zou, L.; Wang, J.; Bai, M. Assessing Spatial–Temporal Heterogeneity of China’s Landscape Fragmentation in 1980–2020. Ecol. Indic. 2022, 136, 108654. [Google Scholar] [CrossRef]
- Fan, C.; Myint, S. A Comparison of Spatial Autocorrelation Indices and Landscape Metrics in Measuring Urban Landscape Fragmentation. Landsc. Urban Plan 2014, 121, 117–128. [Google Scholar] [CrossRef]
- Levin, S.A. The Problem of Pattern and Scale in Ecology. In Ecological Time Series; Powell, T.M., Steele, J.H., Eds.; Springer: Boston, MA, USA, 1995; pp. 277–326. ISBN 978-1-4615-1769-6. [Google Scholar] [CrossRef]
- Zongxing, L.; Qi, F.; Zongjie, L.; Xufeng, W.; Juan, G.; Baijuan, Z.; Yuchen, L.; Xiaohong, D.; Jian, X.; Wende, G.; et al. Reversing Conflict between Humans and the Environment—The Experience in the Qilian Mountains. Renew. Sustain. Energy Rev. 2021, 148, 111333. [Google Scholar] [CrossRef]
- Pickett, S.T.A.; Cadenasso, M.L.; Grove, J.M. Resilient Cities: Meaning, Models, and Metaphor for Integrating the Ecological, Socio-Economic, and Planning Realms. Landsc. Urban Plan 2004, 69, 369–384. [Google Scholar] [CrossRef]
- Santiago-Ramos, J.; Feria-Toribio, J.M. Assessing the Effectiveness of Protected Areas against Habitat Fragmentation and Loss: A Long-Term Multi-Scalar Analysis in a Mediterranean Region. J. Nat. Conserv. 2021, 64, 126072. [Google Scholar] [CrossRef]
- Vorovencii, I. Quantifying Landscape Pattern and Assessing the Land Cover Changes in Piatra Craiului National Park and Bucegi Natural Park, Romania, Using Satellite Imagery and Landscape Metrics. Environ. Monit. Assess. 2015, 187, 692. [Google Scholar] [CrossRef]
- Simpson, I.A.; Dugmore, A.J.; Thomson, A.; Vésteinsson, O. Crossing the Thresholds: Human Ecology and Historical Patterns of Landscape Degradation. Catena 2001, 42, 175–192. [Google Scholar] [CrossRef]
- Nagendra, H.; Munroe, D.K.; Southworth, J. From Pattern to Process: Landscape Fragmentation and the Analysis of Land Use/Land Cover Change. Agric. Ecosyst. Environ. 2004, 101, 111–115. [Google Scholar] [CrossRef]
- Rodríguez-Rodríguez, D.; Martínez-Vega, J. Analysing Subtle Threats to Conservation: A Nineteen Year Assessment of Fragmentation and Isolation of Spanish Protected Areas. Landsc. Urban Plan 2019, 185, 107–116. [Google Scholar] [CrossRef]
- Wittemyer, G.; Elsen, P.; Bean, W.T.; Burton, A.C.O.; Brashares, J.S. Accelerated Human Population Growth at Protected Area Edges. Science 2008, 321, 123–126. [Google Scholar] [CrossRef] [PubMed] [Green Version]
- Burgess, N.D.; Balmford, A.; Cordeiro, N.J.; Fjeldså, J.; Küper, W.; Rahbek, C.; Sanderson, E.W.; Scharlemann, J.P.W.; Sommer, J.H.; Williams, P.H. Correlations among Species Distributions, Human Density and Human Infrastructure across the High Biodiversity Tropical Mountains of Africa. Biol. Conserv. 2007, 134, 164–177. [Google Scholar] [CrossRef]
- Peng, Q.; Wang, R.; Jiang, Y.; Li, C. Contributions of Climate Change and Human Activities to Vegetation Dynamics in Qilian Mountain National Park, Northwest China. Glob. Ecol. Conserv. 2021, 32, e01947. [Google Scholar] [CrossRef]
- Qian, D.; Cao, G.; Du, Y.; Li, Q.; Guo, X. Impacts of Climate Change and Human Factors on Land Cover Change in Inland Mountain Protected Areas: A Case Study of the Qilian Mountain National Nature Reserve in China. Environ. Monit. Assess. 2019, 191, 486. [Google Scholar] [CrossRef]
- Mottet, A.; Ladet, S.; Coqué, N.; Gibon, A. Agricultural Land-Use Change and Its Drivers in Mountain Landscapes: A Case Study in the Pyrenees. Agric. Ecosyst. Environ. 2006, 114, 296–310. [Google Scholar] [CrossRef]
- Cai, X.; Wu, Z.; Cheng, J. Using Kernel Density Estimation to Assess the Spatial Pattern of Road Density and Its Impact on Landscape Fragmentation. Int. J. Geogr. Inf. Sci. 2013, 27, 222–230. [Google Scholar] [CrossRef]
- Hawbaker, T.J.; Radeloff, V.C.; Hammer, R.B.; Clayton, M.K. Road Density and Landscape Pattern in Relation to Housing Density, and Ownership, Land Cover, and Soils. Landsc. Ecol. 2005, 20, 609–625. [Google Scholar] [CrossRef]
- Sánchez-fernández, M.; Miguel, J.; Morillas, B.; González, D.M.; Juan, J.; Blasco, D.S. Impact of Roads on Environmental Protected Areas: Analysis and Comparison of Metrics for Assessing Habitat Fragmentation. Land 2022, 11, 1843. [Google Scholar] [CrossRef]
- Liu, Z.; Ding, M.; He, C.; Li, J.; Wu, J. Landscape and Urban Planning The Impairment of Environmental Sustainability Due to Rapid Urbanization in the Dryland Region of Northern China. Landsc. Urban Plan 2019, 187, 165–180. [Google Scholar] [CrossRef]
- Hui, Z.; Ningning, K.S.L. Human Impacts on Landscape Structure in Wolong Natural Reserve. Acta Ecol. Sin. 2001, 21, 1994–2001. [Google Scholar]
- Boori, M.S.; Voženílek, V.; Choudhary, K. Land Use/Cover Disturbance Due to Tourism in Jeseníky Mountain, Czech Republic: A Remote Sensing and GIS Based Approach. Egypt. J. Remote Sens. Space Sci. 2015, 18, 17–26. [Google Scholar] [CrossRef] [Green Version]
- Heslinga, J.; Groote, P.; Vanclay, F. Understanding the Historical Institutional Context by Using Content Analysis of Local Policy and Planning Documents: Assessing the Interactions between Tourism and Landscape on the Island of Terschelling in the Wadden Sea Region. Tour. Manag. 2018, 66, 180–190. [Google Scholar] [CrossRef] [Green Version]
- Xiang, Y.; Meng, J.; You, N.; Chen, P.; Yang, H. Spatio-Temporal Analysis of Anthropogenic Disturbances on Landscape Pattern of Tourist Destinations: A Case Study in the Li River Basin, China. Sci. Rep. 2019, 9, 19285. [Google Scholar] [CrossRef] [Green Version]
- Orsi, F.; Geneletti, D. Using Geotagged Photographs and GIS Analysis to Estimate Visitor Flows in Natural Areas. J. Nat. Conserv. 2013, 21, 359–368. [Google Scholar] [CrossRef]
- Pérez-Calderón, E.; Miguel-Barrado, V.; Sánchez-Cubo, F. Tourism Business in Spanish National Parks: A Multidimensional Perspective of Sustainable Tourism. Land 2022, 11, 190. [Google Scholar] [CrossRef]
- Xi, J.; Zhao, M.; Ge, Q.; Kong, Q. Changes in Land Use of a Village Driven by over 25 Years of Tourism: The Case of Gougezhuang Village, China. Land Use Policy 2014, 40, 119–130. [Google Scholar] [CrossRef]
- Lakshmi, S.R.; Shaji, T.L. Transformation of Coastal Settlements Due to Tourism. Procedia Technol. 2016, 24, 1668–1680. [Google Scholar] [CrossRef] [Green Version]
- Kurniawan, F.; Adrianto, L.; Bengen, D.G.; Prasetyo, L.B. Patterns of Landscape Change on Small Islands: A Case of Gili Matra Islands, Marine Tourism Park, Indonesia. Procedia Soc. Behav. Sci. 2016, 227, 553–559. [Google Scholar] [CrossRef] [Green Version]
- Mairota, P.; Cafarelli, B.; Boccaccio, L.; Leronni, V.; Labadessa, R.; Kosmidou, V.; Nagendra, H. Using Landscape Structure to Develop Quantitative Baselines for Protected Area Monitoring. Ecol. Indic. 2013, 33, 82–95. [Google Scholar] [CrossRef]
- Ianăş, A.N.; Germain, D. Quantifying Landscape Changes and Fragmentation in a National Park in the Romanian Carpathians. Carpathian J. Earth Environ. Sci. 2018, 13, 147–160. [Google Scholar] [CrossRef]
- Kubacka, M.; Żywica, P.; Vila Subirós, J.; Bródka, S.; Macias, A. How Do the Surrounding Areas of National Parks Work in the Context of Landscape Fragmentation? A Case Study of 159 Protected Areas Selected in 11 EU Countries. Land Use Policy 2022, 113, 105910. [Google Scholar] [CrossRef]
- Munroe, D.K.; Nagendra, H.; Southworth, J. Monitoring Landscape Fragmentation in an Inaccessible Mountain Area: Celaque National Park, Western Honduras. Landsc. Urban Plan 2007, 83, 154–167. [Google Scholar] [CrossRef]
- Ryan, S.J.; Southworth, J.; Hartter, J.; Dowhaniuk, N.; Fuda, R.K.; Diem, J.E. Household Level Influences on Fragmentation in an African Park Landscape. Appl. Geogr. 2015, 58, 18–31. [Google Scholar] [CrossRef]
- Rodríguez-Izquierdo, E.; Cid, A.; García-Meneses, P.M.; Peña-Sanabria, K.A.; Lerner, A.M.; Matus-Kramer, A.; Escalante, A.E. From Resilience Attributes to City Resilience. Landsc. Urban Plan 2022, 226, 104485. [Google Scholar] [CrossRef]
- Mas, J.F. Assessing Protected Area Effectiveness Using Surrounding (Buffer) Areas Environmentally Similar to the Target Area. Environ. Monit. Assess. 2005, 105, 69–80. [Google Scholar] [CrossRef]
- Hill, J.L.; Curran, P.J. Area, Shape and Isolation of Tropical Forest Fragments: Effects on Tree Species Diversity and Implications for Conservation. J. Biogeogr. 2003, 30, 1391–1403. [Google Scholar] [CrossRef] [Green Version]
- Broadbent, E.N.; Asner, G.P.; Keller, M.; Knapp, D.E.; Oliveira, P.J.C.; Silva, J.N. Forest Fragmentation and Edge Effects from Deforestation and Selective Logging in the Brazilian Amazon. Biol. Conserv. 2008, 141, 1745–1757. [Google Scholar] [CrossRef]
- Nascimento, H.E.M.; Laurance, W.F. Biomass Dynamics in Amazonian Forest Fragments. Ecol. Appl. 2004, 14, 127–138. [Google Scholar] [CrossRef] [Green Version]
- Qin, X.; Liu, W.; Mao, R.; Song, J.; Chen, Y.; Ma, C.; Li, M. Quantitative Assessment of Driving Factors Affecting Human Appropriation of Net Primary Production (HANPP) in the Qilian Mountains, China. Ecol. Indic. 2021, 121, 106997. [Google Scholar] [CrossRef]
- Adams, W.M.; Hutton, J. People, Parks and Poverty Political Ecology and Biodiversity Conservation. Conserv. Soc. 2007, 5, 147–183. [Google Scholar]
- Meng, J.; Long, Y.; Lefeng, S. Stakeholders’ Evolutionary Relationship Analysis of China’s National Park Ecotourism Development. J. Environ. Manag. 2022, 316, 115188. [Google Scholar] [CrossRef] [PubMed]
- National Forestry and Grassland Administration (NFGA); National Park Administration (NPA). Master Plan QLMNP (Exposure Draft). 2019. Available online: http://www.forestry.gov.cn/main/4461/20190215/091344699121299.html (accessed on 25 October 2022).
- Wang, Y.; Wu, C.; Wang, F.; Sun, Q.; Wang, X.; Guo, S. Comprehensive Evaluation and Prediction of Tourism Ecological Security in Droughty Area National Parks—A Case Study of Qilian Mountain of Zhangye Section, China. Environ. Sci. Pollut. Res. 2021, 28, 16816–16829. [Google Scholar] [CrossRef]
- Zou, Y.; Xu, J.; Zhang, R. Rethinking Vulnerability and Human Behaviour in Arid and Semi-Arid Regions in Northwestern China. Environ. Monit. Assess. 2020, 192, 379. [Google Scholar] [CrossRef] [PubMed]
- Guo, J.; Zhao, X.; Wei, Z.; Chen, Z.; Zhou, H. Progress, Problems, and Key Directions for Establishing the First National Park Demonstration Province in Qinghai, China. Int. J. Geoherit. Parks 2021, 9, 526–541. [Google Scholar] [CrossRef]
- Lin, P.; He, Z.; Du, J.; Chen, L.; Zhu, X.; Li, J. Recent Changes in Daily Climate Extremes in an Arid Mountain Region, a Case Study in Northwestern China’s Qilian Mountains. Sci. Rep. 2017, 7, 2245. [Google Scholar] [CrossRef] [Green Version]
- Yao, Z.; Zhao, C.; Yang, K.; Liu, W.; Li, Y.; You, J.; Xiao, J. Alpine Grassland Degradation in the Qilian Mountains, China—A Case Study in Damaying Grassland. Catena 2016, 137, 494–500. [Google Scholar] [CrossRef]
- Gong, W.; Wang, H.; Wang, X.; Fan, W.; Stott, P. Effect of Terrain on Landscape Patterns and Ecological Effects by a Gradient-Based RS and GIS Analysis. J. For. Res. 2017, 28, 1061–1072. [Google Scholar] [CrossRef]
- Yuxi, Z.; Linsheng, Z. Identifying Conflicts Tendency between Nature-Based Tourism Development and Ecological Protection in China. Ecol. Indic. 2020, 109, 105791. [Google Scholar] [CrossRef]
- Gerstenberg, T.; Baumeister, C.F.; Schraml, U.; Plieninger, T. Hot Routes in Urban Forests: The Impact of Multiple Landscape Features on Recreational Use Intensity. Landsc. Urban Plan 2020, 203, 103888. [Google Scholar] [CrossRef]
- Tang, X. The Establishment of National Park System: A New Milestone for the Field of Nature Conservation in China. Int. J. Geoherit. Parks 2020, 8, 195–202. [Google Scholar] [CrossRef]
- Levin, N.; Duke, Y. High Spatial Resolution Night-Time Light Images for Demographic and Socio-Economic Studies. Remote Sens. Environ. 2012, 119, 1–10. [Google Scholar] [CrossRef]
- Huang, X.; Yang, J.; Li, J.; Wen, D. Urban Functional Zone Mapping by Integrating High Spatial Resolution Nighttime Light and Daytime Multi-View Imagery. ISPRS J. Photogramm. Remote Sens. 2021, 175, 403–415. [Google Scholar] [CrossRef]
- Wang, M.; Xu, Q.; Fan, Z.; Sun, X. The Imprint of Built-up Land Expansion on Cropland Distribution and Productivity in Shandong Province. Land 2021, 10, 639. [Google Scholar] [CrossRef]
- Pei, J.; Wang, L.; Wang, X.; Niu, Z.; Kelly, M.; Song, X.P.; Huang, N.; Geng, J.; Tian, H.; Yu, Y.; et al. Time Series of Landsat Imagery Shows Vegetation Recovery in Two Fragile Karst Watersheds in Southwest China from 1988 to 2016. Remote Sens. 2019, 11, 2044. [Google Scholar] [CrossRef] [Green Version]
- Yang, S.; Hu, S.; Wang, S.; Zou, L. Effects of Rapid Urban Land Expansion on the Spatial Direction of Residential Land Prices: Evidence from Wuhan, China. Habitat Int. 2020, 101, 102186. [Google Scholar] [CrossRef]
- IUCN Habitat’s Classification Scheme (Version 3.1). In: The IUCN Red List of Threatened Species (Version 2013.1). Available online: https://www.iucnredlist.org/resources/habitat-classification-scheme (accessed on 20 January 2022).
- He, C.; Liu, Z.; Tian, J.; Ma, Q. Urban Expansion Dynamics and Natural Habitat Loss in China: A Multiscale Landscape Perspective. Glob. Chang. Biol. 2014, 20, 2886–2902. [Google Scholar] [CrossRef]
- Dai, L.; Li, S.; Lewis, B.J.; Wu, J.; Yu, D.; Zhou, W.; Zhou, L.; Wu, S. The Influence of Land Use Change on the Spatial–Temporal Variability of Habitat Quality between 1990 and 2010 in Northeast China. J. For. Res. 2019, 30, 2227–2236. [Google Scholar] [CrossRef]
- Wang, X.; Blanchet, F.G.; Koper, N. Measuring Habitat Fragmentation: An Evaluation of Landscape Pattern Metrics. Methods Ecol. Evol. 2014, 5, 634–646. [Google Scholar] [CrossRef]
- Lisiak, M.; Borowiak, K.; Kanclerz, J.; Adamska, A.; Szymańczyk, J. Effect of Linear Investment on Nature and Landscape—A Case Study. J. Environ. Eng. Landsc. Manag. 2018, 26, 158–165. [Google Scholar] [CrossRef]
- Chen, Z.; Yu, B.; Yang, C.; Zhou, Y.; Yao, S.; Qian, X.; Wang, C.; Wu, B.; Wu, J. An Extended Time-Series (2000–2018) of Global NPP-VIIRS-like Nighttime Light Data. Earth Syst. Sci. Data 2021, 13, 889–906. [Google Scholar] [CrossRef]
- Jun, C.; Ban, Y.; Li, S. Open Access to Earth Land-Cover Map. Nature 2014, 514, 434. [Google Scholar] [CrossRef] [PubMed] [Green Version]
- Xu, X.; Hu, J. Study on Spatiotemporal Behavior of Urban Park Tourists Based on GPS Data: A Case Study of Wuhan East Lake Scenic Area. Econ. Geogr. 2020, 40, 224–232. [Google Scholar]
- Shen, Y.; Xu, Y.; Liu, L. Crowd-Sourced City Images: Decoding Multidimensional Interaction between Imagery Elements with Volunteered Photos. ISPRS Int. J. Geoinf. 2021, 10, 740. [Google Scholar] [CrossRef]
- Wu, Q.; Cheng, J.; Young, C. Social Differentiation and Spatial Mixture in a Transitional City—Kunming in Southwest China. Habitat Int. 2017, 64, 11–21. [Google Scholar] [CrossRef] [Green Version]
- Fang, J.; He, H.; An, L.; Jin, G. The Evaluation of Potential for the Exploration and Development of Coalbed Methane Resources Based on an Improved Uncertainty Measure Optimization Model. Energy Explor. Exploit. 2019, 37, 315–331. [Google Scholar] [CrossRef] [Green Version]
- Yan, K.; Ding, Y. The Overview of the Progress of Qilian Mountain National Park System Pilot Area. Int. J. Geoherit. Parks 2020, 8, 210–214. [Google Scholar] [CrossRef]
- Cheng, Q.; Cheng, X.; Ma, K.; Zhao, X.; Qu, J. Offering the Win-Win Solutions between Ecological Conservation and Livelihood Development: National Parks in Qinghai, China. Geogr. Sustain. 2020, 1, 251–255. [Google Scholar] [CrossRef]






| Category | Indicators | References Using Indicators of the Human Impact on the Landscape Pattern |
|---|---|---|
| Human settlements and residential areas | Nighttime light level | Levin et al. [54], Huang et al. [55] |
| Population density | Wittemyer et al. [13], Burgess et al. [14], Nagendra et al. [11] | |
| Proportion of the built-up area | Liu et al. [21], Zeng et al. [22] | |
| Transport and travel demand | Visitor pressure | Orsi et al. [26] |
| Distance to source markets | Rodríguez et al. [12] | |
| Human infrastructure | Density of scenic spots | Xiang et al., 2019 [25] |
| Road density | Cai et al. [18], Hawbaker et al. [19], Sánchez-fernández et al. [20] | |
| Agricultural development | Proportion of cultivated land | Qian et al. [16], Mottet et al. [17] |
| Potential cropland productivity | Wang et al. [56] | |
| Natural background | Annual mean temperature | Qian et al. [16] |
| Annual mean precipitation | Qian et al. [16] | |
| Terrain niche index | Gong et al. [50], Pei et al. [57] |
| Element | Indicators | Method/Equation | Data Source |
|---|---|---|---|
| Human settlements and residential areas | Nighttime light level | Zonal statistics | Chen et al. [64] |
| Population density | Zonal statistics | WorldPop | |
| Proportion of the built-up area | Summary statistics | LCLU data. Source: Global 30 [65] | |
| Transport and travel demand | Visitor pressure | Kernel density of tourist routes | 711 trajectories, (GPX version) from Xingzhe; 677 trajectories (GPX version) from Foooooot; 29 trajectories (GPX version) from Wikiloc; Total 4,390,707 data points |
| Distance to large cities | Euclidean distance | Resource and Environment Data Cloud Platform | |
| Human infrastructure | Density of scenic spots | Kernel density | Documents of the Departments of Culture and Tourism of Qinghai and Gansu Provinces |
| Road density | Summary statistics | Resource and Environment Data Cloud Platform | |
| Agricultural development | Proportion of cultivated land in each community | Summary statistics | Land-use/cover data |
| Mean value of the potential productivity of cropland | Zonal statistics | Resource and Environment Data Cloud Platform | |
| Natural background | Annual mean temperature | Zonal statistics | Resource and Environment Data Cloud Platform |
| Annual mean precipitation | Zonal statistics | Resource and Environment Data Cloud Platform | |
| Terrain niche index [57] | Raster calculator: ; Zonal statistics | Resource and Environment Data Cloud Platform |
| Variable | Coefficient | StdError | t-Statistic | Probability | Robust SE | Robust t | Robust Pr |
|---|---|---|---|---|---|---|---|
| Intercept | 0.0179 | 0.0722 | 0.2484 | 0.8048 | 0.0562 | 0.3194 | 0.7507 |
| Potential productivity of cropland | 0.0259 | 0.1244 | 0.2079 | 0.8361 | 0.1210 | 0.2138 | 0.8316 |
| Terrain niche index | 0.1309 | 0.0717 | 1.8263 | 0.0738 | 0.0659 | 1.9877 | 0.0523 |
| Kernel density of scenic spots | −0.0862 | 0.0910 | −0.9473 | 0.3481 | 0.0681 | −1.2647 | 0.2118 |
| Proportion of cultivated land | 0.2737 | 0.0732 | 3.7372 | 0.000480 * | 0.1157 | 2.3657 | 0.021913 * |
| Proportion of the built-up area | 0.2705 | 0.6601 | 0.4098 | 0.6837 | 0.7596 | 0.3561 | 0.7233 |
| Road density | 2.7354 | 0.2699 | 10.1344 | <0.000001 * | 0.4263 | 6.4168 | <0.000001 * |
| Distance to large cities | −0.0909 | 0.0671 | −1.3555 | 0.1813 | 0.0508 | −1.7890 | 0.0797 |
| Annual mean temperature | −0.0857 | 0.0503 | −1.7039 | 0.0946 | 0.0304 | −2.8162 | 0.006939 * |
| Annual mean precipitation | −0.1245 | 0.0522 | −2.3847 | 0.020927 * | 0.0390 | −3.1964 | 0.002414 * |
| Visitor pressure | −0.0759 | 0.2259 | −0.3362 | 0.7381 | 0.1482 | −0.5125 | 0.6106 |
| Nighttime light level | −1.0701 | 0.5778 | −1.8520 | 0.0699 | 0.6543 | −1.6353 | 0.1083 |
| Population density | −0.8283 | 0.3840 | −2.1572 | 0.035818 * | 0.4401 | −1.8822 | 0.0656 |
| Variable | Coefficient | StdError | t-Statistic | Probability | Robust SE | Robust t | Robust Pr |
|---|---|---|---|---|---|---|---|
| Intercept | −0.0268 | 0.0131 | −2.0377 | 0.0469 * | 0.0189 | −1.4179 | 0.1624 |
| Potential productivity of cropland | −0.0056 | 0.0226 | −0.2488 | 0.8046 | 0.0204 | −0.2761 | 0.7836 |
| Terrain niche index | 0.0197 | 0.0130 | 1.5087 | 0.1377 | 0.0170 | 1.1565 | 0.2530 |
| Scenic spots | −0.0248 | 0.0165 | −1.5020 | 0.1394 | 0.0137 | −1.8102 | 0.0763 |
| Proportion of cultivated land | 0.0365 | 0.0133 | 2.7365 | 0.0086 * | 0.0235 | 1.5543 | 0.1264 |
| Proportion of the built-up area | −0.1479 | 0.1201 | −1.2315 | 0.2239 | 0.1084 | −1.3647 | 0.1785 |
| Road density | 0.1942 | 0.0491 | 3.9546 | 0.0002 * | 0.0632 | 3.0715 | 0.0034 * |
| Distance to large cities | 0.0159 | 0.0122 | 1.3066 | 0.1973 | 0.0117 | 1.3586 | 0.1804 |
| Annual mean temperature | 0.0186 | 0.0092 | 2.0345 | 0.0472 * | 0.0133 | 1.4008 | 0.1674 |
| Annual mean precipitation | −0.0078 | 0.0095 | −0.8180 | 0.4172 | 0.0083 | −0.9405 | 0.3515 |
| Visitor pressure | 0.0338 | 0.0411 | 0.8230 | 0.4144 | 0.0275 | 1.2294 | 0.2247 |
| Nighttime light level | 0.9488 | 0.1051 | 9.0275 | <0.0001 * | 0.1002 | 9.4687 | <0.000001 * |
| Population density | −0.0163 | 0.0698 | −0.2333 | 0.8165 | 0.0623 | −0.2618 | 0.7946 |
Publisher’s Note: MDPI stays neutral with regard to jurisdictional claims in published maps and institutional affiliations. |
© 2022 by the authors. Licensee MDPI, Basel, Switzerland. This article is an open access article distributed under the terms and conditions of the Creative Commons Attribution (CC BY) license (https://creativecommons.org/licenses/by/4.0/).
Share and Cite
Ren, B.; Park, K.; Shrestha, A.; Yang, J.; McHale, M.; Bai, W.; Wang, G. Impact of Human Disturbances on the Spatial Heterogeneity of Landscape Fragmentation in Qilian Mountain National Park, China. Land 2022, 11, 2087. https://doi.org/10.3390/land11112087
Ren B, Park K, Shrestha A, Yang J, McHale M, Bai W, Wang G. Impact of Human Disturbances on the Spatial Heterogeneity of Landscape Fragmentation in Qilian Mountain National Park, China. Land. 2022; 11(11):2087. https://doi.org/10.3390/land11112087
Chicago/Turabian StyleRen, Baifei, Keunhyun Park, Anil Shrestha, Jun Yang, Melissa McHale, Weilan Bai, and Guangyu Wang. 2022. "Impact of Human Disturbances on the Spatial Heterogeneity of Landscape Fragmentation in Qilian Mountain National Park, China" Land 11, no. 11: 2087. https://doi.org/10.3390/land11112087
APA StyleRen, B., Park, K., Shrestha, A., Yang, J., McHale, M., Bai, W., & Wang, G. (2022). Impact of Human Disturbances on the Spatial Heterogeneity of Landscape Fragmentation in Qilian Mountain National Park, China. Land, 11(11), 2087. https://doi.org/10.3390/land11112087


