Article

Study of Disaster Susceptibility and Economic Vulnerability to Strengthen Disaster Risk Reduction Instruments in Batu City, Indonesia

1
Department of Regional and Rural Development Planning, IPB University, Bogor 16680, Indonesia
2
Department of Economics, IPB University, Bogor 16680, Indonesia
*
Author to whom correspondence should be addressed.
Land 2022, 11(11), 2041; https://doi.org/10.3390/land11112041
Submission received: 20 September 2022 / Revised: 28 October 2022 / Accepted: 10 November 2022 / Published: 14 November 2022

Abstract

:
Batu City in East Java has a thriving tourist area, which is not exempt from disaster susceptibility and economic vulnerability. These weaknesses have led to the strengthening of the disaster resilience system becoming a priority in terms of the Batu government’s disaster risk reduction. The main objective of this study is to improve disaster risk management through the reinforcement of the disaster risk reduction instrument, which can improve the alertness and the mitigation capability of DRR. This research analyzed the susceptibility levels of five disasters—flood, landslide, drought, land fire, and COVID-19—using a quantitative method with panel data and a survey questionnaire. The influence variable was disaster susceptibility, which quantified economic vulnerability through ArcGIS and ILWIS analysis to generate the disaster susceptibility rate. Economic vulnerability was analyzed using static panel data in STATA/R, which generated the economic vulnerability index. The results of this research indicate that there are five villages in the high level of vulnerability category, three villages in the moderate level of vulnerability category, and another sixteen villages/urban villages in the low level of vulnerability category. Furthermore, static panel analysis found that local economic vulnerability in Batu is significantly influenced by three of the five disasters discussed in this research.

1. Introduction

Disasters occur in countries throughout the world, including Indonesia. The intensity of disasters in Indonesia is quite severe. In recent years, several disasters have occurred in Indonesia, such as floods, landslides, drought, and land fires, and recently, coronavirus disease 2019 (COVID-19) has been a novel disaster. Floods are a common and disastrous phenomenon in Indonesia when rainfall increases and leads to vast damage and the interruption of the affected city’s economy [1], as occurred in Batu City, East Java, Indonesia, in 2021. Landslides are another type of disaster that often occur in several regions, influenced by rainfall, soil type, slope, and land cover. Long-term impacts on the ecosystem and environment can arise when landslides occur in an area [2]. Another meteorologically driven natural disaster that occurs in Indonesia is drought, which has had an impact on several sectors, such as natural tourism in Indonesia, especially in Batu City, East Java, which hosts various forms of natural tourism. Land fires are another type of disaster that occur because of human-induced or natural causes, such as high temperatures and drought, leading to a loss of value and potentially having an impact on the local economy and public health [3]. COVID-19 first appeared in Wuhan, China, at the end of 2019, and then began to spread across the world at the end of 2020. COVID-19 has had an impact on world public health, including in Indonesia, and has affected several sectors such as tourism because of government interventions, which have included travel restrictions, quarantines for COVID-19 patients, social distancing protocols, and lockdown policies [4].
The National Disaster Management Agency (BNPB) noted that the number of disasters in Indonesia in 2015 was 1694, in 2016 was 2306, in 2017 was 2866, in 2018 was 3397, in 2019 was 3814, in 2020 was 4650, and in 2021 was as many as 5402 [5]. At the local level, it is necessary to develop various indicators and measurements of sustainable development, including local disaster risk instruments [6]. Indonesia has developed several disaster risk reduction instruments, one of which is susceptibility maps. Susceptibility maps are important because they can be used as instruments in policy making, allowing disaster intervention to be carried out accurately, quickly, and easily by all parties.
Over time, the instrument used for compiling disaster susceptibility maps has become one of the parameters in the preparation of disaster risk maps by BNPB. Unfortunately, such susceptibility instruments are incomplete because they are only seen from a spatial perspective. Development or improvement efforts have been carried out but are less effective. Therefore, the preparation of disaster susceptibility maps in Indonesia needs to continue to be developed.
The arrangement of instruments for disaster susceptibility maps in the context of risk reduction is very important. This is because the susceptibility map contains information on the actual location of potential hazards, the recurrence period, the frequency of occurrence, probability information, and the spatial distribution of the possibility of a disaster occurring [7].
In general, the development of susceptibility map instruments has been widely studied; for example, disaster susceptibility maps have been created for types of natural disasters such as floods, landslides, meteorological droughts, and land fires. A study in Batu City examined disaster susceptibility maps by combining spatial data and secondary data. Another study of natural disaster susceptibility created maps using fuzzy probability [8]. The biased probability method is a form of subjective probability modeling; however, this method is recommended by many researchers [9,10,11].
The fuzzy probability method is adequate, but this study aims to improve upon this approach by combining susceptibility maps using the spatial multicriteria evaluation (SMCE) method. SMCE is a method that combines and transforms several sources of geographic data into a single result, and was used in a previous study [12]. SMCE has the highest accuracy of 96%, while AHP has an accuracy of 91%, and the accuracy of WLC is 89%. SMCE allows users to perform multicriteria assessment spatially because this method is an applied-science-based method that combines spatial analysis using GIS and multicriteria evaluation (MCE) to transform spatial and non-spatial input, which generates output decisions [12].
Research into disaster risk management has previously been conducted; however, since 2020, a new disaster has emerged in Indonesia, namely COVID-19, which has led to economic shock. Disaster risk management by the government for the COVID-19 pandemic is also currently carried out separately from the management of other natural disasters, even though all of these disasters have a direct impact on the tourism sector, which is the most prominent sector in Batu City. Hence, the creation of a COVID-19 disaster map is important. The disaster map is used to identify villages/urban villages that have regional economic vulnerabilities, with particular regard to the tourism sector, so that villages/urban villages that are categorized as resilient to disasters can be mapped, both in terms of the COVID-19 pandemic and other natural disasters.
This research considers the impact of several types of disaster on local economic vulnerability. Proposing economic vulnerability indexes is important because disasters have a direct impact on economic loss. The analysis of economic vulnerability was conducted using static panel data in STATA/RStudio. This method considered land productive value using the land rent approach at the urban village/village scale, such that it is more detailed than other methods. The data processing outcome using SMCE is a level of vulnerability that shows the difference in the zoning of a village’s vulnerability level every year. Meanwhile, the processing of the static panel data in STATA/R produces an economic vulnerability index.
Batu City is a disaster-prone area, which falls into the moderate category of the Indonesian disaster risk index (IRBI) [13]. This city is also resilient to both natural disasters and the COVID-19 pandemic, as reflected in the majority of Batu City villages, which are designated to be disaster-resilient areas by the local government. This shows that Batu City is a disaster-resilient tourism area, likely as the result of its good disaster risk management system.
The general objective of this study is to improve the disaster risk management system by strengthening the disaster risk reduction instrument using a quantitative approach, analyzing panel data from 2015 to 2020 to investigate trends in the levels of disaster susceptibility and economic vulnerability in Batu, East Java. The specific purpose of this study is to map disaster-prone areas in Batu City from 2015 to 2020 and provide information about which disasters have a significant impact on local economic resilience. This study is expected to contribute to the arrangement of policies to strengthen the disaster resilience system, starting at the village level.

2. Materials and Methods

2.1. Study Area

The study was conducted in Batu City, East Java as shown in Figure 1, which has an area of 199.09 km2 and an average altitude of 862 m above sea level (masl). Geographically, Batu City is located between 112°17′10.90″ and 122°57′11″ east longitude and between 7°44′55.11″ and 8°26′35.45″ south latitude. Batu City is known as a tourist city. This is related to the vision and mission of Batu City’s government, which wants to introduce and develop as the city into Batu Tourism City. Batu City was chosen as the study area because of the availability of historical data on disaster occurrence. Batu City BPBD recorded 152 disasters that occurred in 2021 in Batu City, which included 106 landslides, 25 floods, 12 strong wind events, 3 soil cracks, 2 earthquakes, and 4 building fires; this disaster incidence was higher than that of a few years prior. A total of 205 victims were affected (died, suffered/evacuated, or injured) and 80 houses/buildings suffered light, moderate, or severe damage [14].

2.2. Data Analysis

Data for this research were obtained from 2015 to 2020. First, the results in this article were derived from processing the data shown in geographic maps regarding disaster susceptibility. The tools employed in this study were the software ArcMap 10.3 and the ILWIS. The ILWIS GIS was used to analyze and process satellite imagery that contributed to the environmental analysis of land cover change [15]. The purpose of this was to show which areas of Batu City from 2015 to 2020 were prone to disasters, through the use of a map.
Digital image analysis was conducted on vegetation cover, surface temperature, and drought index to produce a map of each parameter. At this stage, radiometric corrections were carried out to improve the visual and pixel values of the satellite images. DEM data analysis was carried out to map the height class and surface slope class. The level of rainfall was processed using the Thiessen polygon method to obtain a map of the distribution of rainfall. Hotspot analysis was used to find the hotspots occurring on a surface that potentially had forest/land fire hazards. In addition, an analysis of river network access and road network access using the ring buffer method on ArcMap was carried out to obtain road and river buffer maps. The results of the analysis were used to map disaster risk using the ILWIS software. The used materials are shown in Table 1.
The Integrated Land and Water Information System (ILWIS) is a geographic information system (GIS)-based piece of data processing software. A geographic information system (GIS) is used to analyze the risk of natural disaster threats through a spatial approach based on the type of observed natural disaster. A GIS can be used to identify suitable land and resource inventories for land suitability analysis [16]. The ILWIS was developed by the International Institute for Aerospace Survey and Earth Sciences, Netherlands [17]. The ILWIS is currently widely used for mapping disaster areas and land use planning [18] and is useful for combining spatial and non-spatial data.
Multicriteria analysis based on a spatial approach using ILWIS software provides the opportunity to take advantage of various existing spatial analysis criteria using problem scenario preparation, data standardization, weighting, and mapping. One of the weighting methods used in the ILWIS is spatial multicriteria evaluation (SMCE). SMCE is used as a plan simulation, so is very important in terms of planning. Several different areas can be analyzed for decision-making purposes. In this study, SMCE was used for the preparation of disaster susceptibility maps, namely, for floods, landslides, and land fires, while meteorological drought susceptibility was mapped using the standardized precipitation index (SPI) method, and COVID-19 susceptibility was mapped using IDW in ArcGIS.
The preparation of flood, landslide, and land fire susceptibility maps was carried out using SMCE for weighting with pairwise comparison on the ILWIS. A flood susceptibility map was created using the parameters of slope, rainfall, land cover, river buffer, and soil type. The river buffer map was derived from the topographic map, while the slope map was obtained from DEM data at the research location. Drainage density was obtained as a determining factor for the time of water movement, and the results were obtained by dividing the length of the river flow by the surface area [19]. The drainage density characteristics are obtained from Equation (1).
D = Σ L A
where D is drainage density (km/km2), L is river length (km), and A is watershed area/unit of analysis (km2).
Using the slope, river buffer, land cover, and rainfall use, as per the classification proposed by Costache (2015) [20], given in Table 2, the results of flood mapping were overlaid with a boundary map of the study area for flood susceptibility analysis.
The parameters that were used to map landslide-prone areas consist of natural and human factors, namely, slope, rainfall, soil type, and land cover. Furthermore, to obtain the zoning of the landslide area in the research area, weighting of the processed parameters was carried out as shown in Table 3.
A fire susceptibility map was created using secondary data related to the environmental conditions that were related to fires, namely rainfall, river buffers, and land cover. The level of vulnerability of land cover in terms of fire susceptibility was in line with that proposed by Humam (2020) [21], as shown in Table 4 below.
In addition, to obtain the zoning of fire-prone areas in the research area, weighting of the parameters that were processed using ILWIS software was carried out. The scores for the fire-prone parameters are arranged as shown in Table 5.
The level of meteorological drought was obtained by the interpolation of drought values. The drought values were obtained by calculating the monthly rainfall value using the standardized precipitation index (SPI) using the probabilistic statistical method of gamma distribution. The SPI values and drought classification can be seen in Table 6.
The SPI value obtained was used as a reference to determine the drought condition, the results of which were used as the basis for the interpolation process using ArcMap software in order to produce a meteorological drought map using ILWIS software. The COVID-19 susceptibility map was obtained by mapping the COVID-19 data according to the administrative area, which resulted in the COVID-19 distribution map.
COVID-19 distribution map using Inverse Distance Weighted (IDW). All interpolation methods were developed on the theory that points closer to each other have more correlations and similarities than points farther apart. The IDW method basically assumes that the correlation rate and similarity between adjacent points is proportional to the distance between them, which can be defined as the inverse distance function of each point from its adjacent point. It should be remembered that for this method, the definition of the neighborhood radius and the performance related to the inverse range function are considered key issues. This method is used with enough sample points (at least 14 points) spread on the local scale levels. The main factor affecting the accuracy of the inverse range interpolator is the value of the performance parameter [22] (Table 7). Furthermore, the size of the neighborhood and the number of neighborhoods is related to the accuracy of the result.
Z 0 = i = 1 N Z i . d i = n i = i N d i = n
  • Z0 = the estimation value of variable z in point I
  • Zi = the sample value in point I
  • di = the distance of sample point to estimated point
  • N = the coefficient that determines weigh based on a distance
  • n = The total number of predictions for each validation case.
Secondly, analysis using static panel data was carried out. Static panels are intended to examine the impact of disasters on the tourism sector and were used here to determine how this impact has affected the vulnerability of the local economy during natural disasters and the COVID-19 pandemic in Batu City, East Java. Baltagi (2005) [23] stated several advantages of this method, namely: (1) it identifies and controls the problem of the heterogeneity (unobserved individual heterogeneity) of variables not included in the model; (2) it provides complete, efficient information, high variability, more degrees of freedom, and reduced collinearity between variables; (3) it identifies and calculates results that are not identified by time series or cross-sections; and (4) it has the ability to more deeply examine dynamic problems that are more complex than those identified by time series or cross-sections. The panel analysis model was used to show the influence of the tourism sector and the threat of disaster on economic vulnerability [24], as follows:
E V i t = β 0 + β 1 N R F i t + β 2 T O U R i t + β 3 F L O O D i t + β 4 L A N D F I R E i t + β 5 D R O U G H T i t + β 6 L A N D S L I D E i t + β 7 C O V I D 19 i t + ε i t
where E V i t is economic vulnerability in location i at time t, N R F i t is the number of rooms filled in location i at time t, T O U R i t is the number of tourists in location i at time t, F L O O D i t is the flood susceptibility index in location i at time t, L A N D F I R E i t is the land fire susceptibility index in location i at time t, D R O U G H T i t is the drought susceptibility index in location i at time t, L A N D S L I D E i t is the landslide susceptibility index in location i at time t, C O V I D 19 i t is the COVID-19 susceptibility index in location i at time t, n is estimated coefficient for each variable (n = 1, 2, 3, …, 7), and ɑ is the intercept.
The calculation of BNPB’s economic vulnerability index (2012) [25] is conducted based on the following formula.
E V i = 0.6 × P r o d u c t i v e   l a n d   s c o r e i + 0.4 × G D R P   s c o r e i ,  
where
P r o d u c t i v e   l a n d   s c o r e i = P r o d u c t i v e   l a n d   c l a s s   R L P i M a x i m u m   v a l u e   o f   p r o d u c t i v e   l a n d   c l a s s B i g g e s t   R L P i   i n   B a t u   C i t y
G D R P   s c o r e i = G D R P   c l a s s   R P P i M a x i m u m   v a l u e   o f   G D R P   c l a s s   B i g g e s t   R P P i   i n   B a t u   C i t y
R L P i = R L P k k L L P k k × L L P i  
R P P i = R P P k k L k k × L i
where the values of R L P k k ,   L L P k k ,   L P P i ,   L i ,   L k k , and R P P k k are obtained from field observations and interviews with farmers in local villages.
Productive land value is calculated using the economic land rent approach [26] as follows:
L R = Y m c Y . t . d  
where L R is land rent, which is used as a representation of land productivity value (Rp); Y is output per land unit (ton/hectare); m is the price per unit of output (Rp/kg); c is the production cost of the unit (Rp/kg); t is the transportation cost per unit of output per unit of distance (Rp/Kg/km); and d is the distance from the production site to the city (km).

3. Results

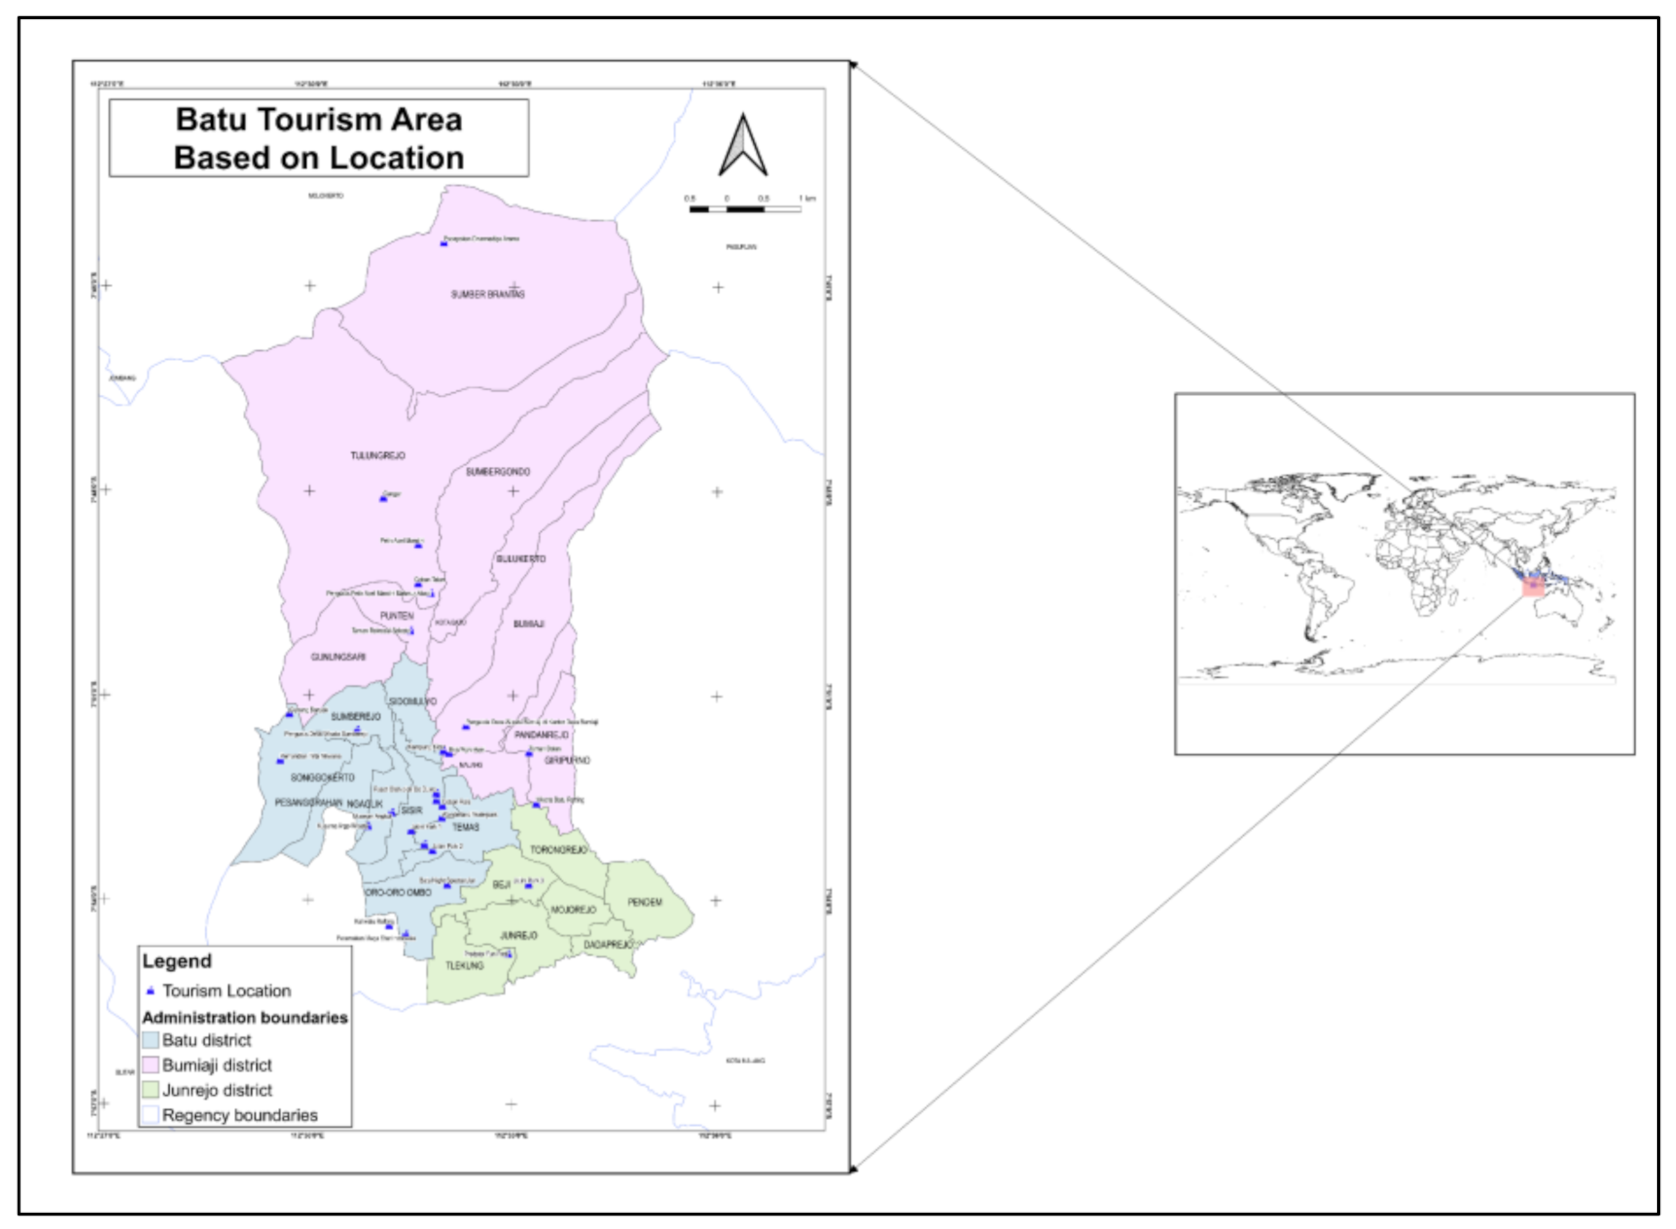
3.1. The Threat of Disasters in Batu City, Indonesia

Based on 
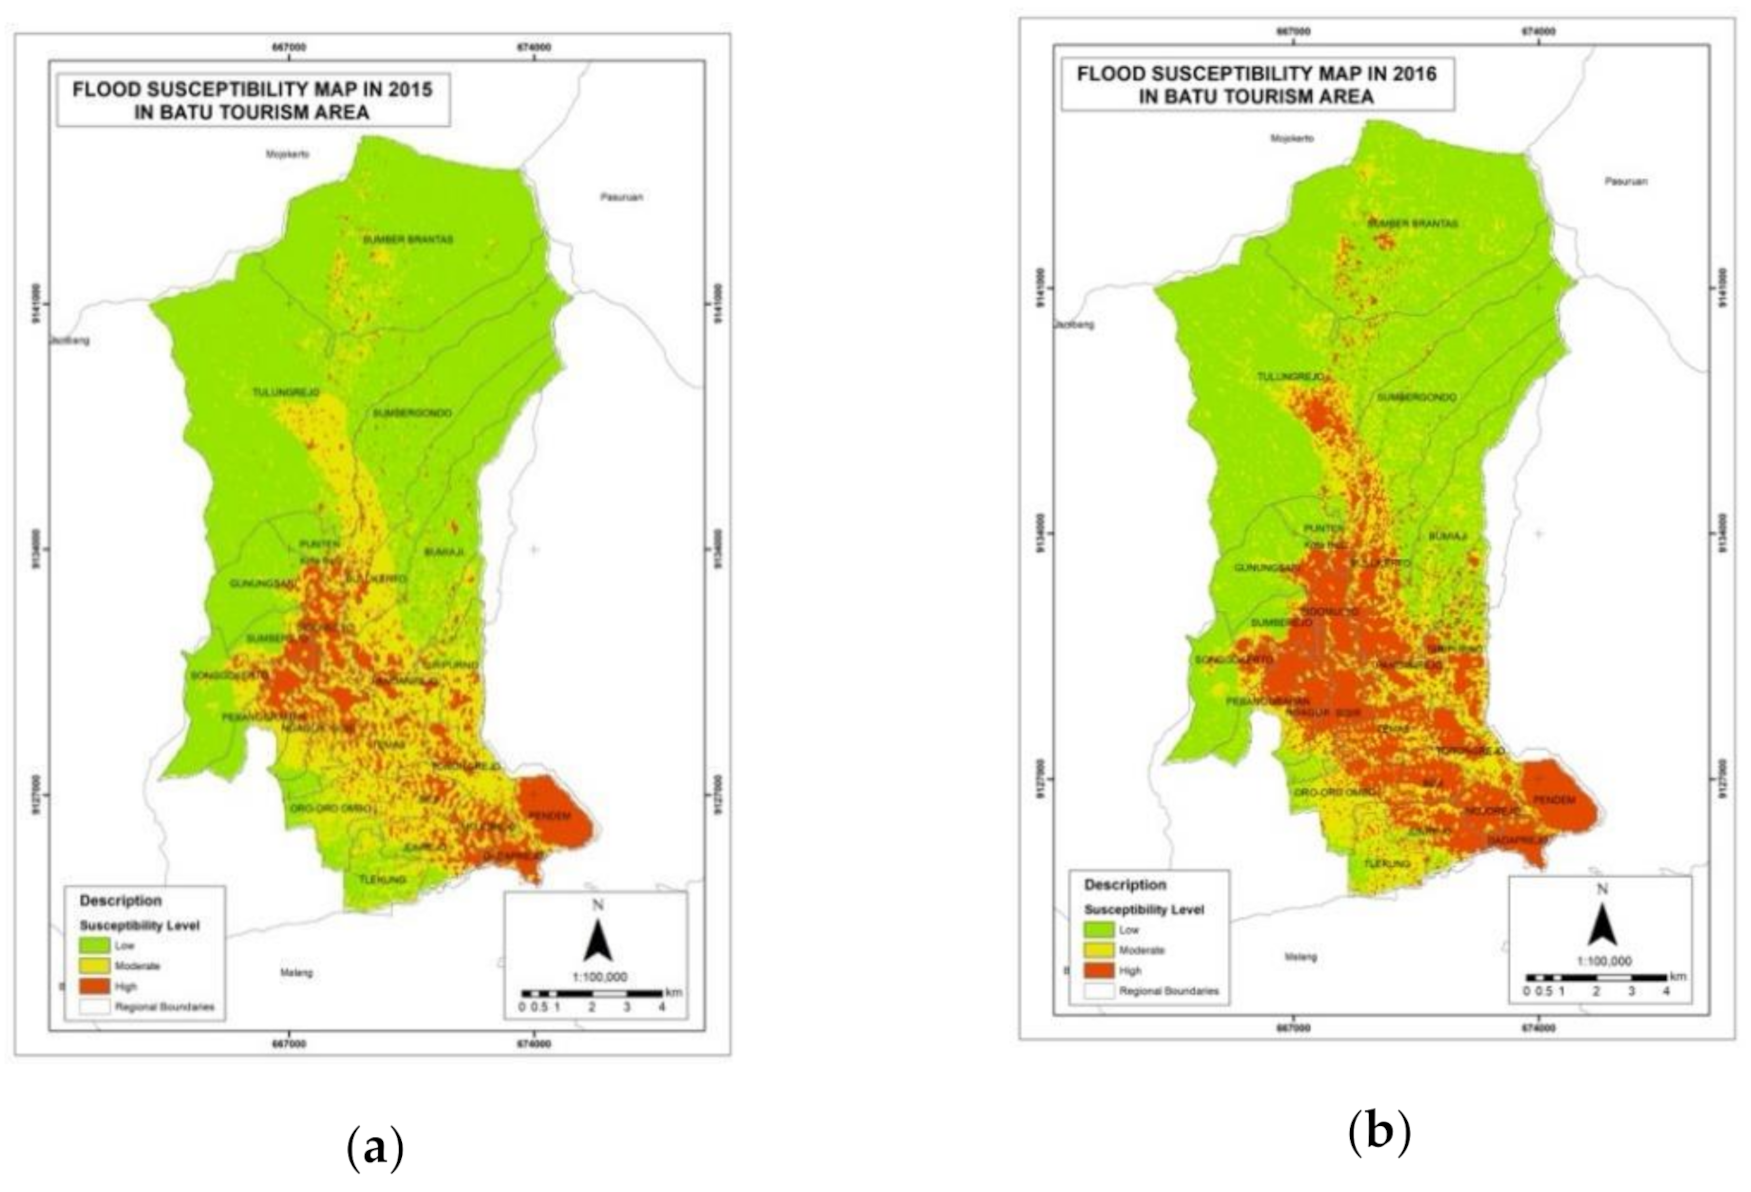
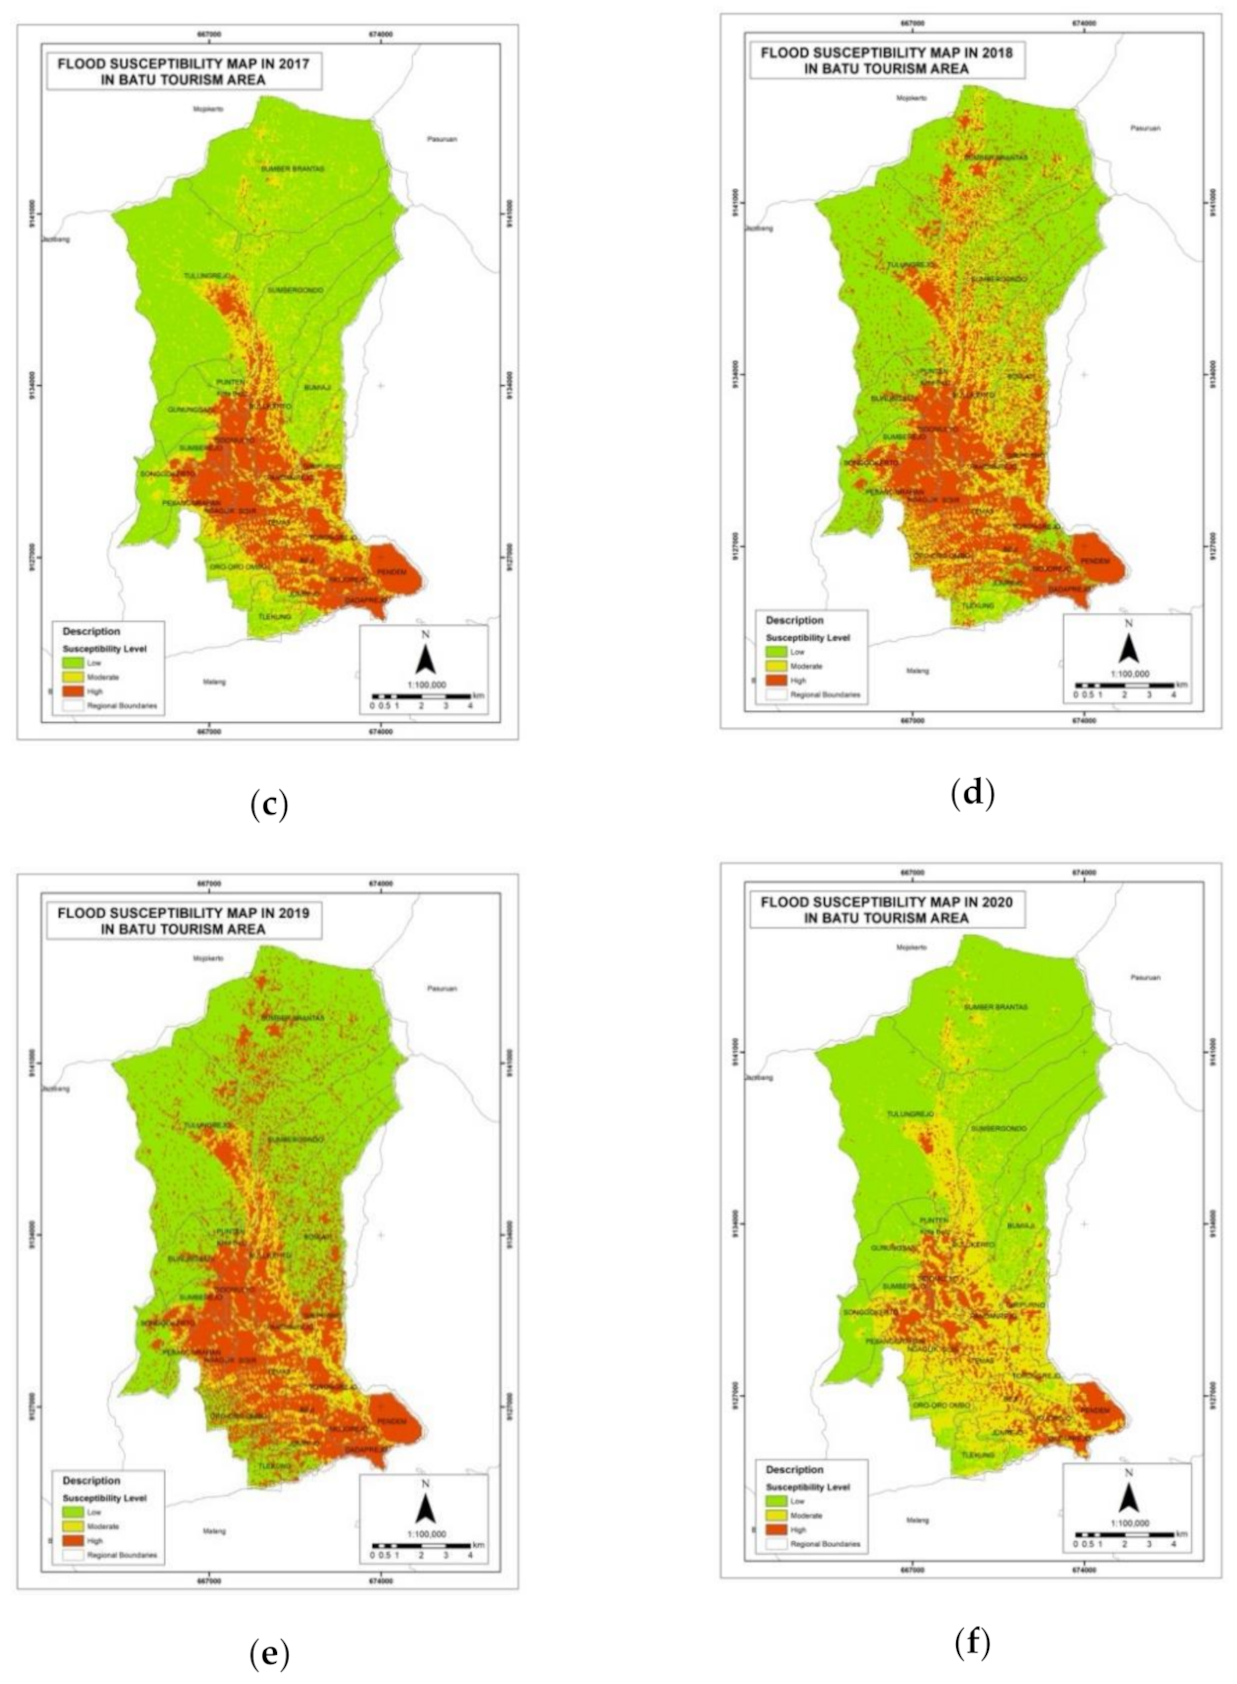
Figure 2, the average scoring for the flood susceptibility category in the villages of the Batu Tourism Area across six years (2015 to 2020) showed that the most susceptible village is Bulukerto Village, with a final score of 0.89, and the least susceptible village is Sisir Village, with a final score of 0.79.
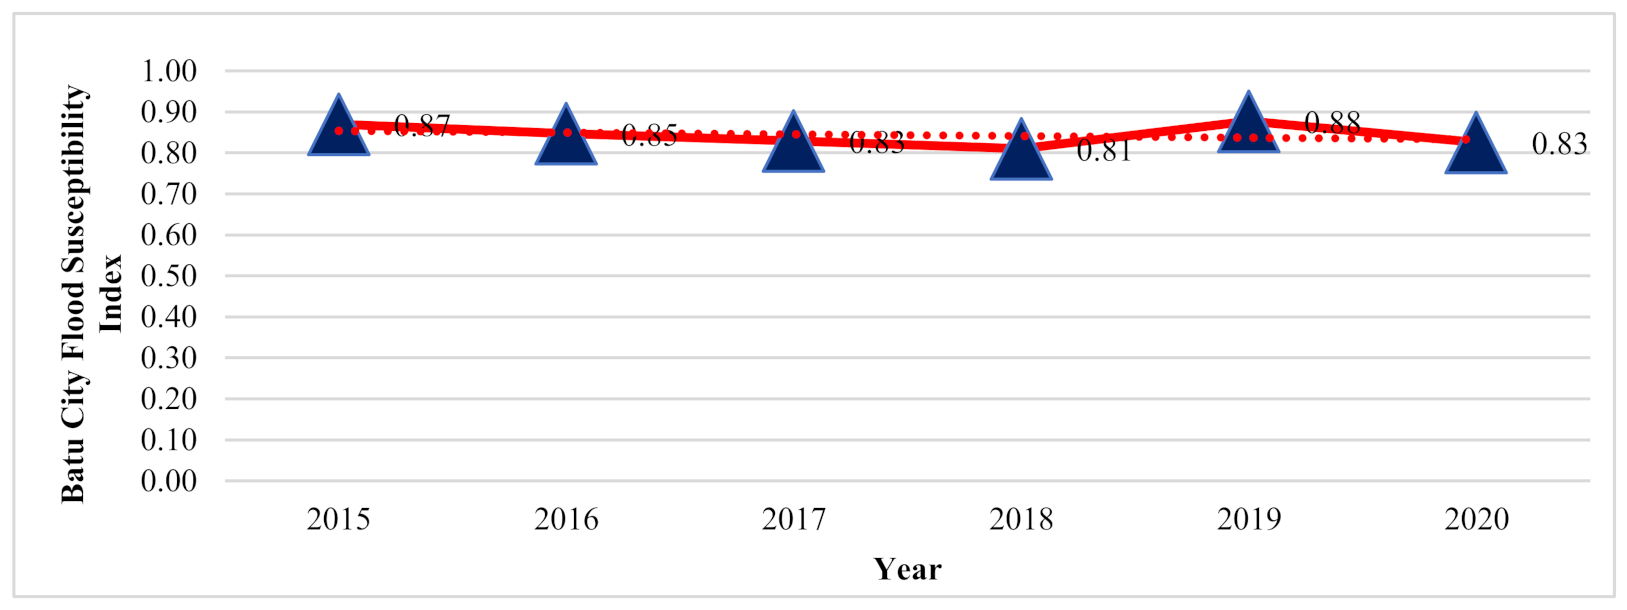
Figure 3 shows that the flood susceptibility trend in Batu City during the observation period decreased, although it was still above 0.8 for the index range.
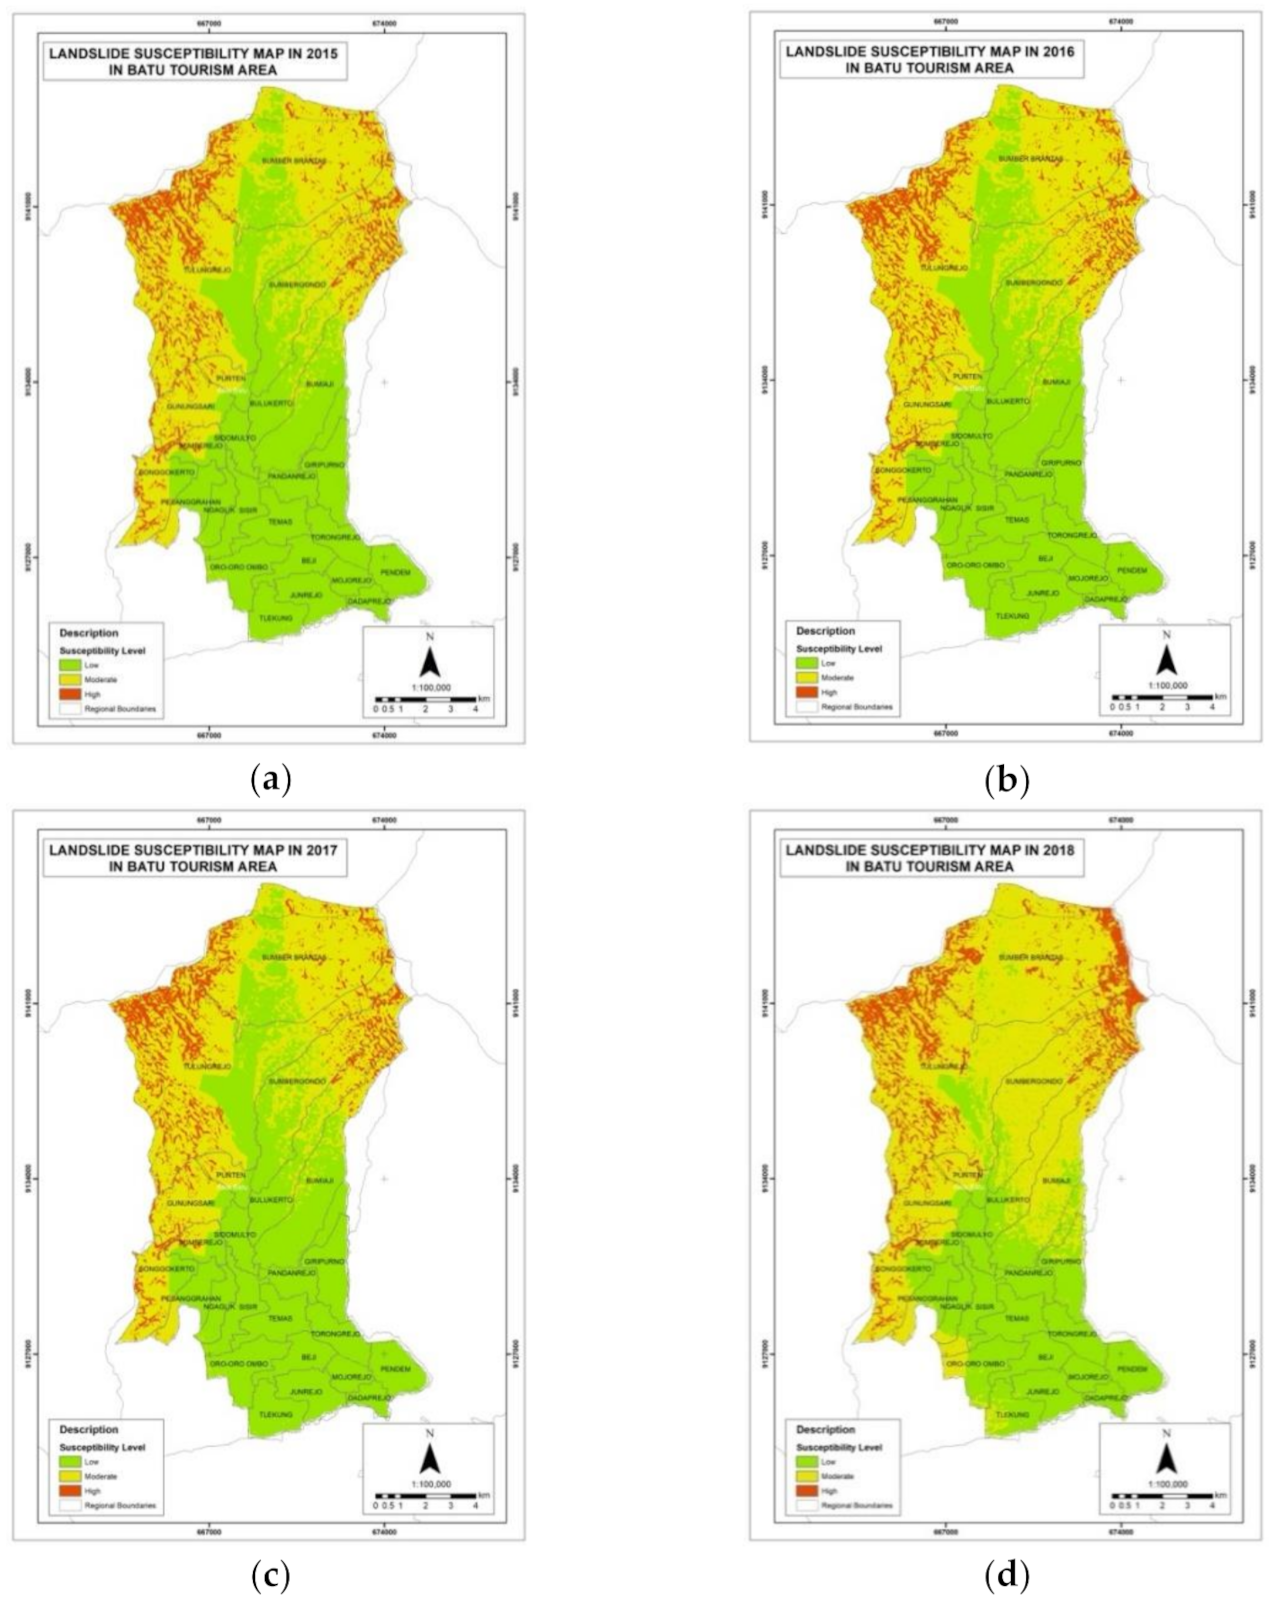
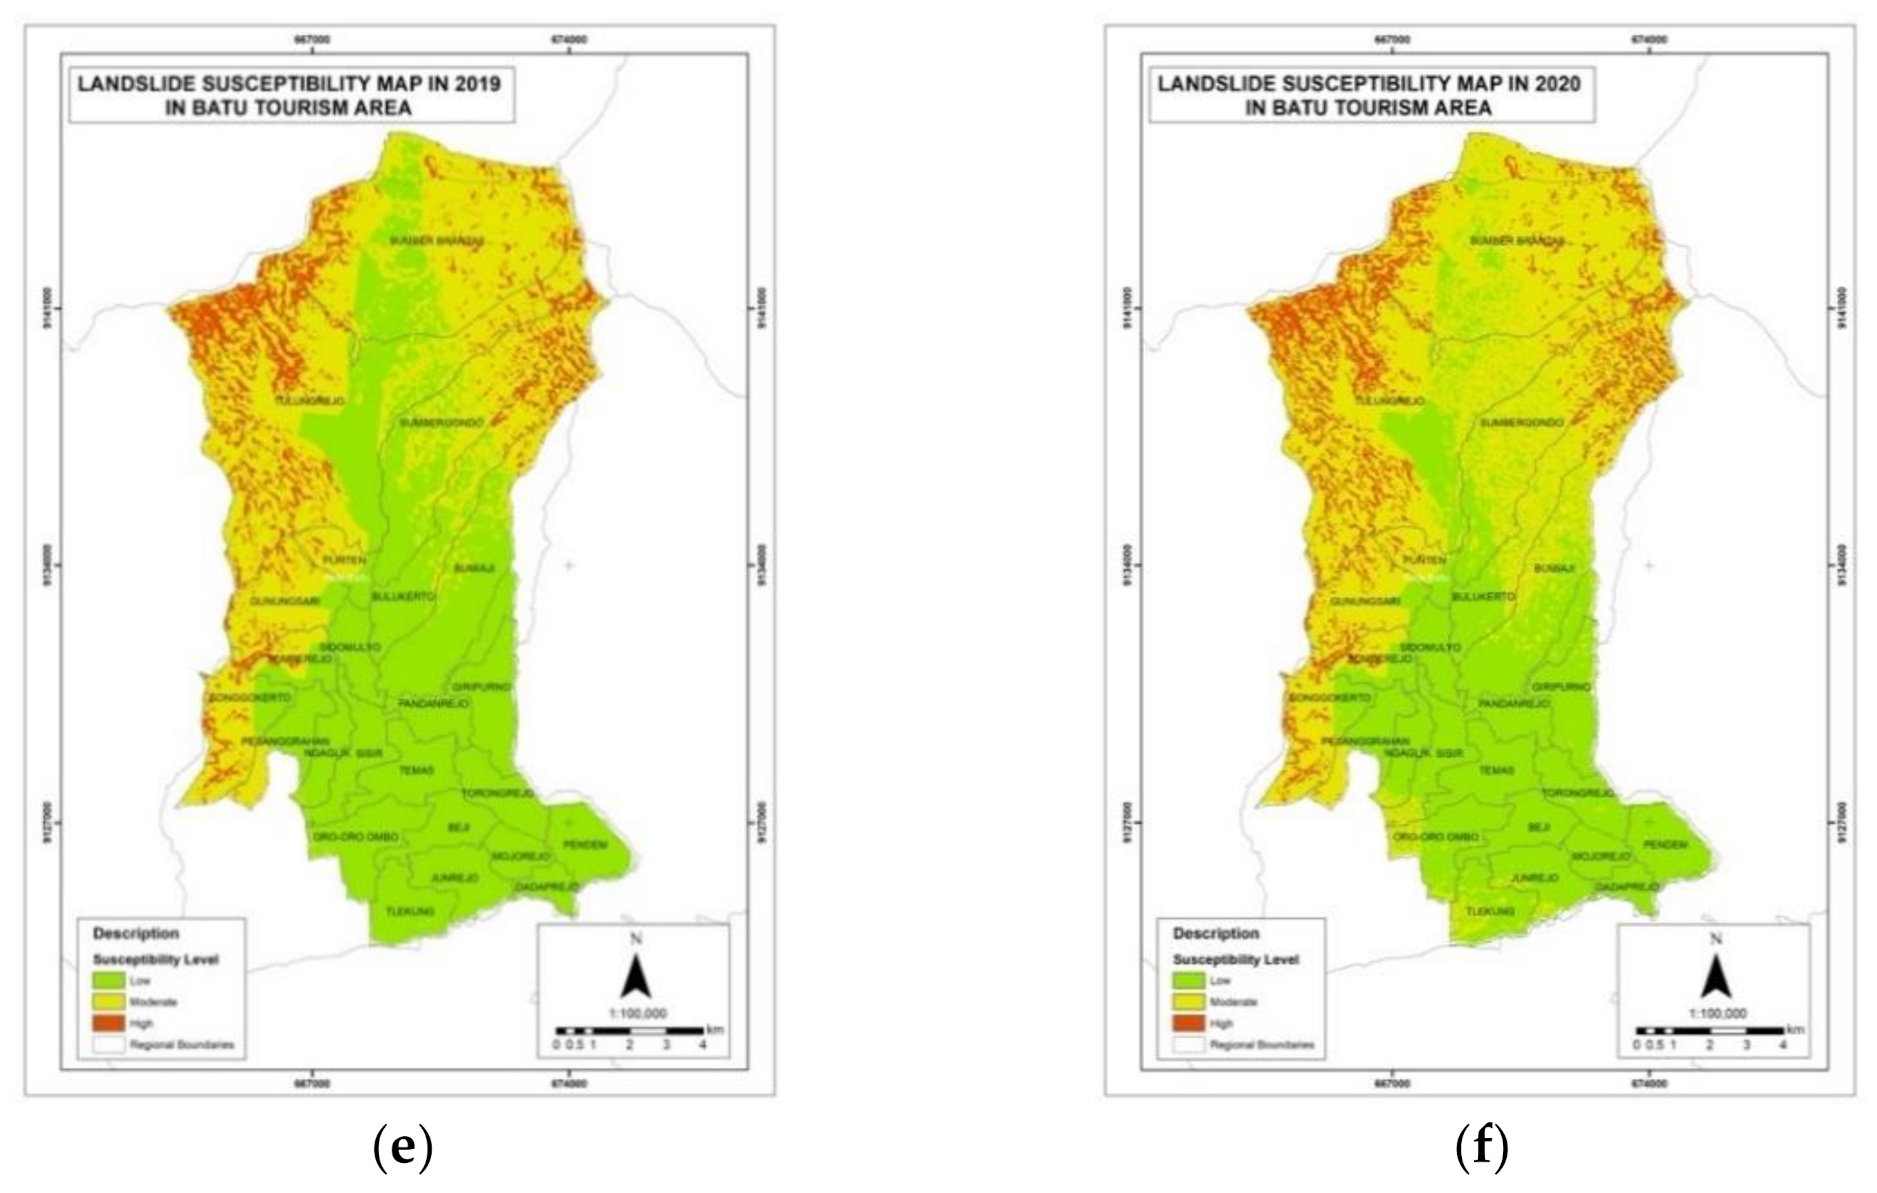
The data processing results of the parameters, as obtained through the ILWIS by weighting parameter values with pairwise comparison, are as follows: slope is 0.457, geomorphology is 0.257, rainfall is 0.570, soil type is 0.09, and land cover is 0.04. Based on the level distribution of landslide susceptibility in Figure 4, it can be concluded that the village in Batu Tourism Area with the highest level of susceptibility is Mojorejo Village, with a final score of 0.96; meanwhile, the villages with the lowest level are Dadaprejo Village and Pesanggarahan Village, which both had a final score of 0.29.
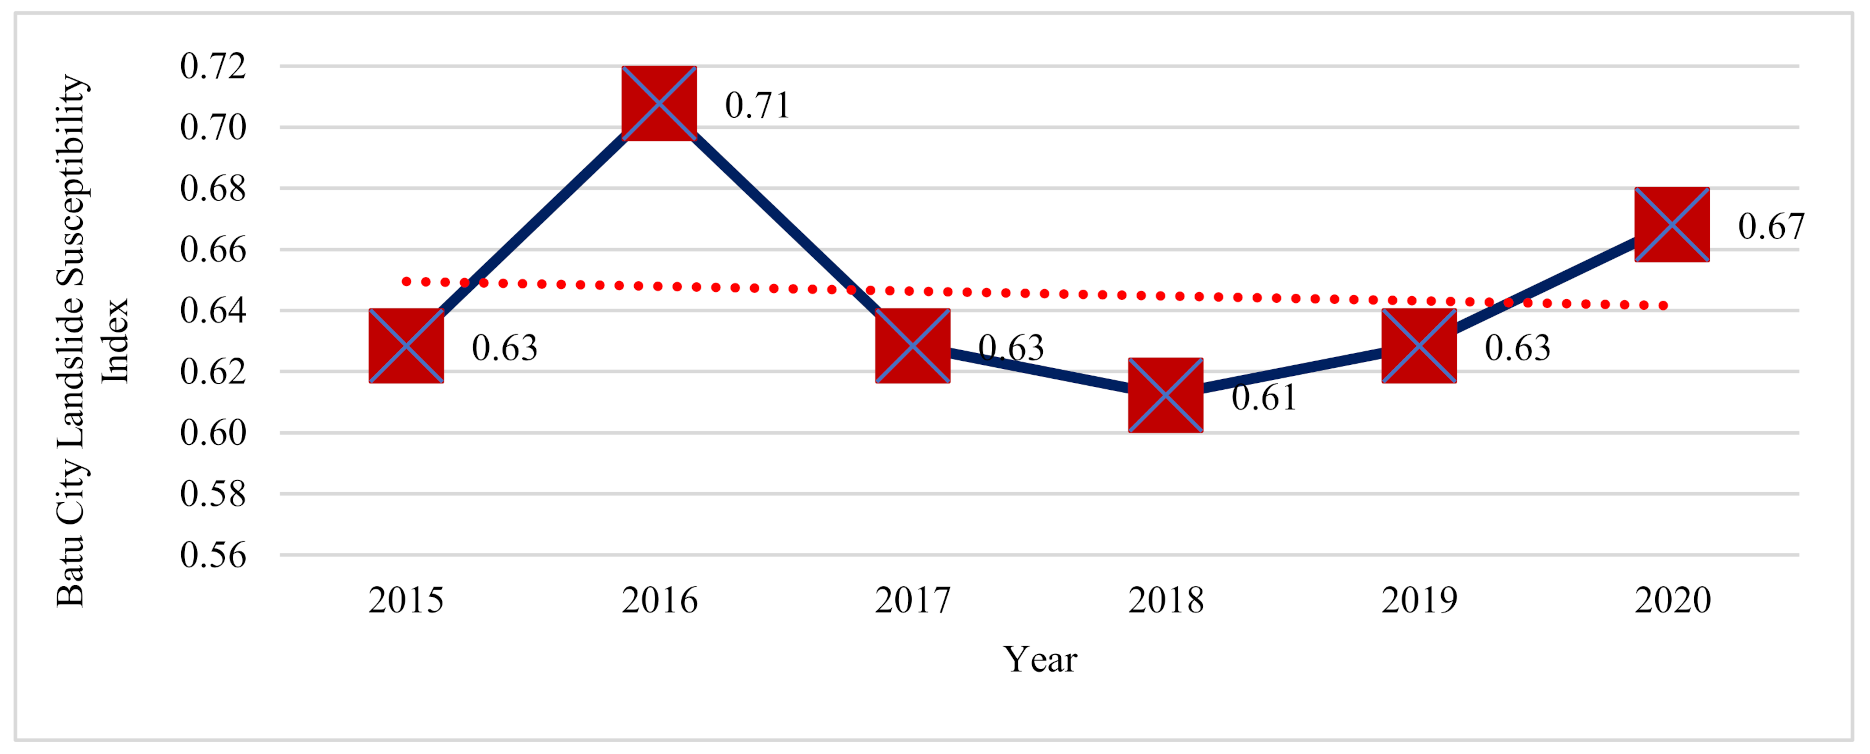
Based on Figure 5, landslide susceptibility in Batu decreased during the observation period from 2015 to 2020.
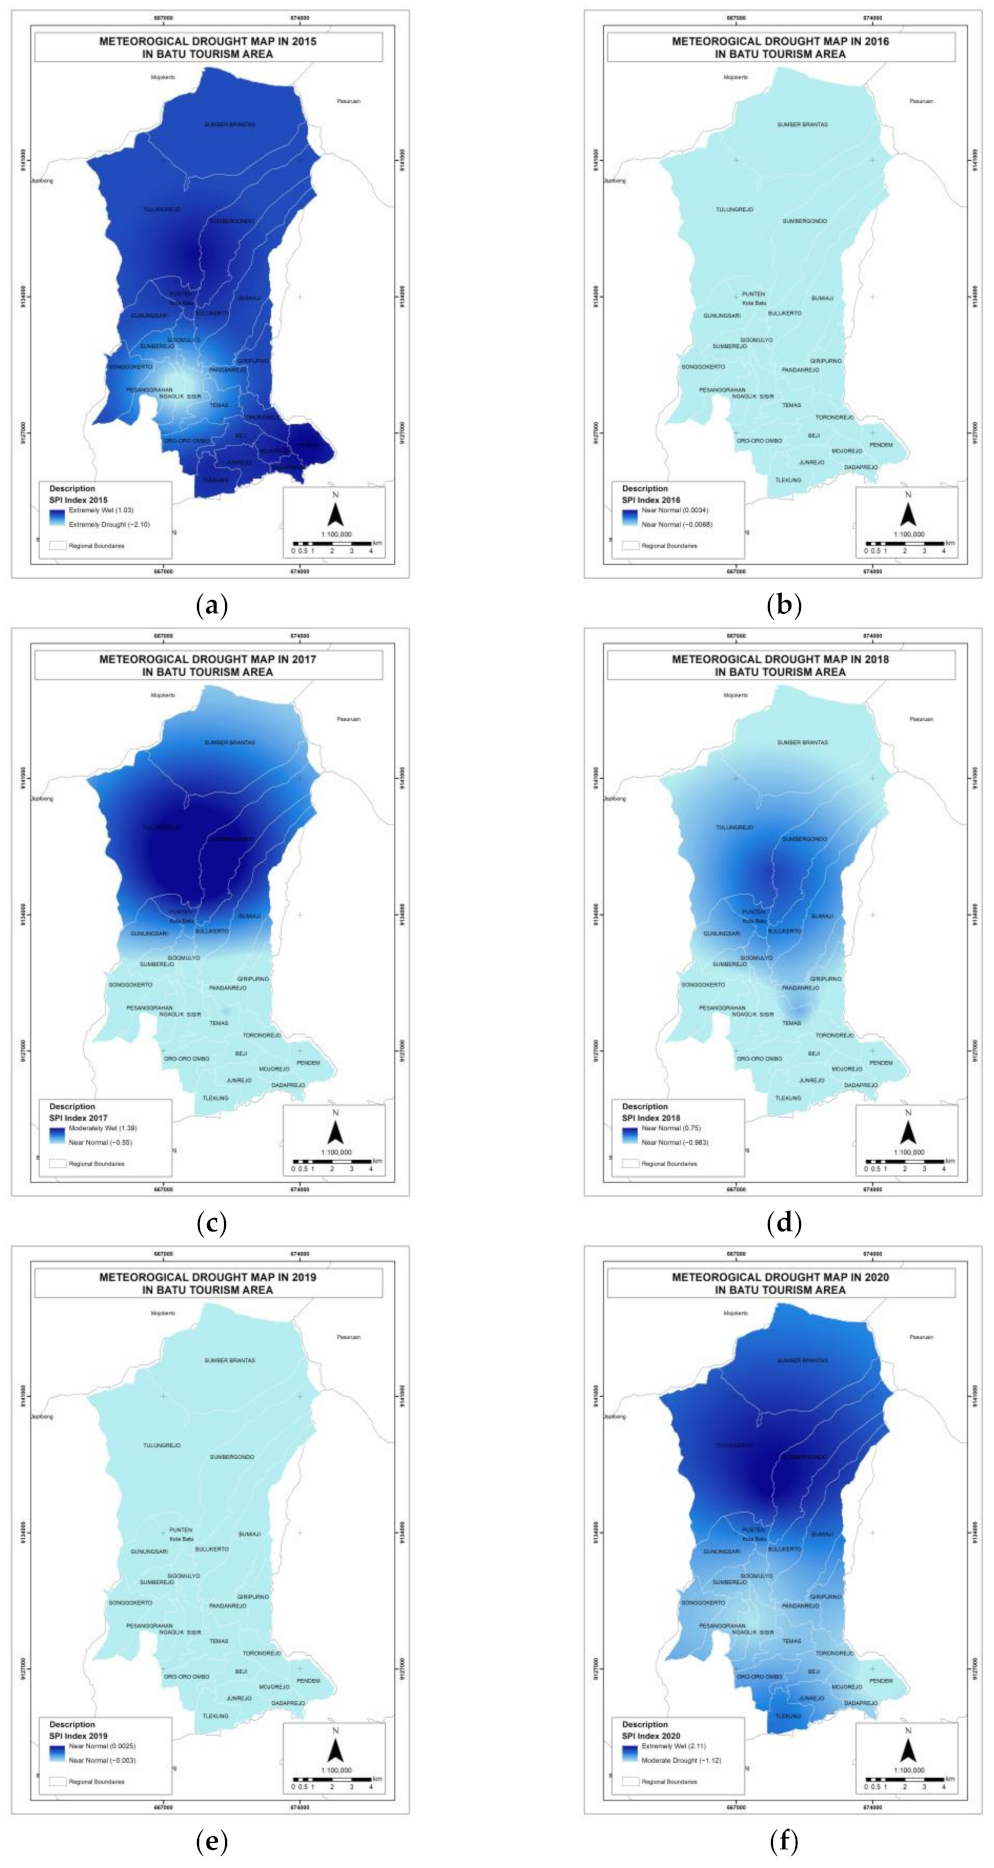
The results of the meteorological drought hazard map in Figure 6 show that the Batu City Tourism Area has varying levels of drought. Based on these results, it can be concluded that the village most susceptible to meteorological drought in the Batu Tourism Area is Sisir Village, with a final score of 0.98, and the least susceptible villages are Junrejo Village, Ngaglik Village, and Torongrejo Village, which all had a final score of 0.57.
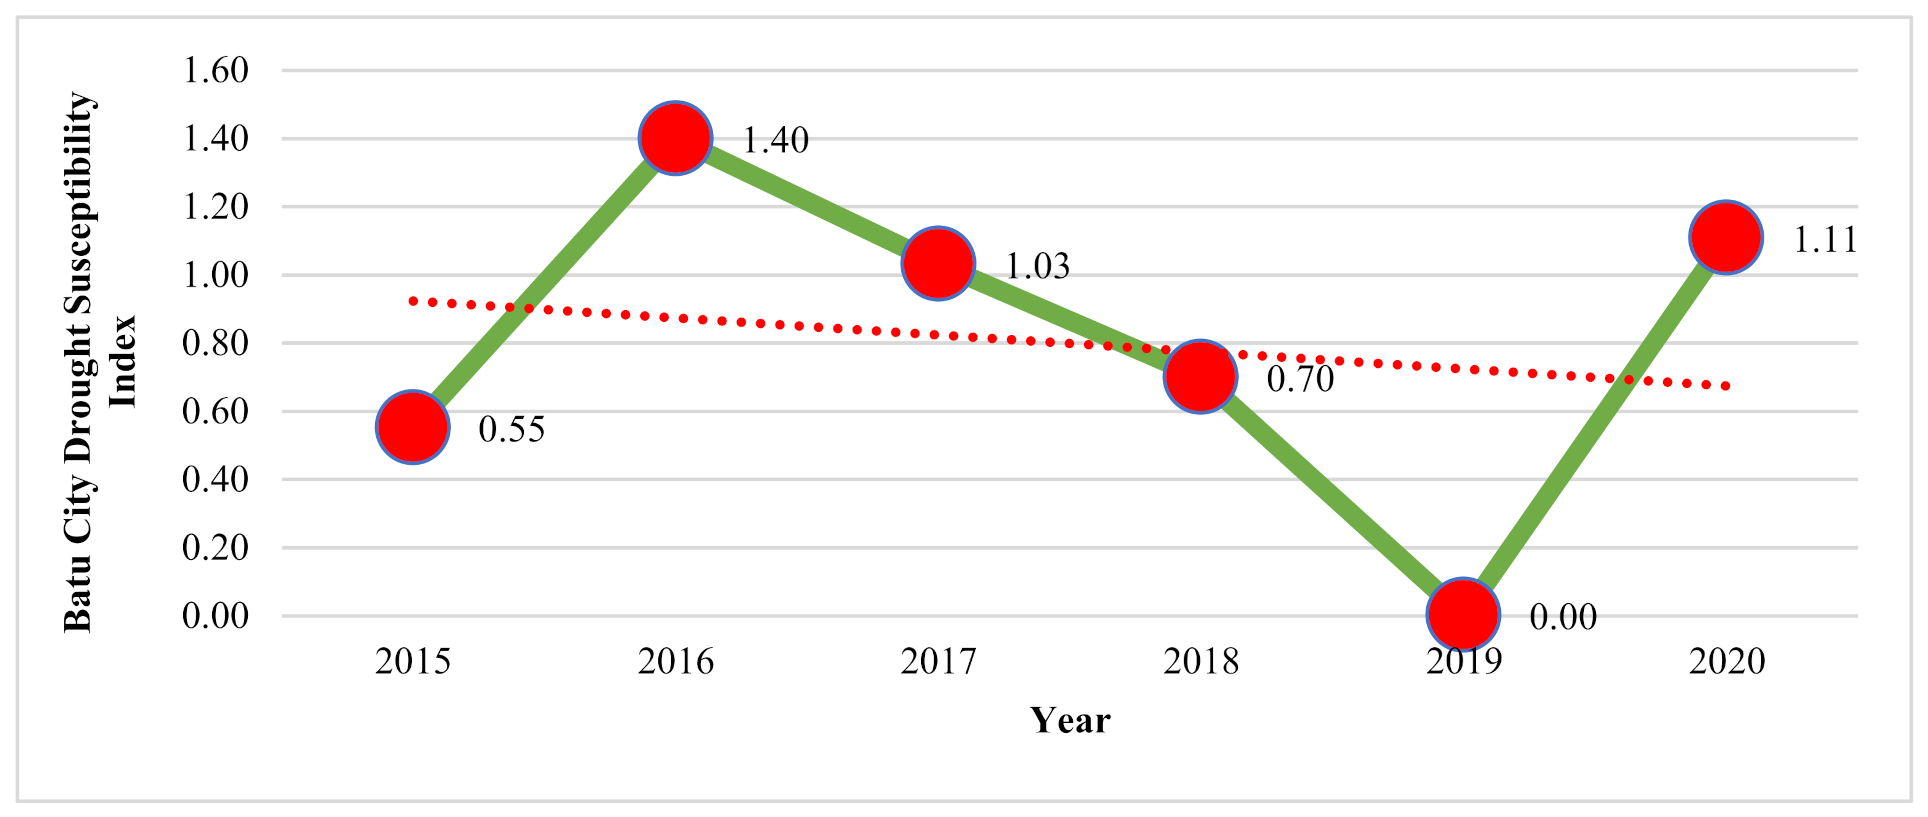
Furthermore, Figure 7 shows that the susceptibility to drought in Batu City during the observation period of 2015 to 2020 exhibited a decreasing trend. However, in 2016 and 2020, the drought susceptibility index increased.
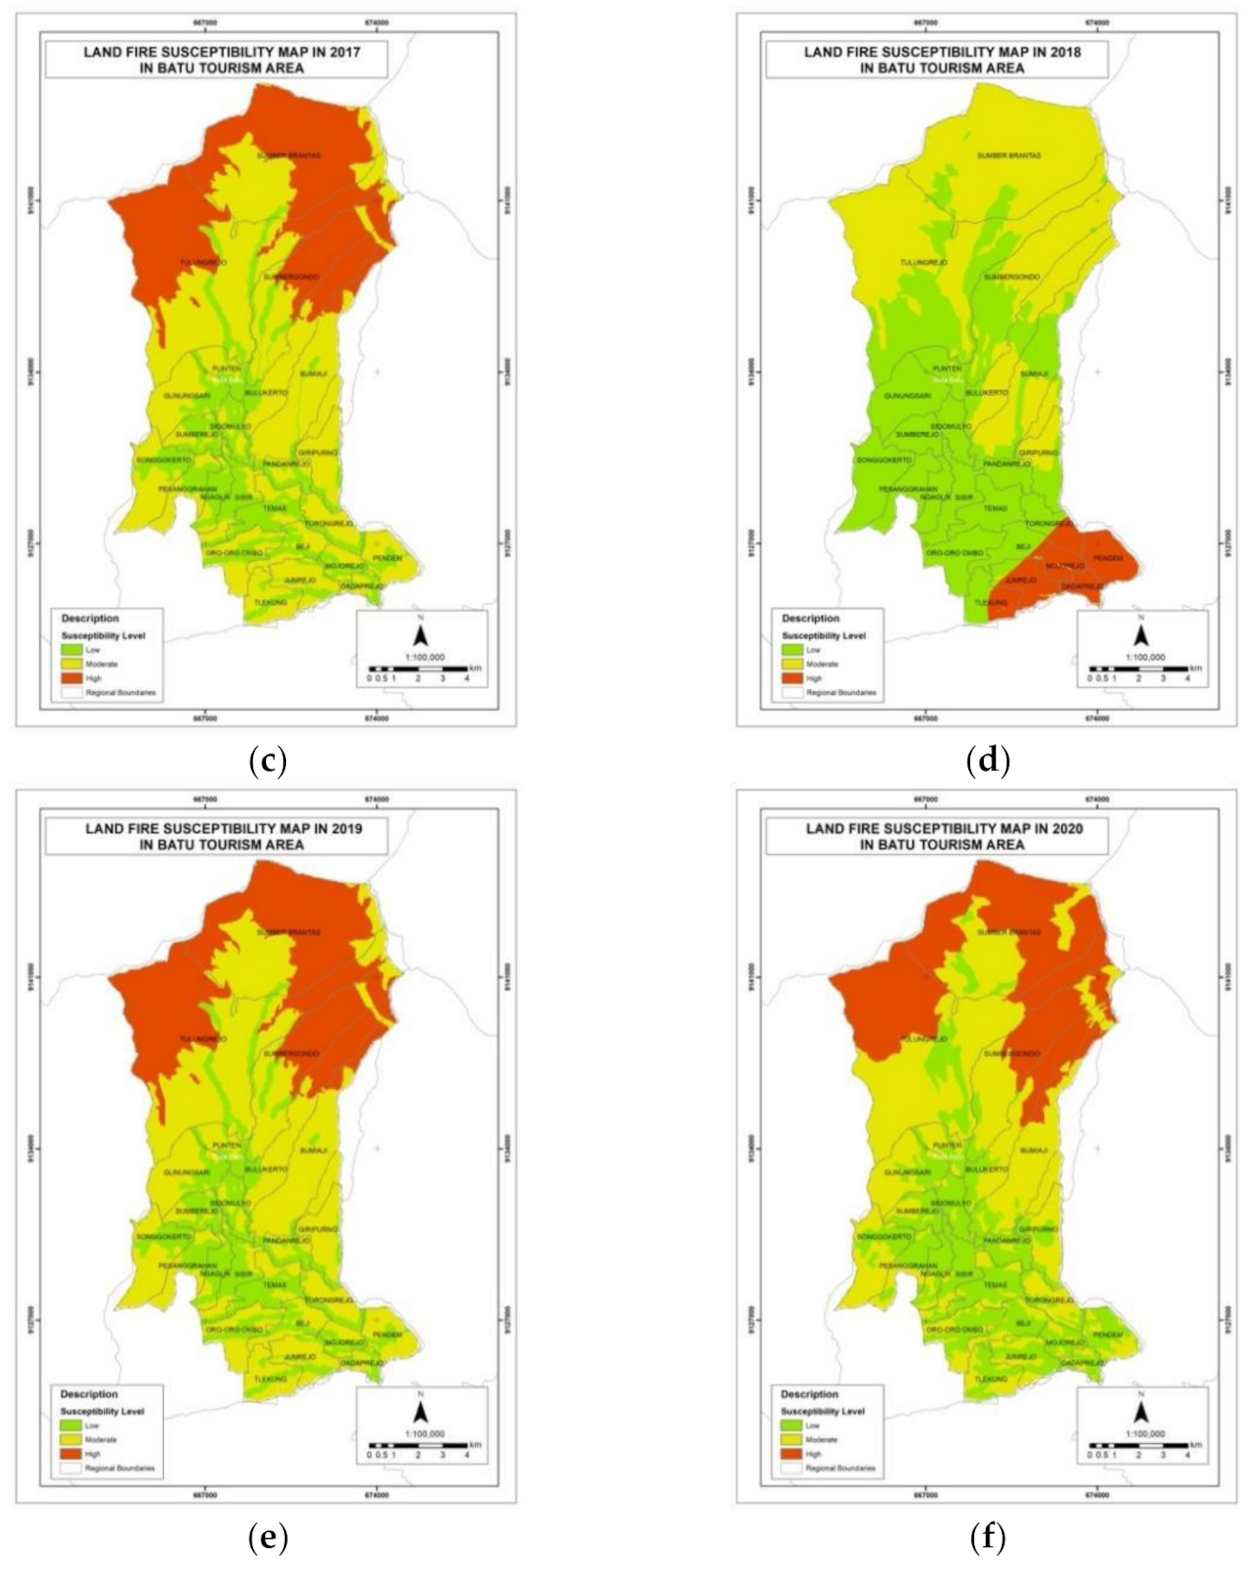
In terms of land fire susceptibility, from Figure 8 it can be concluded that the most susceptible village in the Batu Tourism Area is Sisir Village, with a final score of 0.82, and the least susceptible is Sidomulyo Village, which had a final score of 0.56.
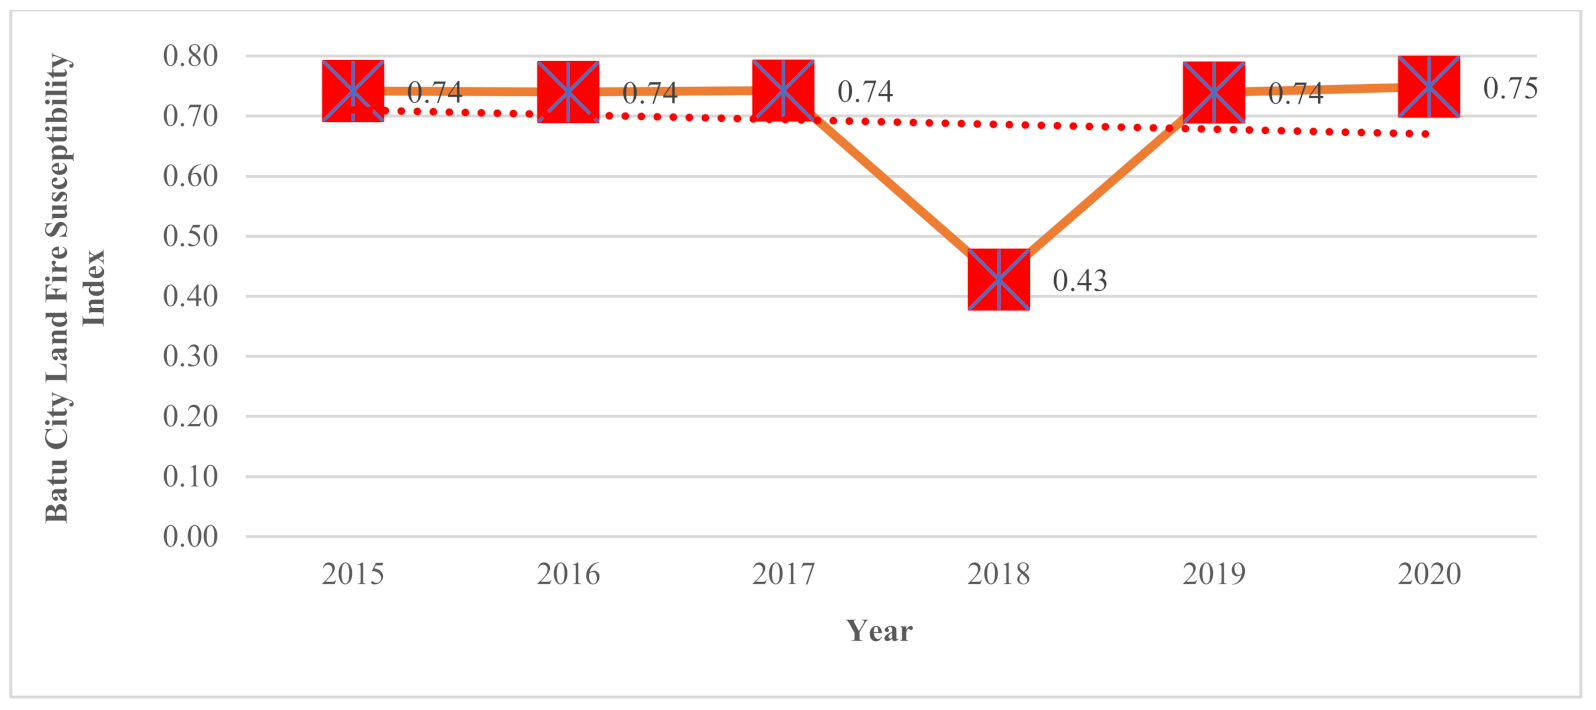
According to Figure 9, the land fire susceptibility in Batu City during the observation period of 2015 to 2020 tended to stagnate at around 0.74, but there was a significant dip in 2018, when the land fire susceptibility index was 0.43. In general, the trend of the land fire susceptibility index in Batu City tended to decrease, although this decrease is not large.
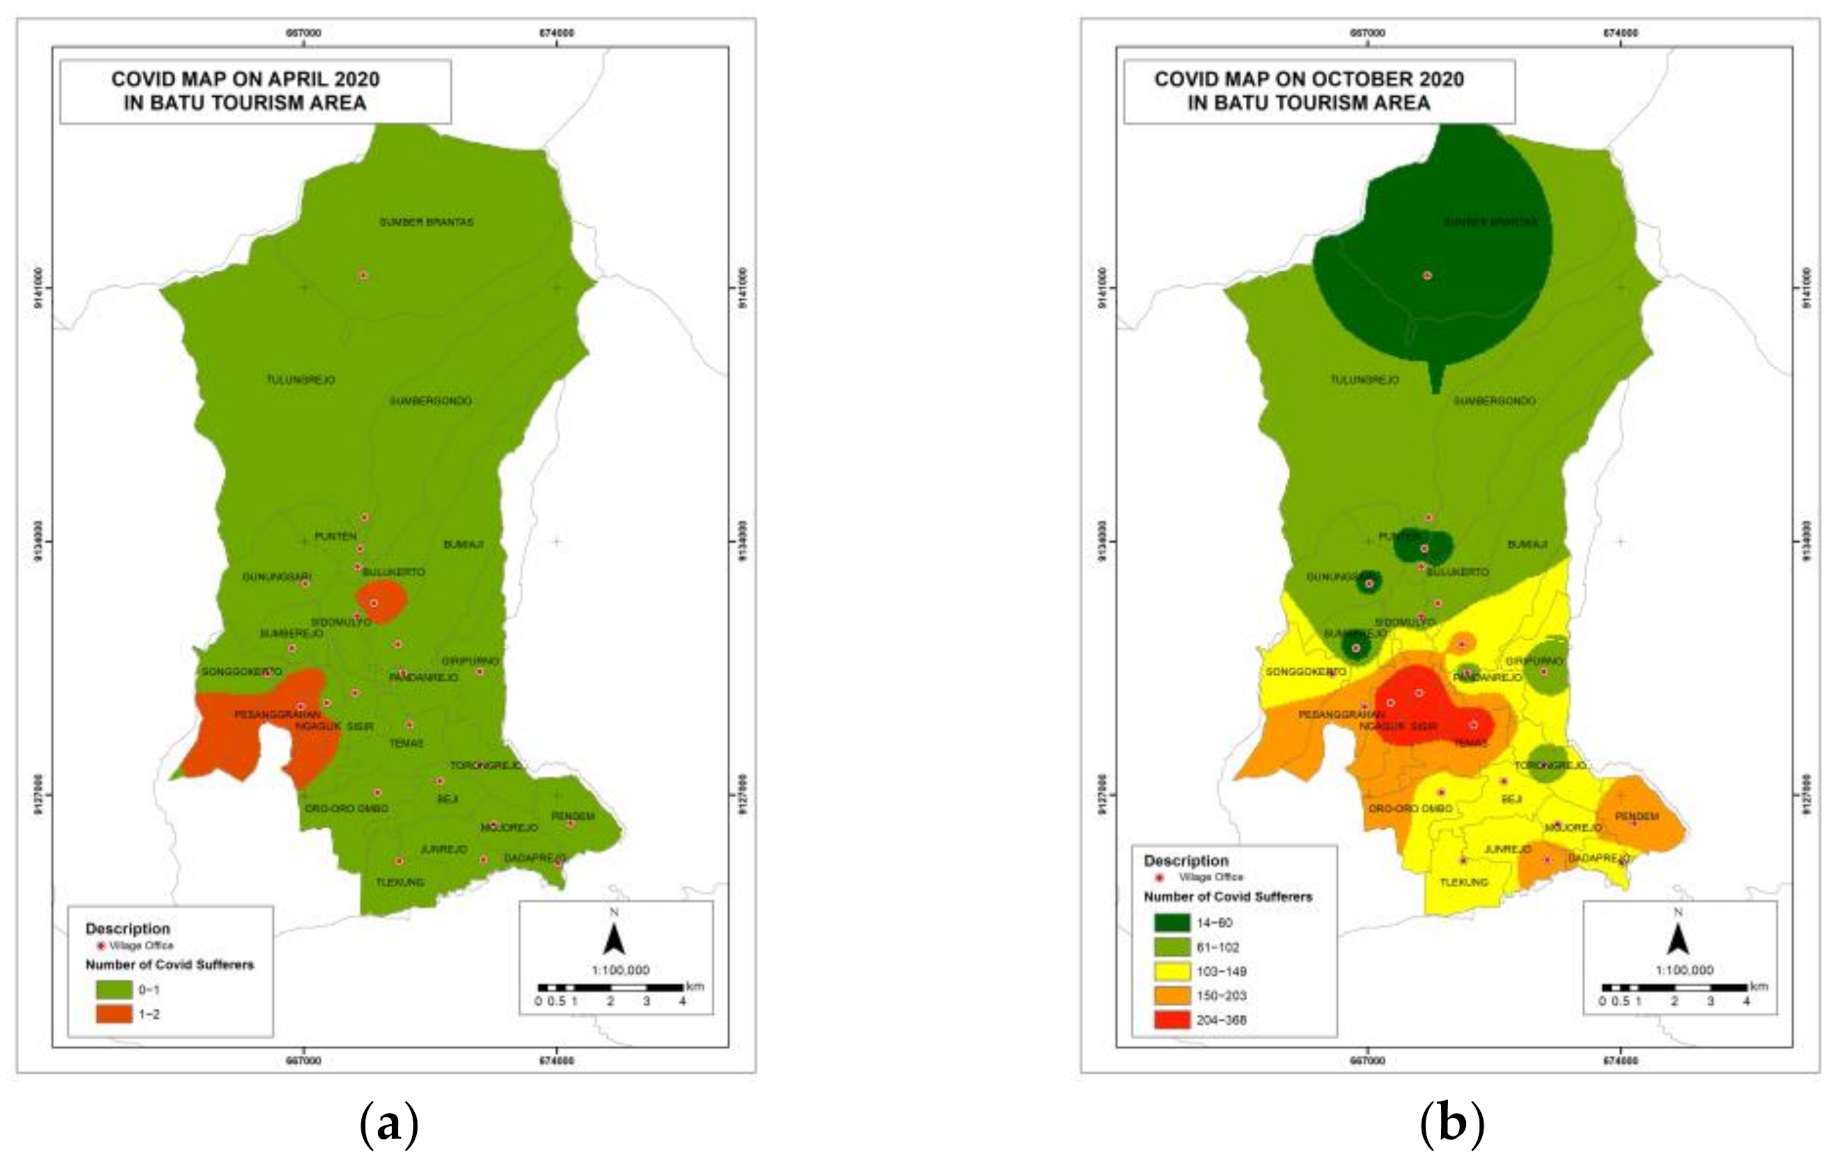
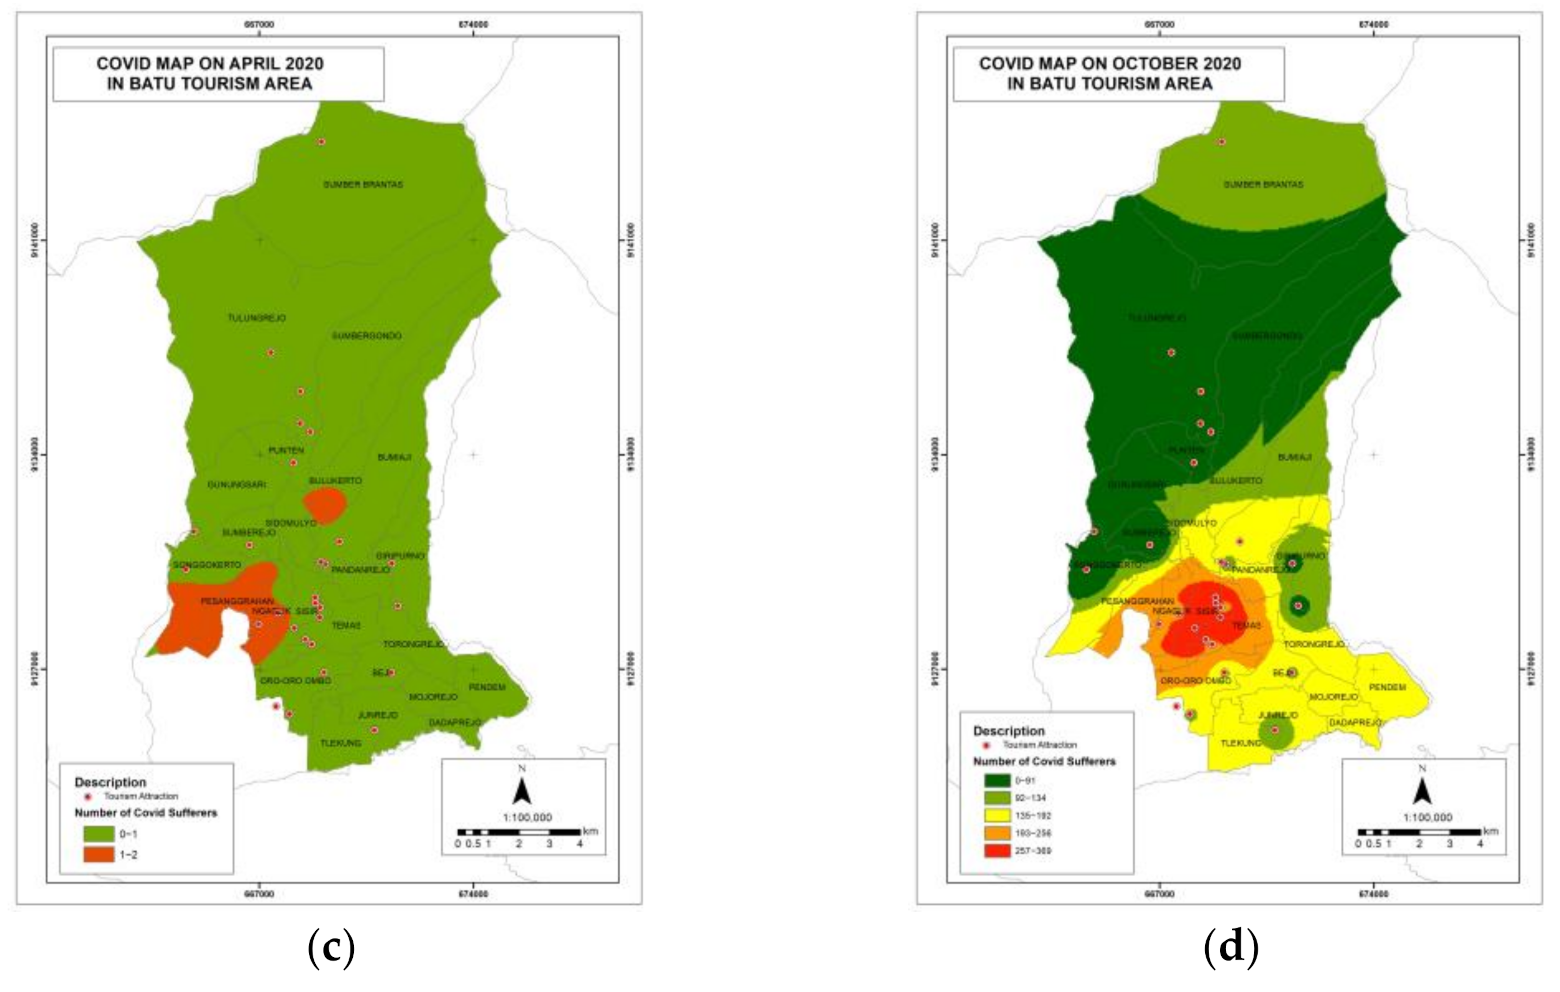
The next disaster to be assessed was the COVID-19 pandemic. The number of positive COVID-19 cases in the Batu Tourism Area increased from April to October 2020. The highest numbers of COVID-19 cases could be found in Sisir Village, Temas Village, and Pesanggarahan Village, while the lowest numbers of COVID-19 cases were in Sumberejo Village and Sumbergondo Village, which each had less than 20 cases. Based on Figure 10, it can be concluded that the most susceptible village in the Batu Tourism Area to COVID-19 cases is Gunungsari Village, which had a final score of 184, and the least susceptible is Pesanggrahan Village, with a final score of 7.

3.2. Impact of Disaster Threats on Economic Resilience in Batu City, East Java, Indonesia

In the analysis of the panel data, pooled least squares (PLS) modeling was used because, with the N>T data structure (more cross-sectional objects than periods), the PLS model can produce unbiased and consistent parameter estimation results [27]. The PLS model was added to a regional dummy consisting of the urban village and village groups (with a dummy of 0 for urban villages and 1 for villages). The estimation results of the PLS model in this research are given in Table 8.
The estimation results shown in Table 8 were obtained using Equation (10), as follows:
E V i t = 0.0156 + 0.000000205 N R F i t + 0.000000286 T O U R i t 0.2655   F L O O D i t + 0.6915   L A N D F I R E i t + 0.1778   D R O U G H T i t + 0.2953 L A N D S L I D E i t 0.0005   C O V I D 19 i t
Based on the estimation results of the PLS model without a dummy in Table 8, five independent variables were shown to significantly affect the local economic vulnerability of Batu in general, namely, the number of rooms filled (NRF), the number of tourists (TOUR), the drought susceptibility index (DROUGHT), the landslide susceptibility index (LANDSLIDE), and the COVID-19 disaster threat index (COVID19). However, in this model without a dummy, it is not possible to know the difference between the effects of each variable on economic vulnerability in Batu City. Therefore, a PLS model was developed with a regional dummy in which it was determined that the urban villages and villages will score 0 and 1, respectively. The regional dummy interacted with the five significant independent variables shown in Table 9. The estimation results of the PLS model with dummy interactions are as follows.
The estimation results of the PLS model with a dummy for the urban village, as shown in Table 9, can be written using Equation (11).
E V i t = 0.1029 0.000000108   N R F i t + 0.0000000405   T O U R i t 0.1777   F L O O D i t 0.0273   L A N D F I R E i t + 0.0258   D R O U G H T i t + 0.3401 L A N D S L I D E i t 0.0002   C O V I D 19 i t
The estimation results of the PLS model with a dummy for the village area are modeled with Equation (12):
E V i t = 0.1029 0.000000449   N R F i t 0.0000003425   T O U R i t 0.1777   F L O O D i t 0.0273   L A N D F I R E i t + 0.0723368 D R O U G H T i t + 0.5522598 L A N D S L I D E i t 0.0004388   C O V I D 19 i t
The basic model of analysis in this study is a model with a robust standard error, namely, the PLS model, which has been discharged from the problems of classical assumptions such as heteroscedasticity and auto-correlation. Based on the model estimation results in Table 9, two independent variables have a significant effect on local economic vulnerability in urban village areas, namely the landslide susceptibility index variable (LANDSLIDE) and the COVID-19 disaster threat index (COVID19), while other variables were found to have no significant effect. Meanwhile, in village areas, it was found that variables such as the number of rooms filled (NRF), number of tourists (TOUR), drought susceptibility index (DROUGHT), and landslide susceptibility index (LANDSLIDE) have a significant effect.
The positive coefficients in the model estimation results for the landslide susceptibility index (LANDSLIDE) and drought susceptibility index (DROUGHT) indicate that there is a positive relationship between each of these independent variables and the economic vulnerability of Batu City in urban village/village areas. Meanwhile, the negative coefficient of the COVID-19 disaster susceptibility index (COVID19) influenced the economic vulnerability of Batu City, especially in urban villages. Other variables that displayed a negative coefficient were the number of rooms filled (NRF), land fire susceptibility index (LANDFIRE), and flood susceptibility index (FLOOD), indicating that these independent variables negatively impact the economic vulnerability of Batu City. However, the number of tourists (TOUR) has a different influence coefficient for urban villages and villages. Based on the estimation results, the impact of the landslide susceptibility index (LANDSLIDE) on the economic vulnerability of Batu City in urban villages is greater than the impact of the COVID-19 susceptibility index (COVID19). Furthermore, in villages, we find that the impact of the drought susceptibility index (DROUGHT) on the economic vulnerability of Batu City was greater than the impact of the number of rooms filled (NRF), the number of tourists (TOUR), and the landslide susceptibility index (LANDSLIDE).
Most of the population in Batu City work in the agricultural/plantation sector and are supported by the existing tourism potential. Therefore, if landslides and droughts occur, these sectors are the most affected [28]. Many types of tourism offered by Batu City are natural attractions that are heavily influenced by natural disasters, especially landslides and droughts. Droughts can lead to a serious decrease in the pro-agricultural sector through reductions in land area and output [29,30,31,32,33,34,35,36,37,38,39].
The threat of landslides increases the vulnerability of the local economy of Batu City, because landslides result in loss of life and injury to people and livestock, as well as damage to infrastructure, agricultural land, and housing [40]. The damage and loss of community livelihoods due to landslides can lead to a decrease in and even loss of community income, which can take years to return to normal [41].
Another disaster that has had a significant impact on the economic vulnerability of Batu City is the COVID-19 pandemic. This is due to the fact that the main sources of income for the Batu City population are agriculture, trading, and tourism. In the context of tourism, one of the responses to the COVID-19 pandemic was the implementation of a lockdown policy, which has implications for all tourism activities in Batu City and causes economic losses in the tourism sector. The implementation of a lockdown, which has been in place since the increase in the number of COVID-19 cases in Indonesia, also worsens the existing conditions. Tourist attractions are able to operate during lockdown by reducing their visitor capacity, or are forced to temporarily close their business locations due to COVID-19 policy restrictions. However, this study finds that an increase in the COVID-19 susceptibility index resulted in a decrease in economic vulnerability. This is presumably because the policies restricting human movement and prohibiting tourist sites from operating can improve the sustainability and environmental conditions of Batu City, allowing the volume of agricultural products from Batu City to increase [42,43]. Mousazadeh et al. (2021) [44] mention that the pandemic also clearly benefited other sectors, which should be considered beneficial progress toward the goal of the global ecosystem’s permanent revival. Lockdown has led to a large reduction in air pollution due to a massive reduction in the burning of fossil fuels, in energy consumption in general [45], and in the emission of greenhouse gases such as nitrogen dioxide (NO2), sulfur dioxide (SO2), and carbon dioxide (CO2) [45,46,47,48]. With reduced human activity, noise levels have decreased in many cities around the world [45,49,50,51,52].
Most agricultural products are obtained from horticultural crops and grains. Both types of plants are basic household goods, so market selling continues to be carried out despite restrictions on mobility due to the COVID-19 pandemic [53]. The average trading activities are carried out by micro, small, and medium enterprises (MSMEs), and most MSMEs have gone digital [54]. The Department of Cooperatives, MSMEs, Industry, and Trade in Batu City (2021) stated that around 75 MSMEs in Batu City are experienced in trading digitally, even though as many as 60% of MSMEs in Batu City already have a business identification number (NIB). This allows MSMEs to reach a wider market share, so that their source of income does not depend on market selling to tourists in Batu City. Therefore, environmental capacity and quality are increasing due to the COVID-19 pandemic, causing the COVID-19 susceptibility index to increase, which has reduced the economic vulnerability of Batu City.
Decreased local economic vulnerability in Batu City, especially in village areas, is due to the increase in the number of rooms and the number of tourists, which represents an increase in the number of requests in the tourism sector. This will also have an impact on the value chain rotation in the economic sector, especially tourism commodities originating from agriculture.
The observed field shows that the majority of tourist attractions in the Batu Tourism Area are a form of agrotourism, i.e., tourism activities that utilize the potential of agriculture and plantations (natural panoramas) as tourist objects, including agricultural culture [55]. The main source of income for the community’s economy is also largely derived from agricultural production activities, so agrotourism is a secondary job.
Other disasters that generally do not significantly affect the economic vulnerability of the Batu City population are also shown by the results of the panel analysis. Flood disasters do not have a significant impact on the economic vulnerability of the Batu City population, even though these disasters often occur in Batu City. The contours of the Batu City area, which has many hills, also contribute to the increased risk of landslides and floods, especially when the level of rainfall is high. These two disasters often occur together, so the community and local government are accustomed to dealing with the impact of such disasters (recovery), ranging from cleaning up the facilities and infrastructure damaged by disasters, to regulating road traffic. Farmers also farm on land where the risk of landslides and floods is relatively low, so these two disasters do not significantly affect the economic vulnerability of the people of Batu City in general.
Forest fires are also relatively common in Batu City. One of the main causes is the conversion of land into horticultural area. In addition, local people often burn garbage indiscriminately, so fires often spread to the forest: a common occurrence in the Batu City area. This type of disaster does not significantly affect the economic vulnerability of the people of Batu City in general, due to the fast handling of forest fires by the government and local communities. This causes fires to be unable to spread, so they do not interfere with agricultural or agrotourism areas.

4. Discussion

The results of the weighting of five types of disaster show that there are five villages/urban villages that fall in the high disaster susceptibility category and three villages/urban villages that fall in the moderate disaster susceptibility category, while the remaining villages are in the low disaster susceptibility category. The five villages in the high susceptibility category are Bumiaji, Bulukerto, Tulungrejo, Sumbergondo, and Sumber Brantas. These five villages are located in the Bumiaji District. The three villages in the moderate susceptibility category are Mojorejo, Pendem, and Dadprejo. These three villages are in Junrejo District. Based on these findings, it can be concluded that the Batu City area is a disaster-resilient area with the highest level of disaster susceptibility. However, the discovery of areas that have high and moderate levels of disaster susceptibility concentrated in the same two sub-districts is a concern.
Furthermore, the distribution of disaster susceptibility identified by panel data analysis shows that the variables that significantly affect the local economic vulnerability of Batu City in the urban village area are the landslide susceptibility index and the COVID-19 susceptibility index. In addition, it can be seen that the number of rooms filled, the number of tourists, the drought susceptibility index, and the landslide susceptibility index significantly affected the local economic vulnerability of Batu City in village areas. Most of Batu City’s population work in the agricultural/plantation sector, supported by the existing tourism potential. Therefore, these sectors are the most affected when landslides and droughts occur [29], which is in line with the findings in [29,30,31,32,33,34,35,36,37,38,39] regarding the serious impact of drought on the agricultural sector, and the findings in [28] regarding the positive impact of COVID-19 on the environment and agriculture.
In this study, the discussion of the effect of disasters in tourism areas on local economic vulnerability in Batu City provides information about which disasters have a significant impact on local economic vulnerability. As shown in Table 9, two of the five types of disaster influenced economic vulnerability in urban villages, namely landslides and COVID-19, while drought and landslides had an impact on economic vulnerability in villages. The findings show that disasters have an impact on the local economy, as also found by Tasri et al. (2022) and give negative impact on the area which it occurs [56,57,58]. This confirms the hypothesis of this study, that disasters will affect the vulnerability of the local economy of Batu City, which relies on two main economic sectors: agriculture and tourism based on agriculture. As the leading economic sector in Batu City, agriculture is developed through a tourism policy framework toward the development of Batu City as a tourism city. It follows that the highest dominance in the GRDP of Batu City comes from the two main leading sectors, namely agriculture and tourism, through hotel, restaurant, and entertainment taxes [59,60].
The economic vulnerability index in this study was obtained by considering the land rent value in the villages/urban villages to calculate the productive land score. By considering the land rent value in the villages/urban villages, this research provides more detailed information about the economic vulnerability index at the scale of villages/urban villages than existing methods. An example of an existing method is inaRisk, developed in Indonesia to measure the economic vulnerability index, which can only measure the economic vulnerability index on a regional scale.
The study of disaster susceptibility and economic vulnerability at the local level is important. Disaster risk reduction at the local scale needs to be improved, and research needs to be able to provide information about the conditions of affected villages/urban villages in tourism areas, so that they may be considered when arranging policy and making decisions. At the international level, the study of disaster susceptibility and economic vulnerability is necessary for preparing for disaster mitigation and disaster risk reduction in tourism areas, with the hope that when disasters occur, the risks to tourism areas are reduced.
An interesting discussion that can be developed further from this research is to comprehend the capacity of the Batu City government in the context of economic vulnerability, based on the findings related to the resulting criteria regarding the five types of disaster that have been identified and mapped. For example, drought was found to affect economic vulnerability in Batu City because the occurrence of drought could disrupt the leading economic sector of Batu City’s GRDP [29,30,31,32,33,34,35,36,37,38,39]. Different susceptibilities and mapping patterns in each sub-district in Batu City also require different handling scenarios for the two disasters that were found to have a significant effect on the economic vulnerability of Batu City, as well as other disasters. Participatory practices are important in disaster risk reduction because the collaboration of various practitioners will increase the strength of disaster mitigation.
In the future, further research can focus on the downstream tourism sector, as economic vulnerability in the downstream tourism sector is an interesting topic. The discussion of the sub-sectors of artificial tourism clusters, including communities, contributes to the sustainability of such clusters, in addition to discussing how the vulnerability index of an area can have a direct impact on the downstream sector in a tourism cluster. One approach that can be used, for example, is to make people’s welfare a final goal. A hypothesis can be developed that is directly related to how much change in purchasing power parity (PPP) occurs if there is a change in economic vulnerability. In other words, further research can be carried out by proving the relationship between local economic vulnerability and local community PPPs and their livelihoods. This information can be obtained from the GRDP sub-sector, which was developed with data on village potential and the profile of each village.

5. Conclusions

Theoretically, a disaster will have a negative impact on the area in which it occurs because of the loss of work productivity due to infrastructure damage, forced migration, the disruption of supply chains, and the potential loss of local income [56,57]. Other negative impacts include labor scarcity due to youth migration leading to high input costs in agriculture, intensive declines in agriculture [42], and the disappearance of water sources, leading to epidemic diseases [56,61]. However, the outbreak of the COVID-19 pandemic is a new disaster which has certainly negatively impacted health and stunned the global economy. This study finds that COVID-19 has had a positive impact on agriculture by improving environmental sustainability and quality. The statistical analysis of panel data using STATA is an option for obtaining information about the impact of a disaster on the economic vulnerabilities of a specific location for the further arrangement of disaster risk reduction policies. The methodology employed in this research can be applied in other areas, such as industrial areas, education areas, housing areas, etc., because of the economic vulnerability index, assuming that land rent value is not limited in an area and that each area has a measurable land rent value.
Policies are enacted by the Batu City government to overcome the threat of disasters and minimize the negative impacts caused by each disaster. Through extracting information by conducting interviews with village administrators throughout Batu City, it can be found that an understanding of disaster management coordination has been disseminated to the community, carried out in a collaboration between the village government and the Batu City Regional Disaster Management Agency. Meanwhile, there is an Institutional Disaster Risk Management Forum in every village management structure, as well as knowledge based on local wisdom with regard to the disaster risk in their area. In addition, the Batu City government also put forward the Batu City Midterm Regional Development Plan (RPJMD) from 2017 to 2022 regarding the anticipation of disasters which are classified as prone to occurring in Batu City, considering that Batu is in a hilly area. The mitigation carried out by the Batu City government through authorized institutions and village government can be said to be good, being in line with the needs of each region in terms of disaster risk management, allowing Batu to become a disaster-resilient tourism city. This is evidenced by the finding that only five and three of the twenty-four villages/urban villages in Batu have a disaster susceptibility index in the high and medium categories, respectively, while sixteen other villages were found to have a low level of disaster susceptibility.
This research was limited to the type of disaster susceptibility observed, which specifically included five types of disasters, namely floods, meteorological droughts, land fires, landslides, and COVID-19, which were analyzed quantitatively and qualitatively to explain their effect on local economic resilience in Batu City during the observation period from 2015 to 2020. Further research can be carried out to observe the vulnerability of the local economy by adding analysis for other types of disaster and including analysis of social and physical vulnerability against the existing threat of disaster.

Author Contributions

Conceptualization, F.A.S.; methodology F.A.S.; software, F.A.S.; validation, F.A.S.; formal analysis, F.A.S.; investigation, F.A.S.; resources, F.A.S.; data curation, F.A.S.; writing—original draft preparation, F.A.S.; writing—review and editing, F.A.S., B.J., E.R. and K.M.; visualization, F.A.S.; supervision, B.J., E.R. and K.M.; project administration, F.A.S..; funding acquisition, F.A.S. All authors have read and agreed to the published version of the manuscript.

Funding

This research received no external funding.

Institutional Review Board Statement

Not applicable.

Informed Consent Statement

Not applicable.

Data Availability Statement

Not applicable.

Acknowledgments

Batu City government, National Disaster Management Agency (BNPB), and Regional Disaster Management Agency (BNPD) of Batu City. The author would like to thank the reviewers and editors for their comments.

Conflicts of Interest

The authors declare no conflict of interest.

References

  1. Priscillia, S.; Schillaci, C.; Lipani, A. Flood susceptibility assessment using artificial neural networks in Indonesia. Artif. Intell. Geosci. 2022, 2, 215–222. [Google Scholar] [CrossRef]
  2. Geertsema, M.; Highland, L.; Vaugeouis, L. Environmental impact of landslides. In Landslides—Disaster Risk Reduction; Sassa, K., Canuti, P., Eds.; Springer: Berlin/Heidelberg, Germany, 2009; pp. 589–607. [Google Scholar]
  3. Angra, D.; Sapountzaki, K. Climate change affecting forest fire and flood risk—facts, predictions, and perceptions in Central and South Greece. Sustainability 2022, 14, 13395. [Google Scholar] [CrossRef]
  4. Moosazadeh, M.; Ifaei, P.; Charmchi, A.S.T.; Asadi, S.; Yoo, C. A machine learning-driven spatiotemporal vulnerability appraisal based on socio-economic data for COVID-19 impact prevention in the U.S. counties. Sustain. Cities Soc. 2022, 8, 103990. [Google Scholar] [CrossRef] [PubMed]
  5. Badan Nasional Penanggulangan Bencana. Infografis Kejadian Bencana. Available online: https://dibi.bnpb.go.id/infografis (accessed on 3 April 2021).
  6. Bakri, B.; Rustiadi, E.; Fauzi, A.; Adiwibowo, S. Regional sustainable development indicators for developing countries: Case study of provinces in Indonesia. Int. J. Sustain. Dev. 2018, 21, 102–130. [Google Scholar]
  7. Jacobs, L.; Dewitte, O.; Poesen, J. The Rwenzori Mountains, a landslide-prone region. Landslides 2016, 13, 519–536. [Google Scholar] [CrossRef] [Green Version]
  8. Huang, C.; Inoue, H. Soft risk maps of natural disasters and their applications to decision-making. Inf. Sci. 2007, 177, 1583–1592. [Google Scholar] [CrossRef]
  9. Budescu, D.V.; Karelitz, T.M. Interpersonal communication of precise and imprecise subjective probabilities. In Proceedings of the 3rd International Symposium on Imprecise Probabilities and their Applications, Switzerland, 14–17 July 2003; Bernard, J.M., Seidenfeld, T., Zaffalon, M., Eds.; The International Symposium on Imprecise Probabilities: Lugano, Switzerland, 2003; pp. 91–105. [Google Scholar]
  10. Nau, R.F. The aggregation of imprecise probabilities. J. Stat. Plan. Inference 2022, 105, 265–282. [Google Scholar] [CrossRef] [Green Version]
  11. Walley, P. Statistical inferences based on a second-order possibility distribution. Int. J. Gen. Syst. 1997, 24, 337–383. [Google Scholar] [CrossRef]
  12. Shahabi, H.; Hashim, M. Landslide susceptibility mapping using GIS-based statistical models and Remote sensing data in tropical environment. Sci. Rep. 2015, 5, 9899. [Google Scholar] [CrossRef] [Green Version]
  13. Badan Nasional Penanggulangan Bencana. Indeks Risiko Bencana Indonesia (IRBI). Available online: http://inarisk.bnpb.go.id/irbi (accessed on 3 April 2021).
  14. Kejadian Bencana Alam Menurut Jenis Kejadian di Kota Batu. 2021. Available online: https://batukota.bps.go.id/statictable/2022/03/11/1053/kejadian-bencana-alam-menurut-jenis-kejadian-di-kota-batu-2021.html (accessed on 11 March 2022).
  15. Lemenkova, P. Satellite image-based mapping of wetland tundra landscapes using ILWIS GIS. In Proceedings of the Actual Problems of the State and Management of Water Resources Conference, Moscow, Russia, 19 March 2015. [Google Scholar] [CrossRef]
  16. Bunruamkaew, K.; Murayam, Y. Site Suitability Evaluation for Ecotourism Using GIS & AHP: A Case Study of Surat Thani Province, Thailand. Procedia Soc. Behav. Sci. 2011, 21, 269–278. [Google Scholar]
  17. ITC. ILWIS 3.0 Academic; User’s Guide Enschede.; IT Department ITC: Enschede, The Netherlands, 2001; Available online: https://www.itc.nl/ilwis/users-guide/ (accessed on 1 March 2022).
  18. Dai, F.C.; Lee, C.F.; Zhang, X.H. GIS-based geoenvironmental evaluation for urban landuse planning. J. Eng. Geol. 2001, 61, 257–271. [Google Scholar] [CrossRef]
  19. Arianpour, M.; Jamali, A.A. Flood hazard zonation using spatial multicriteria evaluation (SMCE) in GIS (case study: Omidieh-Khuzestan). Eur. Online J. Nat. Soc. Sci. 2015, 4, 39–49. [Google Scholar]
  20. Costache, R.; Pravalie, R.; Mitof, I.; Popescu, C. Flood vulnerability assessment in the low sector of saratel catchement (case study: Joseni Village). Carpathian J. Earth Environ. Sci. 2015, 10, 161–169. [Google Scholar]
  21. Humam, A.; Hidayat, M.; Nurrochman, A.; Anestatia, A.I.; Yuliantina, A.; Aji, S.P. Identifikasi daerah kerawanan kebakaran hutan dan lahan menggunakan sistem informasi geografis dan penginderaan jauh di Kawasan Tanjung Jabung Barat Provinsi Jambi. J. Geosains Dan Remote Sens. 2020, 1, 32–42. [Google Scholar] [CrossRef]
  22. Burrough, P.A.; Mcdonnell, R. Principles of Geographical Information Systems; Oxford University Press: Oxford, UK, 1998. [Google Scholar]
  23. Baltagi, B.H. Econometric Analysis of Panel Data, 3rd ed.; John Wiley & Sons. Ltd.: Chichester, UK; Hoboken, NJ, USA, 2005. [Google Scholar]
  24. Juanda, B. Ekonometrika Permodelan dan Pendugaan; IPB Press: Bogor, Indonesia, 2009. [Google Scholar]
  25. Metodologi Perhitungan Kerentanan Perka BNPB No 2 Tahun. 2012. Available online: https://inarisk.bnpb.go.id/metodologi (accessed on 12 December 2021).
  26. Rustiadi, E.; Saefulhakim, S.; Panuju, D.R. Perencanaan dan Pengembangan Wilayah; Yayasan Pustaka Obor Indonesia: Jakarta, Indonesia, 2018. [Google Scholar]
  27. Wooldridge, J.M. Econometric Analysis of Cross Section and Panel Data; The MIT Press: Cambridge, MA, USA, 2010. [Google Scholar]
  28. Badan Penanggulangan Bencana Daerah Kota Batu 2020. Available online: https://ppid.batukota.go.id/ppid_pembantu/profil/badan-penanggulangan-bencana-daerah (accessed on 23 December 2021).
  29. Gómez, C.M.; Tirado, D.; Rey-Maquieira, J. Water exchanges versus water works: Insights from a computable general equi-librium model for the Balearic Islands. Water Resour. Res. 2004, 40, W105021–W1050211. [Google Scholar] [CrossRef] [Green Version]
  30. Dixon, P.B.; Schreider, S.Y.; Wittwer, G. Encapsulation of water allocation into a general equilibrium model. In Proceedings of the International Congress on Modelling and Simulation: Advances and Applications for Management and Decision Making, Melbourne, Australia, 12–15 December 2005; pp. 999–1006. [Google Scholar]
  31. Diao, X.; Dinar, A.; Roe, T.; Tsur, Y. A general equilibrium analysis of conjunctive ground and surface water use with an appli-cation to Morocco. Agric. Econ. 2008, 38, 117–135. [Google Scholar] [CrossRef]
  32. Schreider, S. Water price dynamics, water derivatives and general equilibrium modeling. In Proceedings of the 18th World IMACS Congress and MODSIM09 International Congress on Modelling and Simulation: Interfacing Modelling and Simulation with Mathematical and Computational Sciences, Cains, Australia, 13–17 July 2009; pp. 3640–3646. [Google Scholar]
  33. Mendelson, O.R.; Ariel, D. Climate change and agriculture. An Economic Analysis of Global Impacts, Adaptation and Distributional Effects. In The World Bank—New orizonts in Environmental Economics; Elgar, E., Ed.; Cambridge University Press: Cambrige, UK, 2010; Volume 46, pp. 259–266. [Google Scholar]
  34. Trnka, M.; Olesen, J.E.; Kersebaum, K.C.; Skjelvåg, A.O.; Eitzinger, J.; Seguin, B.; Peltonen-Sainio, P.; Rötter, R.; Iglesias, A.; Or-landini, S.; et al. Agroclimatic conditions in Europe under climate change. Glob. Change Biol. 2011, 17, 2298–2318. [Google Scholar] [CrossRef] [Green Version]
  35. Wittwer, G.; Griffith, M. Modelling drought and recovery in the southern Murray-Darling basin. Aust. J. Agric. Resour. Econ. 2011, 55, 342–359. [Google Scholar] [CrossRef]
  36. Pauw, K.; Thurlow, J.; Bachu, M.; Van Seventer, D.E. The economic costs of extreme weather events: A hydrometeorological CGE analysis for Malawi. Environ. Dev. Econ. 2011, 16, 177–198. [Google Scholar] [CrossRef] [Green Version]
  37. Ariel, D.; Mendelshon, O.R. Handbook on Climate Change and Agriculture; Edward Elgar: Cheltenham, UK, 2011. [Google Scholar]
  38. Mysiak, J.; De Salvo, M.; Santato, S.; Amadio, M. Economic impacts of drought on agriculture. SSRN Electron. J. 2013, 206, 1–32. [Google Scholar] [CrossRef]
  39. Ray, R.L.; Fares, A.; Risch, E. Effects of drought on crop production and cropping areas in Texas. Agric. Environ. Lett. 2018, 3, 170037. [Google Scholar] [CrossRef] [Green Version]
  40. Schuster, R.L.; Fleming, R.W. Economic losses and fatalities due to landslides. Bull. Assoc. Eng. Geol. 1986, 23, 11–28. [Google Scholar] [CrossRef]
  41. Martens, K.; Jacobs, L.; Kabaseke, C.; Maertens, M.; Poesen, J.; Kervyn, M.; Vranken, L. The impact of landslides on household income in tropical regions: A case study from the Rwenzori Mountains in Uganda. Bioeconomics Work. Pap. Ser. 2015, 10, 1032–1043. [Google Scholar] [CrossRef] [PubMed]
  42. Akter, L.; Hasan, M.M.; Babu, S.M.O.; Ahmed, A.S.S.; Ullah, M.; Parvej, M.; Pramanik, M.M. Positive impacts of COVID-19 on environment and biodiversity. Agric. Obs. 2020, 1, 21–27. [Google Scholar]
  43. Yosufzai, R. How the coronavirus crisis is helping improve the environment across the world. SBS News, 2020. Available online: https://www.sbs.com.au/news/how-the-coronavirus-crisis-is-helping-improve-the-environment-across-the-world (accessed on 21 March 2021).
  44. Mousazadah, M.; Paital, B.; Naghdali, Z.; Mortezania, Z.; Hashemi, M.; Niaragh, E.K.; Aghababaei, M.; Ghorbankhani, M.; Lictfouse, E.; Sillanpaa, M.; et al. Positive environmental effects of the coronavirus 2020 episode: A review. Environ. Dev. Sustain. 2021, 23, 12738–12760. [Google Scholar] [CrossRef] [PubMed]
  45. Zambrano-Monserrate, M.A.; Ruano, M.A.; Sanchez-Alcalde, L. Indirect effects of COVID-19 on the environment. Sci. Total Environ. 2020, 728, 138813. [Google Scholar] [CrossRef]
  46. IQAir. Available online: https://www.iqair.com/us (accessed on 5 January 2022).
  47. Otmani, A.; Benchrif, A.; Tahri, A. Impact of COVID-19 lockdown on PM10, SO2 and NO2 concentrations in Salé City (Morocco). Sci. Total Environ. 2020, 735, 139541. [Google Scholar] [CrossRef]
  48. European Space Agency (ESA). COVID-19: Nitrogen Dioxide over China. Available online: https://www.esa.int/Applications/Observing_the_Earth/Copernicus/Sentinel-5P/COVID-19_nitrogen_dioxide_over_China. (accessed on 7 January 2022).
  49. Myllyvirta, L. Air quality, healths and toxics impacts of proposed coal mining and power cluster in Thar, Pakistan. Cent. Res. Energy Clean Air 2020, 1–20. [Google Scholar]
  50. Paital, B. Nurture to nature via COVID-19, a self-regenerating environmental strategy of environment in global context. Sci. Total Environ. 2020, 729, 139088. [Google Scholar] [CrossRef]
  51. Wang, Q.; Su, M. A preliminary assessment of the impact of COVID-19 on environment—A case study of China. Sci. Total Environ. 2020, 728, 138915. [Google Scholar] [CrossRef]
  52. Muhammad, S.; Long, X.; Salman, M. COVID-19 pandemic and environmental pollution: A blessing in disguise. Sci. Total Environ. 2020, 728, 138820. [Google Scholar] [CrossRef] [PubMed]
  53. Djanibekov, N.; Herzfeld, T. The impact of COVID-19 on agrifood systems and rural areas in Central Asia and Caucasus countries. In Final Report of a Study Commissioned by FAO; FAO: Halle, Germany, 2022. [Google Scholar] [CrossRef]
  54. Sembiring, R.; Subekti, T. Analisis aktor dalam tata kelola Usaha Mikro Kecil Menengah (UMKM) Kota Batu untuk kualitas internasional. J. Ilm. Ilmu Sos. 2021, 7, 31. [Google Scholar] [CrossRef]
  55. Palit, G.R.; Talumingan, C.; Grace, A.J.; Rumagit. Strategi pengembangan kawasan agrowisata Rurukan. Agri-Sosio Ekonomi 2017, 2A, 21–34. [Google Scholar] [CrossRef]
  56. Gauchan, D.; Bal, K.; Joshi, B.K.; Ghimire, K. Impact of 2015 Earthquake on Economy, Agriculture and Agrobiodiversity in Nepal. Conference: Rebuilding Local Seed System of Native Crops in Earthquake Affected Areas of Nepal. In Proceedings of the National Sharingshop, Kathmandu, Nepal, 18 December 2017. [Google Scholar]
  57. Gauchan, D.; Joshi, B.K.; Ghimire, K.; Poudyal, K.; Sapkota, S.; Sharma, S.; Man, D.; Dangol, S.; Sthapit, S.; Gautam, S.; et al. Process of Rebuilding Local Seed System after 2015 Nepal Earthquake: Rescue Collection, Conservation and Repatriation. Conference: Rebuilding Local Seed System of Native Crops in Earthquake Affected Areas of Nepal. In Proceedings of the National Sharingshop, Kathmandu, Nepal, 18 December 2017. [Google Scholar]
  58. Tasri, E.V.; Karimi, K.; Muslim, I. The effect of economic on natural disasters and the impact of disasters on economic variables. Heliyon 2022, 8, e08678. [Google Scholar] [CrossRef] [PubMed]
  59. Rencana Pembangunan Jangka Menengah Daerah Kota Batu Tahun 2017–2022. Available online: https://ppid.batukota.go.id/laporan_terkait/rpjmd (accessed on 13 December 2021).
  60. Kota Batu Dalam Angka 2021. Available online: https://batukota.bps.go.id/publication/2021/02/26/bef0b20e76be80075b2176b7/kota-batu-dalam-angka-2021.html (accessed on 13 December 2021).
  61. PDRB Kota Batu Atas Dasar Harga Konstan 2010 Menurut Lapangan Usaha (Juta Rupiah), 2019–2021. Available online: https://batukota.bps.go.id/indicator/52/69/1/-seri-2010-pdrb-kota-batu-atas-dasar-harga-konstan-2010-menurut-lapangan-usaha.html (accessed on 13 December 2021).
Figure 1. Batu tourism area based on a location map from 2022.
Land 11 02041 g001
Figure 2. Flood susceptibility in the Batu City Tourism Area: (a) flood susceptibility map 2015; (b) flood susceptibility map 2016; (c) flood susceptibility map 2017; (d) flood susceptibility map 2018; (e) flood susceptibility map 2019; and (f) flood susceptibility map 2020.
Land 11 02041 g002aLand 11 02041 g002b
Figure 3. Flood susceptibility index in Batu City from 2015 to 2020.
Land 11 02041 g003
Figure 4. Landslide susceptibility in Batu City Tourism Area: (a) landslide susceptibility map 2015; (b) landslide susceptibility map 2016; (c) landslide susceptibility map 2017; (d) landslide susceptibility map 2018; (e) landslide susceptibility map 2019; and (f) landslide susceptibility map 2020.
Land 11 02041 g004aLand 11 02041 g004b
Figure 5. Landslide susceptibility index in Batu City from 2015 to 2020.
Land 11 02041 g005
Figure 6. Meteorological drought hazard in Batu City Tourism Area: (a) meteorological drought map 2015; (b) meteorological drought map 2016; (c) meteorological drought map 2017; (d) meteorological drought map 2018; (e) meteorological drought map 2019; and (f) meteorological drought map 2020.
Land 11 02041 g006
Figure 7. Drought susceptibility index in Batu City from 2015 to 2020.
Land 11 02041 g007
Figure 8. Fire hazards in Batu City Tourism Area: (a) land fire susceptibility map 2015; (b) land fire susceptibility map 2016; (c) land fire susceptibility map 2017; (d) land fire susceptibility map 2018; (e) land fire susceptibility map 2019; and (f) land fire susceptibility map 2020.
Land 11 02041 g008aLand 11 02041 g008b
Figure 9. Land fire susceptibility index in Batu City from 2015 to 2020.
Land 11 02041 g009
Figure 10. Distribution of COVID-19 cases in Batu City Tourism Area based on village offices and tourist attractions: (a) COVID-19 map from April 2020 in Batu Tourism Area; (b) COVID-19 map from October 2020 in Batu Tourism Area; (c) COVID-19 map from April 2020 in Batu Tourism Area; and (d) COVID-19 map from October 2020 in Batu Tourism Area.
Land 11 02041 g010aLand 11 02041 g010b
Table 1. Summary of data from the study area.
DataData Sources
GeologyESDM Geological Agency
DEM STRM 30 mDEM STRM Data from CGIAR CSI (strm.csi.cgiar.org), accessed on 10 August 2021
Citra Landsat 8 path 118/row 65USGS (United States Geospatial Survey) on the website earthexplorer.usgs.gov, accessed on 10 August 2021
Soil Type ShapefileIndonesian Geospatial Information Agency, FAO
Rainfall DataRainfall capture station in Batu City from BMKG data
Land UseLand use map from the Geospatial Information Agency with a scale of 1:250,000
HotspotsTerra/Aqua MODIS satellites on the FIRMS website at the link https://earthdata.nasa.gov/data/near-real-time-data/firms/, active fire-data, accessed on 25 August 2021
RBI Map (Indonesian Landscape)Page https://tanahair.indonesia.go.id, accessed on 10 August 2021
Table 2. Classification of flood susceptibility.
Score12345
Slope0–33.1–77.1–1515.1–25 > 25
River buffer (m)>200150.1–200100.1–15050.1–100<50
Land coverForestShrubs, land sand, oceanMoors, herbaceousIrrigated rice fields, rainfed rice fields, water, pondsBuildings, settlements
Rainfall>100100–200200–300300–400>400
Source: Costache, 2015, with modification.
Table 3. Landslide parameters.
ParameterDescriptionWeighting
SlopeExtremely Steep (55–90 ° )1.000
Very Steep (35–55 ° )0.614
Steep (16–35 ° )0.421
Moderate (8–16 ° )0.293
Sloping (4–8 ° )0.197
Gentle (2–4 ° )0.119
Flat (0–2 ° )0.055
GeomorphologyMiddle Slope1.000
Lower Slope0.455
Fluvial Plains0.182
Land CoverSettlements1.000
Secondary Dryland Forest0.632
Plantation Forest0.448
Dryland Agriculture0.279
Mixed Dryland Agriculture0.279
Rice Fields0.160
Shrub0.099
Bare0.046
Table 4. Land cover classification for fire susceptibility.
Land CoverClass
Secondary Dryland ForestHighly Vulnerable
Secondary Mangrove Forest, Secondary Swamp Forest, Dryland Agriculture with Shrubs, Shrubs, Dryland AgricultureModerately Vulnerable
Plantation Forest, Plantation, Wetland Agriculture, Bare LandSlightly Vulnerable
Primary Dryland Forest, Swamp ForestNot Vulnerable
Table 5. Land fire parameters.
ParameterDescriptionWeight
RainfallLight (0–100 mm)1.000
Moderate (100–300 mm)0.614
River BufferExtremely Far (>125 m)1.000
Slightly Far (100–125 m)0.592
Far (75–100 m)0.388
Near (50–75 m)0.252
Slightly Near (25–50 m)0.150
Extremely Near (<25 m)0.068
Land CoverSecondary Dryland Forest1.000
Shrub0.518
Dryland Agriculture0.518
Mixed Dryland Agriculture0.518
Plantation Forest0.203
Rice fields0.203
Bare land0.203
Settlements0.055
Table 6. SPI value and drought classification.
SPI ValueDrought Classification
2.00Exceptionally Wet
1.50–1.99Extremely Wet
1.00–1.49Moderately Wet
(−0.99)–0.99Normal
(−1.00)–(−1.49)Moderate Drought
(−1.50)–(−1.99)Extreme Drought
−2.00Exceptional Drought
Source: BMKG 2012.
Table 7. Parameter raster interpolation using ArcGIS.
ParameterIDW
Z valueElevation
Output cell size30 m
Search radius12
Table 8. Pooled least squares model estimation results.
Independent VariableEstimation Coefficientp-Value
NRF0.0000002050.004 ***
TOUR0.0000002860.000 ***
FLOOD−0.26548220.399
LAND FIRE0.6914930.615
DROUGHT0.17778340.000 ***
LANDSLIDE0.29527590.024 **
COVID19−0.00046220.006 ***
_cons0.01562350.960
** significant at 5%, and *** significant at 1%.
Table 9. Model estimation results with dummy and variables interaction.
Independent VariableEstimation Coefficientp-Value
Urban Village Estimation Results
NRF−0.0000001080.155
TOUR0.00000004050.710
FLOOD−0.17770.539
LAND FIRE−0.02730.783
DROUGHT0.02580.509
LANDSLIDE0.34010.009 ***
COVID19−0.00020.088 *
_cons0.10290,716
Village Estimation Result
NRF−0.0000004490.002 ***
TOUR−0.00000034250.004 ***
DROUGHT0.07233680.000 ***
LANDSLIDE0.55225980.003 ***
COVID19−0.00043880.612
_cons0.10290.716
* significant at 10% and *** significant at 1%.
Publisher’s Note: MDPI stays neutral with regard to jurisdictional claims in published maps and institutional affiliations.

