Article

A Spatial Equilibrium Evaluation of Primary Education Services Based on Living Circle Models: A Case Study within the City of Zhangjiakou, Hebei Province, China

1
School of Public Administration, Xi’an University of Architecture and Technology, Xi’an 710055, China
2
School of Architecture, Tsinghua University, Beijing 100084, China
3
College of Land Science and Technology, China Agricultural University, Beijing 100193, China
4
Key Laboratory of Digital Earth Science, Aerospace Information Research Institute, Chinese Academy of Sciences, Beijing 100094, China
5
College of Public Administration, Central China Normal University, Wuhan 430079, China
6
School of Geography and Tourism, Qufu Normal University, Rizhao 276800, China
*
Author to whom correspondence should be addressed.
These authors contributed equally to this work and should be considered co-first authors.
Land 2022, 11(11), 1994; https://doi.org/10.3390/land11111994
Submission received: 11 October 2022 / Revised: 3 November 2022 / Accepted: 4 November 2022 / Published: 7 November 2022
(This article belongs to the Section Urban Contexts and Urban-Rural Interactions)

Abstract

:

Highlights

  • A new method is proposed to quantitatively assess the equilibrium between primary education facilities and primary students from the perspective of the living circle. The spatial equilibrium of primary education services across Zhangjiakou City was evaluated based on four living circle scenarios.
  • We establish a site selection path to optimize the spatial equilibrium of primary education based on the living circle.

Abstract

Primary education services are a key component of public infrastructure. These services exert significant impacts on public activity, sustainability, and healthy socio-economic development. This research applies the concept of a ‘living circle’ in order to evaluate the spatial equilibrium of education services in existing primary schools. This has enabled equilibrium planning schemes to be proposed for primary schools as well as the promotion and construction of livable and defensible living spaces. This area remains a key issue, however, one that urgently needs to be addressed in terms of the layout of public infrastructural services to facilitate livable living space construction. Thus, from the perspective of livable and defensible living space construction, the aim of this study was to construct a primary education equalization assessment method based on the walking living circle method. An equilibrium index was also designed based on the number of primary school students; this was then combined with the standard construction of new primary schools to optimize the spatial equilibrium of these education services. The city of Zhangjiakou City was then used as a case study; the spatial equilibrium of primary education services was evaluated across four living circle scenarios (i.e., 15 min, 20 min, 25 min, and 30 min). Results reveal that the city of Zhangjiakou currently offers dramatically spatially negative non-equilibrium primary education services (i.e., supply < demand) across four living circle scenarios, but most notably in rural areas away from urban areas and towns, especially in the counties of Shangyi, Chicheng, Chongli, Kangbao, and Guyuan. It is interesting to note that all living circle scenarios could enable positive non-equilibrium primary education services (i.e., supply > demand), mainly within the urban districts of Qiaodong, Xuanhua, Qiaoxi, Wanquan, and Xiahuayuan. It is also clear that equilibrium living circles are distributed across all counties. A spatial optimization proposal for primary school services should therefore be presented that alleviates the issues inherent to non-equilibrium primary education services. The results of this study offer a number of suggestions for education service optimization across the city of Zhangjiakou as well as for other cities in China. We also provide further scientific foundations for research on livable space and defensible unit construction as well as the spatial equilibrium evaluation of other public infrastructural service facilities

1. Introduction

Primary education services are important components of most public infrastructure. As such, these offerings exert a significant impact on public activity, sustainability, and healthy socio-economic development [1,2]. Throughout the 1970s and 1980s, following the implementation of a nine-year compulsory education policy, primary services across China almost encompassed all townships. This changed subsequent to the family planning policy which was introduced in the 1982 constitution [3]; this legislation led to an obvious decline in the number of primary students, which has continued up until the present. Indeed, according to the China Statistical Yearbook, the number of primary schools nationally fell from 793,261 to 167,009 between 1986 and 2017 [4]. This situation has also led to a significant spatial distribution equilibrium problem in primary education services as well as to a subsequent series of social problems which have influenced living spaces. In one example, most school-age children and their accompanying persons (mostly parents) originally based in areas (mostly rural areas far away from urban and towns) with poor access to education services have had to move to live in areas (mostly urban and town areas) closer to primary schools. This has led to a rural exodus and further exacerbated the emptying and wastage of rural housing, as well as the aging and weakening of the rural population, and pollution and degradation of the environment. As migrants move into towns, they often cannot be registered as residents, which then also leads to a lack of social welfare and living security. Semi-urbanization has intensified, small property housing has continued to grow, and a range of associated problems have also been seen [5]. In order to remedy this, the Chinese Rural Revitalization Strategy calls states that this kind of land use should be suitable for living [6]. National spatial planning also requires that such spaces should be moderately livable. These policies have provided more support and opportunities for promoting the spatial equilibrium of primary education services.
In order to enhance and render living spaces moderately habitable, the Urban Residential Area Planning and Design Standard (GB50180-2018) released by China proposed buildings within walking living circles of 15 min, 10 min, and 5 min. The concept of a living circle is an idea proposed on the basis of behavioral geography; this theory was developed to study the regional division of urban daily life contents and living spaces and generally refers to the space and time range required by residents when they travel to meet their production and living needs. Indeed, from a spatial perspective, the concept of a living circle can be used to better reflect the interactions between spatial units and the actual lives of residents. Thus, as a component of urban and rural planning, the living circle concept has become an important tool for balancing resource allocation, maintaining spatial equity, and the organization of local life [7,8]. Living circle planning is particularly common in Japan [9], South Korea [10], and Taiwan, China [7]. It is also the case that living circle construction within 15 min has been planned as part of the General Territorial and Spatial Plan of Pudong New District, Shanghai, China, to encompass the period between 2017 and 2035. This existing research provides a typical case that can be applied to constructing habitable living circles in China. Public infrastructure, especially schools, are important preparedness spaces as we respond to the COVID-19 pandemic; the impact of this epidemic reinforces the need to build habitable and defensible living circles [11]. Primary school education service facilities must be resilient parts of public infrastructure as they play decisive roles in both peacetime and wartime. We argue that more attention should be paid to the spatial equilibrium of these features. Thus, building on the living circle concept, it is important to consider how to evaluate the spatial equilibrium dynamics of education services in existing primary schools across China. This will enable us to propose an equilibrium planning scheme for primary schools and promote the construction of habitable and defensible living spaces. This key issue urgently needs to be addressed in the context of public infrastructural service layout in order to further facilitate the construction of living space.
Educational service facilities are public and radius-dependent; their spatial layout is mainly limited by threshold population size and service radius. The main research in this area has therefore aimed at assessing the balance between service scale and reasonable radius. In this context, from 1929 onwards, the United States-based researcher Perry constructed the famous theory of Neighborhood Units based on primary school service scale and accessibility. This work determined that the radiation range of a neighborhood center should be between 0.8 km and 1.2 km and initiated a great deal of subsequent research on the spatial equilibrium evaluation of public service facilities. In one example, Yeager [12] noted that the planning criteria for primary school layouts should be determined based on the distance between these facilities and the number of students. Similarly, Bennett [13] discussed education inequality across the United States using the registered population of different ages and gender groups. Thus, applying spatial equilibrium evaluation methods for public facility services, numerous research projects have subsequently been performed using Geographic Information System (GIS) technology [14,15]. In one example, Taylor et al. [16] used GIS to make a plan for schools in Johnston County, North Carolina (United States) which successfully reduced the impact of traffic, enabled students to enter nearby schools, reduced costs, and solved the service radius adjustment problem. Slagle [17] then used GIS approaches to determine the most suitable location for new school construction in order to enhance school layout balance and scientific planning. Building on the administrative unit concept, Gao et al. [18] designed a balance index model for the spatial distribution of urban public service facilities using GIS 10.4.1 software (created by ESRI company, in RedLands, California, USA) and the spatial autocorrelation method. Zhu et al. [19] argued that the actual needs of residents must play a key role in determining the balanced layout of public service facilities. Thus, utilizing a Voronoi Map, Zhu et al. [19] divided their research area into different units on the basis of population and regional area. This enabled them to realize a spatial balance of public facilities through renovation and the demolition of newly built ones. In later work, Pablo et al. [20] explored the intensity utilization of public service facilities based on statistical population data within administrative areas. Earlier research has provided a rich theoretical and practical baseline for promoting the spatial equilibrium of primary education services. As social economies have developed, the living circle model has been widely accepted by researchers globally [11]. Scholars have evaluated the spatial equalization of public service facilities from the perspective of a life circle [21,22]. However, most studies assess the supply-demand equilibrium relationship between residential areas and public service facilities through the high-low classification method [23], and few studies directly analyze it by matching the demand groups and public service facilities.
Zhangjiakou City is located in northwest Hebei Province. This agglomeration is a main component of the Poverty Belt and plays a key role in the ecological security of Hebei and Beijing. It is noteworthy that, compared with surrounding areas, Zhangjiakou city is backward in terms of economic development and was once rated as a poverty-stricken area within China [24]. Data show that between 2000 and 2017, the number of primary schools within the city of Zhangjiakou decreased from 2323 to 464 [25]; this resulted in a serious spatial equilibrium problem in primary education services. As a result of the collaborative development of Beijing-Tianjin-Hebei, habitable living space requirements in national spatial planning, and the resilient layout of infrastructure given the impacts of the COVID-19 pandemic, socioeconomic gains are providing new opportunities for development [26]. In this context, research on the spatial equilibrium of primary education services provides an important reference for improving these offerings as well as the habitability and resilience of living space.
The city of Zhangjiakou is used as a case study in this research. Our overarching goal is to provide theoretical and technical support to evaluate the spatial equilibrium of primary education services based on different living circle models. We also provide further scientific basis for national spatial planning within the city of Zhangjiakou as well as for other public infrastructure planning across China. The specific objectives of this analysis were to: (1) construct a framework and new method for assessing the equilibrium between primary education facilities and primary students from the perspective of a living circle; (2) evaluate the spatial service equilibrium of primary education in four living circle scenarios within the city of Zhangjiakou using this approach, and; (3) propose a site selection path to optimize the spatial equilibrium of primary education based on the living circle.

2. Study Area and Materials
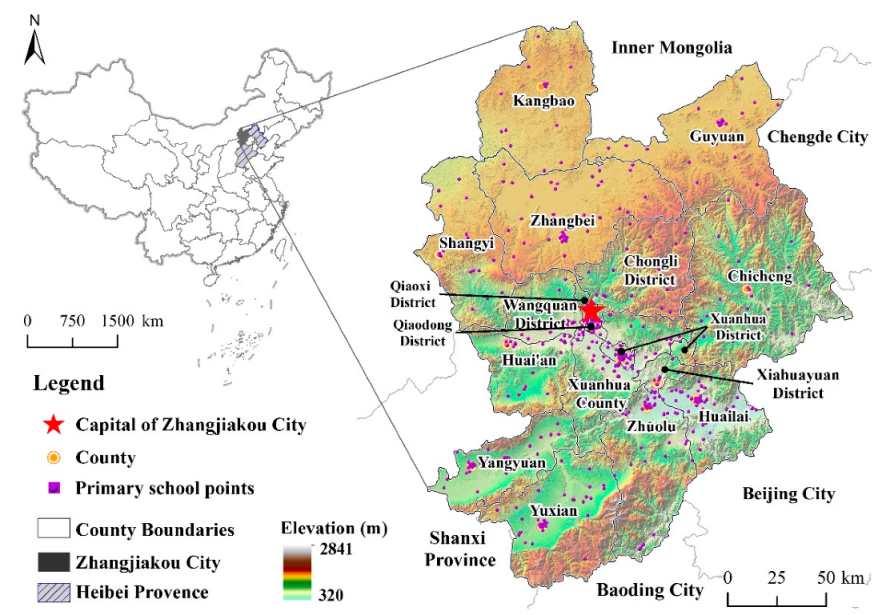
2.1. Study Area

The city of Zhangjiakou is located between 113°50′ and 116°30′ E and between 39°30′ and 42°10′ N, bordering the city of Beijing, Shanxi Province, and Inner Mongolia. Encompassing a total area of 36,800 km2, this agglomeration contains four districts and 13 counties. The city of Zhangjiakou has long been one of the most important in China as it plays a key role in water conservation and ecological security for both Hebei and Beijing. The socioeconomic development of this region is therefore of national concern. The study area assessed here ranges between 320 m and 2841 m in elevation; based on regional terrain features, this area can be divided roughly into a plateau zone in the northwest and an intermountain basin zone to the southeast. Flat topography characterizes the intermountain basin area where the water quality is higher alongside a more favorable climate and other natural conditions compared to the plateau area. The administrative district of Zhangjiakou consists of Qiaodong, Qiaoxi, Xuanhua, Wanquan, Chongli, and Xiahuayuan, all located within the intermountain basin area and characterized by rapid socioeconomic development [24]. The districts, counties, and elevations across the Zhangjiakou region are shown in Figure 1. On the basis of data presented in the Statistical Yearbook of Zhangjiakou released by the Zhangjiakou People’s Government Office in 2017, the gross domestic product (GDP) of this region was 136.354 billion RMB in 2016 while per capita disposable income was 15,781 RMB. The total population of this region comprised 469.01 million people; the permanent population comprised 442.17 million people and the permanent population urbanization rate was 52.2%. A total of 296,130 primary-age students live in this region (ages between 7 years and 12 years).

2.2. Data Sources and Processing
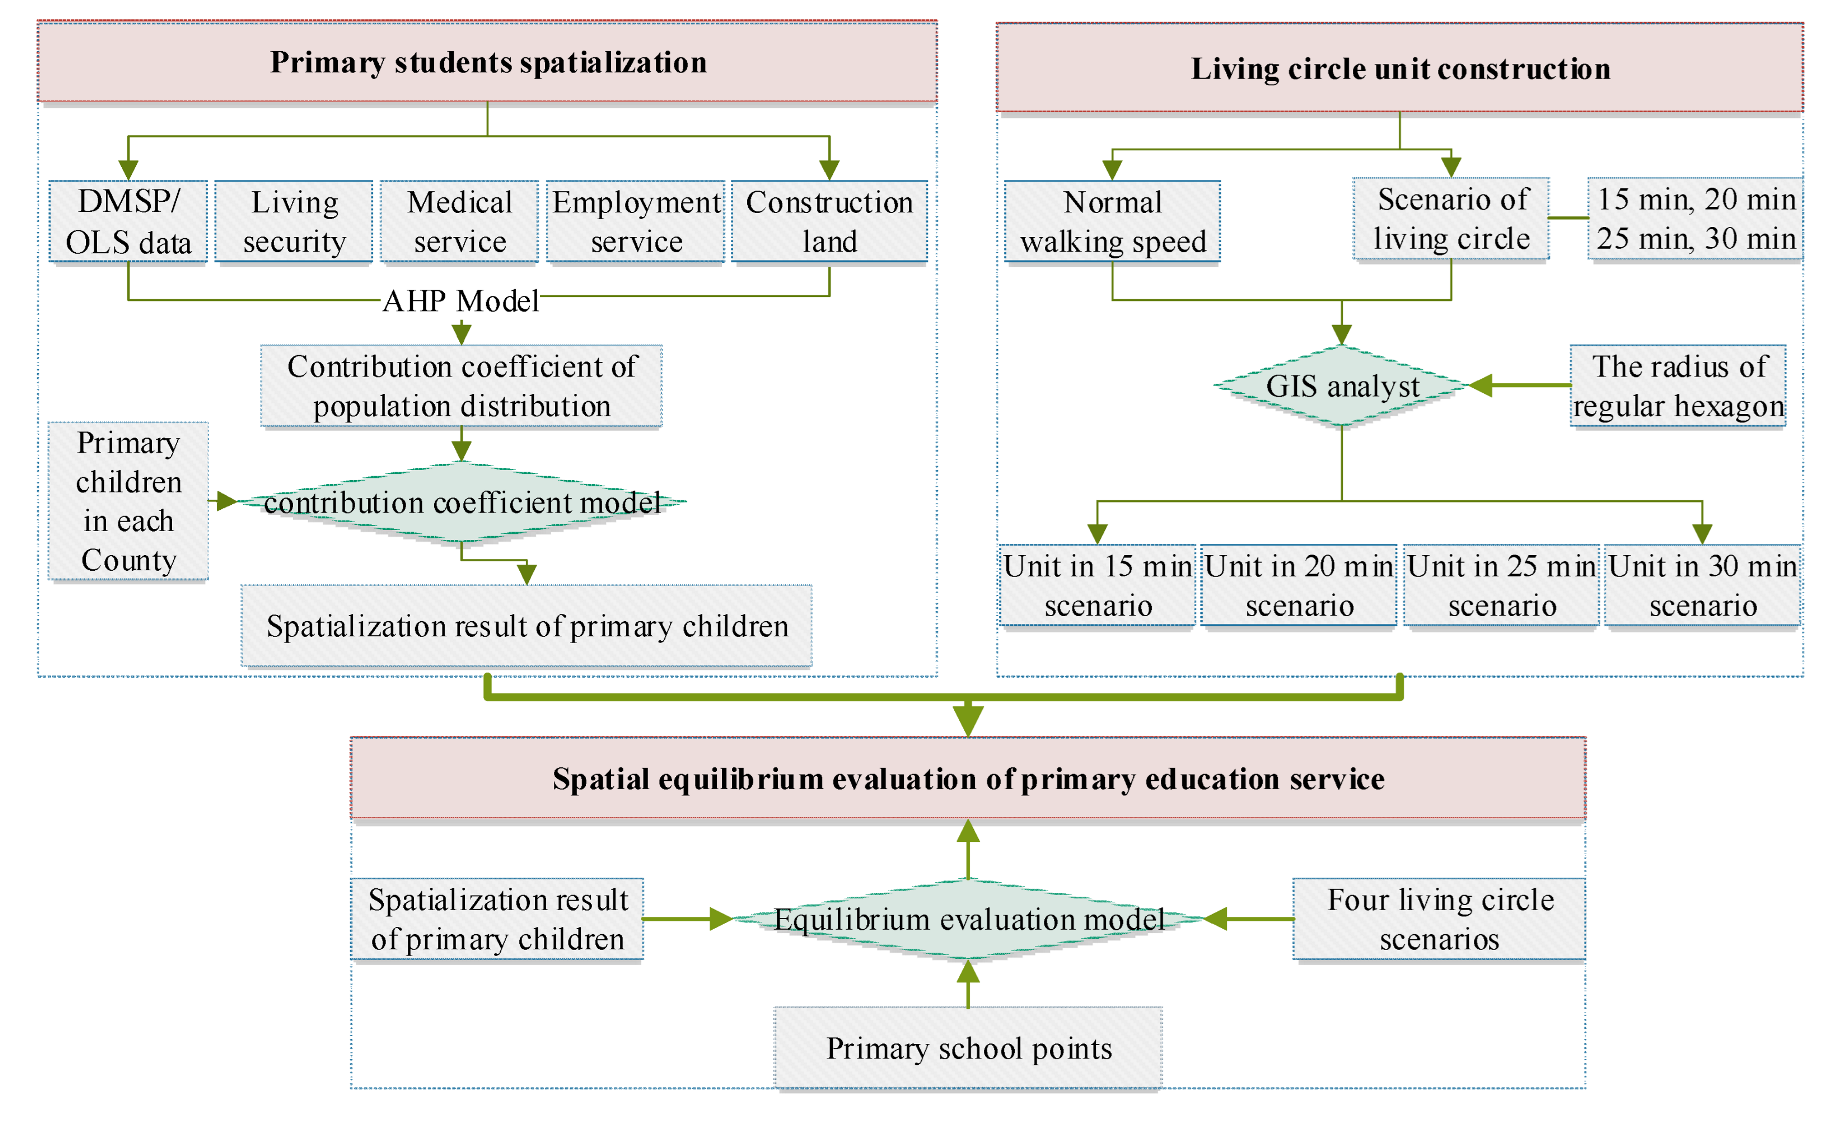
The Ministry of Education for Zhangjiakou City provides 464 primary education centers; the locations of these facilities were obtained from the 2017 Baidu map dataset (Figure 1). Similarly, DMSP/OLS nightlight images for 2015 were downloaded from National Geophysical Data Center (http://www.ngdc.noaa.gov/) (accessed on 1 July 2019). Point-of-interest (POI) data encompassing living support, health guarantee, and employment services were obtained from the 2018 Baidu map dataset. The spatial distribution of residential areas was interpreted from Landsat8 RS images for August 2015 downloaded from the Geospatial Data Cloud released by the Computer Network Information Center, Chinese Academy of Sciences (http://www.gscloud.cn/) (accessed on 1 July 2019). The total residential area within this region is about 1436 km2, encompassing 3.90% of the total overall area covered by the city of Zhangjiakou. The city and town cover about 388 km2, 27.02% of the total residential area. All spatial data were projected to North Pole Lambert Azimuthal Equal Area. In terms of primary school supply capacity, the Standards for The Construction of Buildings in Ordinary Urban Primary and Secondary Schools and The Construction of Ordinary Rural Primary and Secondary Schools promulgated by the Ministry of Education of China stipulate that ‘the minimum standard for a complete primary school in a city is 12 classes with 50 students in each class and 600 students in each school’. Similarly, the minimum standard for a complete primary school in a rural area is six classes with 45 students in each class and 270 students in each school. The minimum standard for an incomplete primary school in remote, rural areas is four classes with 30 students in each class and 120 students in each school. The primary schools assessed here are all complete.

3. Methods

The spatial distribution of primary education services encompasses a convenient service such that the location of these facilities provides for surrounding residents, mainly students [27]. The nature of primary education spatial equilibrium is therefore whether, or not, a convenient service is balanced spatially to achieve habitable living space [3]. Thus, given the goal of achieving a habitable living space, corresponding basic service facilities within living circles have been considered important criteria that can be used for evaluation. Key factors used to evaluate the spatial equilibrium of primary education services mainly include school points, the spatial distribution of students, the living circle unit, and the spatial equalization assessment model. The spatial distribution of primary students, therefore, encompasses the number of such students, calculated using the contribution coefficient method in GIS modeling [28]. A living circle unit is a threshold to assess the equilibrium state of primary education services, determined on the basis of normal human walking speed [7]. The equilibrium assessment model provides one basis for integrating all elements to judge the spatial equalization of primary education services within a given living circle unit.
The methods used here are summarized in Figure 2. Thus, in the first place, population-related data including DMSP/OLS, living security, medical and employment services, and construction land were integrated to realize primary student spatial distributions using the contribution coefficient method. The unit of four living circle scenarios was then constructed on the basis of the normal walking speed and the accessibility time scenarios of a living circle. An equilibrium evaluation model was then designed to evaluate the spatial equilibrium of primary education services based on student spatial distribution, living circles, and school points.

3.1. The Spatial Distribution of Primary Students

In order to assess the spatial distribution of primary school students, total numbers within county/town units were discretized into living circle units (e.g., quantity and density). Variables were then measured using the contribution coefficient method, one GIS modeling approach [28]. This method mainly comprises two steps. In step 1, the comprehensive contribution coefficient, the distribution of primary students, was calculated by spatially overlaying a series of factors affecting population distribution (Equation (1)). In step 2, the total number of students within a county unit was determined using Equation (2); this variable mainly includes the total number of primary students in each county and the contribution coefficient percentage for each living circle unit, the total contribution coefficient across the study area.
These variables were calculated as follows:
I F I = i = 1 n x i F i ,
and;
P N = P S N × I F I N i I F I N i
In these expressions, IFI denotes the comprehensive contribution coefficient, while xi and Fi denote the contribution of IFI and the spatial distribution data of factor i, respectively. Selected factors were regarded as equal in this study, and so the xi value of each is 1. Similarly, n denotes the number of factors, while PN, PSN, and IFINi denote the spatial distribution of primary student density, the number of students, and the IFI value in raster unit i within administrative unit N, respectively.
Evaluating the factors influencing selection is a key step in calculating the comprehensive contribution coefficient. Research has shown that DMSP/OLS nightlight images are important indicators that can be used to characterize population spatial distribution [29]. Indeed, locations adjacent to living support services (i.e., supermarkets, farmers markets, bus stations, and catering outlets), health guarantee services (i.e., general hospitals, hospitals, and clinics), and employment service facilities (i.e., companies, factories) tend to have large population concentrations because of their quality locations [30]. Populations also tend to be more concentrated in urban areas than in town or rural areas [31,32]. Thus, based on this analysis, the comprehensive contribution coefficient measurement index system and calculation method were constructed as summarized in Table 1.

3.2. Living Circle Unit Construction

A large number of studies have shown that an acceptable time for a person to reach a destination on foot is 15 min [33,34]; spatial planning for Shanghai, China, therefore incorporates a living circle of 15 min as a component of living space habitability and moderation. It is also the case, however, that because of the large land area of China and a relatively dispersed population, it is difficult for many regions to achieve a 15 min living circle in urban and rural areas under current socioeconomic conditions, especially in less affluent areas like Zhangjiakou. In order to make this research work better adapt to the actual needs of Zhangjiakou city, a multi-time mode was, therefore, determined to construct evaluation units, which were then divided into four time periods, 15 min, 20 min, 25 min, and 30 min. In terms of living circle unit radius, previous studies have shown that between 0.8 km and 1.2 km and 3 km are adaptive for the elderly, children, and senior students, respectively. However, the purpose of primary school spatial layout optimization is not only to serve students but also other groups within the living circle [22]. Thus, in order to improve living circle practicality, the walking speed of ordinary people (1.418 m) was used as a proxy for the living circle service radius (Table 2) [7]. In addition, according to centrality theory, the service function of a school is the distribution law of a decreasing surrounding concentric circle. Although the optimal shape of an evaluation unit should be circular, a regular hexagonal unit is nevertheless the closest that can be constructed under current technical conditions. A regular hexagonal grid was therefore used to construct evaluation units. Information for regular hexagons in four living circle scenarios are shown in Table 2.

3.3. Equilibrium Evaluation Model

Equilibrium evaluation of primary education services within each living circle is the process used to quantify the relationship between supply capacity and demand at each location. The supply capacity of a primary seat can therefore be regarded as the seating capacity of all schools within a given living circle. Demand capacity can therefore be regarded as the total number of primary students within a living circle, obtained from spatial distribution results via partition statistics. In order to construct an equilibrium evaluation model, a number of cases were considered. First, within a living circle with primary schools, students are able to enjoy the most appropriate educational services. This means that if primary schools are numerous, supply seat quantity might be much larger than demand, up to a threshold of 270 primary students. In the case of a minimum supply degree for a complete primary school in a rural area, the living circle is considered to be a positive non-equilibrium feature. In contrast, if the supply quantity is far less than the demand, also up to a threshold of 270 students, the living circle will be regarded as a negative non-equilibrium feature. In cases where the difference between supply and demand is ±270 people, the living circle is regarded as an equalization feature. In living circle cases where primary schools are absent, supply is far less than demand, and so the circle will be regarded as a negatively non-equilibrium feature. Thus, according to these principles and based on a segmented function, the primary education service equilibrium evaluation model used here was designed as follows:
B = 0 n P S P A P A n > 0 , P A [ n P S 270 , n P S + 270 ] n > 0 , P A [ n P S 270 , n P S + 270 ] n 0 .
In this expression, B denotes the equilibrium index within a living circle belonging to a person, while n, PA, and PS denote the number of primary schools, the total number of actual students, and the seating capacity of all schools within a circle, respectively. Thus, if B is 0, an equilibrium state is present within the living circle, while if B is positive, the primary service supply within the living circle is greater than demand, and non-equilibrium is positive. In cases where B is negative, the service supply of primary schools within a living circle will be less than demand and will present a negative non-equilibrium. In other words, the greater the absolute value of B, the greater the non-equilibrium. As the number of classes in each primary school is secure data, the seating number in each case was not available for this analysis. The minimum seating capacity of a primary school was therefore set using a relevant standard. This study takes the national minimum standard as the number of seating capacity supply in each school and pays attention to the difference between urban and rural primary schools to enhance the sensitivity of this model to equilibrium detection. The Ps value for urban primary schools was 600, while that of rural primary schools was 270.

4. Results

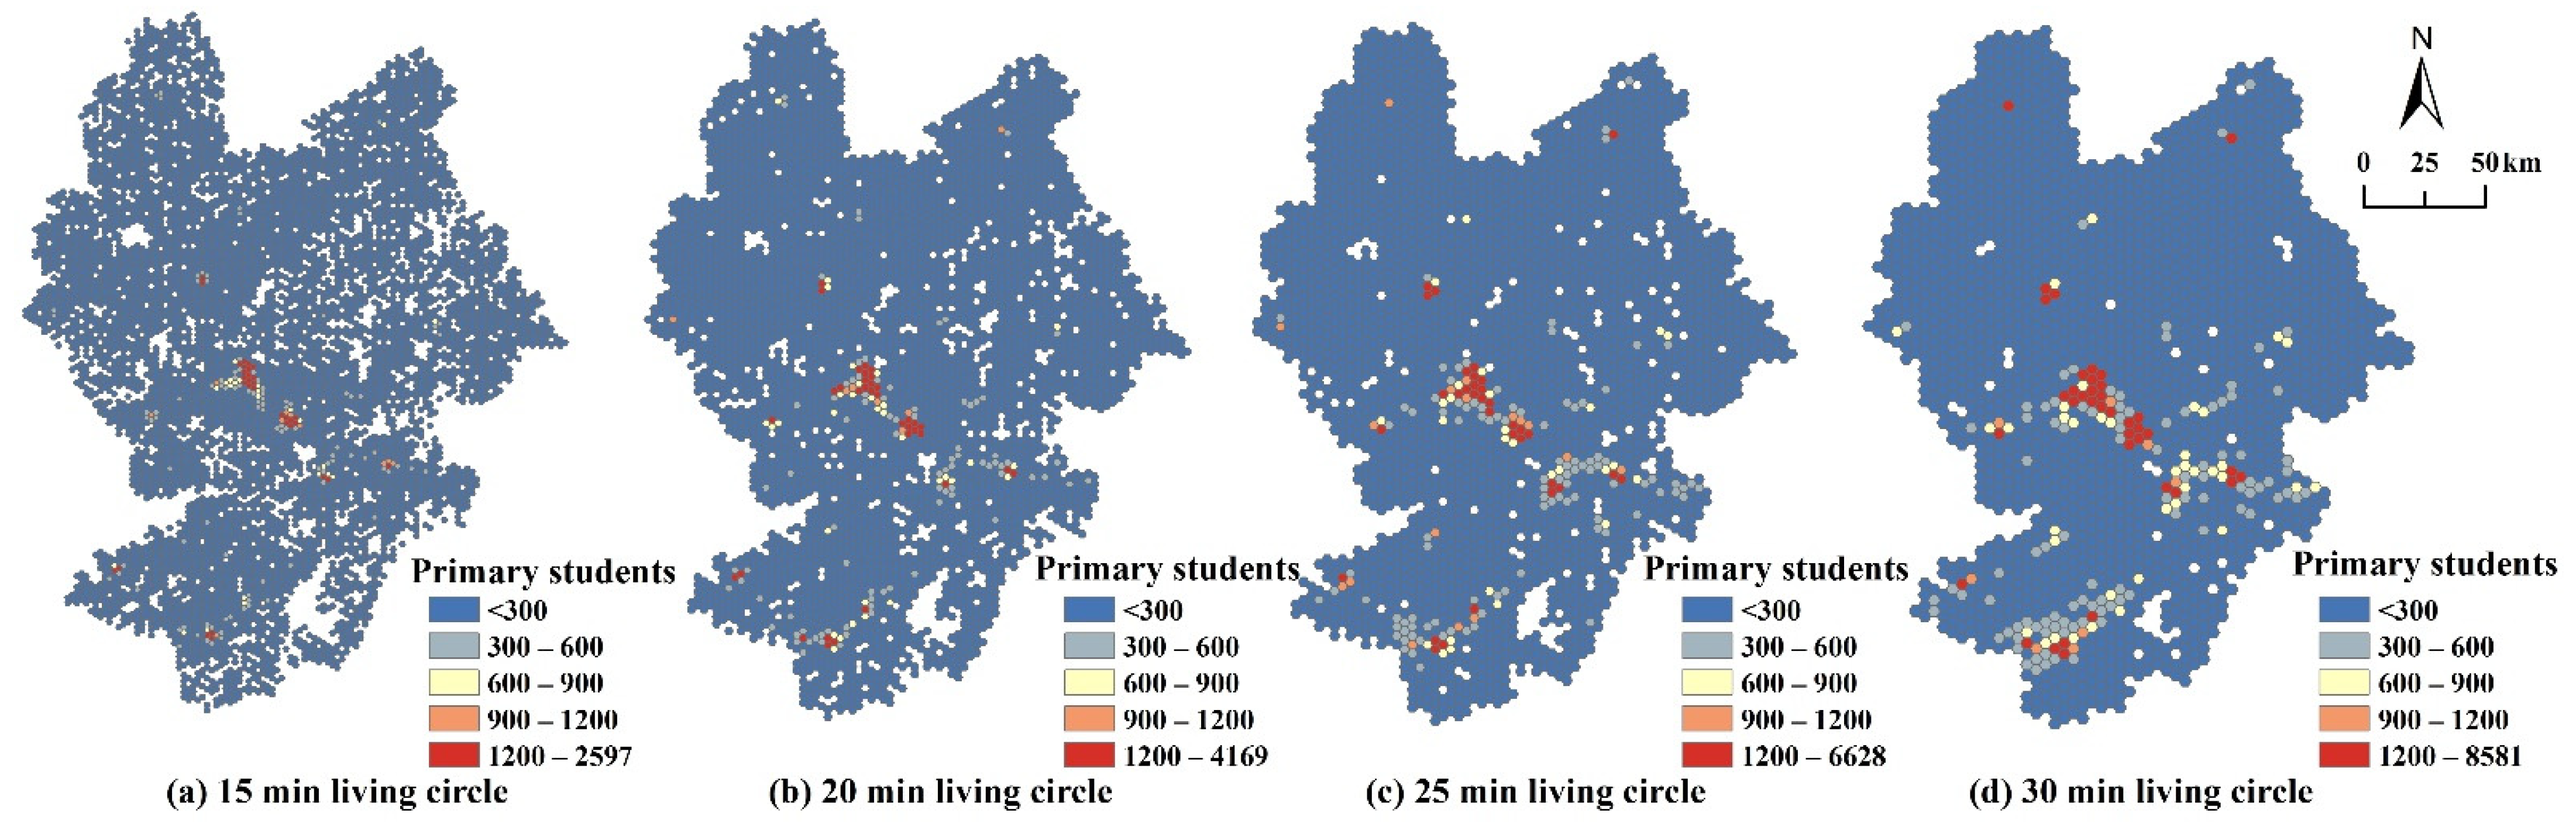
4.1. The Spatial Distribution of Primary Students

The data summaries in Figure 3a–e reveal the spatial distribution of five indicators that influence the spatial distribution of primary students (Table 1). The plot in Figure 3f shows the contribution coefficient spatial distribution for primary students estimated using Equation (1), while the plot in Figure 3g shows the spatial distribution estimated using Equation (2). The spatial distribution density of primary students falls between 69 persons/km2 and 842 persons/km2. Data show that areas of the highest primary student densities are mainly distributed within the districts of Qiaodong, Qiaoxi, and Xuanhua, as well as in the county centers of Zhuolu, Huailai, Yuxian, and Yangyuan. Primary student densities in rural areas far from cities and towns are generally low. The distribution of primary students in Baxia County is relatively concentrated, while the distribution in Bashang County remains relatively dispersed. Results also show that the spatial distribution characteristics of primary students are influenced by a range of factors; however, in terms of high and low spatial distributions, results remain basically consistent with the comprehensive contribution coefficient.

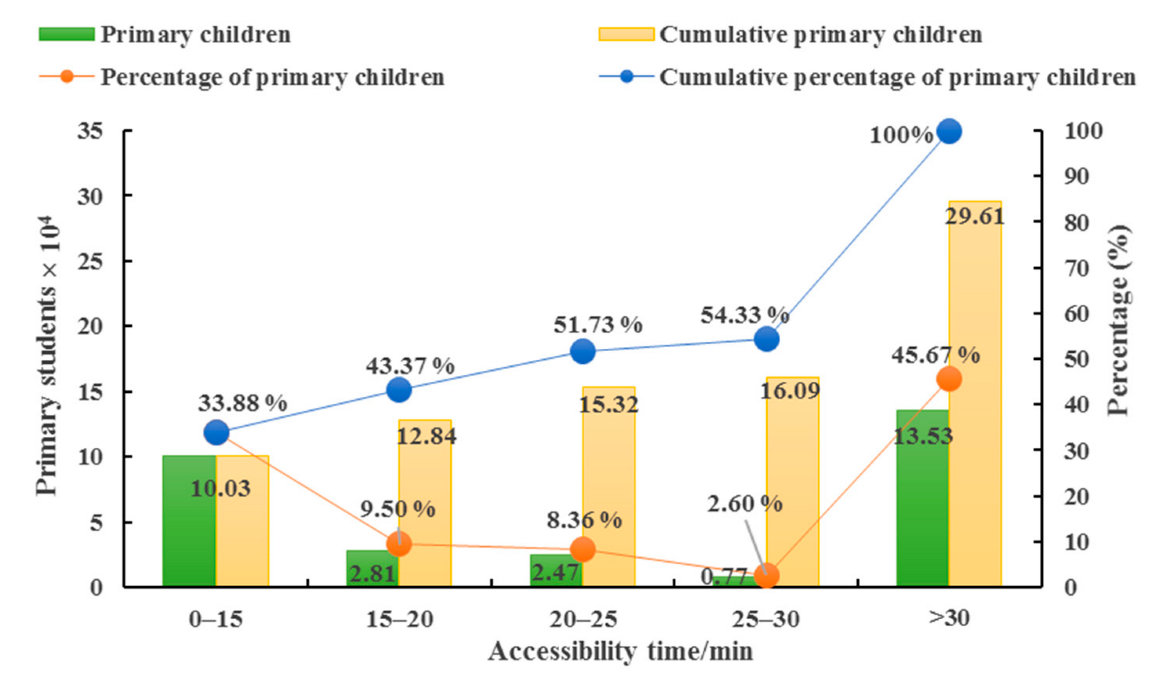
4.2. Primary Student Statistics for Different Living Circles

The summary presented in Figure 4 reveals the spatial characteristics of primary students in different living circles. These data show that as accessibility time increases, the number of high-value primary student units also tends to increase. These high-value units within the 15 min living circle are mainly concentrated around the center of the city of Zhangjiakou, while high-value units within the 30 min living circle are distributed around the center of each county alongside a higher-density area in the city center. Primary students at different accessibility times were counted by overlaying the spatial distribution maps for students and schools in different living circles (Figure 5). This analysis shows that just 33.88% of primary students are able to arrive at school within 15 min, while 54.33% within the city of Zhangjiakou can arrive within 30 min, almost half the total. This phenomenon indicates an obvious spatial equilibrium for primary education services within the city of Zhangjiakou.

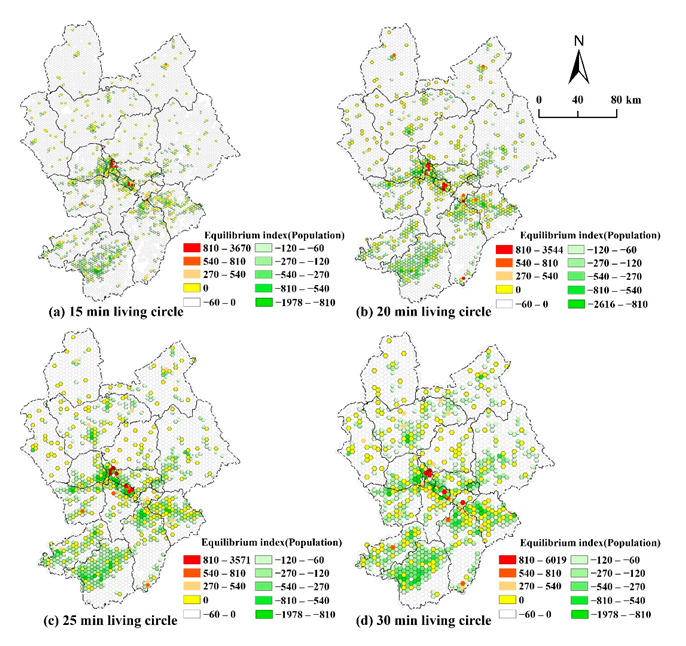
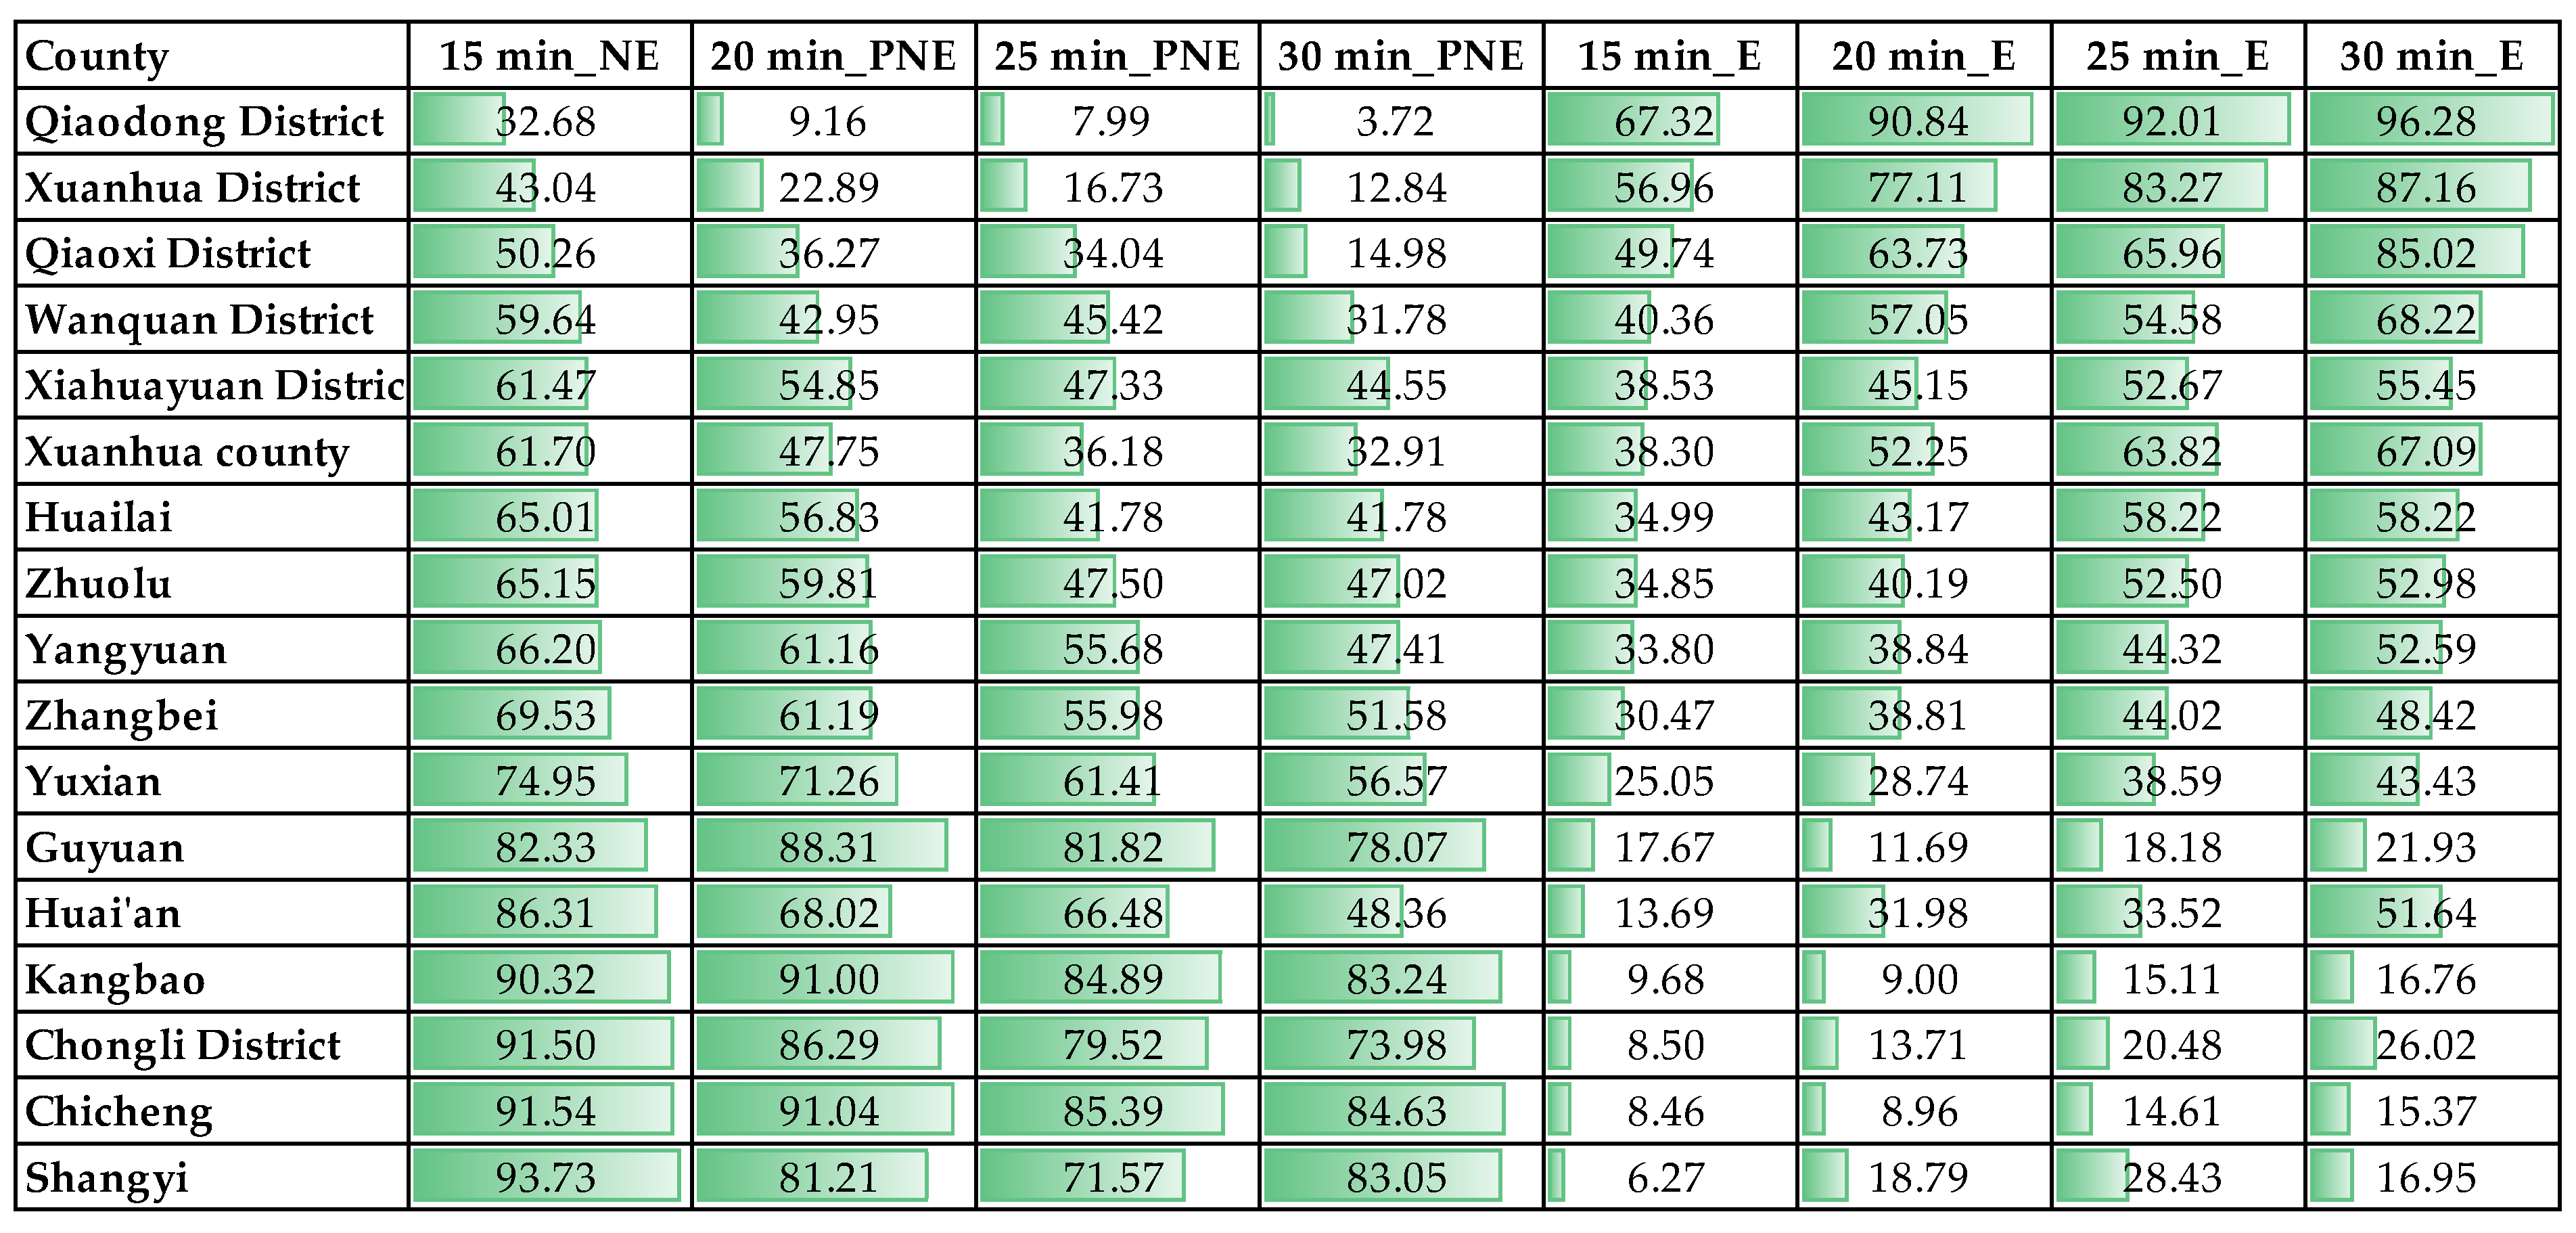
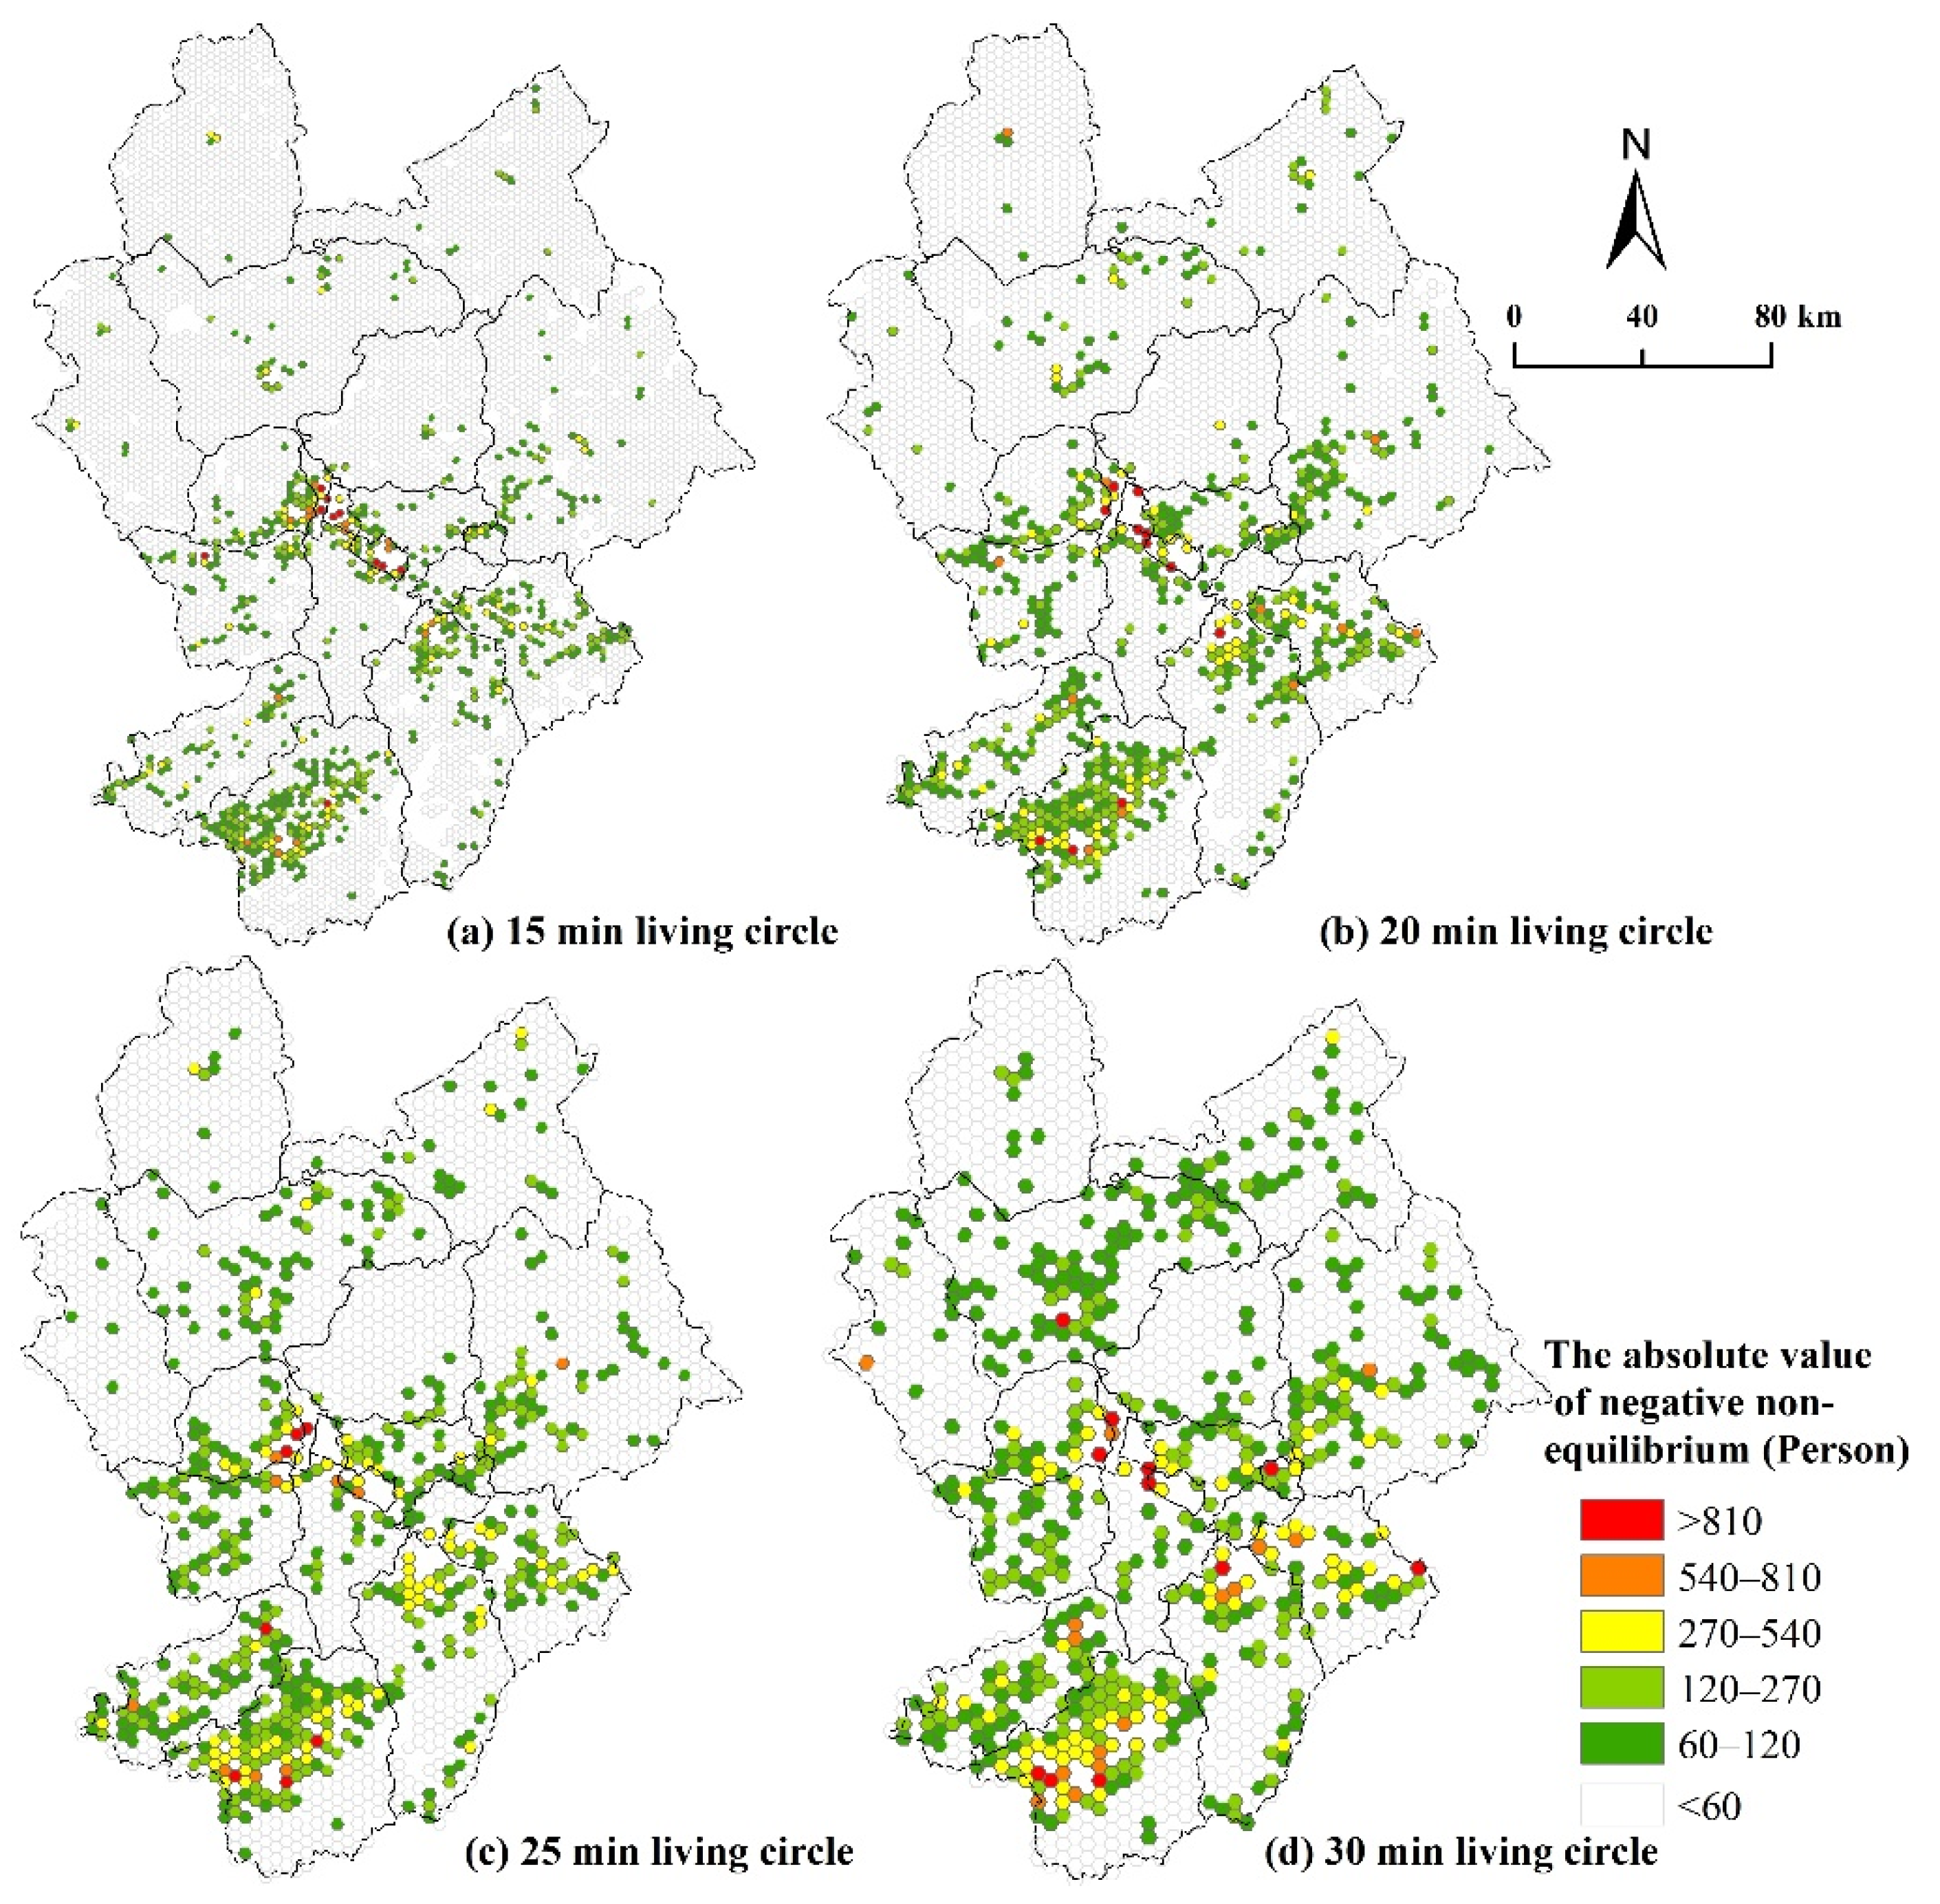
4.3. Spatial Equilibrium Distribution Characteristics for Primary Education Services

The results summarized in Figure 6 and Table 3 reveal the spatial equilibrium distribution characteristics and statistical results for primary educational services within the four living circle scenarios. Equilibrium characteristics can be graded into three levels of positive non-equilibrium and one level of equilibrium as well as negative non-equilibrium with reference to the multiple of the minimum capacity students in rural complete and incomplete primary schools. Thus, the greater the absolute value, the greater the non-equilibrium.
As shown in Figure 6 and Figure 7 and Table 3, the numbers of positive non-equilibrium primary services within the four living circle scenarios are relatively small; 15 min, 20 min, 25 min, and 30 min living circle scenarios account for 0.55%, 0.82%, 1.02%, and 1.28% of total living circle sizes, respectively. These scenarios are mainly distributed centrally within the urban areas of Qiaodong, Xuanhua, Qiaoxi, Wanquan, and Xiahuayuan districts. Data show that as the living circle area increases, the living circle of positive non-equilibrium primary education services also appears sporadically in Huailai, Zhuolu, and Yuxian. These account for 4.01%, 5.72%, 7.66%, and 9.82% of total living circle sizes, respectively, across all districts and counties. The number of negative non-equilibrium primary services within the four living circle scenarios remains relatively large overall; these four living circle scenarios account for 95.44%, 93.45%, 91.32%, and 88.89% of total living circle size, respectively. In the case of the living circle lacking primary school points, the number of negative non-equilibrium cases accounted for 94.98%, 92.62%, 89.73%, and 86.87% of the total living circle, respectively, mainly located in rural areas away from urban zones and towns, such as Shangyi, Chicheng, Chongli, Kangbao, and Guyuan counties. It is also interesting to note that many negative non-equilibrium primary services are also located within living circles containing primary schools, accounting for 0.47%, 0.83%, 1.59%, and 2.02% of the total, respectively, mainly distributed in Qiaodong and Qiaoxi districts.

5. Discussion

It is clearly important to improve the habitability of living spaces and enhance the resilience of regional prevention and control measures to withstand serious emergencies by planning basic public service facilities similar to educational services using living circle units. As one important public basic service, primary schools perform vital functions including supplying education services for primary students, settling down, relieving bearing pressure of the urban population, enhancing the habitability of living space in peacetime, and providing places for combat in wartime. Spatial equilibrium layouts, therefore, exert crucial impacts on these functions. Evaluation results show that primary education services are characterized by dramatically non-equilibrium spatial distributions within the city of Zhangjiakou, in particular in rural areas away from urban zones and towns.
In terms of habitable living space and defensible unit construction, we follow the principle of fairness and refer to the minimum standards for primary school construction in rural China. On this basis, we propose an optimization path for primary education points that could be implemented.
First, in living circles that contain primary schools, boarding options should be added for students who live outside in the case of positive non-equilibrium services. This class should be expanded in the case of negative non-equilibrium.
Second, in living circles that lack primary schools, a number of planning alternatives could be implemented. In cases where the absolute value of the equilibrium index is greater than 270, a new complete school should be planned in the center of the living circle, adhering to the minimum number of students (270) served in a rural complete primary school. In these cases, the number of classes should be planned according to the number of primary students. In cases where the absolute value of the equilibrium index falls between 120 and 270, an incomplete school should be planned in the center of the living circle, again adhering to the minimum number of students (120) served in a rural incomplete primary school. A complete, or incomplete, primary school should also be planned at the junction between two or three living circles, again on the basis of relevant distribution characteristics. Finally, in cases where the absolute value of the equilibrium index is less than 60, a boarding system should be adopted within the living circle including the necessary educational resources in order to solve the non-equilibrium problem. On the basis of these outcomes, a new primary school planning map and associated statistical results are summarized in Figure 8 and Table 4, respectively. Inside these four living circles, the numbers of newly completed primary schools are 90, 82, 88, and 98, respectively, while the number of new incomplete ones are 219, 222, 194, and 158, respectively. The numbers of primary schools located at living circle junctions are 399, 346, 284, and 280, respectively, while the numbers of living cycles requiring boarding measures are 5878, 3477, 2152, and 1357, respectively.
Third, in terms of teaching methods, the online educational model developed in the era of COVID-19 should be fully utilized to solve the educational resources problem. In terms of the functions of new primary schools, complete health and defense facilities should also be added to deal with major emergencies similar to COVID-19. Policies regarding land planning, financial support, and other areas should also be formulated to ensure that optimized primary schools can be implemented.
In fact, many previous studies have assessed the spatial equilibrium of public service facilities through the two-step Floating Catchment Area method [35,36,37,38], and evaluate the equilibrium from the perspective of the living circle [21,22]. However, compared with these studies, the operation of the method proposed here is relatively simple and functional. The equilibrium index used here was also designed on the basis of primary school student numbers and so can be more conveniently combined with new school construction standards to optimize the spatial equilibrium of primary educational services. The spatial equilibrium of primary educational services across four living circle scenarios within the city of Zhangjiakou was therefore evaluated on this basis and optimization proposals were put forward to provide support for optimizing the non-equilibrium of services. These findings reported here reflect the spatial equilibrium of primary educational services throughout the city of Zhangjiakou, which can provide more options for local policymakers; lessons can be learned to prepare for future spatial planning difficulties based on habitable living space and defensible unit construction.
A number of uncertainties and limitations nevertheless remain. In the first place, due to a lack of data on the number of primary school classes, errors in equalization assessment results within school-containing living circles will be present. Thus, in practical application, the actual number of classes in primary schools should be used as model parameters to improve the reliability of equilibrium evaluation results. Uncertainties and limitations in primary student data source spatial distributions are also present and so data accuracy needs to be further improved.

6. Conclusions

A new method is proposed to quantitatively assess primary education service equalization. And it is proved to be effective in the case study of Zhangjiakou City. The city of Zhangjiakou is presently characterized by dramatic spatial negative non-equilibrium primary educational services (i.e., supply < demand) across all four of the living circle scenarios considered in this analysis (i.e., 15 min, 20 min, 25 min, and 30 min). This is particularly true for rural areas away from urban zones and towns, especially in the counties of Shangyi, Chicheng, Chongli, Kangbao, and Guyuan. It is nevertheless interesting to note that all living circle scenarios do contain positive non-equilibrium primary educational services (i.e., supply > demand). These are mainly located within the urban areas of Qiaodong, Xuanhua, Qiaoxi, Wanquan, and Xiahuayuan districts. The spatial optimization of primary schools should therefore be implemented to alleviate the problem of non-equilibrium services according to the optimization maps for four living circle scenarios lacking primary schools. The results of this analysis offer some suggestions for educational service optimization across the city of Zhangjiakou as well as in other Chinese urban areas. We also provide additional scientific data regarding habitable living space and defensible unit construction as well as for the spatial equilibrium evaluation of other public infrastructure service facilities.

Author Contributions

Conceptualization, L.L. and P.S.; methodology, A.H., Y.Z., L.L., C.L., P.S. and Y.X.; software, A.H., C.L. and Y.X.; validation, A.H., P.S. and Y.X.; formal analysis, A.H., Y.Z. and Y.X.; investigation, A.H., C.L., L.L. and Y.X.; resources, Y.Z., C.L. and Q.L.; data curation, Y.Z. and Q.L.; writing—original draft preparation, A.H. and Y.X.; writing—review and editing, A.H. and Y.X.; visualization, A.H. and Y.X.; supervision, A.H. and Y.X.; project administration, A.H. and Y.X.; funding acquisition, A.H. and Y.X. All authors have read and agreed to the published version of the manuscript.

Funding

This research was funded by the National Natural Science Foundation of China grant number 41971238 and 42201272.

Data Availability Statement

Data available on request due to restrictions privacy.

Acknowledgments

We thank the Stine Wang (the academic editor of this paper) and two anonymous reviewers for their valuable and insightful comments and suggestions.

Conflicts of Interest

The authors declare no conflict of interest.

References

  1. Aldis, J. Strategic facility location, capacity acquisition, and technology choice decisions under demand uncertainty: Robust vs. non-robust optimization approaches. Eur. J. Oper. Res. 2017, 260, 1095–1104. [Google Scholar]
  2. Rohaninejad, M.; Navidi, H.; Nouri, B.V.; Kamranrad, R. A new approach to cooperative competition in facility location problems: Mathematical formulations and an approximation algorithm. Comp. Oper. Res. 2017, 83, 45–53. [Google Scholar] [CrossRef]
  3. Gao, Y.; He, Q.; Liu, Y.; Zhang, L.; Wang, H.; Cai, E. Imbalance in spatial accessibility to primary and secondary schools in China: Guidance for education sustainability. Sustainability 2016, 8, 1236. [Google Scholar] [CrossRef] [Green Version]
  4. National Bureau of Statistics. China Statistical Yearbook 2018; China Statistical Press: Beijing, China, 2018.
  5. Tian, L.; Tao, R. Land reform, housing guarantee, and transition of urban-rural development opportunities and challenges for developing rental housing in collective land. City Plan. 2019, 43, 53–60. [Google Scholar]
  6. Liu, Y.; Li, Y. Revitalize the worlds countryside. Nature 2017, 548, 275–277. [Google Scholar] [CrossRef] [PubMed] [Green Version]
  7. Xiao, Z.P.; Cai, Y.W.; Zhang, Y. Overseas life circle planning and practice. Planners 2014, 30, 89–95. [Google Scholar]
  8. Fan, C.; Zhai, G.; Zhou, S.; Zhang, H.; Qiao, P. Integrated framework for emergency shelter planning based on multihazard risk evaluation and its application: Case study in China. Nat. Hazards Rev. 2017, 18, 1–15. [Google Scholar] [CrossRef]
  9. Masateru, H. Progress of Japanese urban geography after the 1950ps and new directions. Urban Reg. Plan. Res. 2010, 3, 118–131. [Google Scholar]
  10. Zhu, Y.R. The development of residential district planning in Korea and its enlightenments. Urban Plan. Int. 2009, 24, 106–110. [Google Scholar]
  11. Duan, J. Building a Defense Unit in the Space Planning System: A Workshop on 2020 COVID-19 Emergencies [EB/OL]. Available online: http://kns.cnki.net/kcms/detail/11.2378.TU.20200220.1353.002.html (accessed on 21 February 2020).
  12. Yeager, R.F. Rationality and retrenchment: The use of a computer simulation to Aid decision making in school closings. Educ. Urban Soc. 1979, 11, 296–312. [Google Scholar] [CrossRef]
  13. Bennett, D.L. Educational inequality in the United States: Methodology and historical estimation of education Gini coefficients. Soc. Sci. Res. Netw. 2011, 33, 1–34. [Google Scholar]
  14. Brousselle, A.; Petit, G.; Giraud, M.J.; Rietmann, M.; Boisvert, K.; Foley, V. Using the evaluation process as a lever for improving health and healthcare accessibility: The case of HCV services organization in Quebec. Eval. Program Plan. 2016, 55, 134–143. [Google Scholar] [CrossRef] [Green Version]
  15. Takahagi, W.; Sumitani, Y.; Takahashi, H.; Omae, Y.; Sakai, K. Method of determining future facility location with maintaining present accessibility. Ind. Eng. Manag. Syst. 2016, 15, 197–205. [Google Scholar] [CrossRef] [Green Version]
  16. Taylor, R.G.; Vasu, M.L.; Causby, J.F. Integrated planning for school and community: The case of johnston county, north carolina. Interfaces 1999, 29, 67–89. [Google Scholar] [CrossRef]
  17. Slagle, M. GIS in community-based school planning: A tool to enhance decision making, cooperation, and democratization in the planning process. EDRS PRICE 2000, 16–19. Available online: https://aap.cornell.edu/academics/department-city-and-regional-planning (accessed on 21 February 2022).
  18. Gao, J.B.; Zhou, C.S.; Wang, Y.M.; Jiang, H. Spatial analysis on urban public service facilities of Guangzhou City during the economy system transformation. Geogr. Res. 2011, 30, 424–436. [Google Scholar]
  19. Zhu, H.H.; Yan, H.W.; Li, Y.L. An optimization method for the layout of public service facilities based on Voronoi diagrams. Sci. Surv. Mapp. 2008, 33, 72–74. [Google Scholar]
  20. Pablo, C.B.; Wei, C.; Michael, H. Multiscale evaluation of an urban deprivation index: Implications for quality of life and healthcare accessibility planning. Appl. Geogr. 2016, 70, 1–10. [Google Scholar]
  21. Xiao, F.L.; Du, R.H.; Zhang, X.L. Evaluation of spatial allocation of residential quarters and public service facilities based on the perspective of 15 minutes life circle: A case study of Urumqi. Arid. Land Geogr. 2021, 44, 7565. [Google Scholar]
  22. Zhang, X.K.; Pei, X.R.; Li, J.R.; Zeng, P. Spatial differences of public service facilities in central urban area of Tianjin from the perspective of life circle. J. Arid. Land Resour. Environ. 2021, 35, 43–51. [Google Scholar]
  23. Wei, W.; Hong, M.Y.; Xie, B. Demand-supply matching oriented 15-minute community life circle demarcation and spatial optimization, Wuhan. Planner 2019, 35, 11–17. [Google Scholar]
  24. Sun, P.; Xu, Y.; Yu, Z.; Liu, Q.; Xie, B.; Liu, J. Scenario simulation and landscape pattern dynamic changes of land use in the Poverty Belt around Beijing and Tianjin: A case study of Zhangjiakou city, Hebei Province. J. Geogr. Sci. 2016, 26, 272–296. [Google Scholar] [CrossRef]
  25. Zhangjiakou People’s Government Office. Zhangjiakou Economic Yearbook-2018; China Statistics Press: Beijing, China, 2018.
  26. Huang, A.; Xu, Y.; Sun, P.; Zhou, G.; Liu, C.; Lu, L.; Xiang, Y.; Wang, H. Land use/land cover changes and its impact on ecosystem services in ecologically fragile zone: A case study of Zhangjiakou City, Hebei Province, China. Ecol. Indic. 2019, 104, 604–614. [Google Scholar] [CrossRef]
  27. Olubadewo, O.O.; Abdulkarim, I.A.; Ahmed, M. The use of GIS as educational decision support system(EDSS) for primary schools in Fagge local government area of Kano state, Nigeria. Acad. Res. Int. 2013, 6, 614–625. [Google Scholar]
  28. Huang, A.; Xu, Y.; Sun, P.; Liu, C.; Zheng, W. Spatial distribution of population spatialization based on multi-source data: A case study of Zhangjiakou city. Resour. Sci. 2017, 39, 2186–2196. [Google Scholar]
  29. Cao, X.; Hu, Y.; Zhu, X.; Shi, F.; Zhuo, L.; Chen, J. A simple self-adjusting model for correcting the blooming effects in DMSP-OLS nighttime light images. Remote Sens. Environ. 2019, 224, 401–411. [Google Scholar] [CrossRef]
  30. He, M.; Xu, Y.; Li, N. Population spatialization in Beijing City based on machine learning and multisource remote sensing data. Remote Sens. 2020, 12, 1910. [Google Scholar] [CrossRef]
  31. Tan, C.; Tang, Y.; Wu, X. Evaluation of the equity of urban park green space based on population data spatialization: A case study of a central area of Wuhan, China. Sensors 2019, 19, 2929. [Google Scholar] [CrossRef] [Green Version]
  32. Xiong, J.; Li, K.; Cheng, W.; Ye, C.; Zhang, H. A method of population spatialization considering parametric spatial stationarity: Case study of the southwestern area of China. ISPRS Int. J. Geo-Inf. 2019, 8, 495. [Google Scholar] [CrossRef] [Green Version]
  33. Liang, H.; Ren, J.; Dong, L.; Gao, Z.; Zhang, N.; Pan, M. Is the hydrogen production from biomass technology really sustainable? Answer by life cycle emergy analysis. Int. J. Hydrog. Energy 2016, 41, 10507–10514. [Google Scholar] [CrossRef]
  34. González-Quintero, R.; Bolívar-Vergara, D.M.; Chirinda, N.; Arango, J.; Pantevez, H.; Barahona-Rosales, R.; Sánchez-Pinzón, M.S. Environmental impact of primary beef production chain in Colombia: Carbon footprint, non-renewable energy and land use using life cycle assessment. Sci. Total Environ. 2021, 773, 145573. [Google Scholar] [CrossRef]
  35. Han, Y.H.; Lu, Y.Q. Accessibility assessment and planning of public service facilities for education: A Case study on senior high schools in Yizheng City. Sci. Geogr. Sin. 2012, 7, 822–827. [Google Scholar]
  36. Dos Anjos Luis, A.; Cabral, P. Geographic accessibility to primary healthcare centers in Mozambique. Int. J. Equity Health 2016, 15, 173–185. [Google Scholar] [CrossRef] [PubMed] [Green Version]
  37. Ertugay, K.; Argyroudis, S.; Düzgün, H.S. Accessibility modeling in earthquake case considering road closure probabilities: A case study of health and shelter service accessibility in Thessaloniki, Greece. Int. J. Disaster Risk Reduct. 2016, 17, 49–66. [Google Scholar] [CrossRef]
  38. Featherstone, P.; Eberth, J.M.; Nitcheva, D.; Liu, J. Geographic accessibility to health services and neonatal mortality among very-low birthweight infants in south Carolina. Matern. Child Health J. 2016, 20, 2382–2391. [Google Scholar] [CrossRef] [PubMed]
Figure 1. Map of the study area. Administrative divisions of China are based on a standard GS map (2016) 2884, downloaded from the standard map service website of the National Administration of Surveying, Mapping, and Geographic Information Technology.
Land 11 01994 g001
Figure 2. Methods flowchart.
Land 11 01994 g002
Figure 3. Maps to show the spatial distribution of primary students in this analysis.
Land 11 01994 g003
Figure 4. The spatial distribution of primary students within different living circles (Note: blank circles denote depopulated zones).
Land 11 01994 g004
Figure 5. Primary population statistics for different accessibility times.
Land 11 01994 g005
Figure 6. Spatial equilibrium distribution characteristics of primary educational services within the four living circle scenarios.
Land 11 01994 g006
Figure 7. The ratio of primary children of non-equilibrium and equilibrium services at the county level (%) (Note: NE and E denote the primary children of non-equilibrium service and the primary children of equilibrium services, respectively).
Land 11 01994 g007
Figure 8. Optimization maps for four living circle scenarios lacking primary schools.
Land 11 01994 g008
Table 1. Contribution coefficients of primary student spatial distribution.
First-Tier VariableSecond-Tier VariableMethod
DMSP/OLS--Normalized to 0~1 based on the formula F ( x ) = x x min x max x min , where F(x) is the normalized value, x is the original data, xmin is the minimum value of x, and xmax is the maximum value of x.
Living support servicesSupermarket accessibility
Farmers market accessibility
Bus stop accessibility
Catering services
The accessibility of each service was first calculated based on POI data and the Euclidean Distance Analysis tool in ArcGIS 10.4.1 (created by ESRI company, in RedLands, California, USA). Second, accessibility distance was divided into 11 levels: up to 200 m, between 200 m and 400 m, between 400 m and 600 m, between 600 m and 800 m, and greater than 2000 m. The contribution value for different levels was assigned via the expert scoring method on the scale 1, 0.9, 0.8, 0.7... 0.
Health guarantee servicesGeneral hospital accessibility
Special hospital accessibility
Clinic accessibility
Employment servicesCompany accessibility
Factory accessibility
Construction land A contribution value for different areas was assigned using the expert scoring method.
Urban0.5
Town0.3
Rural0.1
Table 2. Regular hexagons in four living circle scenarios.
Living Circle (Minutes)Normal Walking Speed (m/s)Regular Hexagon
Radius (m)
Regular Hexagon Area (m2)
151.4181276.24,231,327.371
201.4181701.67,522,359.771
251.418212711,753,687.14
301.4182552.416,925,309.48
Table 3. Primary educational equilibrium services within the four living circle scenarios.
Level15 min20 min25 min30 min
CountRatio/%CountRatio/%CountRatio/%CountRatio/%
(810, +∞]90.1390.2070.2350.23
(540, 810]20.0360.1340.1340.18
(270, 540]27 380.3922 350.4920 310.6619 280.87
02784.012555.722327.662149.82
[−60,0)587884.77347778.03215271.05135762.28
[−120, −60)3995.753467.762849.3828012.85
[−270, −120)2193.162224.981946.401587.25
[−540, −270)751.08771.73852.81914.18
[−810, −540)240.35160.36190.63221.01
[−∞, −810)230.33260.58321.06291.33
Total6934100445610030291002179100
Containing primary schools15 min20 min25 min30 min
CountRatio/%CountRatio/%CountRatio/%CountRatio/%
[−60, 0)00000000
[−120, −60)00000000
[−270, −120)00000000
[−540, −270)110.16170.38130.43190.87
[−810, −540)80.1250.11100.3370.32
[−∞, −810)130.19150.34250.83180.83
Lacking primary schools15 min20 min25 min30 min
CountRatio/%CountRatio/%CountRatio/%CountRatio/%
[−60, 0)587884.77347778.03215271.05135762.28
[−120, −60)3995.753467.762849.3828012.85
[−270, −120)2193.162224.981946.401587.25
[−540, −270)640.92601.35722.38723.30
[−810, −540)160.23110.2590.30150.69
[−∞, −810)100.14110.2570.23110.50
Table 4. Statistical results for four living circle scenarios lacking primary school.
Planning ProposalsEquilibrium Index (Person)Living Circle CountsLegends
15 min20 min25 min30 min
A complete primary school should be planned in the center of the living circle.>8101011711Land 11 01994 i001
540–8101611915
270–54064607272
Subtotal90828898
An incomplete primary school should be planned in the center of the living circle.120–270219222194158
A complete or incomplete primary school should be planned at the junction between two or three living circles.60–120399346284280Land 11 01994 i002
Boarding with other living circles containing primary schools.<605878347721521357--
Publisher’s Note: MDPI stays neutral with regard to jurisdictional claims in published maps and institutional affiliations.

