Article

A Multi-Objective Optimization of Physical Activity Spaces

1
College of Civil Engineering and Architecture, Zhejiang University, Hangzhou 310058, China
2
Center for Balance Architecture, Zhejiang University, Hangzhou 310058, China
3
Urban and Rural Planning Research Center, Qujiang District Natural Resources and Planning Bureau, Quzhou 324022, China
4
The Architectural Design & Research Institute of Zhejiang University Co., Ltd., Hangzhou 310028, China
*
Author to whom correspondence should be addressed.
Land 2022, 11(11), 1991; https://doi.org/10.3390/land11111991
Submission received: 10 October 2022 / Revised: 27 October 2022 / Accepted: 2 November 2022 / Published: 7 November 2022

Abstract

:
Optimizing the location of physical activity spaces (PAS) to ensure health, equity and efficiency has long been an important issue in urban planning. Given the health benefits of urban green spaces (UGS), taking Gongshu District in Hangzhou as a case, we examine the issue of where such PAS should be located to optimize three objectives: (1) minimize the distance between PAS and UGS; (2) maximize the accessibility of PAS and (3) maximize the population that falls within the coverage range. This study develops a multi-objective optimization of physical activity spaces model (MOPAS) based upon multi-objective particle swarm optimization to yield a set of non-dominated Pareto optimum solutions that can be used to determine the most practical tradeoffs between the conflicting objectives. It compares the advantages and disadvantages of the Pareto solutions and evaluates the construction situation of locations and the implementation feasibility. Decision-makers can choose the best solution according to subjective preferences and objective conditions. The MOPSO holds great promise for improving the location optimization of PAS and the methods applied can be adapted to support multi-objective optimization of facilities in urban planning globally.

1. Introduction

Rapid urbanization has changed people’s traditional lifestyle. The World Health Organization (WHO) has identified physical inactivity as the fourth risk factor that contributes to the global mortality rate. Further, non-communicable diseases (NCDs) attributable to the lack of physical activity (PA) have become a great challenge to public health [1,2,3]. Thus, the way to prevent NCDs effectively and improve people’s health has attracted global attention. Accordingly, one of the efficient strategies is to encourage PA that can have long-term benefits by preventing obesity, hypertension, cancers and other NCDs and improving the quality of life [4,5,6,7,8,9]. Considerable evidence has shown the association between PA and the built environment according to the social ecology model. Hence, the built environment’s potential as a determinant of PA and its ability to influence the positive effects of PA is recognized more widely [10,11,12,13].
From the perspective of public health, physical activity spaces (PAS) such as stadiums, gymnasiums, sports parks, etc., are of great significance because of PA’s health benefits [14,15]. Some scholars have also associated PAS with “leisure” and “vitality”, deriving concepts such as leisure PAS or vibrant PAS, emphasizing the quality, attractiveness and vitality of space [16,17]. In particular, when the PAS are located close to or within the urban green spaces (UGS), it not only provides a comfortable environment for residents to exercise, but also offers more valuable health benefits, including emotional improvements, increased happiness and self-esteem and reductions in stress and anxiety through fresh air and exposure to nature [18,19,20,21,22]. The close proximity of PAS to UGS has been achieved in Germany, Britain and other countries, but China’s spatial planning continues to give less attention to the synergy of PAS and UGS in promoting PA [23,24]. In the transformation from scale expansion to new urbanization represented by livable construction in cities in China, the unbalanced distribution of PAS has made users less willing to visit these areas to engage in PA and has led some spaces to lose vitality and serviceability [25,26,27,28,29]. Therefore, improving spatial health benefits by optimizing location is needed urgently [30,31].
Spatial location optimization refers to the location of several objects within a certain geographical space to maximize their individual benefits and is now used widely in emergency, medical, disaster prevention and other studies [32,33,34,35,36,37,38]. Most of these are based upon using GIS location-allocation models to choose a site’s location by optimizing accessibility and response time [30,39]. However, PAS planning is a multi-objective problem that is difficult to solve with a simple mathematical model because objectives conflict with each other. Therefore, quantitative and intelligent methods are essential to optimize PAS location [40,41,42,43,44,45,46].
If no value of one objective function can be improved without degrading some of the other objectives, it is called Pareto optimal solution. Heuristic algorithms are used to optimize location because of their powerful spatial search capability and computational efficiency. Among them, multi-objective particle swarm optimization (MOPSO) has been recognized widely as a superior method to solve multi-objective problems in various applications [47,48,49,50,51,52]. MOPSO is an objective vector composed of multiple functions and the set of Pareto non-dominated solutions is obtained by spatial search and Pareto dominance relation screening. This feature makes MOPSO a very attractive method to identify optimal solutions in a multi-objective environment. Given the advantages above, MOPSO is applied widely to the category of facilities that reduce disasters or risks and improve land-use efficiency [51,53,54]. However, none of these MOPSO-based multi-objective optimization models have been used yet in planning PAS’ locations.
Therefore, in this paper, multi-objective location models based upon MOPSO are presented for urban PAS planning. From the perspective of promoting PA, factors such as coordinated development of PAS and UGS, accessibility and spatial service efficiency were considered. MOPSO was developed to take three incommensurable objectives functions into account: (1) minimizing the distances from PAS to UGS, (2) minimizing the distances from PAS to communities and (3) maximizing the population within the PAS’ service area. MOPSO was coded by Matlab. Taking Gongshu District, Hangzhou City as an example, the experiments on the MOPSO-based multi-objective optimization model for PAS location described in this study demonstrate this approach’s effectiveness in spatial planning and multi-objective decision-making.

2. Literature Review

2.1. Multi-Objective Location Optimization

In 1929, Weber (1929) [55] proposed the facility location problem, which marked the entry of location optimization into scientific research. Optimizing public service facility location has experienced initial, quantitative, humanistic and diversified eras [42,55,56,57,58,59,60]. Optimizing location can be complex when different objectives are involved [61], but optimization that considers multiple objectives can provide the decision-maker with deep insight into the characteristics of the problem based upon benefits and planning preferences before a final solution is chosen [56,58,62,63]. Therefore, since the mid-1990s, many scholars have promoted the study of location optimization more systematically and synthetically and discussed it from multi-objective, multi-level and multi-attribute perspectives. With respect to the way to achieve the optimization objectives, Current et al. (1990) [64] proposed four objectives: (1) minimum cost; (2) demand orientation; (3) maximum profit and (4) environmental concern. From the perspective of economics, Bellettini et al. (2013) [65] suggested that the optimal decision of where to locate a facility depends upon the variables of distance and demand. In addition, the objectives also include minimizing travel time, efficiency and land use.
Scholars have discussed in depth the methods and models used to solve location optimization problems in combination with social, economic, humanistic and ecological objectives. Batta et al. (2014) [66] developed the p-median model to optimize the location of facilities by considering dispersion, demand and equity. Cho (1998) [32] proposed a trade-off model for medical care facilities’ location problems that considered equity and efficiency. Drezner et al. (2007) [67] expanded the approaches to solve location and integration problems with complex conditions using gravity P-median model. Farahani et al. (2010) [36] detailed a multi-objective location solution approach. China’s scholars have studied the solution to multi-objective location optimization problems from different perspectives and solved certain practical problems [38,68]. Chen et al. (2006) [37] established evaluation criteria to select location that take into account both efficiency and equity. Liu et al. (2010) [68] proposed the ideal decision-making process of “search first, a decision later” and applied Pareto multi-objective genetic algorithm to optimize facilities. The PAS location is optimized by predicting future demand, planning a “PA circle” and feasibility analysis in many existing studies [69,70,71].

2.2. MOPSO-Based Location Optimization

MOPSO is an evolutionary heuristic algorithm that imitates the cognitive and social behavior of birds flocking. It has the advantages of simple parameter setting, fast computing speed and strong global search ability [72,73]. Coello proposed MOPSO first in 2004. Thereafter, many scholars improved it by adding particle memory [74], the chaos algorithm [48] and local search [49], as well as crowding distance and a mutation mechanism [73] to compensate for some defects in the algorithm.
A Pareto solution set of facility locations solved with MOPSO has been used in spatial decision-making plans in existing studies. Uno et al. (2007) [50] minimized the total travel distance and wait time to solve a multi-objective MOPSO model. Çakmak et al. (2021) and Mohammadi et al. (2016) [40,47] presented an improved MOPSO model to address the location problem under a complex layout. ElKady et al. (2015) [41] used MOPSO to maximize facilities’ coverage in terms of residents’ demands, service area, expanding the application scenarios and optimizing performance. Li et al. (2008) [75] explored facilities’ location and shape using MOPSO combined with the shape variation algorithm. Du et al. (2006), Zeng et al. (2010) and Tao et al. (2015) [76,77,78] combined algorithms and GIS to improve the spatial optimization decisions’ effectiveness. They confirmed that the MOPSO’s application in location optimization is significant and helps improve facilities’ spatial service efficiency [46,52].

3. Data and Methods

3.1. Study Area

Gongshu District is one of the main districts of Hangzhou City and is located in the north-central area of the city. The district’s total area is 119 square kilometers. It is comprised of 18 neighborhoods and 174 communities and has a population of approximately 1.12 million. Figure 1 shows a map of the Gongshu District that depicts the community boundaries. The reasons why we choose Gongshu District as the study area are: (1) it has a stable population, which can reflect the demand accurately; (2) there are various types of PAS, but their spatial distribution is not balanced and (3) the distribution of PAS and UGS has serious spatial differences, such that it is necessary to improve PAS efficiency through location optimization.

3.2. Data

Four different datasets, population distribution, land use patterns, UGS and the PAS distribution of Gongshu District, are used to execute the model. These datasets were collected from a variety of sources. Population data in 2020 were collected from the world population website. Land use data of Hangzhou City in 2018 derived from Hangzhou Land Bureau. The administrative boundary and road network data were collected from the OpenStreetMap website. PAS data were taken from the OpenStreetMap website and Zhejiang PAS public service platform website.
Then, we process these data: firstly, we use the natural discontinuity grading method to visualize the population. By querying the latest population data of the Zhejiang Government Service network and Gongshu district government website, we revise and perfect the results to obtain a population with high reliability. Secondly, based upon UGS data, we combine maps and field surveys to calibrate spatial location and area. According to the Plan of PAS in Hangzhou (2019–2035), the neighborhood PAS must be combined with UGS within a 15-min living circle. Further, according to the Urban Residential Area Planning and Design Standard, the minimum size of UGS in a 15-min living circle is 5 hectares and it is stipulated that 10% to 15% of the land is used for PA. To coordinate the size of the PAS and UGS distributed nearby, the UGS with an area of more than 5 hectares were taken as the basic data. Thirdly, we selected PAS suitable for 3–6 METs of moderate and >6 METs of vigorous PA based upon the PA intensity classification, including large stadiums, community fitness sites, courts, etc.

3.3. Methods

3.3.1. MOPSO

Supposing that n particles fly in the D-dimension space, xi = (xi1,xi2,…,xiD) is the particle’s current position; vi = (vi1,vi2,…,viD) is current velocity; pi = (pi1,pi2,…,piD) is each particle’s best position in history and pg = (pg1,pg2,…,pgD) is the best position that the particle swarm has reached. Each particle in MOPSO maintains its position, velocity and fitness value, computed through the fitness function’s iteration. The particle’s position represents a solution in the search space. The velocity, including speed and direction, can determine the particle’s position in the next moment. The process can be regarded as “self-learning” and “social learning”. The particles fly to the next position based upon the individuals and the swarm’s experiences. Particles update their velocity (v) and position (x) by the following Equations [79]:
v i d k + 1 = w v i d k + c 1 r 1 ( p i d x i d k ) + c 2 r 2 ( p g d x i d k )
x i d k + 1 = x i d k + v i d k
in which i = 1,2, nPop, d = 1,2,…,D, pid is the best position that the particle has reached in history, pgd is the best position that the swarm has reached in history, k is the number of iterations, c1 and c2 are acceleration constants, r1 and r2 are independent random numbers between [0,1] and w is the inertia weight; the formula is as follows:
w = w max w max w min I max t
where wmax is the initial inertia weight, wmin is the inertia weight at the end, t is the current number of iterations and Imax is the total number of iterations. In this study, wmax = 0.9, wmin = 0.
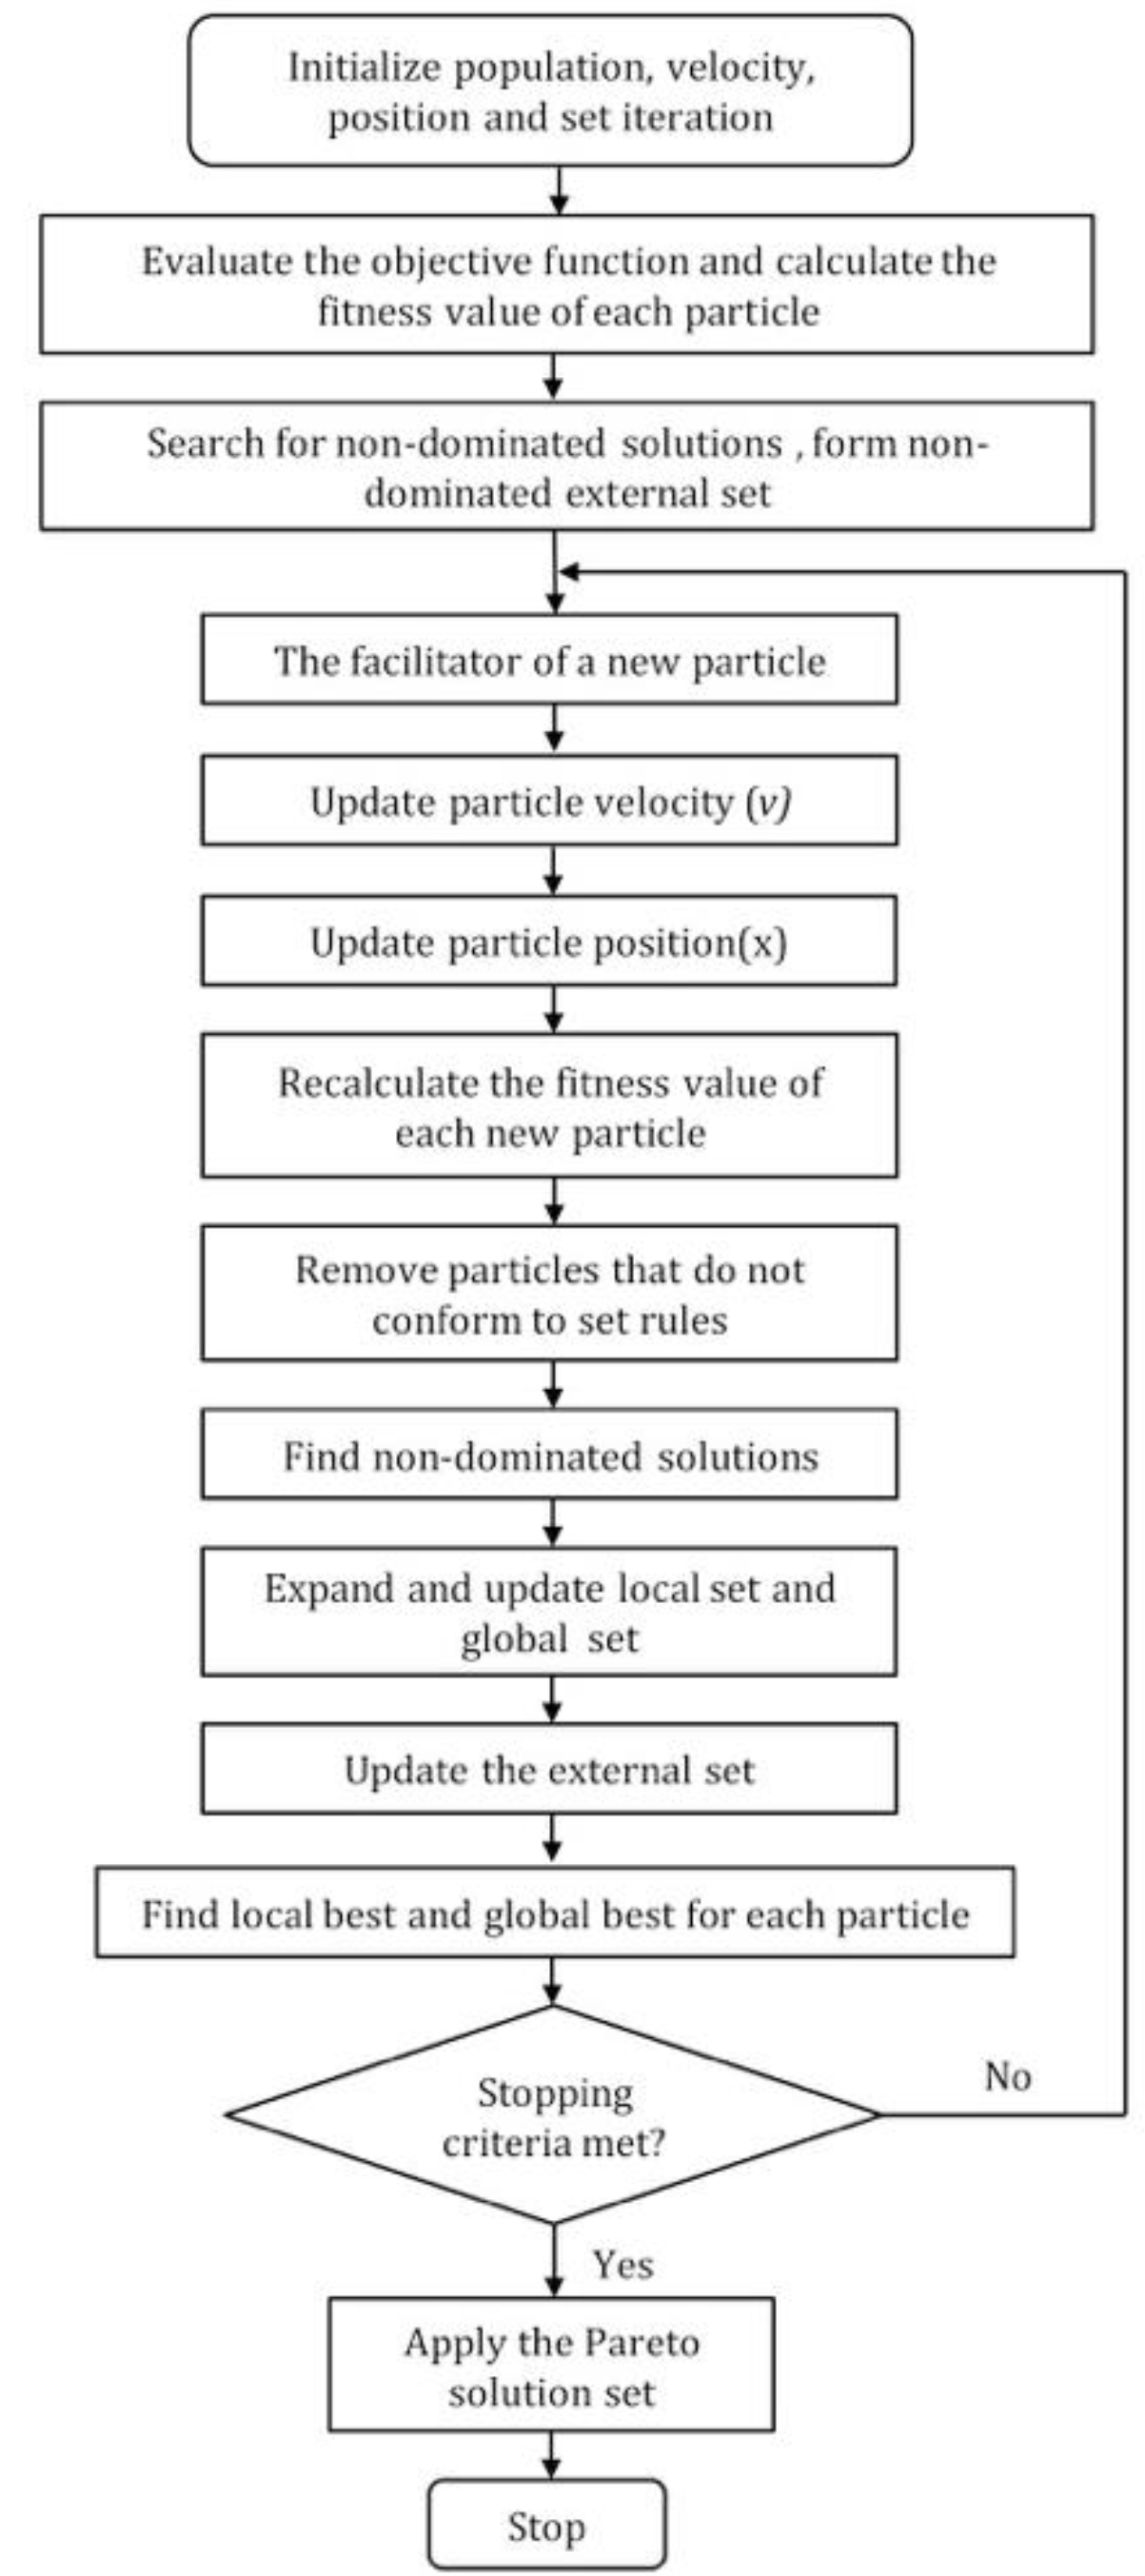
The algorithm flowchart of MOPSO is as follows (Figure 2):

3.3.2. Optimization Objectives

We consulted government departments in Gongshu District through telephone interviews. Compared with the city, district and community levels, the current number of PAS at neighborhood level is insufficient. The government plans to build seven neighborhood level PAS by the end of 2025. We developed a multi-objective optimization of PAS model (MOPAS) based on three optimization objectives:
Objective 1: The distance between PAS and UGS. The distance between PAS and UGS affects the health benefits of the space. Minimizing the total distance from UGS to the PAS can promote the coordination of PA space:
f 1 = min k = 1 u i = 1 m D i s i k
in which i is the set of PAS’ locations, m is the number of PAS, k is UGS, u is the number of UGS and Disik is the Euclidean distance between the PAS and UGS, i = 1,2,…,m, k = 1,2,…,u.
Objective 2: The PAS’ accessibility. Travel distance is one of the metrics used most widely to select locations. Minimizing the total distance from the demand locations to the PAS can save time:
f 2 = min i = 1 m j = 1 n D i s i j
in which j is community, n is the number of communities and Disij is the Euclidean distance between the PAS and communities, i = 1,2,…,m, j = 1,2,…,n.
Objective 3: Service population coverage. This represents the equity in the use of PAS. Maximizing the number of people covered within a 1 km service area of PAS is conducive to improving the health facility’s efficiency:
f 3 = max i = 1 m j = 1 n x i j P e o i j
in which xij represents whether the community j is serviced by PAS i and Peoij is the population the PAS serves.
To evaluate the location optimization under the combination of objectives and solve the complex problem of multi-objective decision-making, the MOPSO is used to integrate the three optimization objectives:
F = min f 1 , min f 2 , max f 3
The values of f1 and f2 calculated are too large. To compare the difference in the functions’ values better, we take the average of their values as the final result, i.e., there are m PAS and u UGS in the algorithm operation process such that f1 = f1/(m*u), f2 = f2/(m*n).

3.3.3. Constraints

First, the distance between any PAS through location optimization is farther than 1000 m: Disi(a,b) ≥ 1000; second, the distance between the optimized PAS and the current city or district-level PAS is farther than 1000 m: Disir ≥ 1000; third, it can provide services for the community or residents within 1 km of the PAS:
j = 1 n x i j 1 ;   x i j = 0 , 1 .
in which Disi(a,b) is the Euclidean distance between which any two PAS would be located, r is the current city or district-level PAS, Disir is the Euclidean distance between the PAS located and current PAS; xij = 1 indicates that within the 1 km service range, the community j is served by PAS i, otherwise it is 0, and n is the number of communities.

3.3.4. Parameter Settings

In MOPSO, the parameters have a great influence on the ability to optimize the algorithm and are set as shown in Table 1.
The number of particles: each particle represents a location solution and the number of particles affects the algorithm process directly. For the more complex multi-objective location problem, the number of particles is set to 100–200.
External particles number: the iterations of the algorithm produce the Pareto solutions in the Rep external document, which represent the number of optimal location solutions. Too many solutions are not conducive to identifying the optimal solution and too few make it difficult to compare different solutions’ advantages and disadvantages. To analyze the solutions’ characteristics in depth and provide decision-makers with diverse preferences, nRep is set to 4. Four non-dominant site selection optimization schemes were generated after the code was run, i.e., the algorithm is run once to produce four non-dominated location solutions.
The grid number: this represents the number of PAS’ locations in a solution. We set nGrid to 7 based upon the premise that the government will complete seven neighborhood-level PAS in the Gongshu District by the end of 2025.
Acceleration constants: the values of acceleration constants determine individual historical information and swarm historical information’s influence on particle flight. They reflect the acceleration weights of flying to optimal individual and swarm positions. If c1 = 0, the particle falls easily into local optimization; if c2 = 0, it is difficult to find the global optimal solution. Previous studies have shown that the selection of c1 and c2 should satisfy c1 + c2 ≤ 4 and a good initial value is c1 = c2 = 2.
Maximum flight range, maximum velocity: the flight range is limited to the Gongshu District. The particle’s flight range in the X dimension is (Xmin, Xmax) and in the Y dimension is (Ymin, Ymax). The particle updates its position by adjusting its velocity in each dimension. If the velocity is too high, the particles’ flight behavior will exceed the solution space. Therefore, a maximum velocity is set to ensure an effective search. The maximum velocity is given by 10–20% of the distance of the X and Y dimension that particles have searched thus far [80].
The particles’ initial positions are distributed evenly in the search space as much as possible. The initial positions are given by Equation (7):
X i a = R a n d * W + X min Y i a = R a n d * H + Y min
in which Xia and Yia are the X and Y coordinates of the ith particle, ath PAS, Rand is an independent random number between [0,1], Xmin and Ymin are minimum values of X and Y dimensions and W and H are the width and height of X, Y dimensional spaces.
The initial velocity is given by the Equation (8).
v X i a = R a n d * v X max v Y i a = R a n d * v Y max
in which vXia and vYia are the velocity of the ith particle, ath PAS’ X and Y dimensions and vXmax and vYmax are the maximum velocities of the X and Y dimensions.
Particle flight space dimension: each of the PAS’ location is determined by X and Y coordinates. When the number of PAS optimized for location is 7, the ith particle’s position is (Xi1, Yi1,…, Xi7, Yi7), which indicates that the particle is searching in the 14 spaces’ dimensions.

4. Results

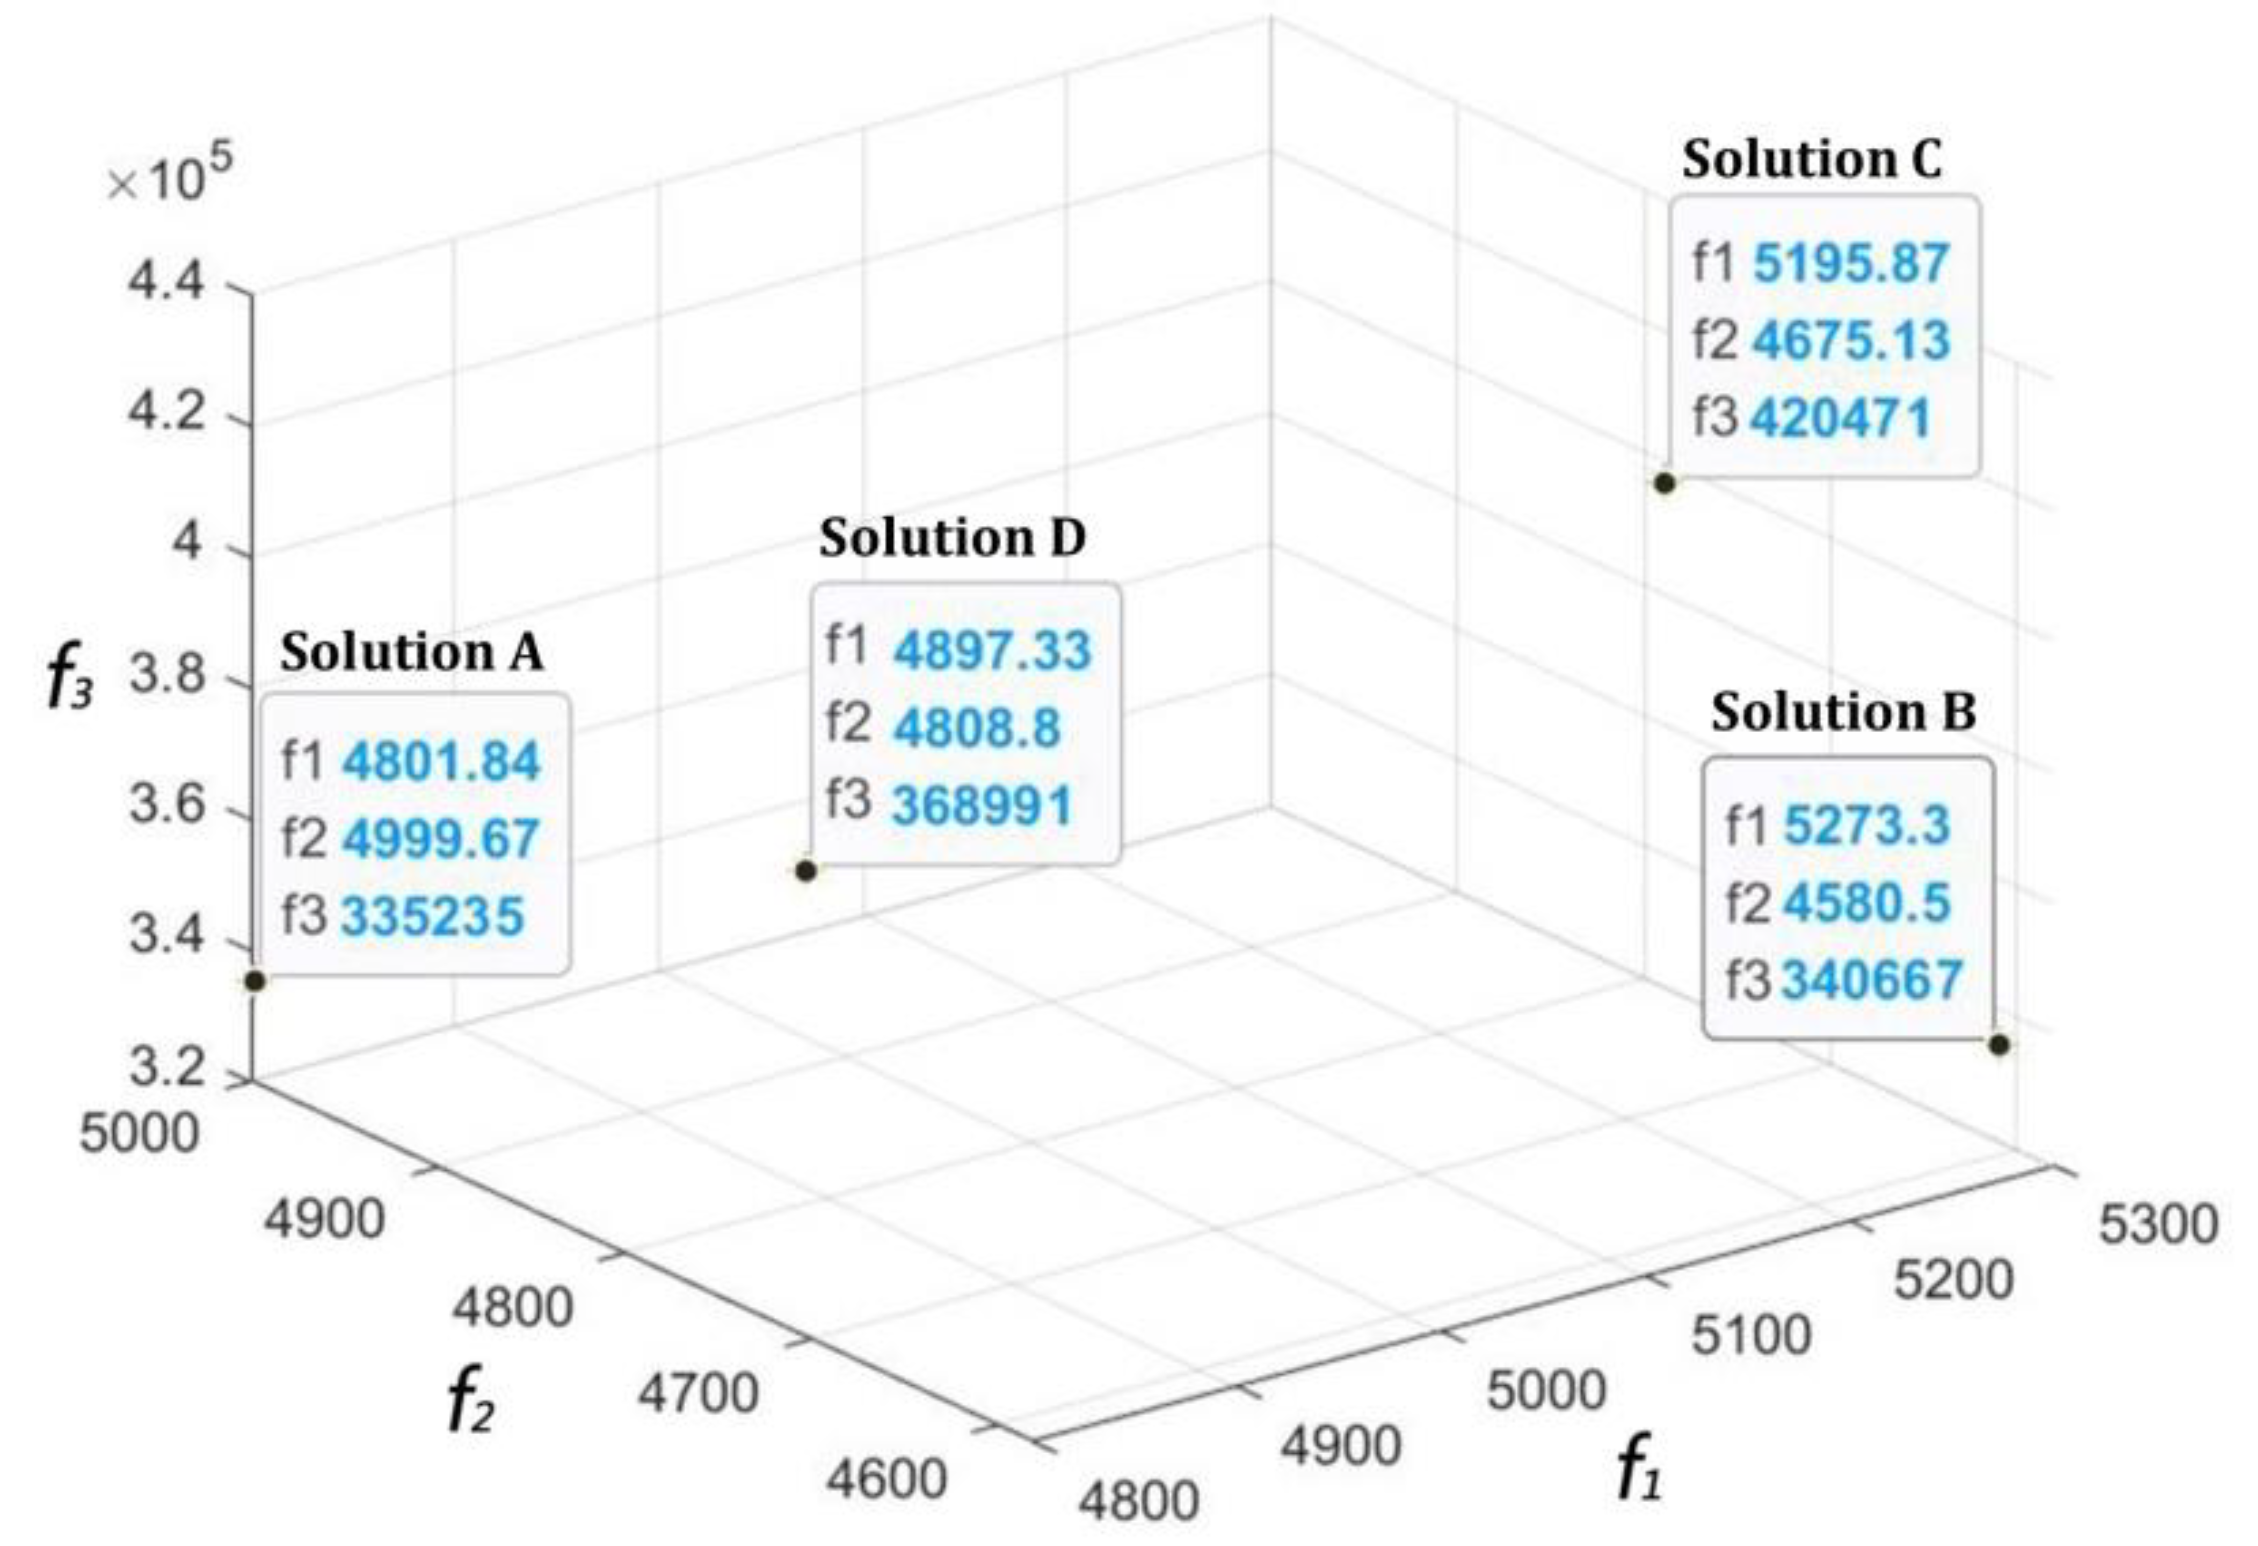
Given the tradeoffs between distance to UGS, the PAS’ accessibility and its service efficiency, the MOPAS model produces a series of Pareto optimal solutions. The four best Pareto optimal solutions A, B, C and D are reported in Figure 3 and the fitness values of Existing Configuration and Pareto optimal solutions are illustrated in Figure 4. In terms of the current PAS configuration, the average distance between the PAS and UGS is 6144.34 m, the average distance between PAS and the communities is 4307.61 m and the population serviced within 1 km is 301,678 people. Compared with the current PAS allocation, the fitness values of f1 and f3 of the solutions are better than current situation. This means the Pareto optimal solutions would make PAS and UGS closer and improve the PAS’ service capacity. However, for objective 2, minimizing the distance between PAS and communities, the existing configuration of PAS is better than the Pareto optimal solutions. This suggests that the existing configuration focuses on the accessibility and ignores or fails to make a tradeoff between the other objectives.
Solution A achieves the minimum distance between PAS and UGS in the last generation, which has the best fitness value of f1, in that f1 = 4801.84 m. Solution B achieves the minimum distance of PAS and communities and its f2 = 4580.50 m. Solution C has the maximum value of the population covered and its f3 = 420,471, such that the number of people served within 1 km is 118,793 more than that for PAS with the existing configuration. This solution maximizes the efficiency and equity of space service. Solution D is the average optimal solution calculated by finding a balance of the three objectives. The average distance between the PAS and UGS decreases to 4897.33 m, while the average distance to the communities increases to 4808.80 m. The number of people served within walking distance increases to 368,991. The solution D improves objectives 1 and 3, but at the cost of reducing the residents’ accessibility to the PAS.
Obviously, the best outcome for each objective is achieved in different optimization solutions, suggesting that all of these objectives are conflicting and no solution can obtain the best value for all of the objectives. Even if the best solution for one objective can be obtained, it must come at the cost of diminishing at least certain other objectives. Thus, it also verifies the effective application of the MOPSO in solving multi-objective location optimization problems.
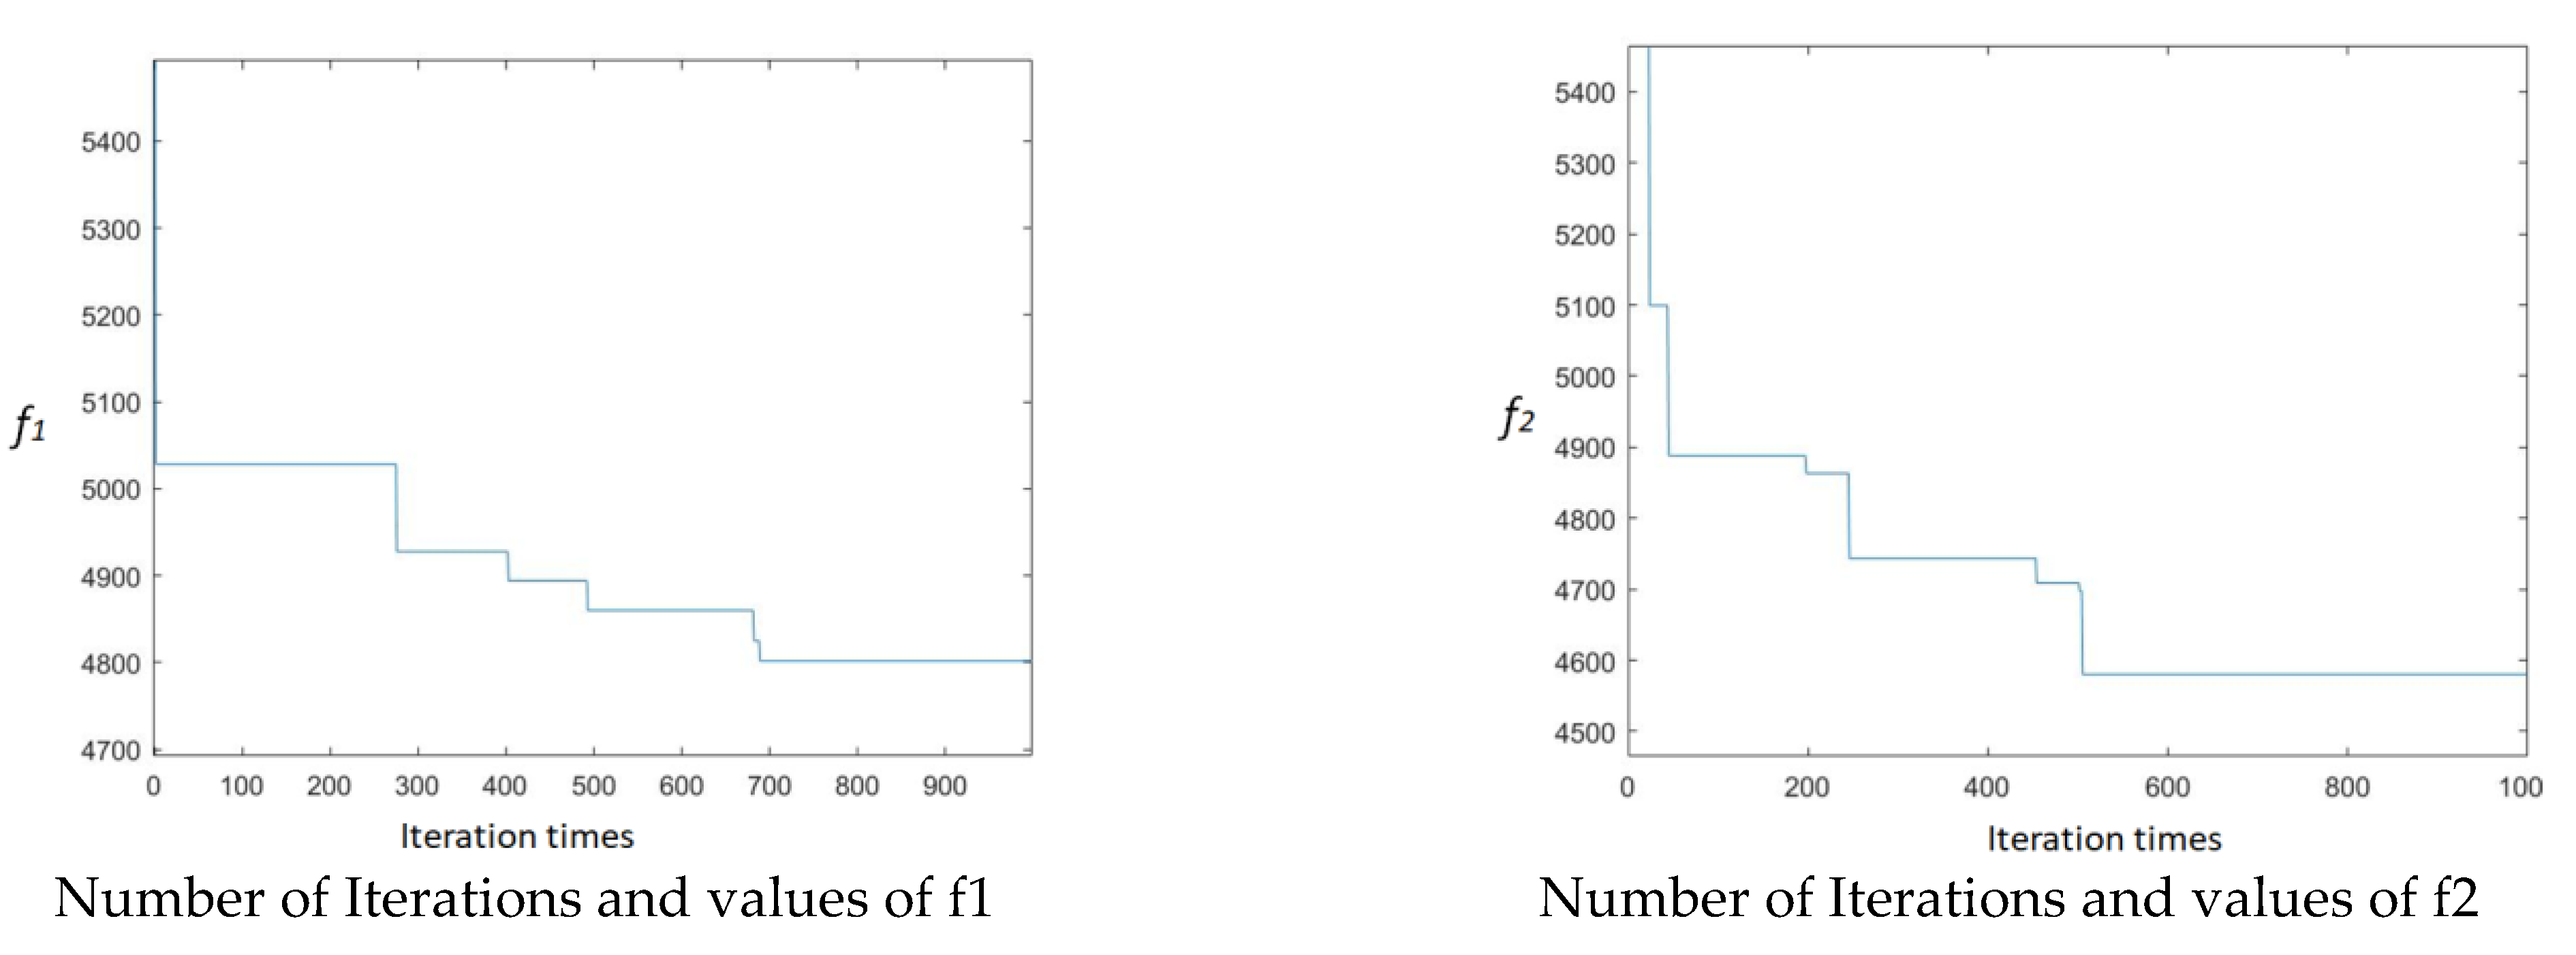
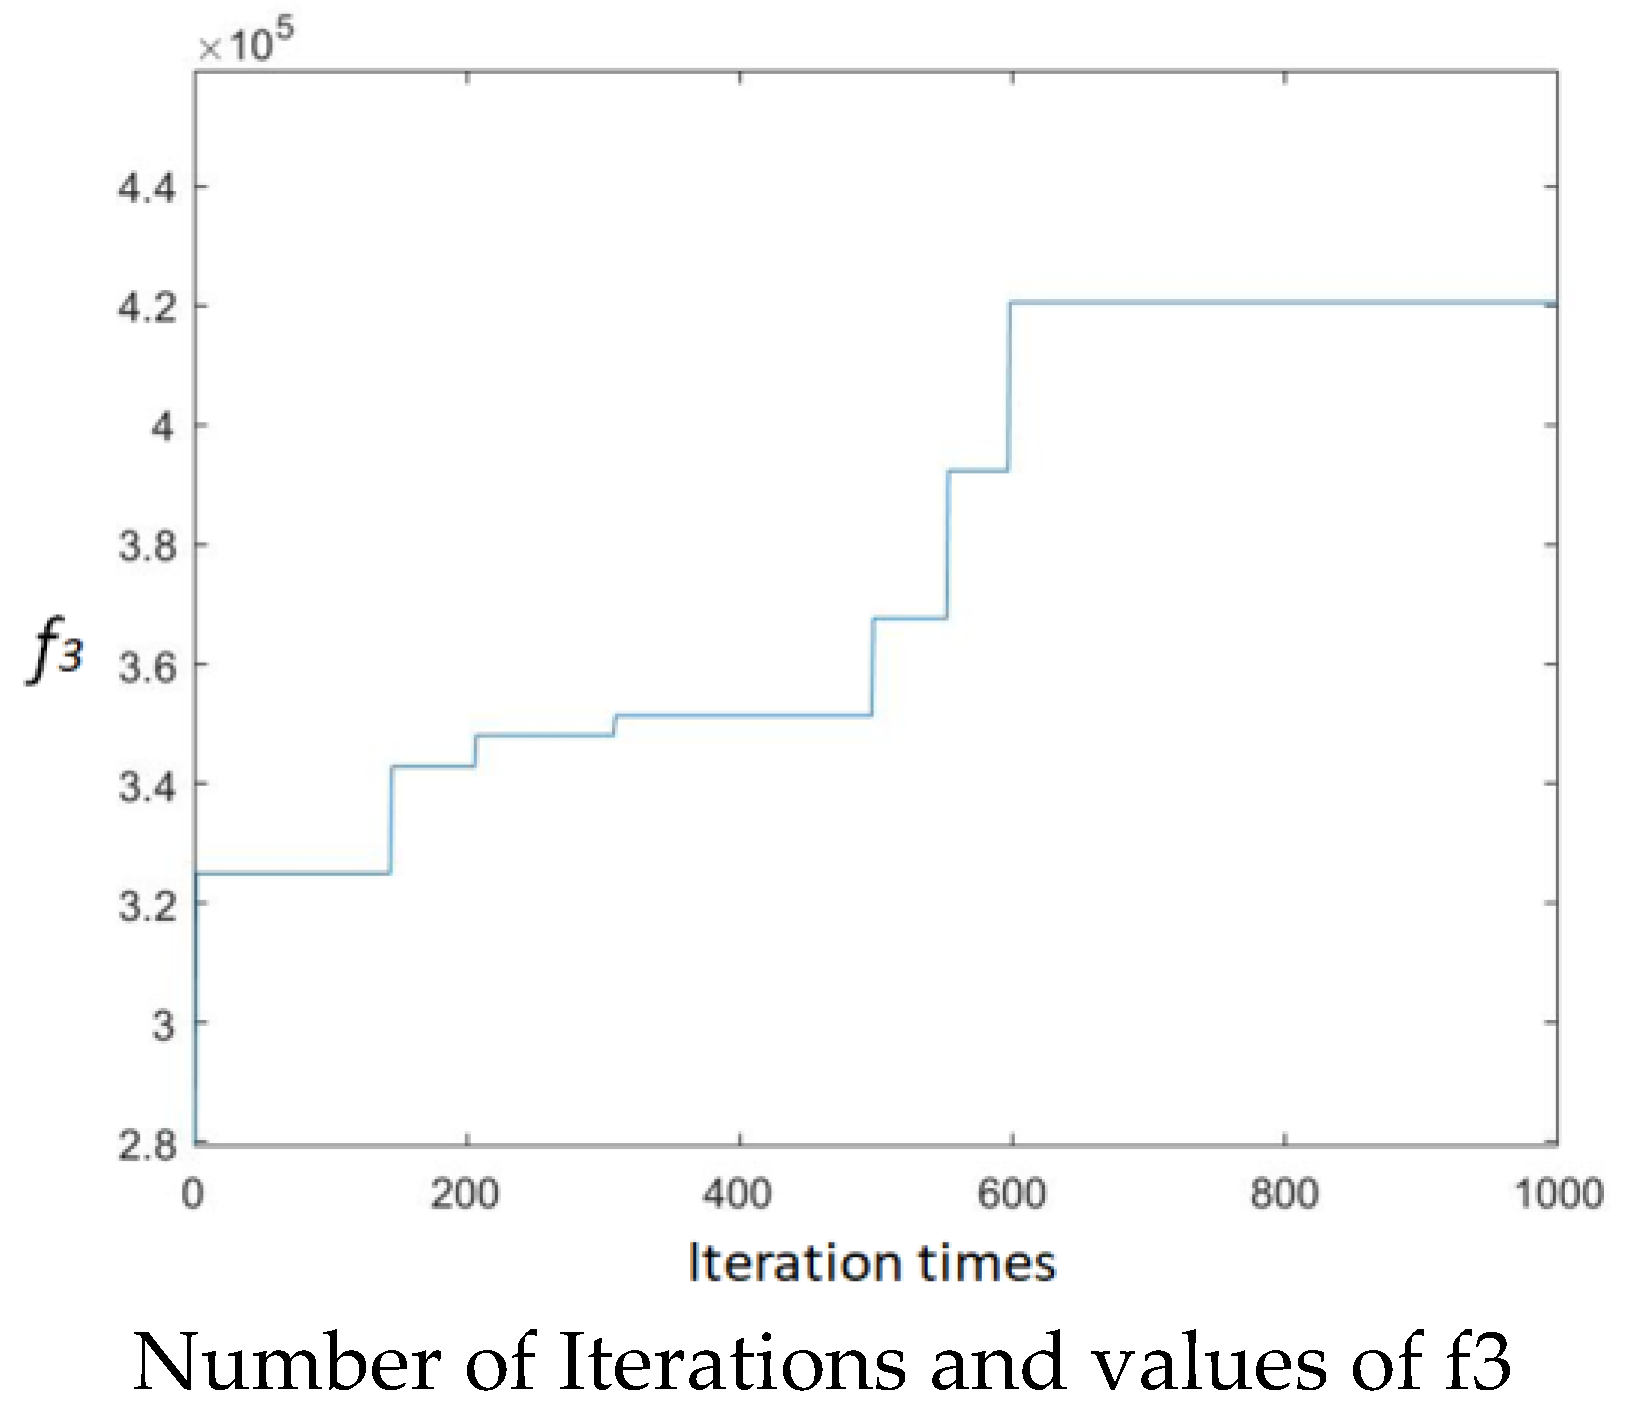
Figure 5 shows the relation between the iterations and function values. The value of f1 tends to be stable at 700 iterations, that of f2 at approximately 500 iterations and f f3 at approximately 620 iterations. This indicates that the functions’ fitness value reaches a stable state after 1000 iterations of the algorithm and the location optimization result after the algorithm is accurate.

5. Discussion

5.1. Spatial Distance between the Planned PAS and the Existing PAS

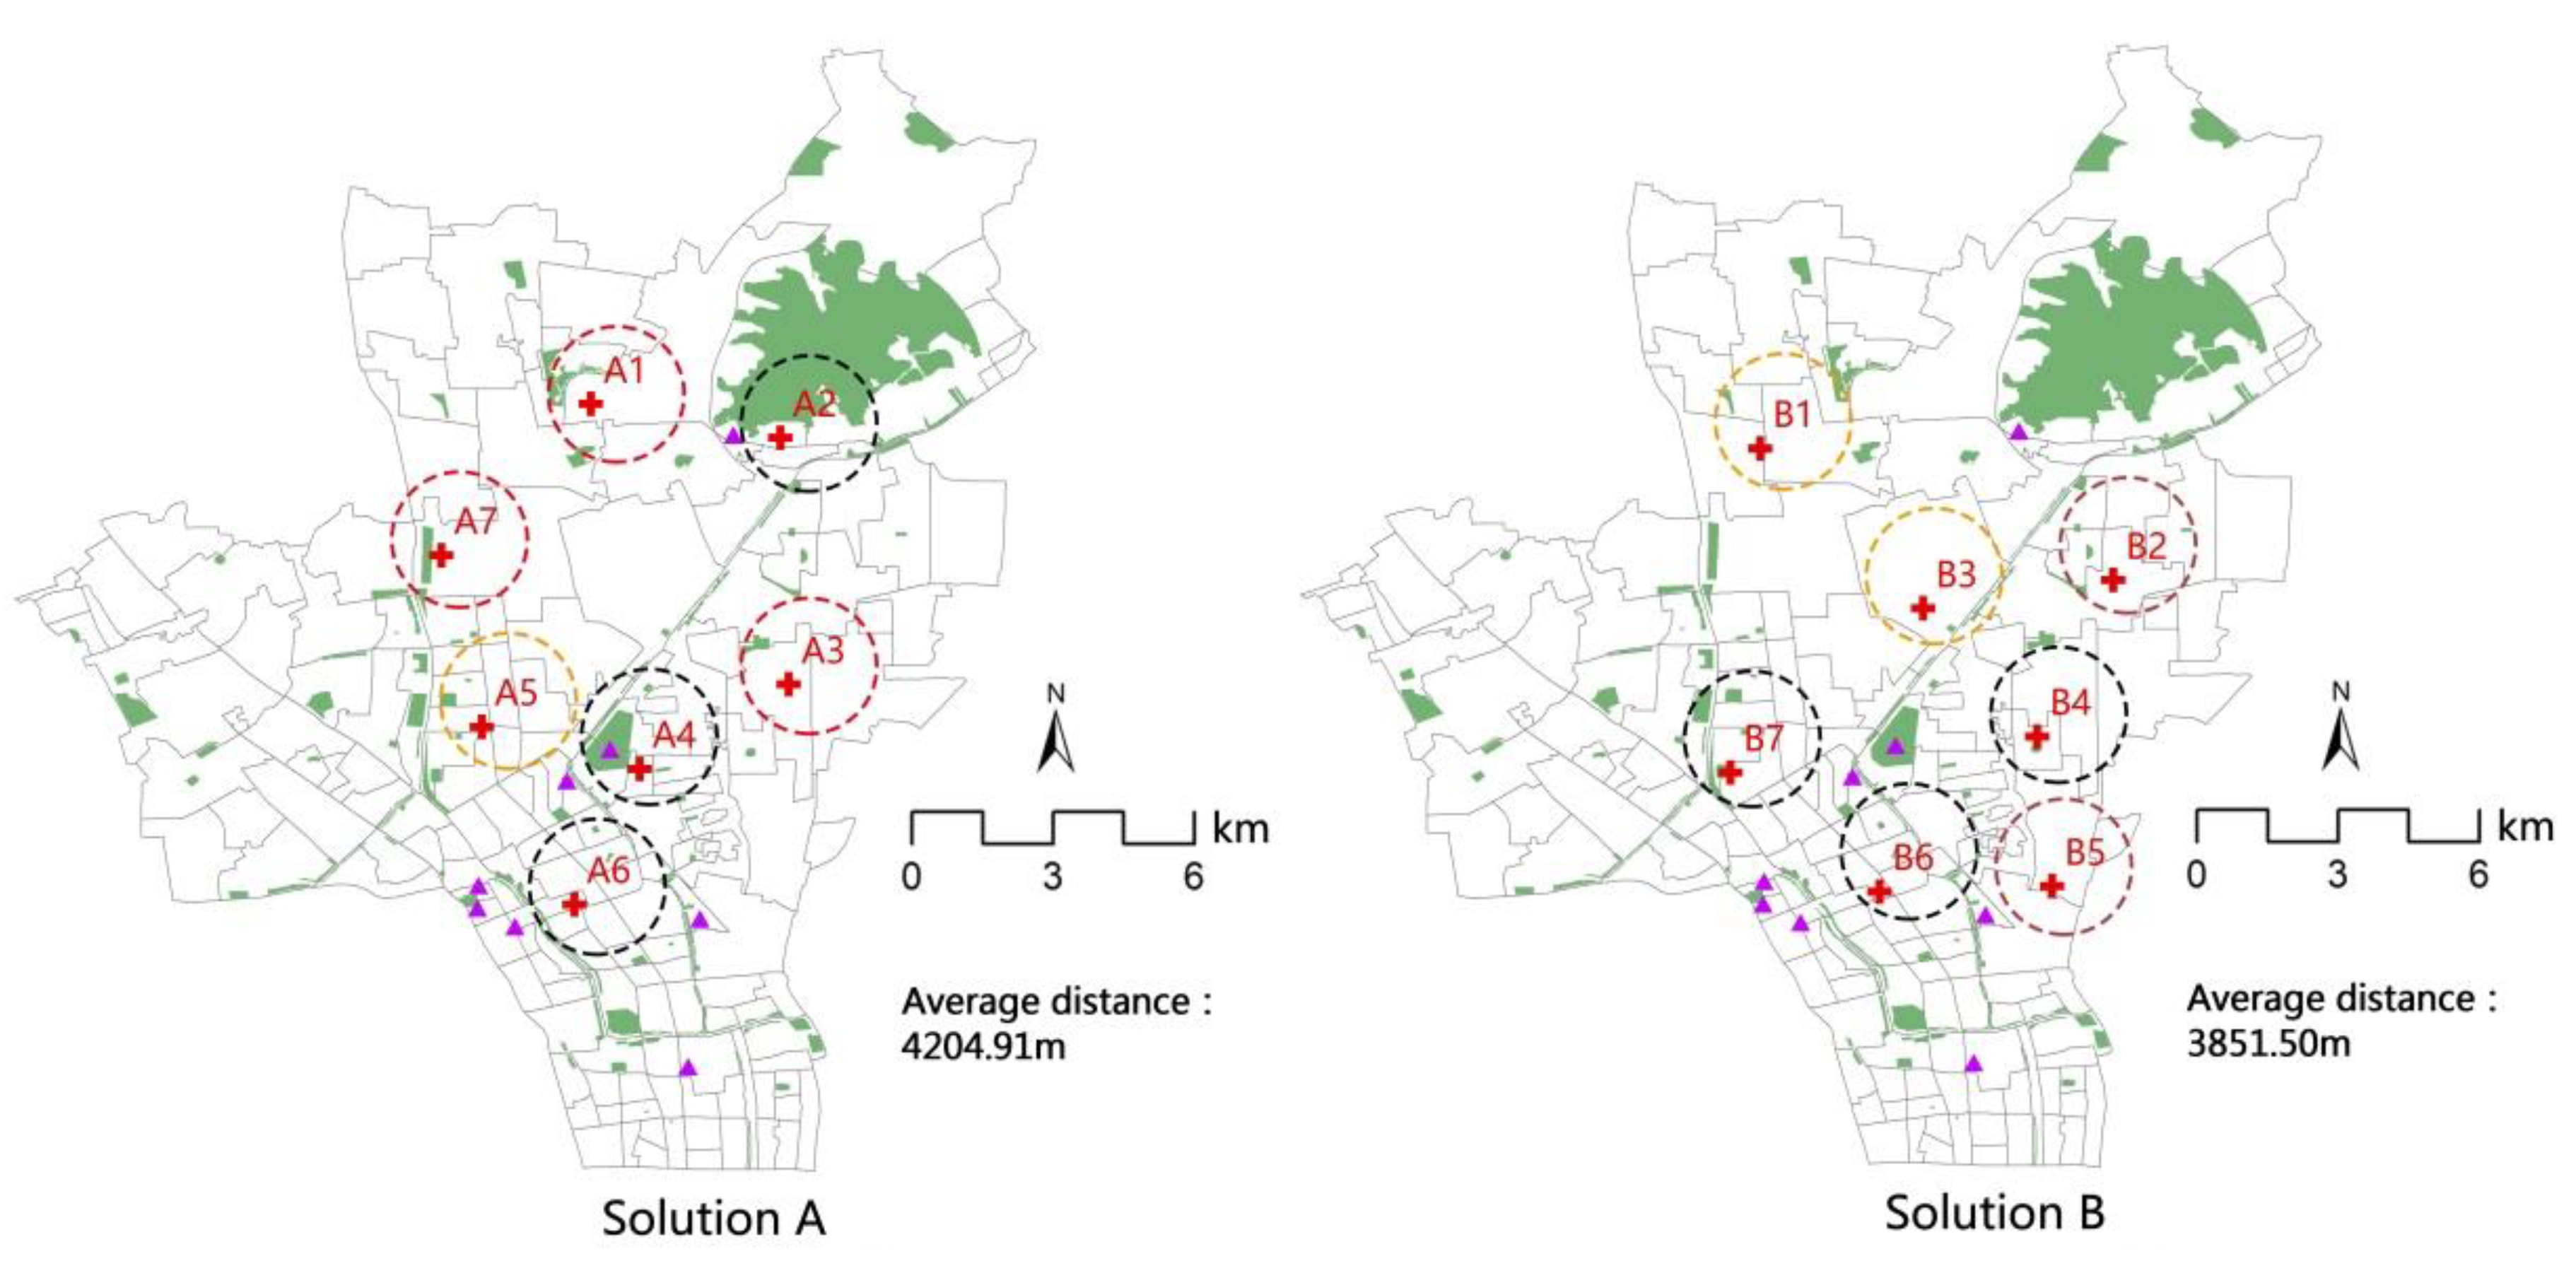
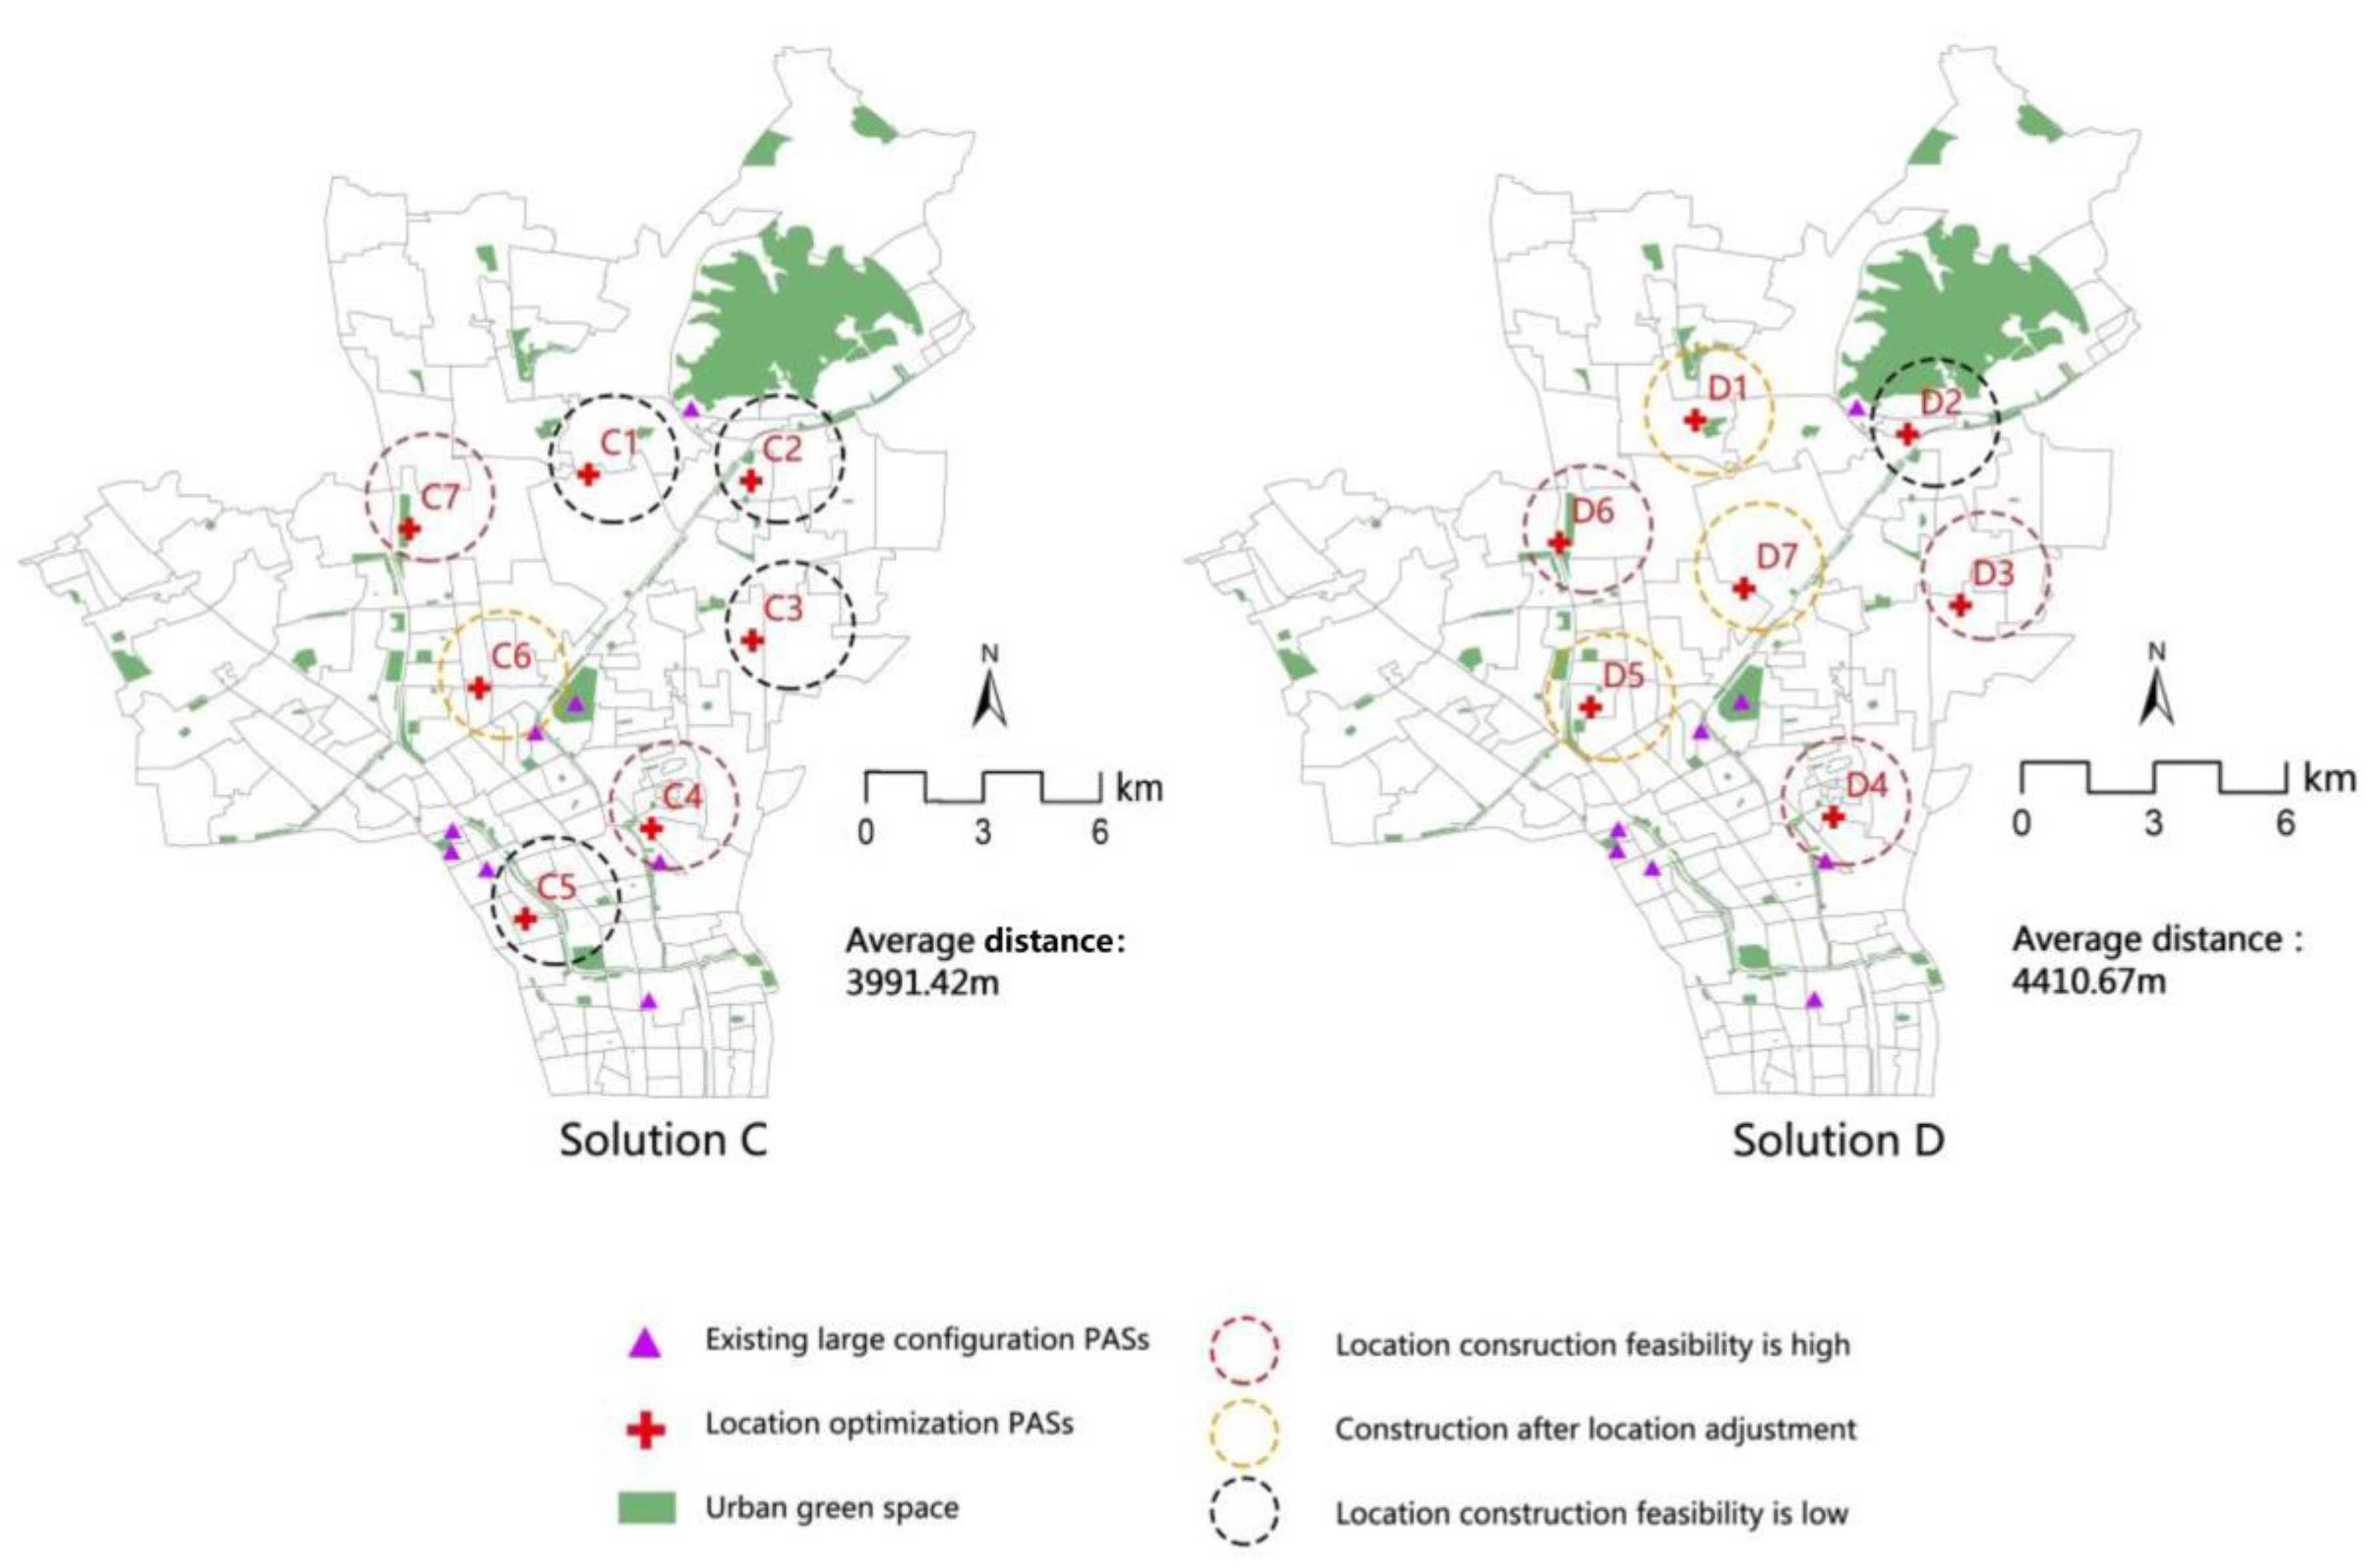
Most of the existing large PAS are concentrated in the south of the Gongshu District and only one is located in the north. The spatial distance is the average distance between the new allocated PAS and the existing PAS (Figure 6). A larger value indicates a more balanced and rational spatial distribution. The average distances from solution A to D are 4204.91 m, 3851.50 m, 3991.42 m and 4410.67 m, respectively.
The spatial distribution is objective-oriented. The PAS’ locations in solution A are close to the large scale UGS in the central-northern area of Gongshu District, i.e., the Banshan Forest Park, the Ducheng Ecological Park, the Sports Park and the waterfront space along the Grand Canal. Most of the PAS located are far away from the existing PAS in the south and are more evenly distributed. Solutions B and C take residents’ demand as the dominant goal and the locations overall are moved to the southern communities with high population density. These two solutions increase residents’ access to PAS, but the locations are closer to the existing PAS. This solution may lead to an uneven distribution. Compared to other solutions, solution D has the highest spatial distance, which means PAS is the most evenly distributed.

5.2. Implementation Feasibility

Feasibility analysis helps promote the organization and evaluation of the implementation of PAS. The land use types with high construction feasibility are generally industrial wasteland, vacant land and demolition land, which are easier to convert. If no land is available or the on-site land is difficult to change, the available land around can be considered instead. In this scenario, it is suggested to change the locations to the surrounding vacant land that can be built within 300 m, which will reduce the fitness value of the optimization objectives to a certain extent, but improve the feasibility of implementation and land use efficiency. Most of the locations with low feasibility are located in newly built residential areas, public service buildings and urban roads that have large development densities. There is also a lack of land and vacant land available nearby, which makes it difficult to build new PAS.
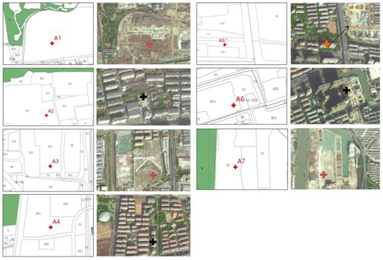
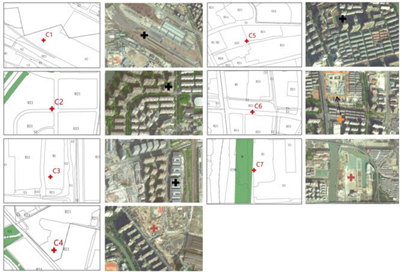
A comparative analysis of the construction feasibility of the locations in the four solutions can be used to assess the advantages and disadvantages of the solutions. Figure 6 illustrates the spatial distribution of locations allocated and Table 2 lists the land use conditions and feasibility analysis of all locations. For solutions A, A1, A3 and A7 are located in the abandoned land, factory demolition land and vacant land, respectively, with higher construction feasibility; A5 is in a plot with a new building, but there is industrial land 300m northeast of it that can be used. Solutions A2, A4 and A6 are located in a new residential area. It is difficult to add new buildings and there is no land available nearby.
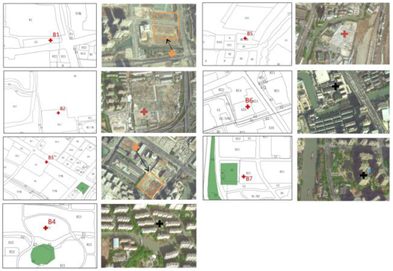
For solutions B, B2 and B5 are in abandoned vacant land with high construction feasibility. B1 and B3 are located in UGS and cultural buildings, but vacant land within 300 m is available. The construction feasibility of B4, B6 and B7 is low.
In solution C, the locations of C4 and C7 are feasible. C6 is located on a road and the northern industrial land can be considered for construction. However, most of the locations in this solution are not feasible for construction. C1, C2, C3 and C5 are located in the green buffer, consisting of newly built residential buildings, new industry and schools, respectively. There is little construction land nearby, which makes it difficult to settle the locations.
Solution D is the most feasible, as among them, only D2 has low construction feasibility. D3, D4 and D6 can be converted directly into land for construction. Although D1, D5 and D7 are located on roads and residential buildings, the locations can be moved to nearby vacant land and industrial land for construction.
If it is difficult to procure land during the construction, we can reproduce the resource by making private spaces public, such as multiple plots in areas with high density that can form public space jointly, or by clarifying the spatial rights, responsibilities and ownership relations to offer a property transfer incentive to obtain public space to use [81]. Overall, most of the locations in the southern part of solution A and B face problems such as high construction density, which make it difficult to implement the construction of PAS. Solution C has the lowest construction feasibility, while solution D is the most feasible.

5.3. Optimization Trade-Offs and Optimal Solutions

Previous research on PAS location optimization is mainly based on the accessibility assessment or population coverage. The reason why single indicator is often suboptimal is that they ignore the tradeoffs among multiple objectives. Our results indicate clear trade-offs among the three objectives, meaning that the optimization of one objective is at the cost of anther. Given that the proximity of PAS to UGS is at the core of our concerns, the results indicate that including this objective can lead to a decrease in accessibility to a certain extent; while focusing on accessibility is likely to be suboptimal for population coverage and approximate to UGS. Therefore, our trade-off analysis implies that one objective should not be used as surrogate for another. Instead, location optimization of PAS should be based on a range of objectives, which is more likely to optimize locations comprehensively.
With respect to optimization trade-offs, spatial distribution and construction feasibility, all of the locations in solution D show that it is one of the best. Table 3 lists the comprehensive evaluation of the solutions, which indicates that each has its unique advantages and disadvantages. Solutions A and B can be used as alternatives for decision-making, while solution C is not recommended because of its low construction feasibility. Appropriate location solutions should be provided for cities with different resource endowments and the solutions’ practical value also should be verified by factors such as distribution, feasibility, preference and finance. In this way, it will improve the effectiveness of PAS spatial planning.

5.4. Methodology Applications

The goals in the policy and governance fields are diverse and may lead to conflicts, such that trade-offs are necessary to explore more compromise solutions. The multi-objective optimization approach is highly compatible with the multi-objective characteristics of spatial planning. However, multi-objective problems in spatial planning are usually carried out in a subjective or qualitative manner. Facing the complexity of real-world spatial planning and the uncertainty of the future, the limitations of human’s bounded rationality are particularly obvious.
Our research indicates that MOPSO has potential as a useful tool for information on the decisions of location optimization. The study verifies the MOPSO’s effectiveness in spatial planning and multi-objective decision-making. The MOPSO-based model can be readily applied to available empirical datasets, can more easily integrate multidimensional objectives and can provide planners with a set of alternative solutions. The methods applied can be adapted to support multi-objective optimization of PAS in urban planning globally and other empirical analyses and dataset. However, human judgement should not be fully replaced by heuristic algorithm and location optimization decisions should be based on comprehensive considerations and empirical feasibility.

6. Conclusions

Optimizing PAS’ location to ensure health, equity and efficiency is an important planning issue. All solutions constitute a candidate pool for decision-makers. The way to choose the best solution from the pool of these non-dominated Pareto optimal solutions is important for planners or decision-makers. Generally, previous multi-objective optimization research emphasizes the accessibility or population coverage, but less consideration is given to the health benefits of the close proximity of PAS to green spaces, the relationship between planned and current site selections and the implementation feasibility. The innovation of this study lies in providing theoretical support for this information.
Taking Gongshu District, Hangzhou City as an example, this paper proposes MOPSO-based models and illustrates their potential application to the multi-objective PAS location problem. We consider a variety of factors, such as the relation with UGS, the accessibility and spatial services efficiency, which help us finally determine the competing objectives: (1) minimize the distance between PAS and UGS; (2) optimize the accessibility of PAS and (3) maximize the population PAS served. This MOPSO model yields a set of non-dominated Pareto optimum solutions that can be used to determine the most practical tradeoffs between the conflicting objectives. However, the solution with the greatest spatial benefits does not represent the most practical solution. Such factors as the spatial equity and construction feasibility also affect the final decision. Therefore, the study analyzes the construction situation of locations and evaluates the implementation feasibility. Decision-makers need to consider these factors before they select the most appropriate solution. In drawing conclusions based on this work, a few limitations should be considered. It does not separate different types of PAS with different activity intensity so that all the PAS are the same. With respect to the distance, it uses the Euclidean distance rather than the network distance. The residents’ views on the location optimization have not been considered, which may miss additional objectives.

Author Contributions

Conceptualization, F.W.; methodology, F.W. and W.X.; formal analysis, W.X.; writing—original draft preparation, F.W. and W.X.; writing—review and editing, F.W.; visualization, W.X.; funding acquisition, F.W., W.X. and C.H. All authors have read and agreed to the published version of the manuscript.

Funding

This research was supported by Zhejiang Provincial Natural Science Foundation of China under Grant No. LY19E080025 and Scientific Research Fund of Zhejiang Provincial Education Department under Grant No. Y202045580.

Data Availability Statement

The data presented in this study are available on request from the corresponding author.

Conflicts of Interest

The authors declare no conflict of interest. The funders had no role in the design of the study; in the collection, analyses, or interpretation of data; in the writing of the manuscript, or in the decision to publish the results.

References

  1. Elizabeth, A.; Durstine, J.L. Physical activity, exercise, and chronic diseases: A brief review. Sport. Med. Health Sci. 2019, 1, 3–10. [Google Scholar]
  2. WHO. Noncommunicable-Diseases 2022. Available online: https://www.who.int/zh/news-room/fact-sheets/detail/noncommunicable-diseases (accessed on 1 September 2022).
  3. Murray, C.J.; Lopez, A.D. Alternative projections of mortality and disability by cause 1990–2020: Global Burden of Disease Study. Lancet 1997, 349, 1498–1504. [Google Scholar] [CrossRef]
  4. Warburton, D.E.; Nicol, C.W.; Bredin, S.S. Health benefits of physical activity: The evidence. Can. Med. Assoc. J. 2006, 174, 801–809. [Google Scholar] [CrossRef] [Green Version]
  5. Durstine, J.L.; Gordon, B.; Wang, Z.Z.; Luo, X. Chronic disease and the link to physical activity. J. Sport Health Sci. 2013, 2, 3–11. [Google Scholar] [CrossRef] [Green Version]
  6. Ades, P.A.; Balady, G.J.; Berra, K. Transforming exercise-based cardiac rehabilitation programs into secondary prevention centers: A national imperative. J. Cardiopulm. Rehabil. 2001, 21, 263–272. [Google Scholar] [CrossRef]
  7. Hamman, R.F.; Wing, R.R.; Edelstein, S.L.; Lachin, J.M.; Bray, G.A.; Delahanty, L.; Hoskin, M.; Kriska, A.M.; Mayer-Davis, E.J.; Pi-Sunyer, X.; et al. Effect of weight loss with lifestyle intervention on risk of diabetes. Diabetes Care 2006, 29, 2102–2107. [Google Scholar] [CrossRef] [PubMed] [Green Version]
  8. Lee, I.M.; Shiroma, E.J.; Lobelo, F.; Puska, P.; Blair, S.N.; Katzmarzyk, P.T. Effect of physical inactivity on major non-communicable diseases worldwide: An analysis of burden of disease and life expectancy. Lancet 2012, 380, 219–229. [Google Scholar] [CrossRef] [Green Version]
  9. Lear, S.A.; Hu, W.H.; Rangarajan, S.; Gasevic, D.; Leong, D.; Iqbal, R.; Casanova, A.; Swaminathan, S.; Anjana, R.M.; Kumar, R.; et al. The effect of physical activity on mortality and cardiovascular disease in 130,000 people from 17 high-income, middle-income, and low-income countries: The PURE study. Lancet 2017, 390, 2643–2654. [Google Scholar] [CrossRef]
  10. Spence, J.C.; Lee, R.E. Toward a comprehensive model of physical activity. Psychol. Sport Exerc. 2003, 4, 7–24. [Google Scholar] [CrossRef]
  11. Sallis, J.F.; Bauman, V.; Pratt, M. Environmental and policy interventions to promote physical activity. Am. J. Prev. Med. 1998, 15, 379–397. [Google Scholar]
  12. McLeroy, K.R.; Bibeau, D.; Steckler, A.; Glanz, K. An ecological perspective on health promotion programs. Health Educ. Q. 1988, 15, 351–377. [Google Scholar] [CrossRef]
  13. Sallis, J.F.; Cervero, R.B.; Ascher, W.; Henderson, K.A.; Kraft, M.K.; Kerr, J. An ecological approach to creating active living communities. Annu. Rev. Public Health 2006, 27, 297–322. [Google Scholar] [CrossRef] [PubMed]
  14. Wang, L.; Zhou, K.C. Performance assessment of the distribution of community sports facility from the perspective of healthy equity—A case study of the central city of Shanghai. J. Hum. Settl. West China 2019, 34, 1–7. [Google Scholar]
  15. Guo, J.M.; Zhao, S. Optimization strategy of residents ‘public sports space supply under the concept of healthy city. Contemp. Sport. Technol. 2021, 11, 106–109. [Google Scholar]
  16. Wei, F.; Wang, X. Measuring spatial accessibility to physical activity spaces in Hangzhou using 2SFCA method. City Plan. Rev. 2019, 43, 112–119. [Google Scholar]
  17. Kabisch, N.; Haase, D. Green spaces of European cities revisited for 1990–2006. Landsc. Urban Plan. 2013, 110, 113–122. [Google Scholar] [CrossRef]
  18. Brito, J.N.; Pope, Z.C.; Mitchel, N.R.; Schneider, I.E.; Larson, J.M.; Horton, T.H.; Pereira, M.A. Changes in psychological state measures after green versus suburban walking exercise: A pilot crossover study. Int. J. Environ. Res. Public Health 2019, 16, 2894. [Google Scholar] [CrossRef] [Green Version]
  19. Wood, L.; Hooper, P.; Foster, S.; Bull, F. Public green spaces and positive mental health -investigating the relationship between access, quantity and types of parks and mental wellbeing. Health Place 2017, 48, 63–71. [Google Scholar] [CrossRef]
  20. Berman, M.G.; Kross, E.; Krpan, K.M.; Askren, M.K.; Burson, A.; Deldin, P.J.; Kaplan, S.; Sherdell, L.; Gotlib, I.H.; Jonides, J. Interacting with nature improves cognition and affect for individuals with depression. J. Affect. Disord. 2012, 140, 300–305. [Google Scholar] [CrossRef] [Green Version]
  21. Hanson, S.; Jones, A. Is there evidence that walking groups have health benefits? A systematic review and meta-analysis. Br. J. Sport. Med. 2015, 49, 710–715. [Google Scholar] [CrossRef] [Green Version]
  22. Pouso, S.; Borja, Á.; Fleming, L.E.; Gómez-Baggethun, E.; White, M.P.; Uyarra, M.C. Contact with blue-green spaces during the COVID-19 pandemic lockdown beneficial for mental health. Sci. Total Environ. 2020, 756, 143984. [Google Scholar] [CrossRef]
  23. He, J.L.; Zhang, X.F.; Chen, J.F. Sports and city: Integrative development strategy of urban green space and public sports in Germany. Urban Plan. Int. 2017, 32, 44–48. [Google Scholar] [CrossRef]
  24. Zhao, X.L.; Wang, M.C.; Zhao, W.; Chen, X.C.; Bian, Q. Evolution of British urban parks from the perspective of public health and well-being. Urban Plan. Int. 2021, 36, 47–57. [Google Scholar]
  25. Zhang, F.Y.; Xiao, Y.; Wu, Y. Spatial layout of public sports venues in urban communities—Based on Yangpu district of Shanghai. J. Shanghai Univ. Sport 2014, 38, 80–83. [Google Scholar]
  26. Billaudeau, N.; Oppert, J.M.; Simon, C.; Charreire, H.; Casey, R.; Salze, P.; Badariotti, D.; Banos, A.; Weber, C.; Chaix, B. Investigating disparities in spatial accessibility to and characteristics of sport facilities: Direction, strength, and spatial scale of associations with area income. Health Place 2011, 17, 114–121. [Google Scholar] [CrossRef]
  27. Zhang, H.J.; Yu, K.H. Investigation on condition of sports facility construction in the commercial residential communities in Hangzhou city. Zhejiang Sport Sci. 2007, 2, 45–48. [Google Scholar]
  28. Ma, Z.H.; Ma, Z.Q.; Dai, J.; Zhang, L. Research on central place theory and spatial distribution of urban sports facilities. J. Beijing Sport Univ. 2004, 27, 445–447. [Google Scholar]
  29. Shi, Z.G.; Ma, C.; Zhao, Y.P.; Wang, X.L.; Zhang, L.P.; Chu, S.L. Coupling mechanism and optimization path of urban public sports facilities distribution and residents’ leisure sports living space. J. Shandong Sport Univ. 2021, 37, 1–9. [Google Scholar]
  30. Chen, Y. Optimizing the distribution of community sports service facilities based on GIS. Econ. Geogr. 2010, 30, 1254–1258. [Google Scholar]
  31. Gu, X.F.; Li, N.; Lu, H.L. Study on locations of urban community sports “fitness circle” facilities based on GIS. Ind. Eng. J. 2014, 17, 87–90. [Google Scholar]
  32. Cho, C. An equity-efficiency trade-off model for the optimum location of medical care facilities. Socio-Econ. Plan. Sci. 1998, 32, 99–112. [Google Scholar] [CrossRef]
  33. Hodgson, J.M. A location–allocation model maximizing consumers’ welfare. Reg. Stud. 1981, 15, 493–506. [Google Scholar] [CrossRef]
  34. Revelle, C.S.; Laporte, G. The plant location problem: New models and research prospects. Oper. Res. 1996, 44, 864–874. [Google Scholar] [CrossRef] [Green Version]
  35. Zhang, Y.Y. Research on location and distribution of multi-objective emergency resources. China Saf. Sci. J. 2011, 21, 153–158. [Google Scholar]
  36. Farahani, R.Z.; SteadieSeifi, M.; Asgari, N. Multiple criteria facility location problems: A survey. Appl. Math. Model. 2010, 34, 1689–1709. [Google Scholar] [CrossRef]
  37. Chen, Z.N.; Yan, X.P. Application of location models in the distribution of common facilities. Econ. Geogr. 2006, 26, 23–26. [Google Scholar]
  38. Zhang, C.; Zhai, Z.W.; Li, Y.D. Location optimization of emergency medical facilities in downtown Nanjing Based on potentiality. Jiangsu Constr. 2019, 79–83. [Google Scholar]
  39. Hu, J.C.; Wang, L. Optimizing the distribution of city public sports service facilities based on GIS. J. Harbin Sport Univ. 2013, 31, 10–15. [Google Scholar]
  40. Çakmak, E.; Önden, İ.; Acar, A.Z.; Eldemir, F. Analyzing the location of city logistics centers in Istanbul by integrating Geographic Information Systems with Binary Particle Swarm Optimization algorithm. Case Stud. Transp. Policy 2021, 9, 59–67. [Google Scholar] [CrossRef]
  41. ElKady, S.K.; Abdelsalam, H.M. A Simulation-based optimization approach for healthcare facility location allocation decision. In Proceedings of the Science and Information Conference, London, UK, 28–30 July 2015; pp. 500–505. [Google Scholar]
  42. Larson, R.C.; Stevenson, K.A. On insensitivities in urban redistricting and facility location. Oper. Res. 1972, 20, 595–612. [Google Scholar] [CrossRef]
  43. Li, X.; Ye, J.A. Optimal spatial search using genetic algorithms and GIS. Acta Geogr. Sin. 2004, 59, 745–753. [Google Scholar]
  44. Li, L.; Xie, X.L. Research for combination algorithm of Weber multi-point facilities optimization location. Comput. Eng. Appl. 2013, 49, 258–261. [Google Scholar]
  45. Li, X.L.; Zhou, Q.P.; Tan, C.G.; Tan, Y.L.; Xu, Z.Y. Optimal location of urban sports facilities based on ant colony algorithm. Comput. Mod. 2020, 33–39. [Google Scholar] [CrossRef]
  46. Chen, W.L.; An, C.R.; Wang, J.C.; Yang, Y.L. A technical method for spatial location optimization based on network Voronoi diagram and multi-objective particle swarm. Geogr. Geo-Inf. Sci. 2014, 30, 1–6. [Google Scholar]
  47. Mohammadi, R.; Ghomi, S.M.T.F.; Jolai, F. Prepositioning emergency earthquake response supplies: A new multi-objective particle swarm optimization algorithm. Appl. Math. Model. 2016, 40, 5183–5199. [Google Scholar] [CrossRef]
  48. Liu, J.F.; Zhang, H.Y.; He, K.; Jiang, S.Y. Multi-objective particle swarm optimization algorithm based on objective space division for the unequal-area facility layout problem. Expert Syst. Appl. 2018, 102, 179–192. [Google Scholar] [CrossRef]
  49. Sevkli, M.; Guner, A.R. A continuous particle swarm optimization algorithm for uncapacitated facility location problem. Lect. Notes Comput. Sci. 2006, 4150, 316–323. [Google Scholar]
  50. Uno, T.; Kato, K.; Katagiri, H. An application of interactive fuzzy satisficing approach with particle swarm optimization for multiobjective emergency facility location problem with A-distance. In Proceedings of the IEEE Symposium on Computational Intelligence in Multicriteria Decision Making, Honolulu, HI, USA, 1–5 April 2007; pp. 368–373. [Google Scholar]
  51. Lu, Z. Research on the Application of Multi-Objective Particle Swarm Optimization in the Land of Consolidation Projects Site Location—A Case Study of Qinzhou District in Tianshui City. Master’s Thesis, Gansu Agricultural University, Lanzhou, China, 2017. [Google Scholar]
  52. Liu, J.D. Intelligent algorithm application in facility location—Taking Guangzhou city as an example. Urban Geotech. Investig. Surv. 2020, 3, 33–39. [Google Scholar]
  53. Ma, Y.J.; Zhao, X.J.; Qin, L.J.; Liang, P.J.; Zhou, H.J.; Yuan, Y.; Xu, W. Multi-objective location-allocation model of earthquake emergency shelters with multiple constraints: A case study in Wenchang of Hainan. J. Catastrophol. 2018, 33, 218–224. [Google Scholar]
  54. Tian, J.; Ma, W.Z.; Wang, Y.L.; Wang, K.L. Emergency supplies distributing and vehicle routes programming based on particle swarm optimization. Syst. Eng.-Theory Pract. 2011, 31, 898–906. [Google Scholar]
  55. Weber, A. On the Location of Industries; University of Chicago Press: Chicago, IL, USA, 1929. [Google Scholar]
  56. Beasley, J.E.; Chu, P.C. A genetic algorithm for the set covering problem. Theory Methodol. 1996, 94, 392–404. [Google Scholar] [CrossRef]
  57. Bigman, D.; ReVelle, C. An operational approach to welfare considerations in applied public-facility-location models. Environ. Plan. A 1979, 11, 83–95. [Google Scholar] [CrossRef]
  58. Murat, A.; Verter, V.; Laporte, G. A multi-dimensional shooting algorithm for the two-facility location–allocation problem with dense demand. Comput. Oper. Res. 2011, 38, 450–463. [Google Scholar] [CrossRef]
  59. Streifel, C.; Wolch, J.; Dean, M. Malign neglect: Homelessness in an American city. Contemp. Sociol. 1994, 23, 690. [Google Scholar] [CrossRef]
  60. Zhang, P.G.; Xu, Y.; Hu, S.; Hu, J.J. Sports facility and its layout for residents’ needs. Planners 2017, 33, 132–137. [Google Scholar]
  61. Konak, A.; Coit, D.W.; Smith, A.E. Multi-objective optimization using genetic algorithms: A tutorial. Reliab. Eng. Syst. Saf. 2006, 91, 992–1007. [Google Scholar] [CrossRef]
  62. Almiñana, M.; Pastor, J.T. An adaptation of SH heuristic to the location set covering problem. Eur. J. Oper. Res. 1997, 100, 586–593. [Google Scholar] [CrossRef]
  63. Farhan, B.; Murray, A.T. Siting park-and-ride facilities using a multi-objective spatial optimization model. Comput. Oper. Res. 2008, 35, 445–456. [Google Scholar] [CrossRef]
  64. Current, J.; Min, H.; Schilling, D. Multiobjective analysis of facility location decisions. Eur. J. Oper. Res. 1990, 49, 295–307. [Google Scholar] [CrossRef]
  65. Bellettini, G.; Kempf, H. Why not in your backyard? On the location and size of a public facility. Reg. Sci. Urban Econ. 2013, 43, 22–30. [Google Scholar] [CrossRef] [Green Version]
  66. Batta, R.; Lejeune, M.; Prasad, S. Public facility location using dispersion, population, and equity criteria. Eur. J. Oper. Res. 2014, 234, 819–829. [Google Scholar] [CrossRef]
  67. Drezner, T.; Drezner, Z. The gravity p-median model. Eur. J. Oper. Res. 2007, 179, 1239–1251. [Google Scholar] [CrossRef]
  68. Liu, M.W.; Li, X. A pareto genetic algorithm for multi-objective site search problem: A case study on hospital location in Shenzhen city. Trop. Geogr. 2010, 30, 650–655. [Google Scholar]
  69. Wang, Y.Q. Research on location optimization of public sports Facilities based on GIS. Contemp. Sport. Technol. 2019, 9, 182–184. [Google Scholar]
  70. Li, X.; Ma, X.D.; Xue, X.T.; Khuong, M.H. Spatial supply-demand evaluation and layout optimization for urban green space: A case study of Xuzhou central district. Sci. Geogr. Sin. 2019, 39, 1771–1779. [Google Scholar]
  71. Zhang, Q.; Guo, X.L.; Peng, C.X.; Sun, H.L.; Qu, D.L. Optimization strategies for urban community sports space based on ten-minute fitness circle: A case study of Yuexiu district in Guangzhou. J. Guangdong Poly. Nor. Univ. 2022, 43, 67–72. [Google Scholar]
  72. Coello, C.A.C.; Lechuga, M.S. MOPSO: A proposal for multiple objective particle swarm optimization. In Proceedings of the Congress on Evolutionary Computation, Honolulu, HI, USA, 12–17 May 2002; pp. 1051–1056. [Google Scholar]
  73. Raquel, C.R.; Naval, P.C. An effective use of crowding distance in multiobjective particle swarm optimization. In Proceedings of the Genetic and Evolutionary Computation Conference, Washington, DC, USA, 25–29 June 2005; pp. 257–264. [Google Scholar]
  74. Zhang, G.A.; Zhou, C.; Zhou, H. New multi-objective particle swarm optimization based on extended individual memory. Appl. Res. Comput. 2010, 27, 1665–1668. [Google Scholar]
  75. Li, H.B.; Li, X.; Liu, X.P.; Ai, B.; Liu, T. Particle-swarm optimization for site selection with contiguity constraints. Natl. Remote Sens. Bull. 2008, 12, 724–733. [Google Scholar]
  76. Zeng, Z.F.; Du, G.M. Location of public library based on particle swarm optimization. Libr. Inf. Serv. 2010, 54, 119–121. [Google Scholar]
  77. Du, G.M.; Chen, X.X.; Li, X. Spatial optimal search based on particle swarm optimization. Acta Geogr. Sin. 2006, 61, 1290–1298. [Google Scholar]
  78. Tao, Z.L.; Cheng, Y.; Dai, W.Q.; Li, X. Spatial optimization of residential care facility locations in 2020 in Beijing: Maximum equity in accessibility. Prog. Geogr. 2015, 34, 1609–1616. [Google Scholar]
  79. Kennedy, J.; Spears, W.M. Matching algorithms to problems: An experimental test of the particle swarm and some genetic algorithms on the multimodal problem generator. In Proceedings of the IEEE Conference on Evolutionary Computation, Anchorage, AK, USA, 4–9 May 1998; pp. 78–83. [Google Scholar]
  80. Liu, X.W.; Wang, H.; Lei, X.H.; Liao, W.H.; Wang, M.N.; Wang, W.P.; Zhang, P.P. Influence of parameter settings in PSO algorithm on simulation results of Xin’anjiang model. South-North Water Transf. Water Sci. Technol. 2018, 16, 69–74. [Google Scholar]
  81. Yang, X.C.; Sima, X.; Hong, T. Urban open space system planning method research—A case study of Shenzhen city. Planners 2008, 24, 24–27. [Google Scholar]
Figure 1. Study area.
Land 11 01991 g001
Figure 2. Flowchart of the MOPSO.
Land 11 01991 g002
Figure 3. Pareto optimal solutions.
Land 11 01991 g003
Figure 4. The fitness values of existing configuration and Pareto optimal solutions.
Land 11 01991 g004
Figure 5. Relation between the Number of Iterations and function values.
Land 11 01991 g005aLand 11 01991 g005b
Figure 6. The PAS’ locations of the four solutions.
Land 11 01991 g006aLand 11 01991 g006b
Table 1. Parameter settings of MOPSO.
ParametersValues
Number of particles, nPop200
Number of external particles, nRep4
The grid number, nGird7
Maximum iteration, Imax1000
Acceleration constants, c1, c22, 2
Inertia weight, wAccording to Formula (3)
Value range of X and YThe range of X and Y dimension
Maximum velocity, vXmax and vYmax10% of the distance in X and Y dimension
Mutation probability, mu0.1
Particle flight space dimension, D14
Table 2. Land use conditions and feasibility analysis of locations.
SolutionsFeasibilityLocationsLand Use Conditions
AHighA1, A3, A7 are located on abandoned and vacant landLand 11 01991 i001
AdjustA5 can be moved to the northeast industrial land
LowA2, A4, A6 lack available land
BHighB2, B5 are located in abandoned and vacant landLand 11 01991 i002
AdjustB1, B3 are located in UGS and cultural buildings, which can be moved to the vacant land
LowB4, B6, B7 lack available land
CHighC4, C7 are located in vacant landLand 11 01991 i003
AdjustC6 is located on the road and can be moved to the industrial land
LowC1, C2, C3, C5 are located in nonbuildable areas, such as green buffers
DHighD3, D4, D6 are industrial land and abandoned vacant landLand 11 01991 i004
AdjustD1, D5, D7 can be moved to vacant land
LowD2 has no more available land
Table 3. Comprehensive evaluation of the solutions.
SolutionsAdvantages Disadvantages
APAS has the best connection with UGS; high spatial distribution balance; most locations’ construction feasibility is highThe accessibility and service population are lowest. Three locations are difficult to construct
BThe accessibility of PAS is the best. Most locations’ construction feasibility is highPoor connection between PAS and UGS; the spatial distribution balance is poorest; Three locations are difficult to construct
CService the most people and the residential accessibility is highThe spatial distribution balance needs to be improved; construction feasibility is lowest and many locations are difficult to construct
DMean optimal objective; the spatial distribution balance in construction feasibility is highestA separate objective optimal solution cannot be obtained
Publisher’s Note: MDPI stays neutral with regard to jurisdictional claims in published maps and institutional affiliations.