


Potential of Multitemporal Lidar for the Detection of Subtle Archaeological Features under Perennial Dense Forest


Abstract
1. Introduction
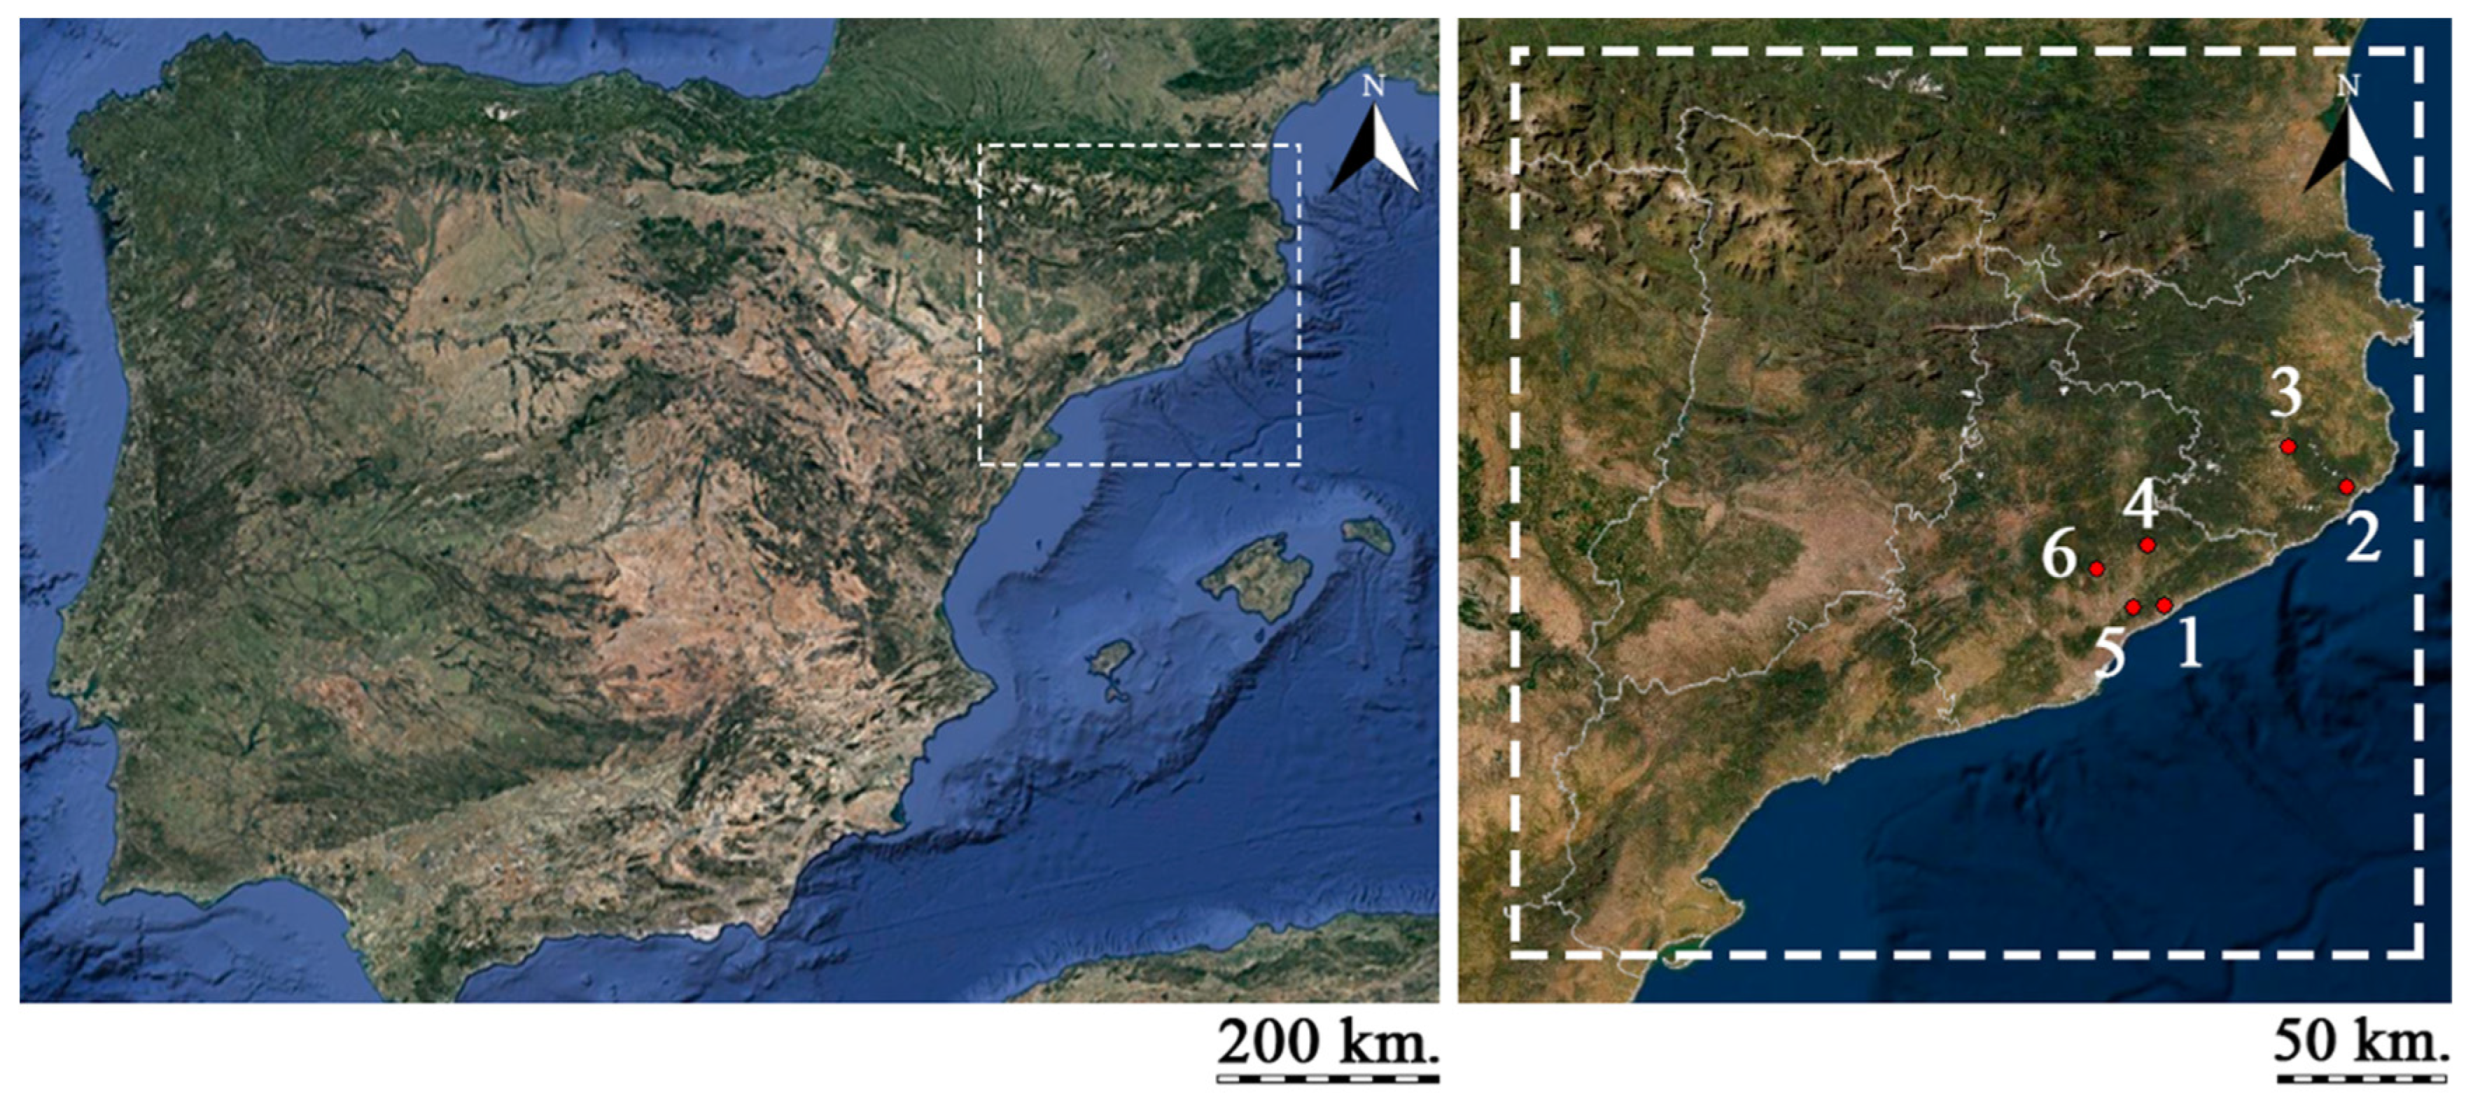
2. Case Studies
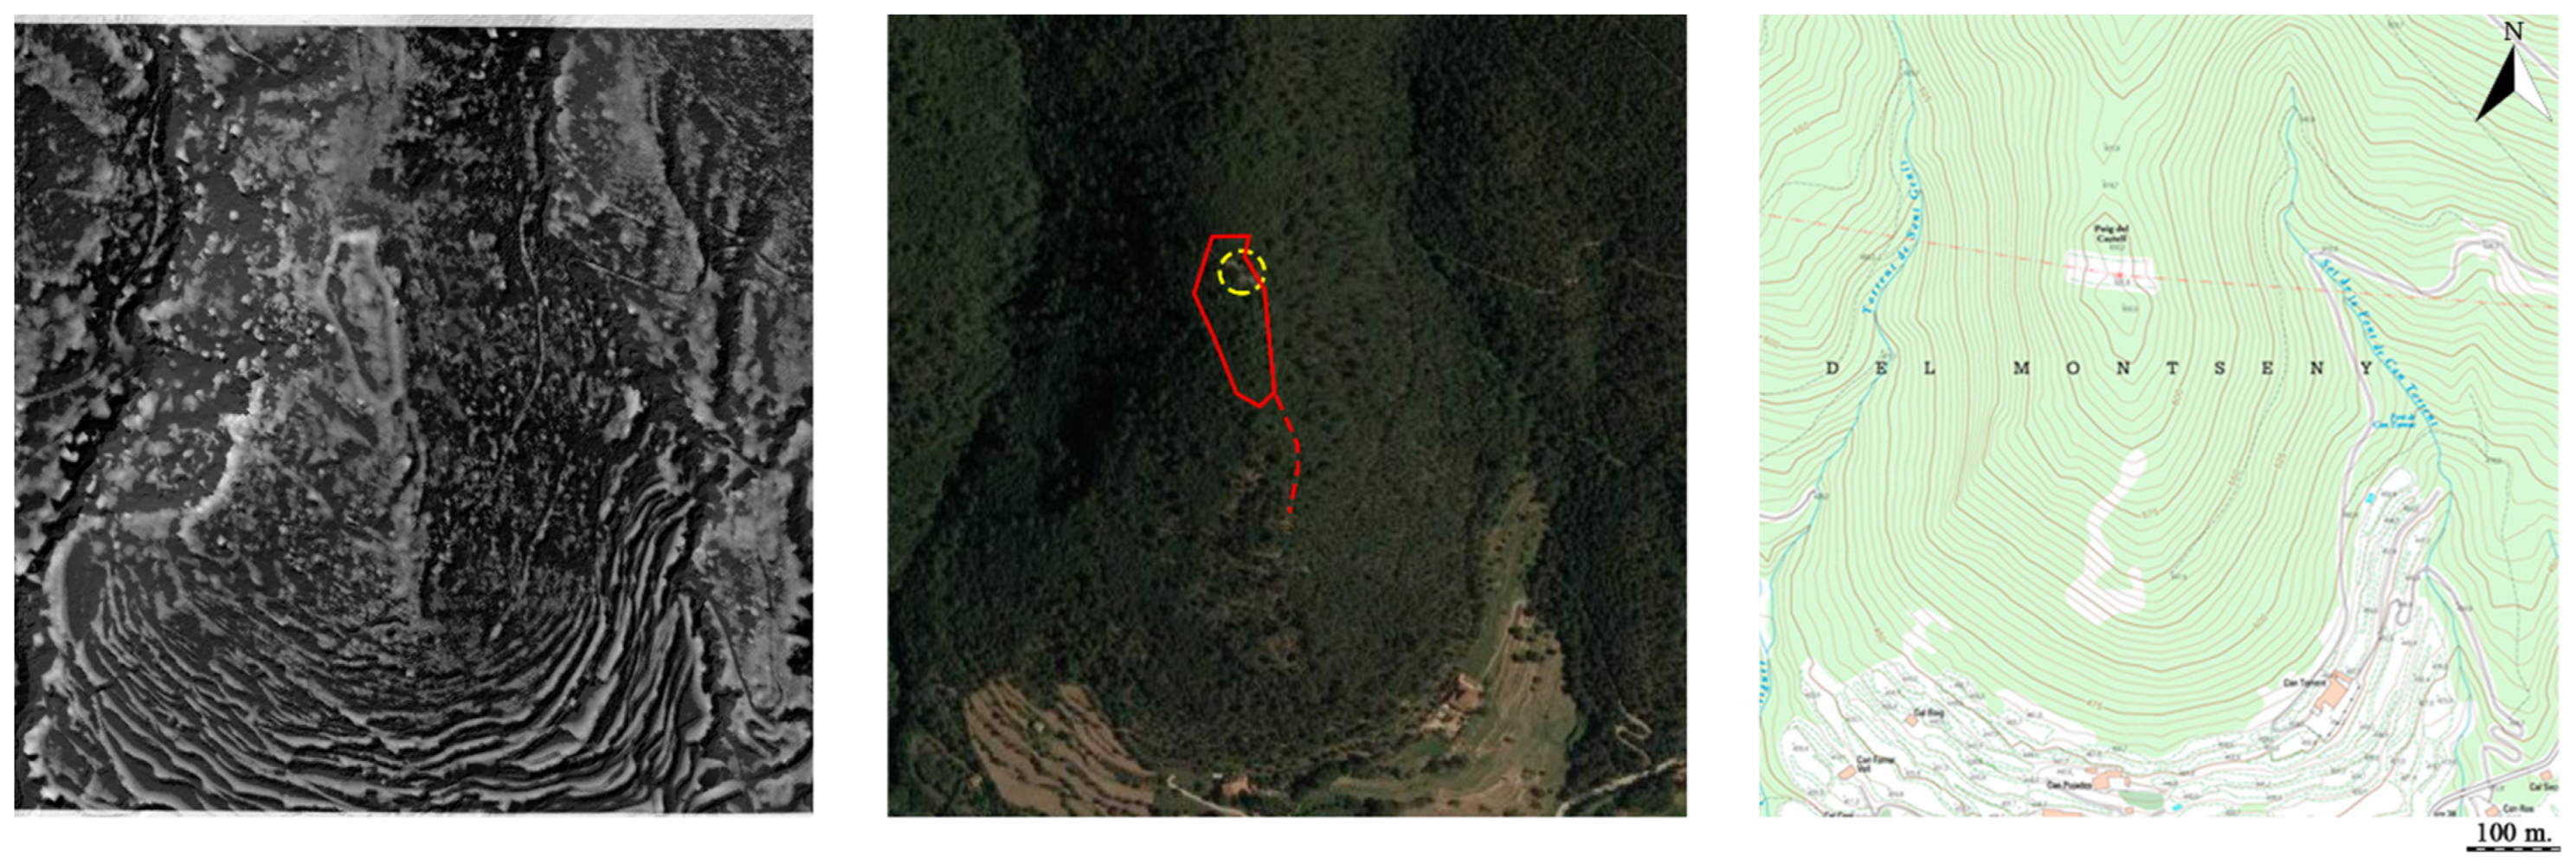
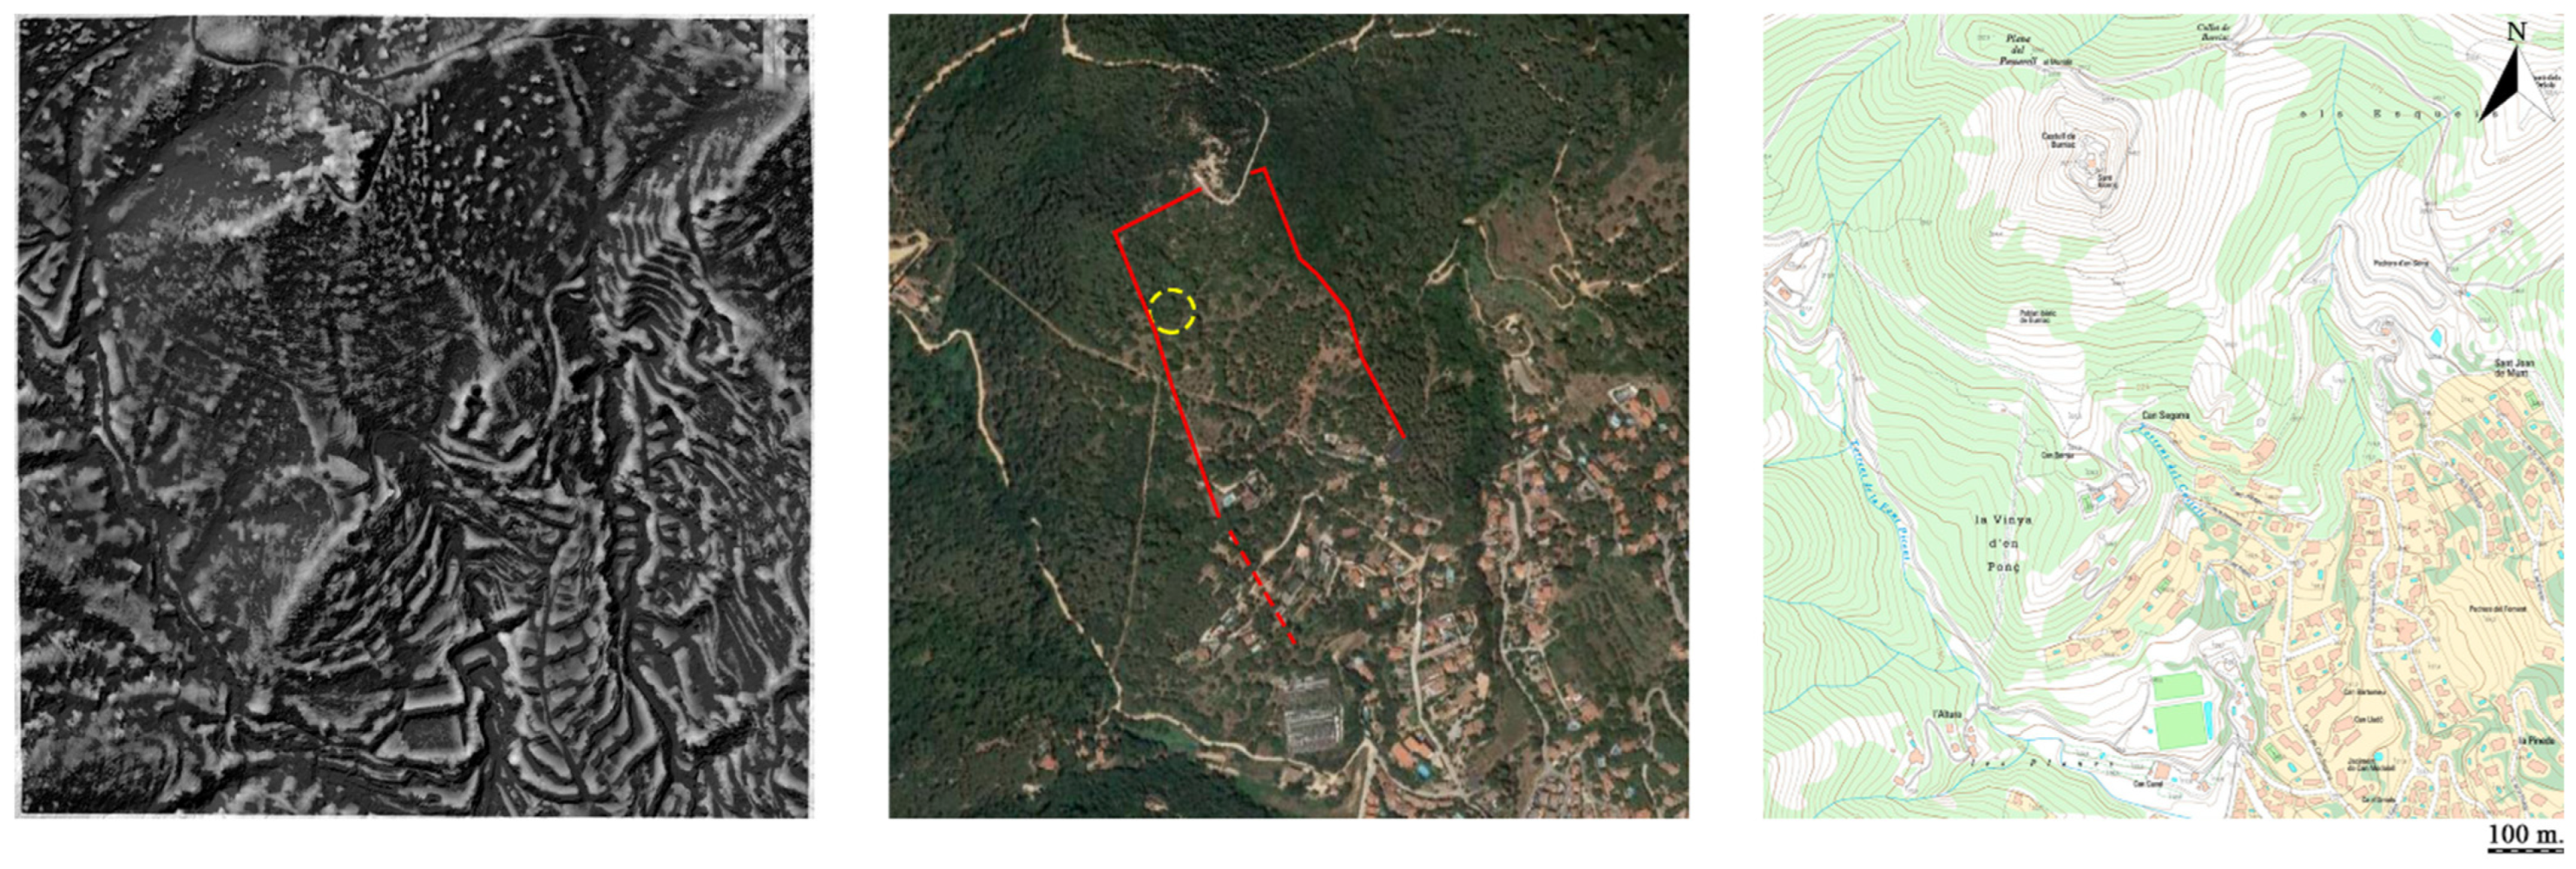
- Burriac (Cabrera de Mar, Maresme, Barcelona) (41°32′08″ N, 02°23′11″ E) [16]. This large site of around 10 ha corresponds to a first-order settlement, which can probably be identified as ancient Ilturo;
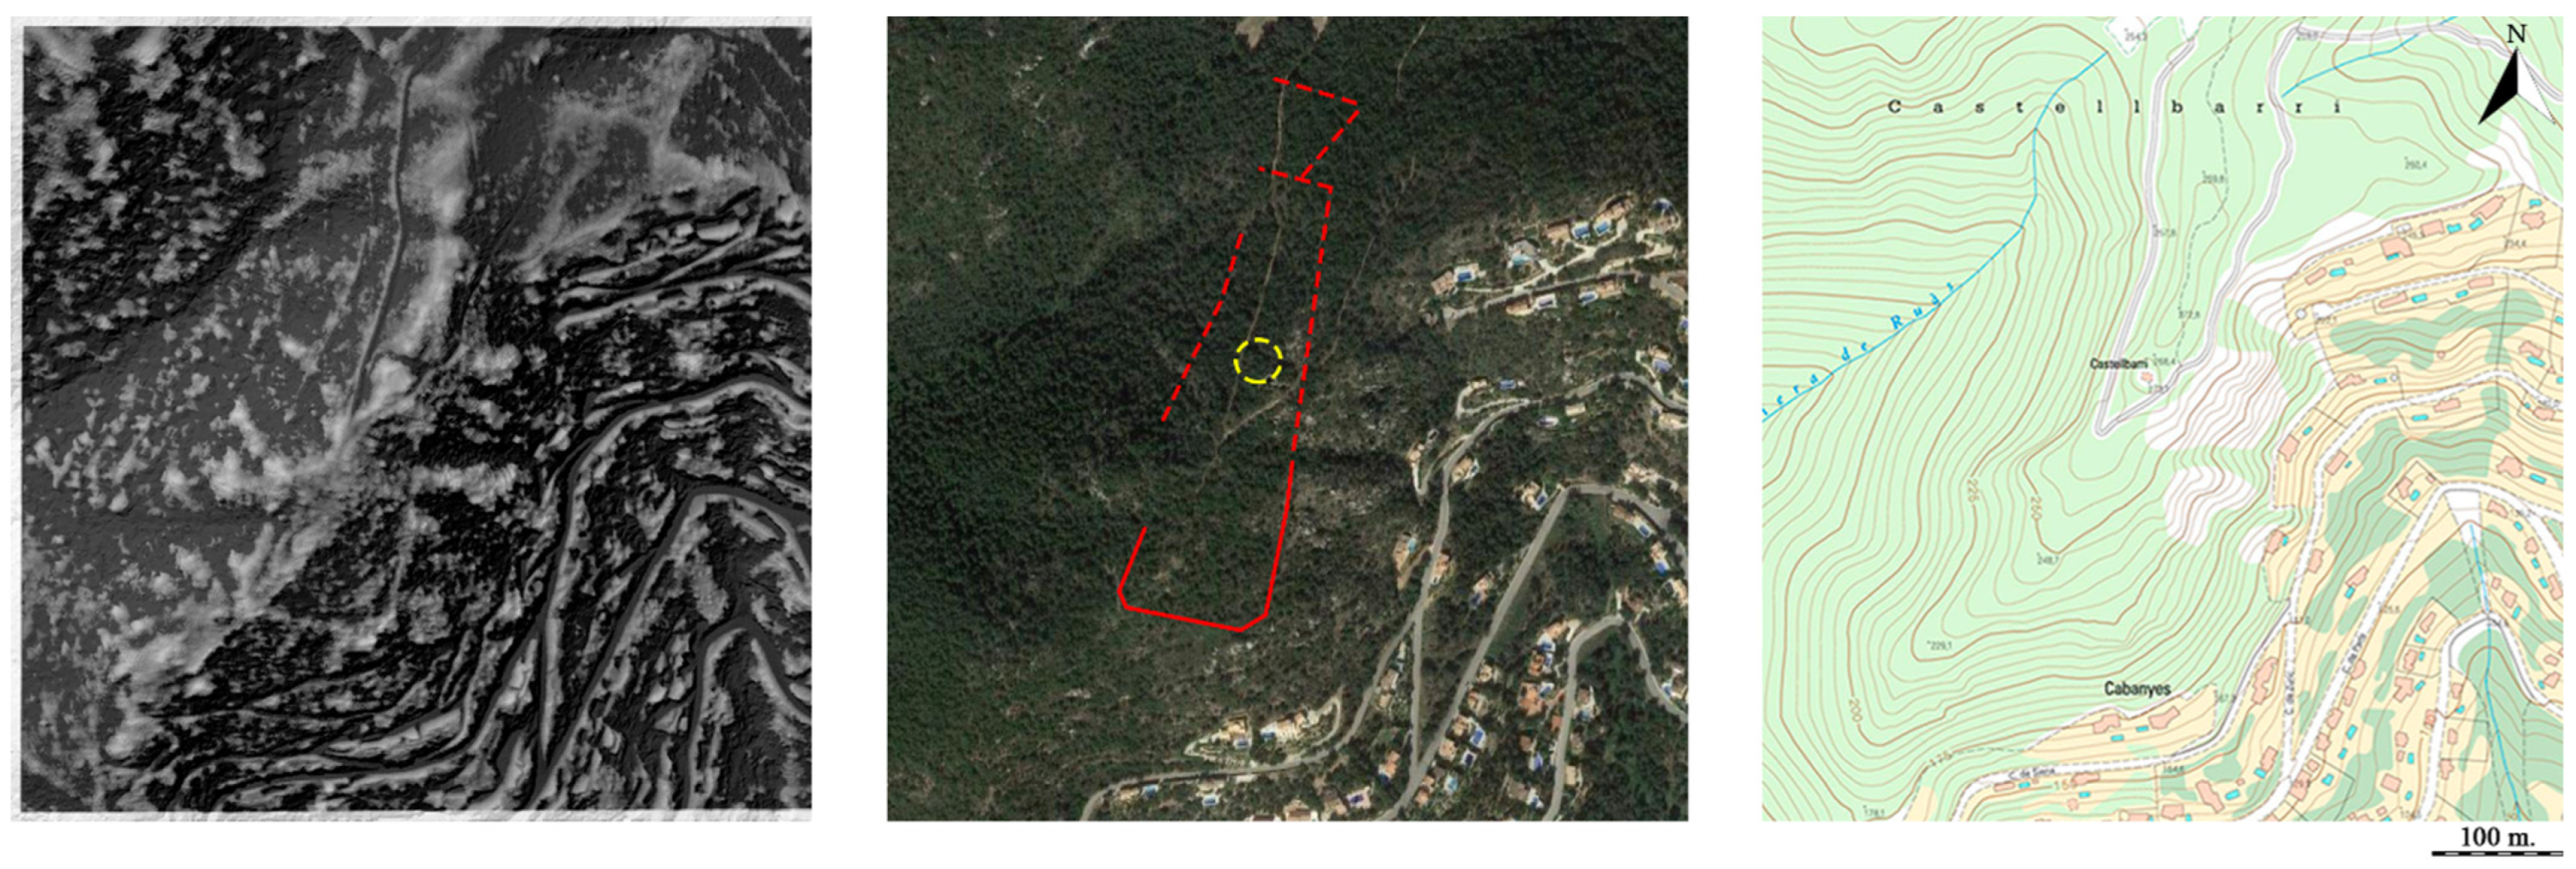
- Castell Barri (Calonge, Baix Empordà, Girona) (41°51′19″ N, 03°02′48″ E). Surface ceramic fragments have been recovered from this second-order town, which provided an approximate dating of 4th–3rd century BC [17];
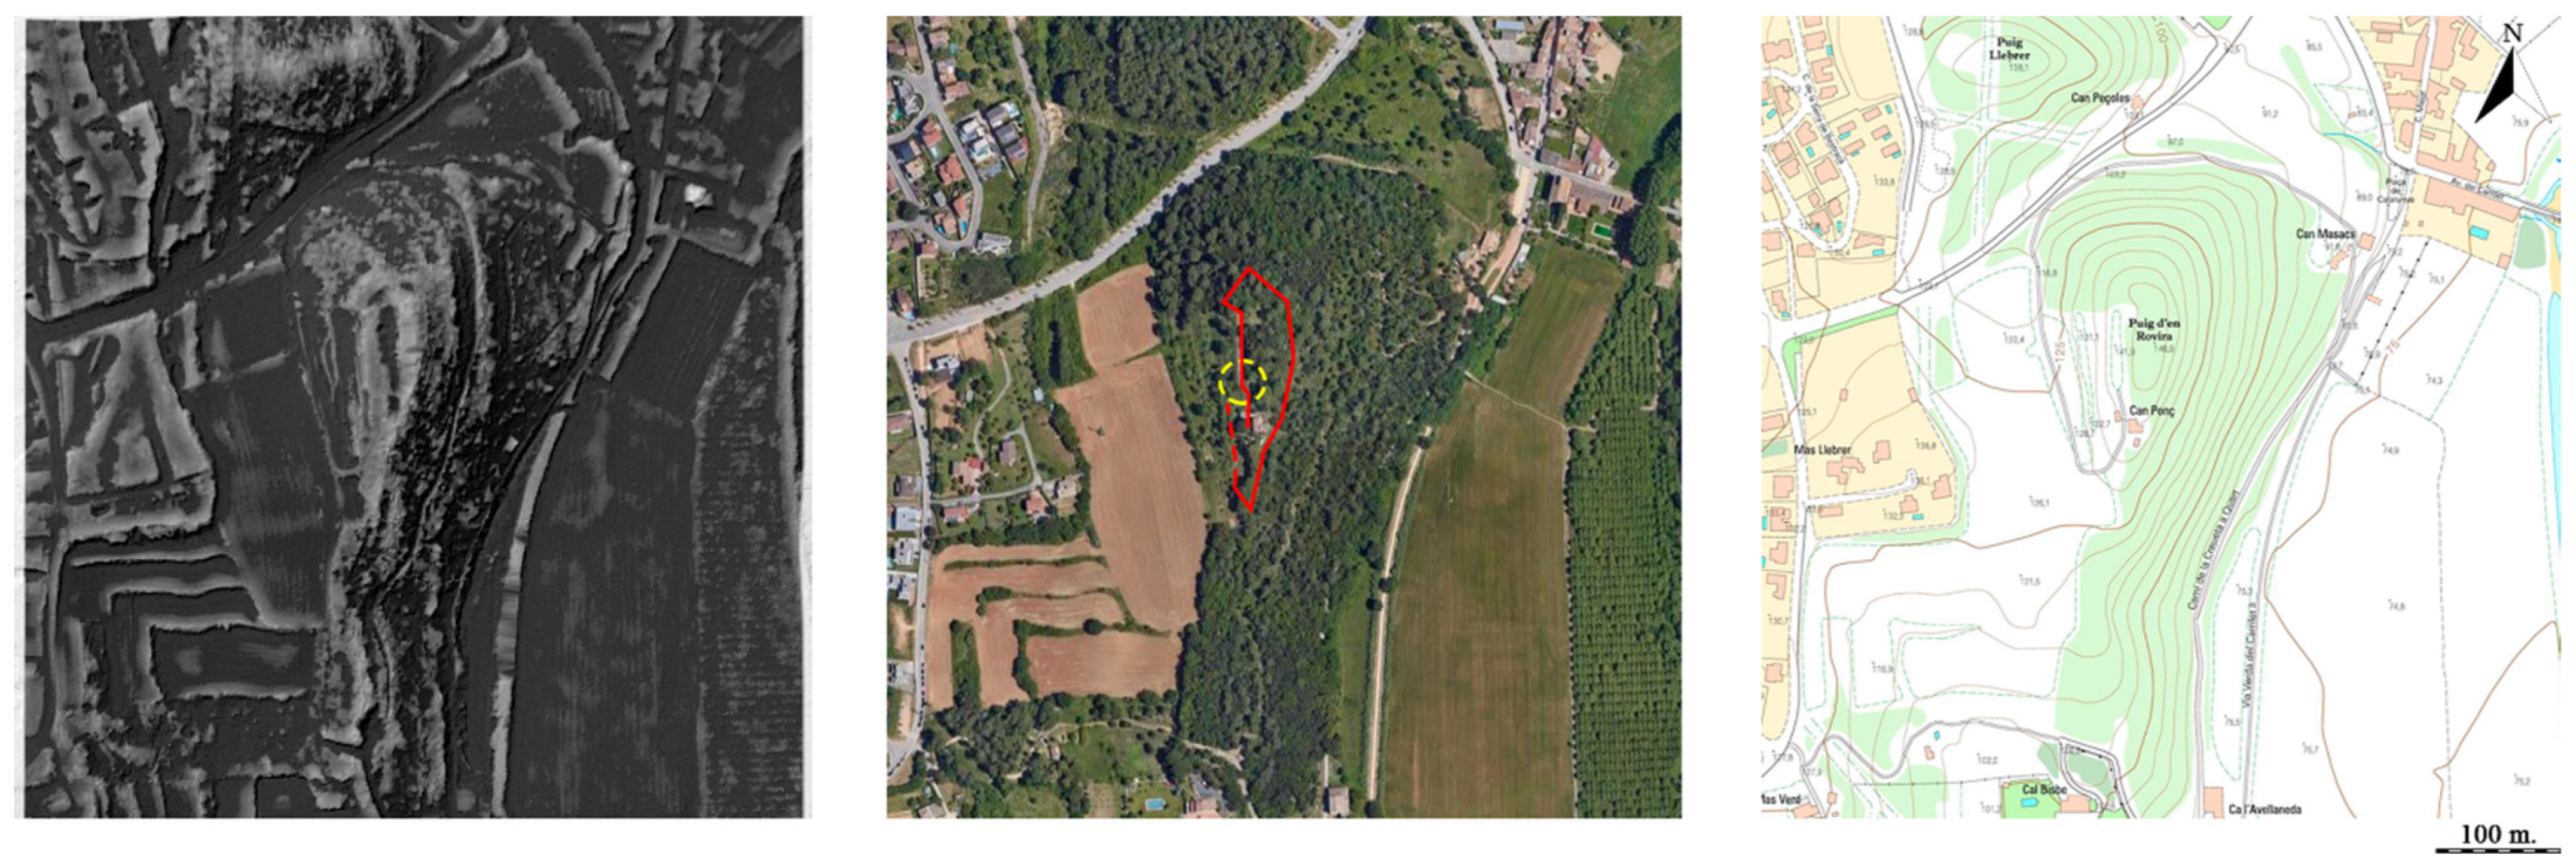
- Puig d’en Rovira (La Creueta de Quart, Girona) (41°57′48″ N, 02°50′11″ E). This small settlement was occupied from the late 4th to the 2nd century BC [18] with a Roman phase of use during the 1st and 2nd centuries AD;
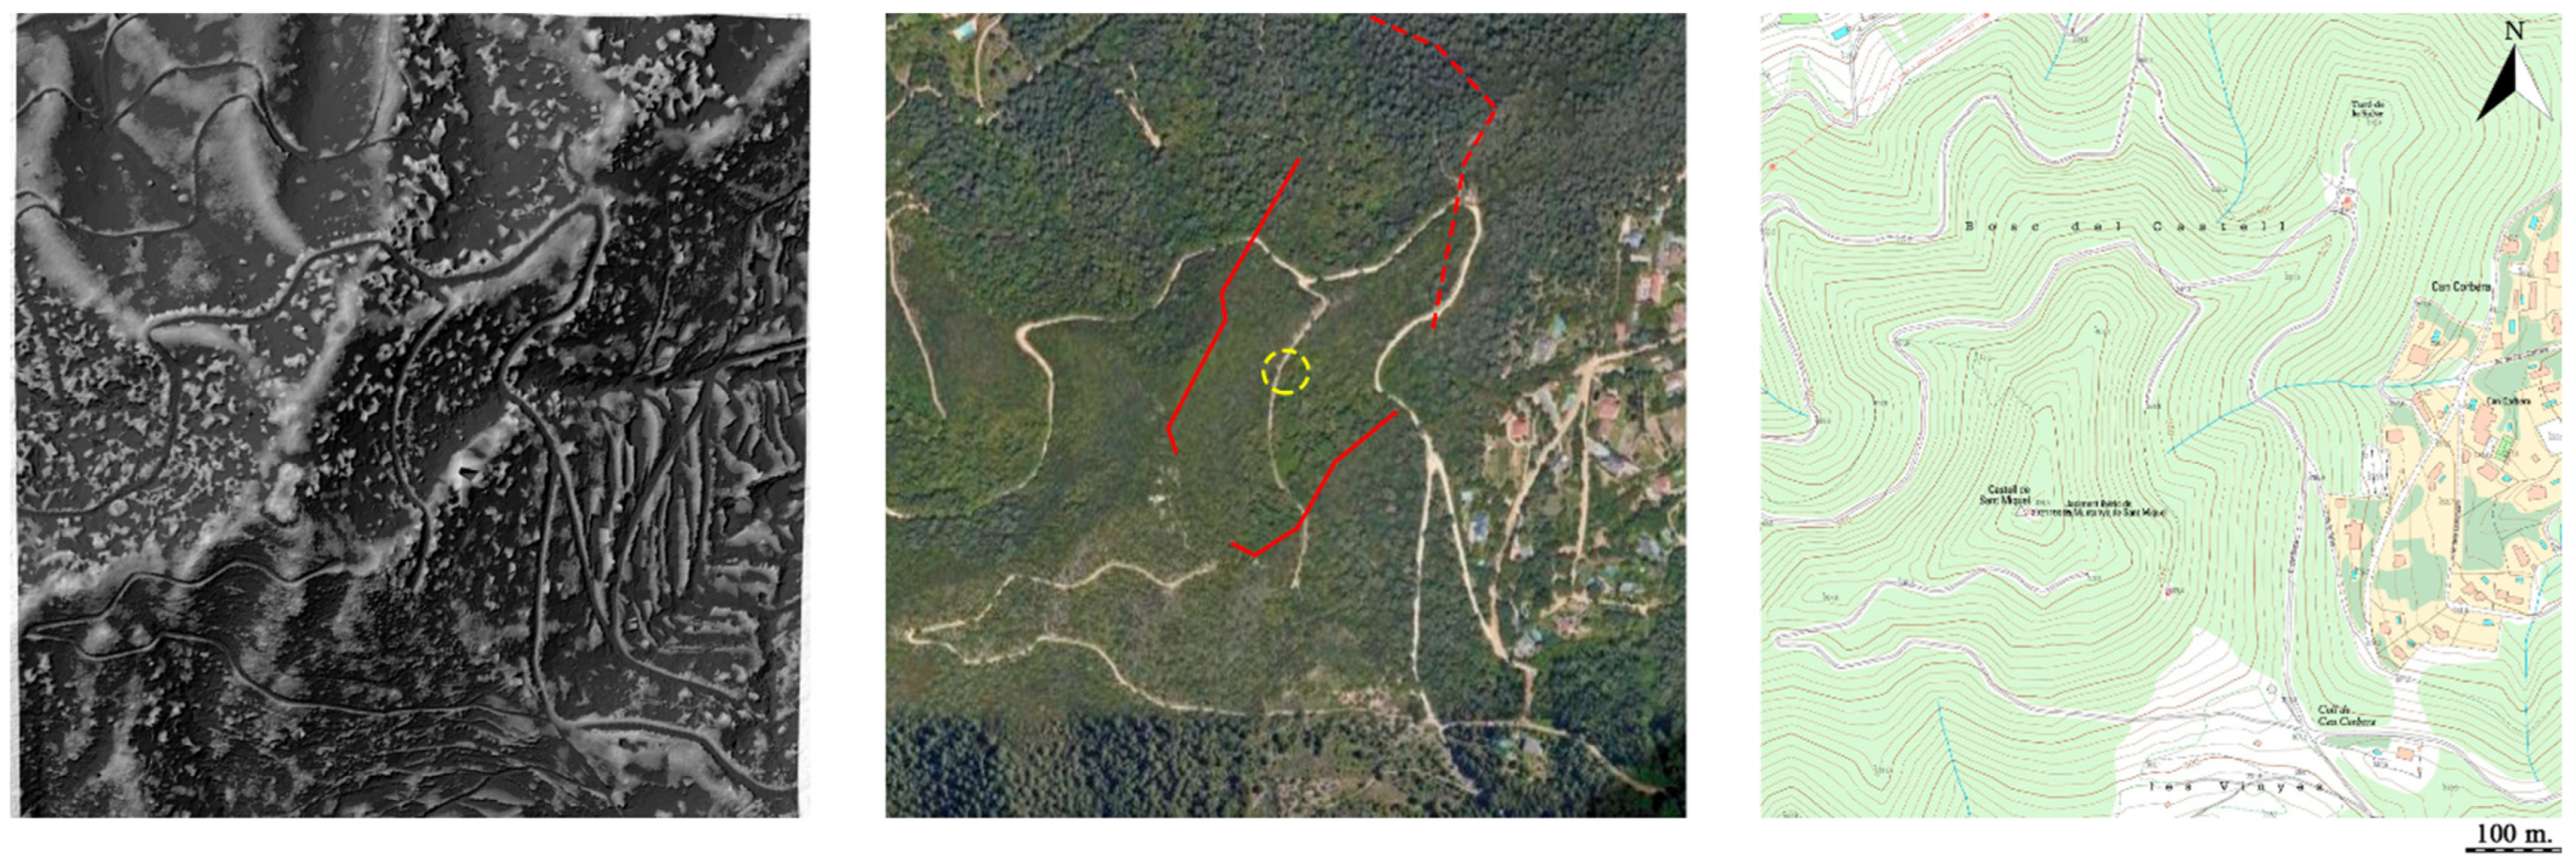
- Sant Miquel (Vallromanes/Montornès, Vallès Oriental, Barcelona) (41°31′44″ N, 02°16′26″ E). This middle-sized town (1.5–2.5 ha) was occupied from the second half of the 5th to the end of the 2nd century BC [21];
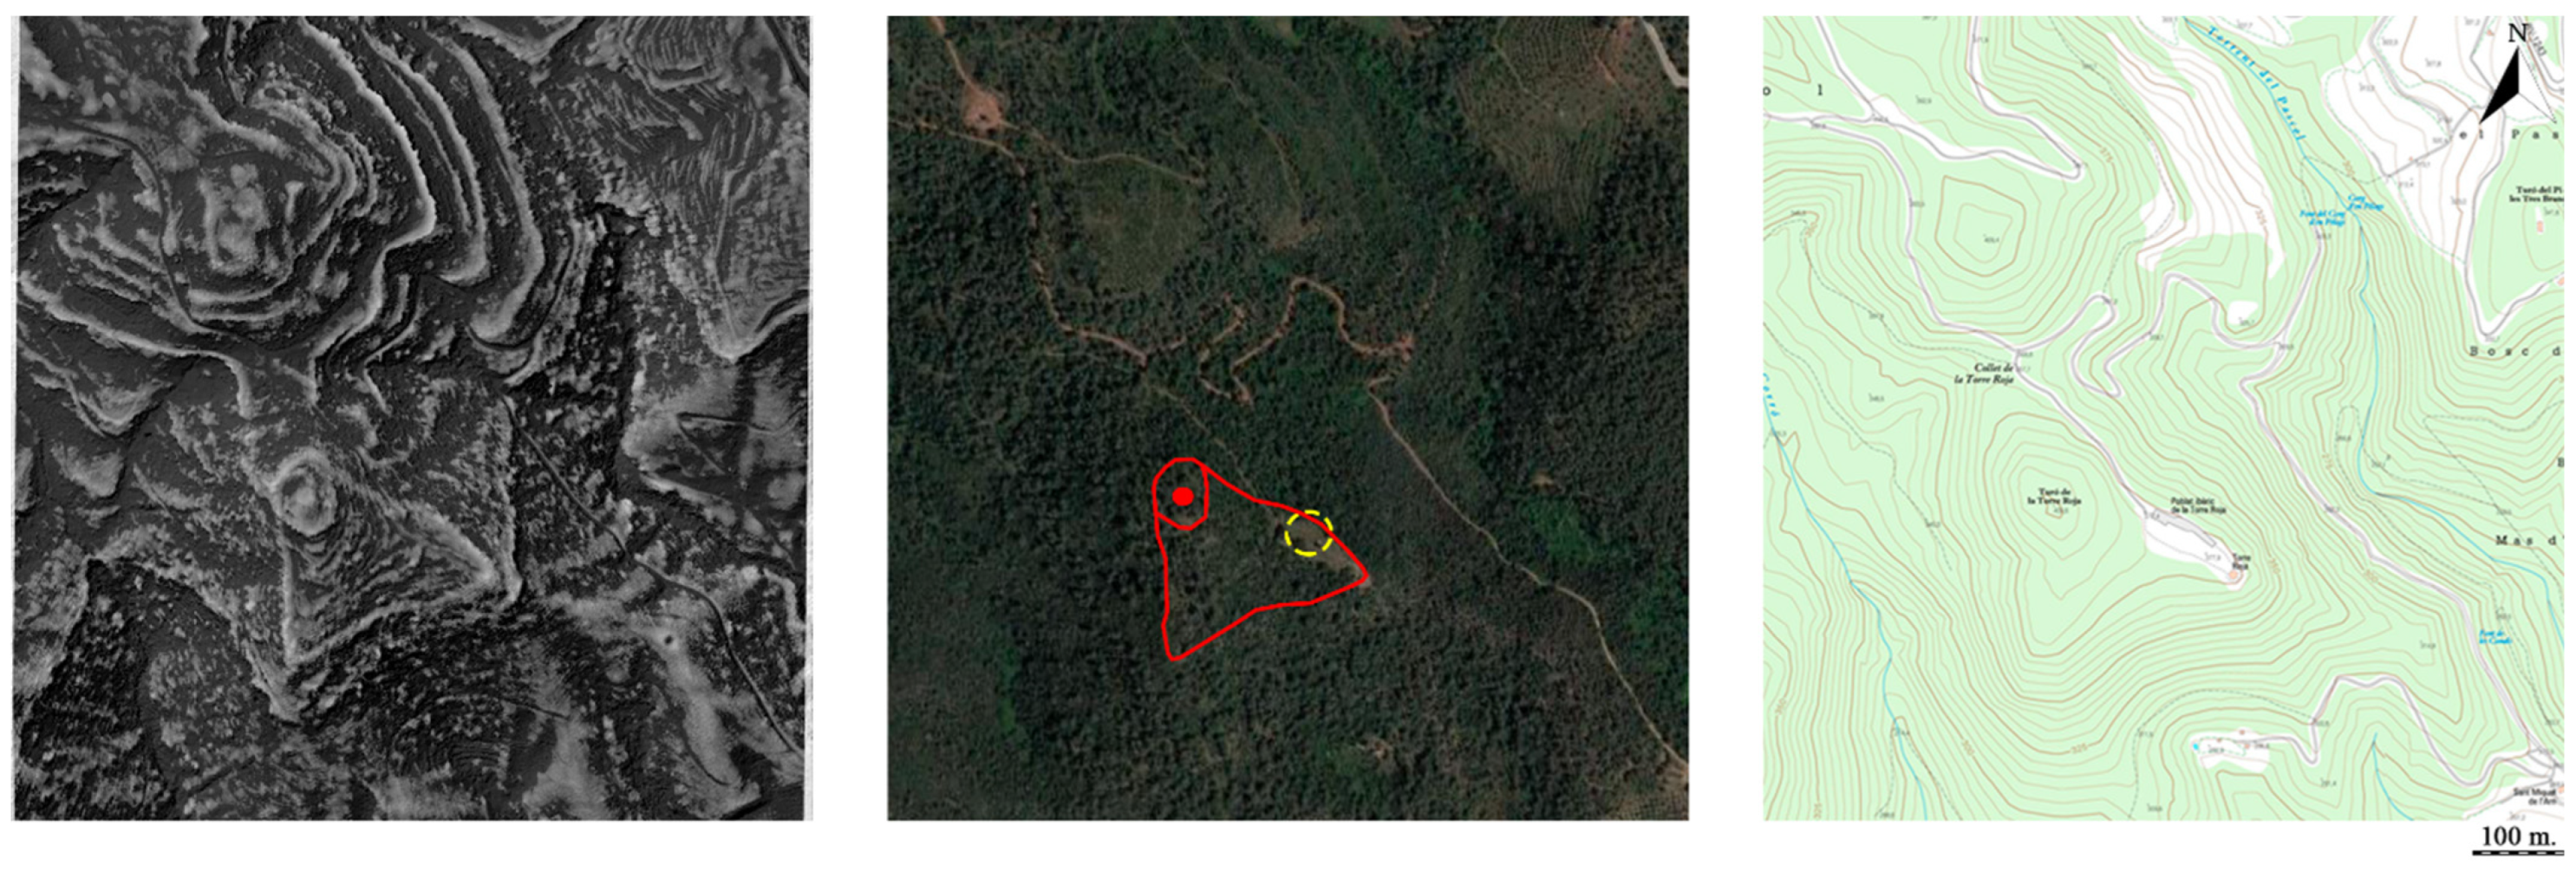
- Torre Roja (Caldes de Montbui, Vallès Oriental, Barcelona) (41°38′00″ N, 02°08′35″ E). This site was occupied from the late 6th century to the Middle Ages. Recent excavations have revealed an Iberian habitation area occupied from the 5/4th to the 1st centuries BC [22].
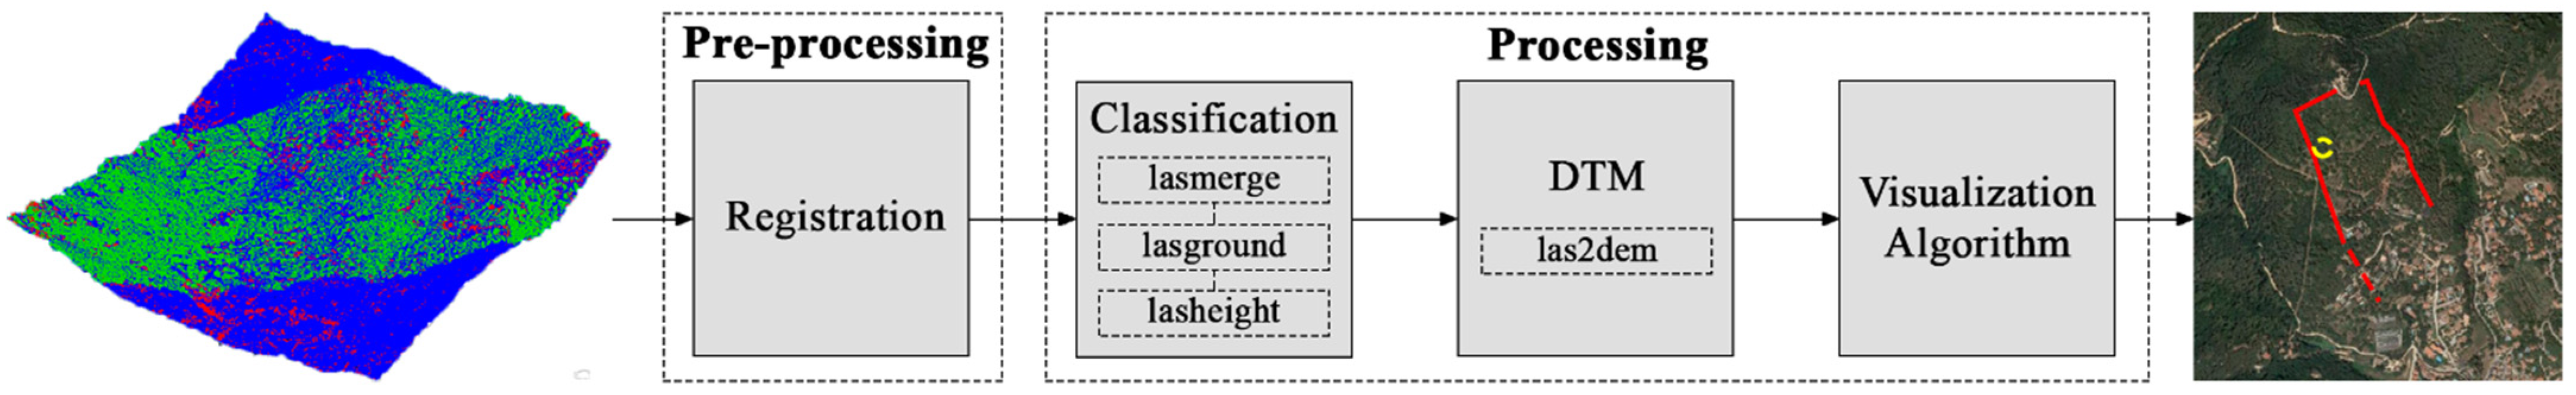
3. Methods and Sources
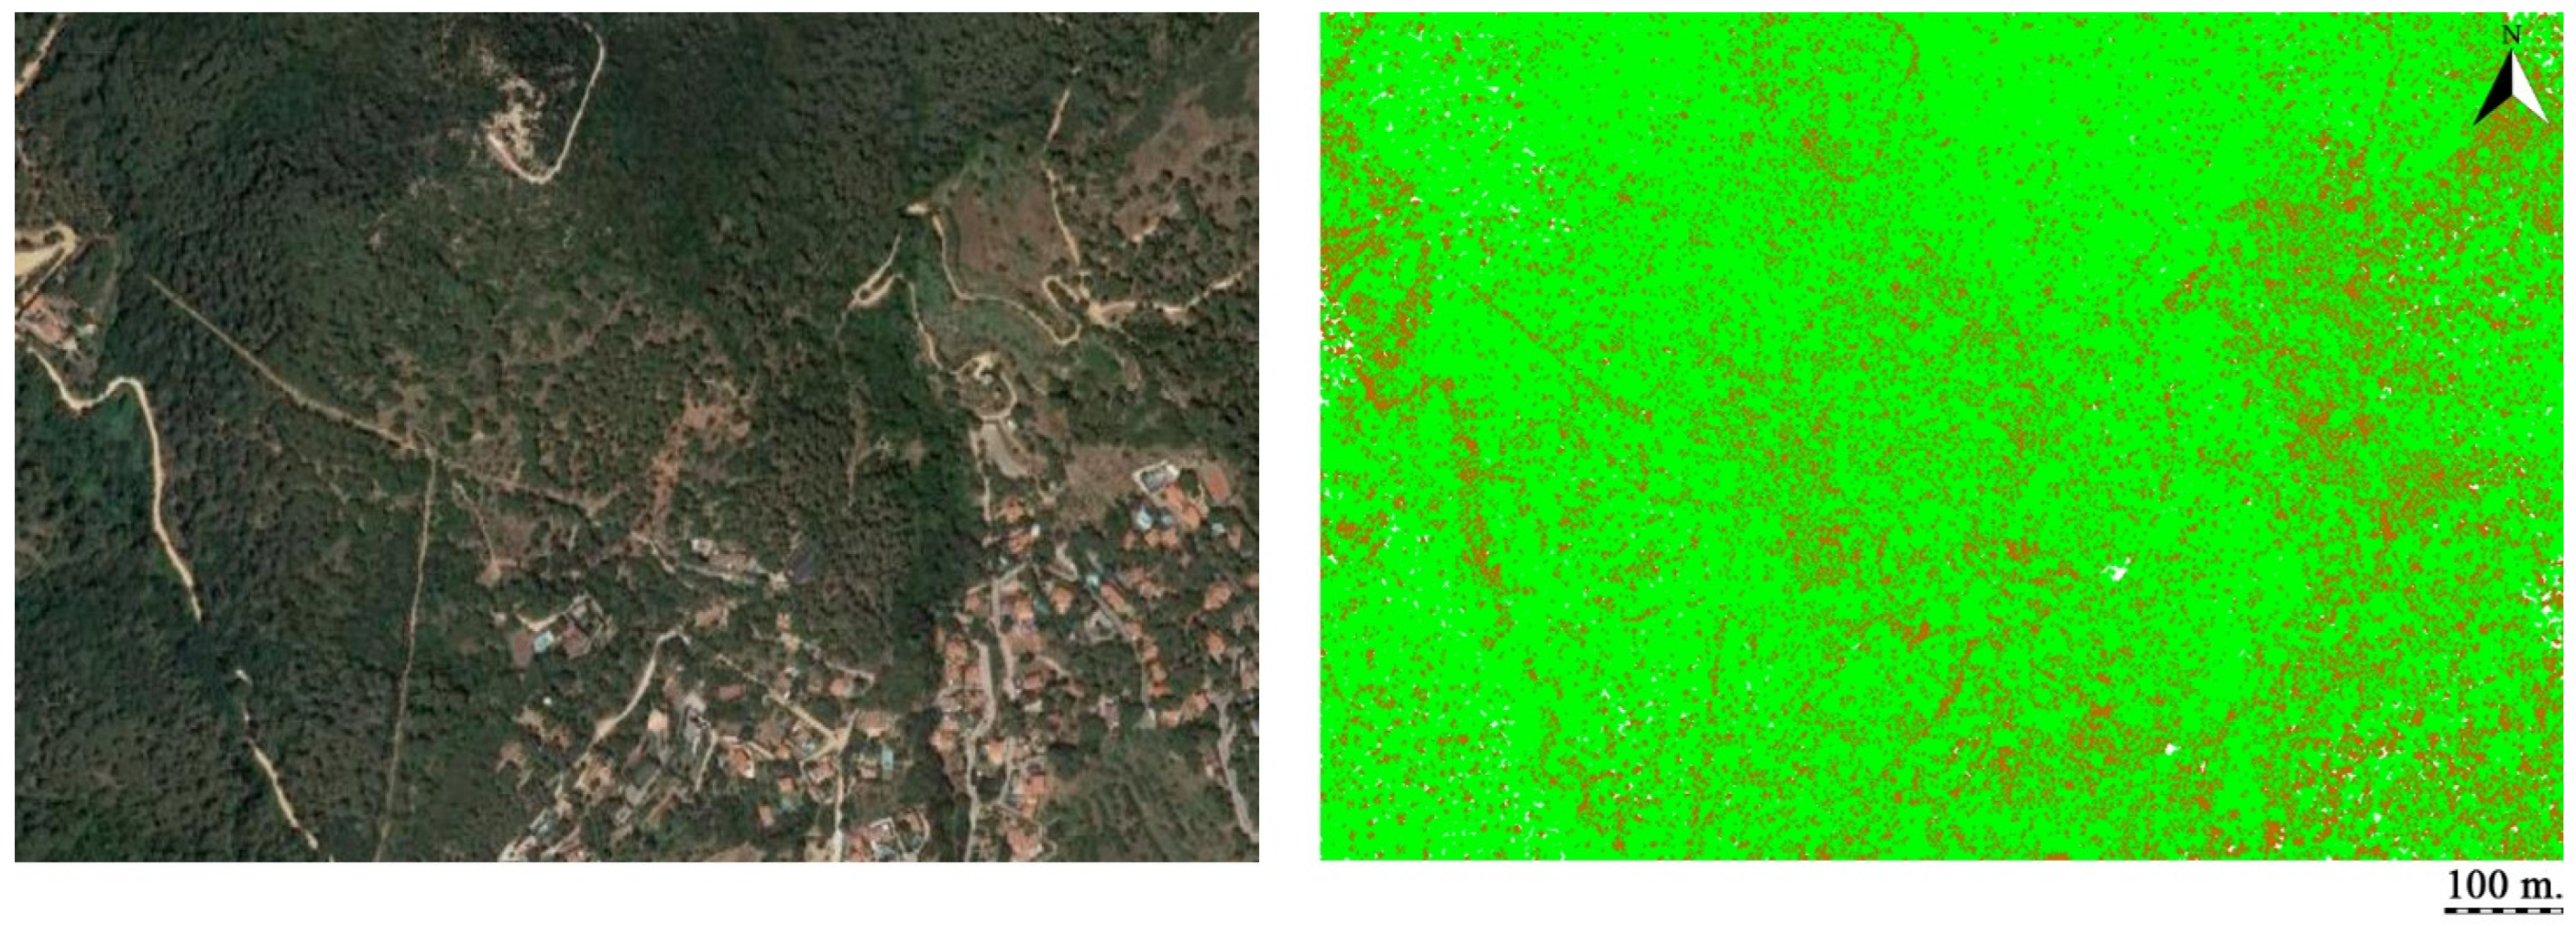
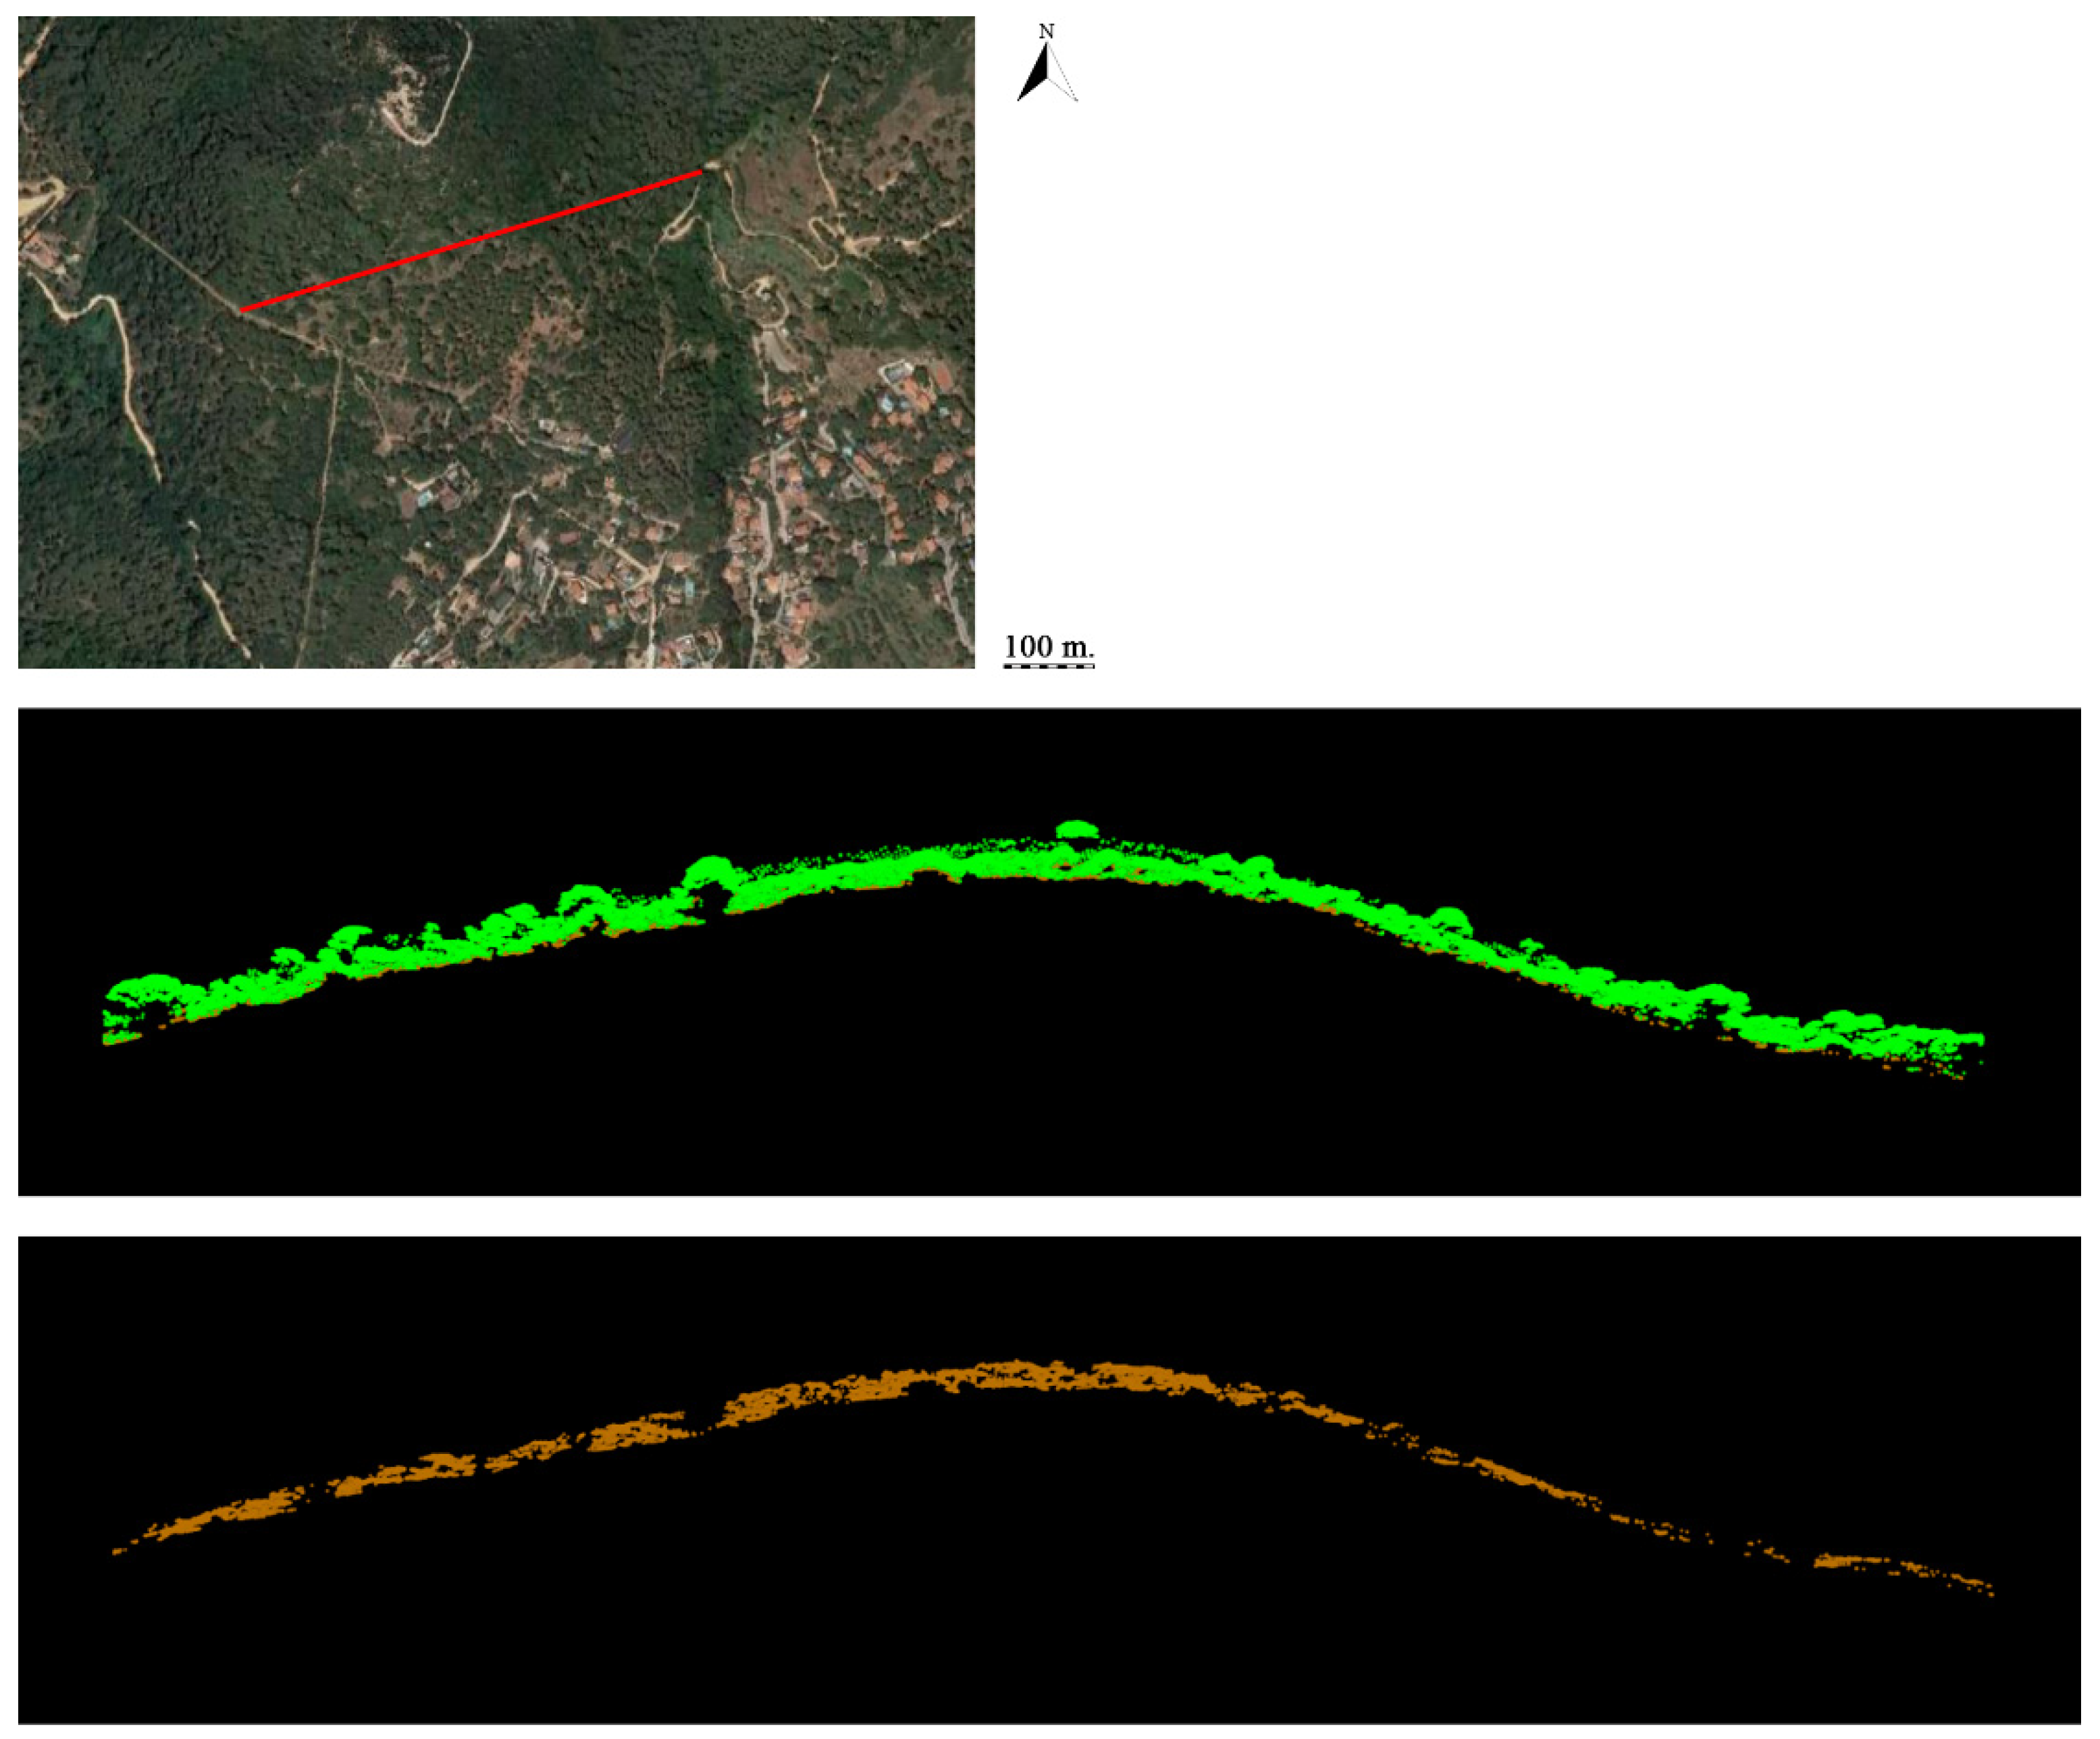
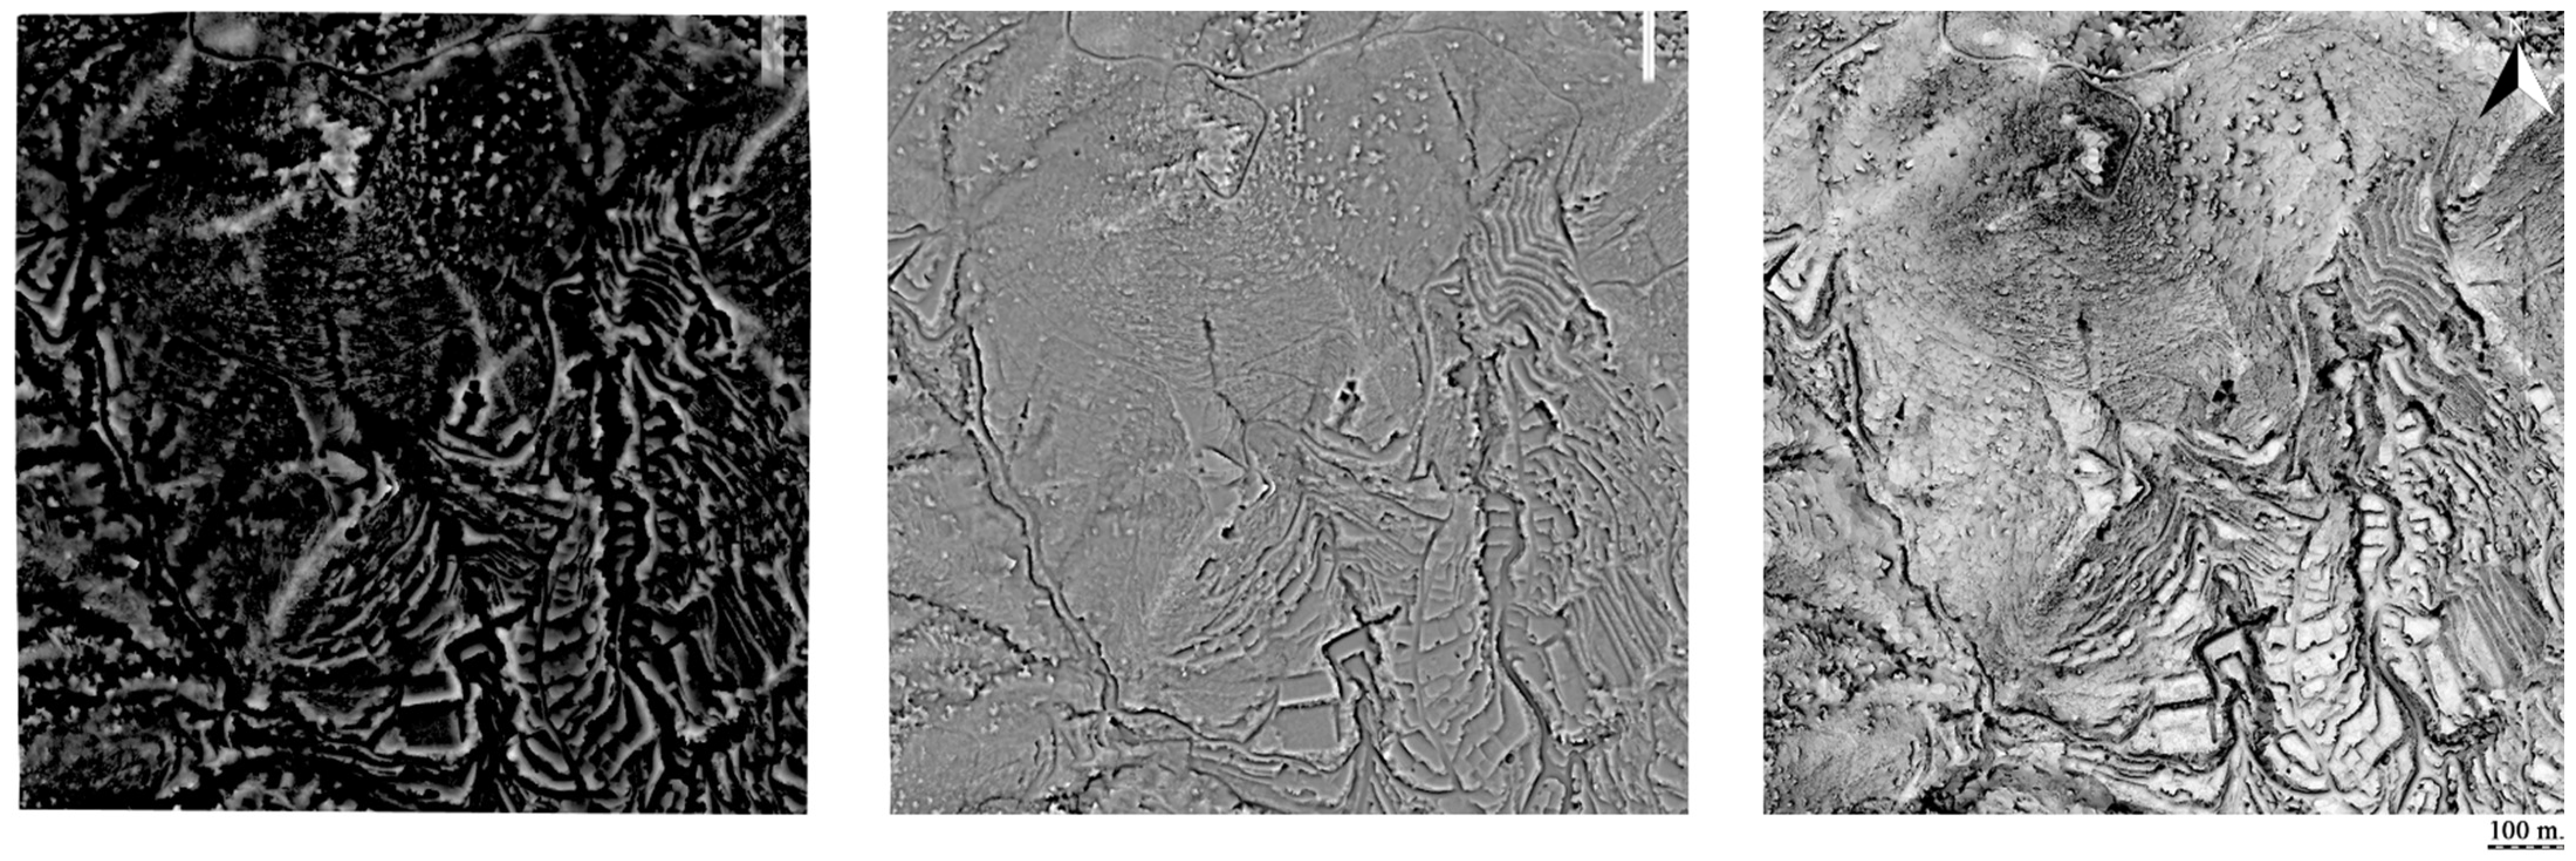
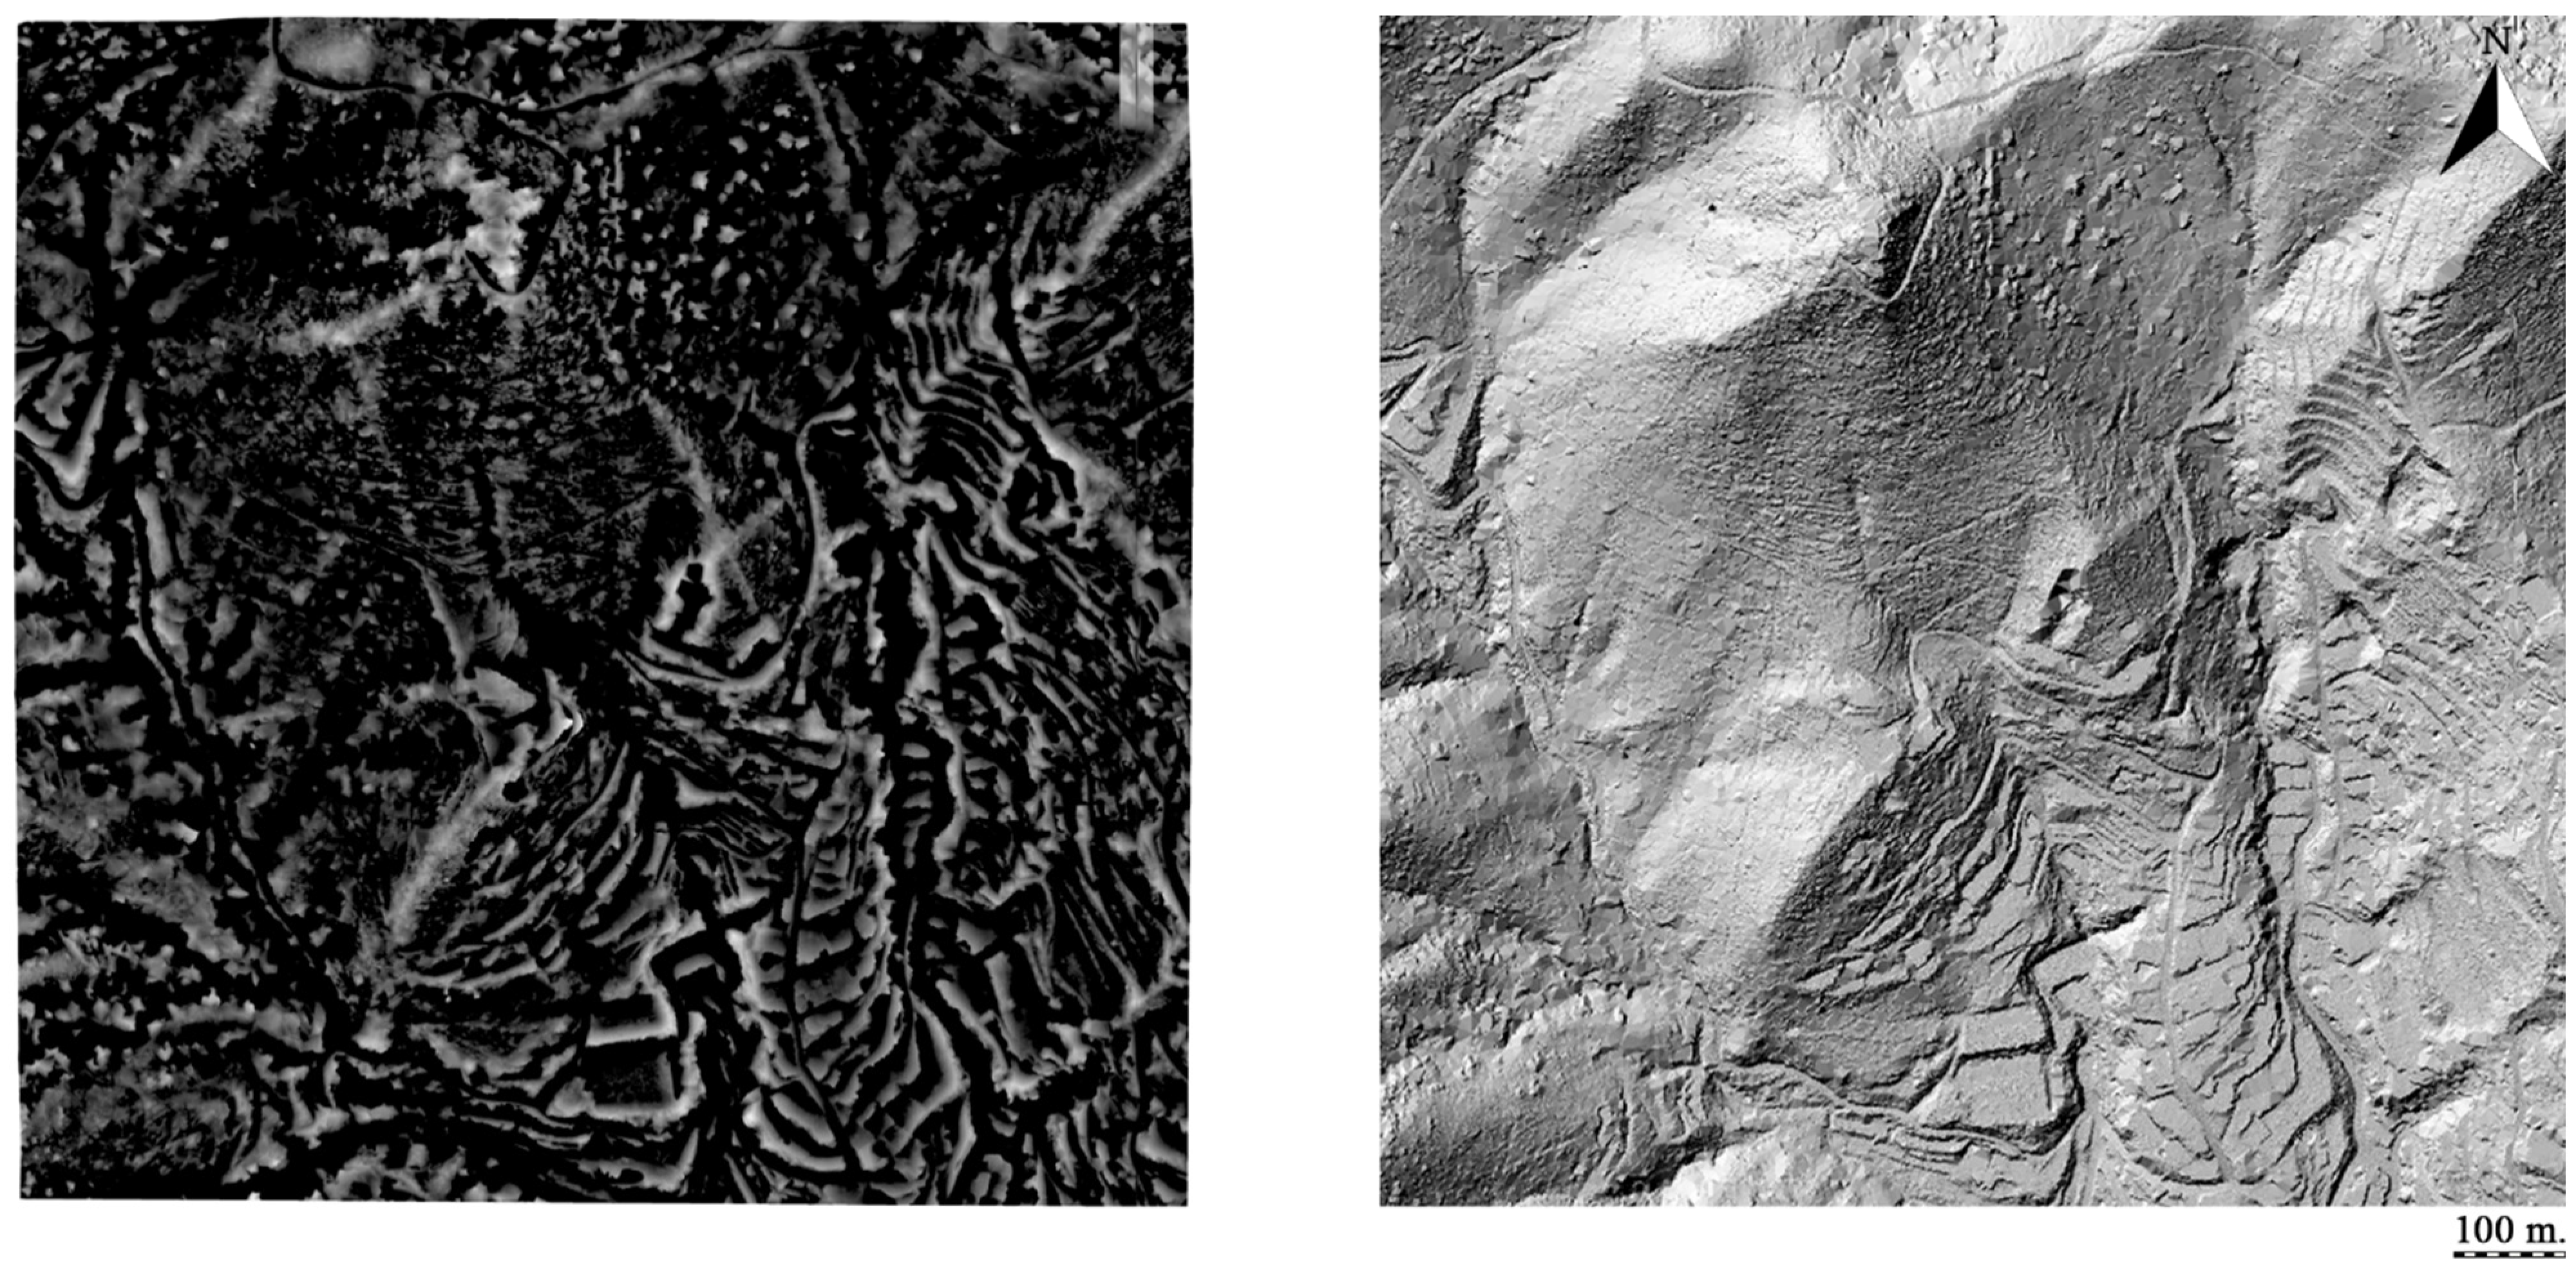
4. Results
5. Discussion
- It will allow for the estimation of the potential population and hierarchies between sites;
- It will allow for the development of conscientious excavation planning, which can now focus on intramural areas and not waste efforts in potentially uninhabited sectors;
- It will allow for more informed heritage protection measures, which will be able to take into account the site as a whole and not just the small area where remains have been detected.
6. Conclusions
Author Contributions
Funding
Institutional Review Board Statement
Informed Consent Statement
Data Availability Statement
Acknowledgments
Conflicts of Interest
References
- Bewley, R.; Crutchley, S.; Shell, C. New light on an ancient landscape: LIDAR survey in the Stonehenge World Heritage Site. Antiquity 2005, 79, 636–647. [Google Scholar] [CrossRef]
- Evans, D.; Pottier, C.; Fletcher, R.; Hensley, S.; Tapley, I.; Milne, A.; Barbetti, M. A comprehensive archaeological map of the world’s largest preindustrial settlement complex at Angkor, Cambodia. Proc. Natl. Acad. Sci. USA 2007, 104, 14277–14282. [Google Scholar] [CrossRef] [PubMed]
- Opitz, R.S.; Ryzewski, K.; Cherry, J.F.; Malone, B. Using airborne LiDAR Survey to explore historic-era archaeological landscapes of Montserrat in the eastern Caribbean. J. Field Archaeol. 2015, 40, 523–541. [Google Scholar] [CrossRef]
- Parcero-Oubiña, C. At Last! Remote-Sensing Discovery of Archaeological Features through Aerial Imagery and Lidar in Galician Hillforts. AARGnews 2022, 64, 22–33. [Google Scholar]
- Amable, G.; Devereux, B.; Crow, P.; Cliff, A.D. The potential of airborne LiDAR for detection of archaeological features under woodland canopies. Antiquity 2005, 79, 648–660. [Google Scholar]
- Doneus, M.; Mandlburger, G.; Doneus, N. Archaeological Ground Point Filtering of Airborne Laser Scan Derived Point-Clouds in a Difficult Mediterranean Environment. JCAA 2020, 3, 92–108. [Google Scholar] [CrossRef]
- Orengo, H.A.; Petrie, C.A. Large-scale, multi-temporal remote sensing of palaeo-river networks: A case study from northwest India and its implications for the Indus Civilisation. Remote Sens. 2017, 9, 735. [Google Scholar] [CrossRef]
- Garcia, A.; Orengo, H.A.; Conesa, F.C.; Green, A.S.; Petrie, C.A. Remote Sensing and Historical Morphodynamics of Alluvial Plains. The 1909 Indus Flood and the City of Dera Ghazi Khan (Province of Punjab, Pakistan). Geosciences 2019, 9, 21. [Google Scholar] [CrossRef]
- Rayne, L.; Gatto, M.C.; Abdulaati, L.; Al-Haddad, M.; Sterry, M.; Sheldrick, N.; Mattingly, D. Detecting Change at Archaeological Sites in North Africa Using Open-Source Satellite Imagery. Remote Sens. 2020, 12, 3694. [Google Scholar] [CrossRef]
- Agapiou, A.; Alexakis, D.D.; Hadjimitsis, D.G. Potential of virtual earth observation constellations in archaeological research. Sensors 2019, 19, 4066. [Google Scholar] [CrossRef]
- Orengo, H.A.; Conesa, F.C.; Garcia-Molsosa, A.; Lobo, A.; Green, A.S.; Madella, M.; Petrie, C.A. Automated detection of archaeological mounds using machine learning classification of multi-sensor and multi-temporal satellite data. Proc. Natl. Acad. Sci. USA 2020, 117, 18240–18250. [Google Scholar] [CrossRef] [PubMed]
- Berganzo-Besga, I.; Orengo, H.A.; Lumbreras, F.; Carrero-Pazos, M.; Fonte, J.; Vilas-Estévez, B. Hybrid MSRM-Based Deep Learning and Multitemporal Sentinel 2-Based Machine Learning Algorithm Detects Near 10k Archaeological Tumuli in North-Western Iberia. Remote Sens. 2021, 13, 4181. [Google Scholar] [CrossRef]
- Orengo, H.A.; Petrie, C.A. Multi-scale relief model (MSRM): A new algorithm for the visualization of subtle topographic change of variable size in digital elevation models. Earth Surf. Process. Landf. 2018, 43, 1361–1369. [Google Scholar] [CrossRef] [PubMed]
- Guyot, A.; Lennon, M.; Hubert-Moy, L. Objective comparison of relief visualization techniques with deep CNN for archaeology. J. Archaeol. Sci. Rep. 2021, 38, 103027. [Google Scholar] [CrossRef]
- Belarte, M.C.; Canela, J.; Orengo, H.A.; Berganzo-Besga, I. Using LIDAR to detect architectural features in urban sites in the coast of Northern Iberia (6th–3rd centuries BC). In Urbanization in Iberia and Mediterranean Gaul in the First Millennium BC, 1st ed.; Treballs de la Mediterrània Antiga, 7, Belarte, M.C., Noguera, J., Plana-Mallart, R., Sanmartí, J., Eds.; ICAC: Tarragona, Spain, 2020; Volume 1, pp. 137–148. [Google Scholar]
- Barberà, J.; Pascual, R. Burriac, un yacimiento protohistórico de la costa catalana (Cabrera de Mar, Barcelona). Ampurias 1980, 41–42, 203–242. [Google Scholar]
- Oliva, M. El poblado ibérico de Castell Barri. Ampurias 1947, 9–10, 288–293. [Google Scholar]
- Riuró, F. El poblado de La Creueta. Ampurias 1943, 5, 117–131. [Google Scholar]
- Estrada, J. Síntesis Arqueológica de Granollers y sus Alrededores, 1st ed.; Museo de Granollers: Granollers, Spain, 1955. [Google Scholar]
- Garcia Molsosa, A.; Flórez Santasusana, M.; Palet Martínez, J.M. Arqueología del paisaje en el entorno de «Lauro»: Una aproximación microrregional a la construcción del territorio romano en el noreste de la Península Ibérica. Zephyrus 2015, 76, 99–119. [Google Scholar]
- Asensio, D.; Guitart, J. El Jaciment ibèric de la Muntanya de Sant Miquel. Montornès del Vallès i Vallromanes. Recull de Documentació i assaig d’interpretació, 1st ed.; Diputació de Barcelona: Barcelona, Spain, 2010. [Google Scholar]
- Fortó, A.; Maese, X. La Torre Roja: Un jaciment ibèric i medieval (Caldes de Montbui, Vallès Oriental; Sentmenat, Vallès Occidental). Trib. D’arqueologia 2010, 2009–2010, 113–152. [Google Scholar]
- Sanmartí, J. From the archaic states to romanization: A historical and evolutionary perspective on the Iberians. Catalan Hist. Rev. 2009, 2, 9–32. [Google Scholar]
- (Coord) Fernández, A.; Hernando, A.; Maillo, J.M.; Muñoz, F.J.; Quesada, J.M.; Ripoll, S. Prehistoria II. Las sociedades metalúrgicas, 2nd ed.; Editorial Universitaria Ramón Areces: Madrid, Spain, 2015; pp. 665–689. [Google Scholar]
- Asensio, D.; Morer, J.; Rigo, A.; Sanmartí, J. Les formes d’organització social i económica a la Cossetània ibèrica: Noves dades sobre l’evolució i tipología dels assentaments entre els segles VII-I a.C. In Territori Polític i Territori Rural Durant L’edat del Ferro a la Mediterrània Occidental. Actes de la Taula Rodona celebrada a Ullastret, 1st ed.; Martí, A., Plana, R., Eds.; Museu d’Arqueologia de Catalunya-Ullastret: Girona, Spain, 2001; Volume 1, pp. 253–271. [Google Scholar]
- Orengo, H.A.; Ejarque, A.; Albiach, R. Water management and land-use practices from the Iron-Age to the Roman period in Eastern Iberia. J. Archaeol. Sci. 2014, 49, 265–275. [Google Scholar] [CrossRef]
- Aguilera, M.J.; Borderías, M.P.; González, M.P.; Santos, J.M. Geografía General I (Geografía Física), 1st ed.; Editorial Universidad Nacional de Educación a Distancia: Madrid, Spain, 2009; pp. 266–271. [Google Scholar]
- Wehr, A.; Lohr, U. Airborne laser scanning—An introduction and overview. ISPRS J. Photogramm. Remote Sens. 1999, 54, 68–82. [Google Scholar] [CrossRef]
- Hesse, R. LiDAR-derived Local Relief Models—A new tool for archaeological prospection. Archaeol. Prospect. 2010, 17, 67–72. [Google Scholar] [CrossRef]
- Gutiérrez-Antuñano, M.A.; Tiana-Alsina, J.; Rocadenbosch, F.; Sospedra, J.; Aghabi, R.; González-Marco, D. A wind-lidar buoy for offshore wind measurements: First commissioning test-phase results. In IEEE International Geoscience and Remote Sensing Symposium (IGARSS), 1st ed.; IEEE: Fort Worth, TX, USA, 2017; pp. 1607–1610. [Google Scholar]
- Besl, P.J.; McKay, N.D. A method for registration of 3-D shapes. In IEEE Transactions on Pattern Analysis and Machine Intelligence; IEEE Computer Society: Washington, DC, USA, 1992; Volume 14, pp. 239–256. [Google Scholar] [CrossRef]
- Zakšek, K.; Oštir, K.; Kokalj, Ž. Sky-View Factor as a Relief Visualization Technique. Remote Sens. 2011, 3, 398–415. [Google Scholar] [CrossRef]
- Doneus, M. Openness as Visualization Technique for Interpretative Mapping of Airborne Lidar Derived Digital Terrain Models. Remote Sens. 2013, 5, 6427–6442. [Google Scholar] [CrossRef]
- Kokalj, Ž.; Hesse, R. Airborne Laser Scanning Raster Data Visualization: A Guide to Good Practice, 1st ed.; Založba ZRC: Ljubljana, Slovenia, 2017. [Google Scholar]
- Gorelick, N.; Hancher, M.; Dixon, M.; Ilyushchenko, S.; Thau, D.; Moore, R. Google Earth Engine: Planetary-scale geospatial analysis for everyone. Remote Sens. Environ. 2017, 202, 18–27. [Google Scholar] [CrossRef]
- Faniel, I.; Kansa, E.; Whitcher Kansa, S.; Barrera-Gomez, J.; Yakel, E. The challenges of digging data: A study of context in archaeological data reuse. In Proceedings of the 13th ACM/IEEE-CS Joint Conference on Digital Libraries, Indianapolis, IN, USA, 22–26 July 2013; ACM: New York, NY, USA, 2013; pp. 295–304. [Google Scholar]
- Opitz, R.; Herrmann, J. Recent Trends and Long-standing Problems in Archaeological Remote Sensing. J. Comput. Appl. Archaeol. 2018, 1, 19–41. [Google Scholar] [CrossRef]


Publisher’s Note: MDPI stays neutral with regard to jurisdictional claims in published maps and institutional affiliations. |
© 2022 by the authors. Licensee MDPI, Basel, Switzerland. This article is an open access article distributed under the terms and conditions of the Creative Commons Attribution (CC BY) license (https://creativecommons.org/licenses/by/4.0/).
Share and Cite
Berganzo-Besga, I.; Orengo, H.A.; Canela, J.; Belarte, M.C. Potential of Multitemporal Lidar for the Detection of Subtle Archaeological Features under Perennial Dense Forest. Land 2022, 11, 1964. https://doi.org/10.3390/land11111964
Berganzo-Besga I, Orengo HA, Canela J, Belarte MC. Potential of Multitemporal Lidar for the Detection of Subtle Archaeological Features under Perennial Dense Forest. Land. 2022; 11(11):1964. https://doi.org/10.3390/land11111964
Chicago/Turabian StyleBerganzo-Besga, Iban, Hector A. Orengo, Joan Canela, and Maria Carme Belarte. 2022. "Potential of Multitemporal Lidar for the Detection of Subtle Archaeological Features under Perennial Dense Forest" Land 11, no. 11: 1964. https://doi.org/10.3390/land11111964
APA StyleBerganzo-Besga, I., Orengo, H. A., Canela, J., & Belarte, M. C. (2022). Potential of Multitemporal Lidar for the Detection of Subtle Archaeological Features under Perennial Dense Forest. Land, 11(11), 1964. https://doi.org/10.3390/land11111964