Article

Function Evaluation and Coordination Analysis of Production–Living–Ecological Space Based on the Perspective of Type–Intensity–Connection: A Case Study of Suzhou, China

School of Architecture and Urban Planning, Suzhou University of Science and Technology, Suzhou 215011, China
*
Author to whom correspondence should be addressed.
Land 2022, 11(11), 1954; https://doi.org/10.3390/land11111954
Submission received: 5 October 2022 / Revised: 26 October 2022 / Accepted: 31 October 2022 / Published: 2 November 2022
(This article belongs to the Special Issue Territory Spatial Planning toward High-Quality Development in China)

Abstract

:
The function evaluation and coordination analysis of production–living–ecological space is of great significance for guiding the high-quality development of territorial space. Considering the complexity of territorial space, this study constructed the evaluation index system of production–living–ecological spatial functions based on the perspective of “type–intensity–connection” and used multisource data to conduct empirical analysis in Suzhou, China, as an example. The results show that there were significant regional and urban-rural differences in the production–living–ecological comprehensive functional level of Suzhou, and it presents a composite spatial structure characterized by core-agglomeration, multipoint-dispersion, and centre-periphery. Among them, the functions of production and living spaces were concentrated with high values and have similar spatial structure, while the function of ecological space has low values and is distributed in contiguous areas around the production and living spaces. Overall, the coordination relationships of living–production space, ecological–living space and ecological–production space show significant positive, negative and negative correlations, respectively. However, in local space, the coordination relationship was composed of two types of leading relationships. This mainly reflects the great coordination between production space and living space, while the coordination between ecological space and other space is poor and needs to be improved. Therefore, it’s necessary to continuously improve the adequacy and balance of the functional quality of production–living–ecological space and increase organic connectivity and benign integration.

1. Introduction

Territorial space is a dynamic, multidimensional and complex spatiotemporal giant system of human–land relations formed by the development of spatial regions along the time axis with the participation of human activities [1]. The three industrial revolutions have not only promoted the rapid development of global urban industrialization and urbanization, but also brought about problems of inefficient utilization of productive land, insufficient allocation of living facilities, ecological environment deterioration and other disorders of territorial space. To promote the balance of spatial development and protection and to realize the scientific layout and integrated control of spatial resources, a number of countries have developed their own spatial planning in practice. The European Spatial Development Plan (ESDP) classifies space according to regional functions, population and administrative elements [2]. The UK has prepared a spatial plan based on the three dimensions of economy, society and environment [3]. Spatial planning of the United States consists of a comprehensive framework of “livable communities, human capital, transterritorial governance, and regional mobility” [4]. Japan has compiled a spatial planning focusing on production, ecological and environmental changes, and improvement of people’s living standards [5]. Germany has carried out a spatial planning model that includes economic, transportation, social services and sustainable use of resources [6]. Throughout the spatial planning of these countries, they all regard sustainable development as the core value orientation. They point to the goals of optimization of territorial spatial pattern, spatial governance capacity and sustainable development of social and economic standards. The spatial planning types of these countries focus on the balanced and coordinated development of economy, society, culture and ecology, which coincides with the concept of ecological civilization in China. China’s territorial space planning aims to adapt to the era background of industrial civilization turning to ecological civilization. It absorbs the experience of overseas spatial planning for reference, and constantly blends with local planning practices to build a territorial space planning system (NTSP). NTSP has the core value of giving priority to ecological civilization construction. NTSP further puts forward the characteristic requirements of “promoting intensive and efficient production space, habitable and appropriate living space, green and graceful ecological space” [7]. The goal of production–living–ecological spatial optimization is in line with the sustainable development path of “developed production, affluent living and excellent ecology”. It is an inevitable choice for promoting production–living–ecological spatial optimization to realize the path of sustainable economic and social development. Based on the research on the classification and representation system of production–living–ecological space with multilevel and all elements under a blueprint, it is committed to achieving the coordinated optimization of production–living–ecological space. This strategy has been widely accepted by Chinese academia and government departments [8]. Therefore, defining how to carry out the refined identification and function evaluation of production–living–ecological space, clarify the coordination relationship between space’s functions, and make orderly adjustments to the optimal configuration of the production–living–ecological space, can not only improve space quality, reduce conflict and effectively play the coordination effect of territorial space functions, but also have important significance to optimize the layout of ecological civilization space and meet people’s aspirations for a better life [9].
The classification and evaluation system of production–living–ecological space is the basis of building a reasonable spatial development and protection pattern. The production–living–ecological space covers multifunctional products coupled with the living factors of land, economy, energy, ecology and other systems, such as aboveground production activities, residents’ material and spiritual life security, material and energy flow and ecological environment regulation. Production–living–ecological species are both independent and interrelated, with symbiotic integration and constraint effects [10]. The existing studies mainly focus on fields such as production–living–ecological space type [11,12], intensity [13,14], connection [15,16,17,18,19], coupling coordination [20,21,22], etc. In terms of space type, researchers believe that there is a certain connection between land and production, living and ecology, which plays an important role in coordinating production–living–ecological space [20]. Therefore, the production–living–ecological space is divided according to people’s differentiated land use modes, production inputs and activity maintenance capabilities [11]. However, the fact that crossed and mixed spatial functions of the same territory lead to errors and exclusivity in spatial identification has given rise to quantitative identification of production–living–ecological spatial functions. The production–living–ecological spatial functions are visualized in abstract points in the form of POI data, and the spatial intensity of production–living–ecological is evaluated [23]. In terms of connection, traffic accessibility [24,25] explored the flow of factors related to the formation of life and production functions, and the minimum resistance model of ecological functions [26,27] explored the influencing factors of internal elements of ecological space. The combination of the two further explored the space law of production–living–ecological space. In terms of spatial coordination, the coupling coordination degree model [28], mechanical equilibrium model [29] and spatial autocorrelation analysis method [30] are mainly used to calculate the spatial coordination level of production–living–ecological space, reflecting the comprehensive relationship of the three spatial functions. However, this research ignored the interaction between pairwise spatial functions, thus it is difficult to propose specific governance strategies. Additionally, on the research scale of existing studies, the evaluation spatial units are mostly meso or macro scales, based on the statistical data and the macro pattern of territorial space, serving the macro decision-making of territorial development and protection. However, the type, intensity and connection of the crowd activities’ actual demand on the territorial spatial pattern are not reflected enough, which makes it difficult to guide the optimization of territorial space and grass-roots government within the city. In short, due to insufficient data accuracy and incomplete methodology, it is difficult to meet the optimization and implementation of territorial governance in a large range of high precision.
Based on this information, this study constructs an evaluation system of production–living–ecological spatial functions according to the concept of production–living–ecological space, which covers the integration of spatial type-intensity connections. On the basis of land classification and evaluation, to ensure the refinement of the spatial analysis scale of production–living–ecological spatial function comprehensive evaluation and function coordination, a 100-m grid scale was taken as the basic unit of spatial research. The study is dedicated to identifying the functional level distribution pattern of production–living–ecological space, and quantitatively explaining the relationship among the three types spatial functions of production, living and ecological to provide a scientific basis for the optimization of territorial space. Suzhou is used as an example, using POI data, which carry a large amount of data and spatial entity attributes, and high-precision land use data to conduct specific empirical analyses.

2. Materials and Methods
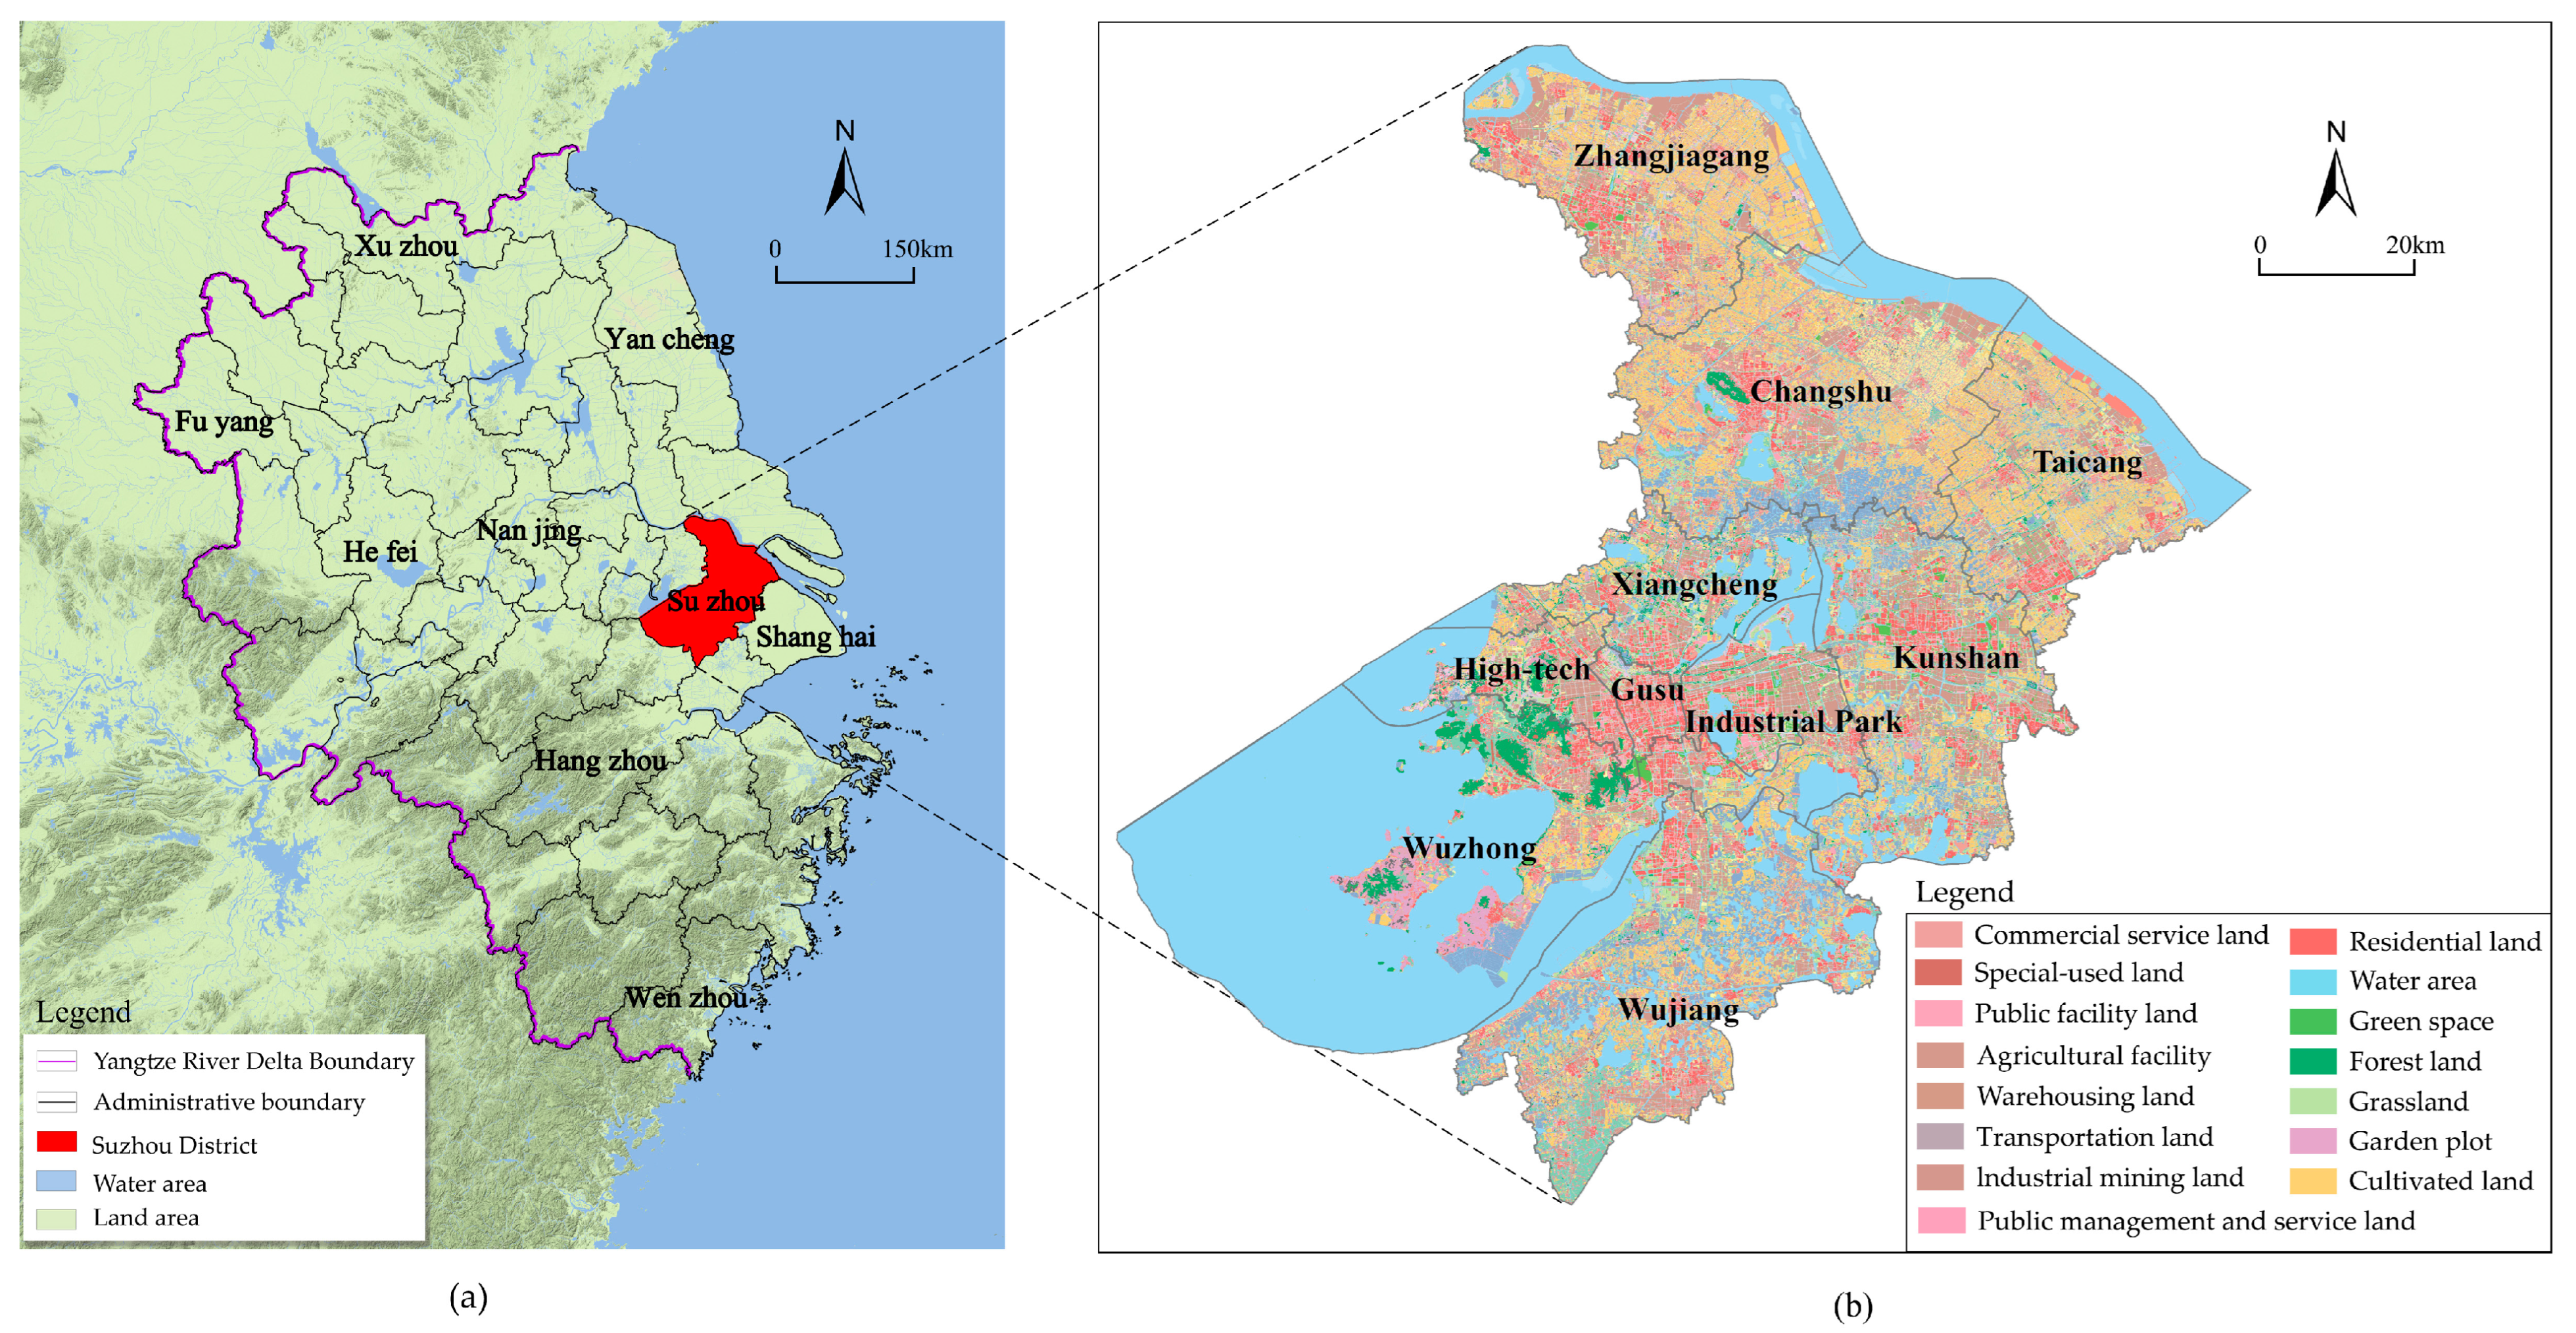
2.1. Study Area

The Yangtze River Delta region is one of the most active regions in the economic development of China, playing a decisive strategic position in national modernization development. It consists of 41 cities, including Shanghai, Jiangsu Province, Zhejiang Province and Anhui Province. Suzhou is one of the most important central cities in the Yangtze River Delta, located between 119°55′–121°20′ E and 30°47′–32°02′ N, with Shanghai to the east, Zhejiang to the south, Taihu Lake to the west and the Yangtze River to the north (Figure 1). The city’s topography is low and flat, with scattered low hills and a complicated hydrological system. The city has 5 municipal districts and 4 county-level cities, with a total area of 8657.32 km2. By 2020, Suzhou had a permanent resident population of 12.75 million, with an urbanization rate of 81.72%. The economic development and industrial structure of Suzhou are far in excess of the national average. At the same time, Suzhou’s industrial chain, trade circulation and resource services are all in line with international standards, representing a type of international city. However, with the rapid progress of urbanization, the internal land use of Suzhou has changed significantly, resulting in production and living and ecological space being incompatible with high-speed economic and social development. There are problems such as land space disorder, conflict intensification between economic development and ecological protection and fierce competition for space resources. Therefore, determining the efficient and intensive utilization of territorial space and the coordinated development of spatial function zoning is of great significance to the development and protection of territorial space in Suzhou.

2.2. Data Sources and Processing

2.2.1. Land Use Data

Interpretation of land use data of the Suzhou municipal administrative area is based on the remote sensing satellite image of GF-2. The spatial resolution of the remote sensing images was 0.8 m under the star and better than 1 m overall, acquired in May 2018. The land use classification was accurate to the second class with reference to the Technical Regulations of the Third Territorial Survey, and the overall classification accuracy was higher than 85%.

2.2.2. POI Data

The POI data of the Suzhou municipal administrative area were acquired in 2020 through Amap, totaling 1,292,500 data points with name, address, latitude, longitude and category attributes, and contains a large amount of production and living space entity information within the city. The large data volume, high precision and wide coverage finely portray the degree of spatial utilization development. According to the territorial spatial functional characteristics, the data were screened and categorized according to the POI source data subcategories, and data cleaning was carried out to finally obtain a total of 208,900 data points, which were divided into 10 major categories and 32 subcategories. ArcGIS 10.7 was applied to coordinate conversion, projection transformation and data analysis.

2.2.3. Road Data

Traffic network data used in this study area were collected from Open Street Map public road data, including highways, territorial roads, provincial roads and urban primary and secondary roads, using ArcGIS10.7 to clean the road data.

2.3. Methods

With the goal of building a sustainable territorial space strategic pattern, the study attached importance to the optimization of the combined structure and the functional value improvement of territorial space, and then proposed a technical framework as shown in Figure 2. In order to obtain the production–living–ecological spatial functional pattern, we built evaluation indicators from types, intensity and connection of the spatial elements, using the variation coefficient method to weigh each index [31]. The study focused on improving the disorder of spatial conflicts, enhancing the benefits of man–land coupling and clarifying the optimization path of territorial spatial functions in the process of high-quality coordinated development. Additionally, we used bivariate spatial autocorrelation to analyze the interactions of space functions from the aspects of quantity and space relationship, so as to clarify the optimization path of land spatial functions in the process of high-quality coordinated development.

2.3.1. Spatial Function Evaluation Index Construction

Production–living–ecological space exhibits different characteristics and assumes different functions in urban development due to its different service targets [32]. Based on the intrinsic properties of the production–living–ecological space, this study considers the endogenous order and sequence structure of spatial supply and builds a functional representation system of the production–living–ecological space in terms of spatial type–intensity–connection (Table 1). Spatial type refers to the type of territory with production, living and ecological characteristics, which is the basis and carrier of the existence of the production–living–ecological space. Because land use has independent functions as well as mixed plots, this study used the strength or weakness assignment of the production, living and ecological spatial functions carried by land use, so as to characterize the spatial type differences. Spatial intensity refers to the development and shaping of production, living and ecological material entities, and characterizes the intensity of utilization of the three spatial types. POI data can reflect the intensity of people’s production and living action in space [33]. Considering the functional and morphological differences of spatial entities, we selected the POI data types of production and living spaces for intensity analysis to represent the differences in development intensity; based on land use types, ecological patches were screened for density statistics to characterize ecological spatial intensity. Spatial connection refers to the flow and interaction of production, living and ecological elements in the corresponding space, reflecting the internal information connection of the production–living–ecological space. According to the flow subjects and characteristics of various spatial elements, time cost assignment was used for cost distance analysis to measure the degree of connection between production and living space. Additionally, we employed flow resistance assignment for cost distance analysis to measure ecological spatial connection [34]. The combination of spatial type, intensity and connection in sequence and interaction form a specific production–living–ecological spatial structure as a whole and express the differentiated spatial function level.
(1) Space Type
Based on the land use data, according to the people’s demand for land use types, the composite functions of the land use and the primary and secondary strengths of the functions, this study assigns a hierarchical score to the functions provided by land use types (Table 2) and obtains the spatial pattern of the production–living–ecological types.
(2) Spatial intensity
The intensity of production and living space mainly depends on the use and shaping of land by the activities of people. By establishing the mapping relationship between POI with production and living space, the density analysis was used to reflect the space intensity. Production space is the space carrier [36] that provides human beings with the management of production and operation activities, such as material production, transportation and trade. It is subdivided into three categories of activity spaces, namely agriculture, industry and service industry, according to the industrial structure. As a result, the corresponding POI data with production, operation and management functions were screened. The living space is mainly a place for people to live, consume and have leisure and entertainment [36]. According to the material and spiritual needs of people, it is subdivided into seven types of activity spaces, including shopping, catering, medical treatment, etc. As a result, the corresponding POI data were screened according to the principle of typical representation and hierarchical differentiation (Table 3). In the representation of ecological spatial intensity, since POI data were point vector data and most of them originate from the physical business of production and life of people, it is difficult to accurately describe ecological elements and entities, so ecological intensity was used to characterize ecological spatial intensity. In terms of analysis indexes selection, based on land use data, ecological patches that can provide ecological products and services were screened, mainly including natural ecological patches such as forest land, grassland and waters, and productive green patches of cultivated land and garden land (Table 3).
(3) Space Connection
The spatial connection analysis method was constructed according to the interaction mode and path of production, and the living and ecological spatial factor flow. Due to the mixed layout of production and living space, the flow of elements was also compounded and crossed; therefore, the flow interaction characteristics of production and living elements are characterized by time cost based on road and land use type. According to the travel modes of roads at all levels, land, types of water and other different spatial objects, we set the traffic speed per hour, calculating the time cost [37] (Table 4), and measuring the flow capacity of production and living factors. Generally, the lower the time cost, the easier the flow interaction of elements, which is reflected in the closer connection of elements within production and living space. The main subjects of ecological spatial flow interaction are plants and animals, and ecological spatial connections are characterized by the strength of resistance to ecological factor flow based on land use type (Table 5). Generally, the lower the resistance value, the closer the connection between the elements within the ecological space. In this study, species-rich and ecologically sensitive forest parks, wetland parks and scenic spots were selected as ecological source sites. Ecological resistance values were determined based on different land use types and the degree of anthropogenic disturbance, and the flow capacity of ecological elements was measured.
(4) Weighing of evaluation indicators
For spatial entity data of different types and grade quantities with different distribution characteristics and influence, the coefficient of the variation method was used for the calculation of weight coefficients of spatial type–intensity–connection indicators to avoid artificial subjectivity. The coefficient of variation was a statistical indicator commonly used in statistics to measure data differences, assigning weights to each indicator according to the magnitude of its variation in the observed values on all evaluated objects; the more balanced the data distribution, the smaller the weight and the lower the urgency of priority improvement, and vice versa [34]. This method reflects the rank difference between resources and the environment and also reflects the bottom-line thinking and short-board thinking of territorial land space optimization. We used Suzhou as an example for empirical analysis. First, we used the range method to standardize the data (Formulas (1) and (2)), and then used the variation coefficient method to calculate the weight of each index (Table 6, Formulas (3)–(6)). The results of the weights in the primary indicators reflect that ecological space is more balanced than production and living space distribution, and the weights of the secondary indicators reflect that production and living space intensity is more unbalanced than spatial type and spatial connection distribution, while ecological space connection distribution is much more balanced than spatial type and spatial intensity.
Standardization of positive indicators:
Y i j = X i j X m i n X m a x X m i n
Standardization of negative indicators:
Y i j = X m a x X i j X m a x X m i n
X i j ¯ = 1 m j = 1 m X i j
σ i j = 1 m j = 1 m ( X i j X i j ¯ ) 2
i j = σ i j X i j ¯
W i j = i j   i j
In the formula, i is the indicator system, j is the jth indicator in the i -level indicator system, and Y i j is the standardized value of the indicator. X i j ,   X m a x ,   X m i n are the actual value, maximum value, and minimum value of the indicator in the i -level indicator system, respectively. m is the number of index samples, respectively the average value, standard deviation and coefficient of variation of the index, and is the index weight.

2.3.2. Spatial Coordination Relationship Model

This study used bivariate spatial autocorrelation to analyze the coordination relationship between spatial functions because this method can describe the spatial association and dependence characteristics of two geographical elements more accurately. We analyzed the coordination relationship between the spatial functions of production–living–ecological space with the help of a bivariate spatial autocorrelation model. To quantify the role relationship between them, the spatial functions of production–living–ecological space were taken as independent and dependent variables, and the coordination relationship between the two functions of production–living–ecological space was obtained. Bivariate global spatial autocorrelation analysis was performed by GeoDa, and the spatial weights were determined by the Rook proximity principle to obtain Moran’s I index, which took values in the range of [–1, 1], so as to measure the quantitative relationship of spatial functional coordination. The values of [–1, 0] reflect the lack of coupling and coordination between one-dimensional spatial function and another dimensional spatial function, thus playing an inverse role in spatial function coordination; [0, 1] reflect that one-dimensional spatial function and other dimensional spatial functions can be coupled and coordinated, and consequently play an isotropic role in spatial function coordination. A larger absolute value of the index indicates a stronger role relationship between spatial functions. Based on the Z value test, bivariate local spatial autocorrelation was used to reveal the spatial distribution characteristics of the relationship. In this study, HH type represents the unit with high-value spatial function, such as the functional level of itself and the surrounding plots. LL type refers the unit with low-value spatial function, such as the mass of itself and the surrounding land. Both of these reflect the aggregation of positive direction relationship with the local adjacent space. HL and LH types are units mixed with high-value and low-value spatial, which are embodied in the aggregation of the negative direction relationship of the local adjacent spaces. NS was not significant, indicating a region with random distribution and no spatial correlation.

3. Results

3.1. Production–Living–Ecological Space Function Level

3.1.1. Functional Level of Production Space

The production space function (Figure 3d) was obtained by superimposing and analyzing the production space type (Figure 3a), spatial intensity (Figure 3b) and spatial connection (Figure 3c). The specific analysis was as follows: (1) The production space function values ranged from 0 to 0.99, with an average value of 0.32, which was a low level overall, and the values vary greatly. (2) Spatially, the very high value areas were mainly concentrated in the central urban areas of Suzhou and four county-level cities, and the high value areas were mainly around the periphery of high value areas and central town areas, spreading outward in a radial pattern. The medium value areas were distributed in a row in the northern township areas of the city and the distant suburbs of the city. The very low value areas are mainly distributed at the Yangtze River, Taihu Lake and other natural mountain lakes, and the low values spread outward around the low values area. (3) This is due to the convergence of production resources and efficient circulation interaction, which enhances the production service values of the central city, while the lagging economic and industrial development and inefficient production connection reduces the production space function of the peripheral townships.

3.1.2. Functional Level of Living Space

The spatial type of living space (Figure 4a), spatial intensity (Figure 4b) and spatial connection (Figure 4c) were superimposed to obtain the spatial function of production (Figure 4d), which was analyzed as follows: (1) The spatial function of living space ranges from 0 to 0.99, with 61.4% of the lower and lower value areas, 23.4% of the middle value areas and 15.2% of the higher and higher value areas; the overall level was low. (2) Spatially, the very high values were concentrated in areas with good accessibility and production clustering space, which were distributed in the central urban areas of Suzhou and four county-level cities, as well as in the residential areas of townships. The high value areas were spread outward at the periphery of the high value areas and scattered star-like at the central towns; the medium value areas were semi-open around the central urban areas and the periphery of the towns; the very low value areas were widely distributed in the rural areas of the townships; and the low value areas were concentrated in the areas of the Yangtze River, Taihu Lake and other large water areas. (3) The possible reason for this is that the rich concentration of public service facilities promotes the value of living services in central urban areas, while the different development levels between urban and rural areas, as well as the single type of living facilities and living space, lead to obvious differences in living functions between urban and rural areas.

3.1.3. Ecological Space Function Level

The ecological spatial type (Figure 5a), spatial intensity (Figure 5b), and spatial connection (Figure 5c) were superimposed and analyzed to obtain the production spatial function (Figure 5d), which was analyzed as follows: (1) The ecological spatial function was between 0 and 1, with a mean value of 0.63, the low and very low type accounting for 26.4%, the medium type accounting for 15.6% and the high and very high type accounting for 58%; therefore, the overall level of function was high. (2) Spatially, the very high value areas were mainly in Taihu Lake, Yangtze River and large lake water areas; the high value areas and middle value areas were distributed in township cultivated land and lake network water areas; the very low value areas and the low value areas were in central urban areas and central townships, which have overlap with the high value areas of production space. (3) The pattern distribution of the ecological spatial function level was shaped by the natural ecological pattern of the region and the urbanization process, but mainly shows more significant urban-rural differences and needs to strengthen the ability to enhance the ecological spatial function within urban areas or to utilize the surrounding ecological spatial resources.

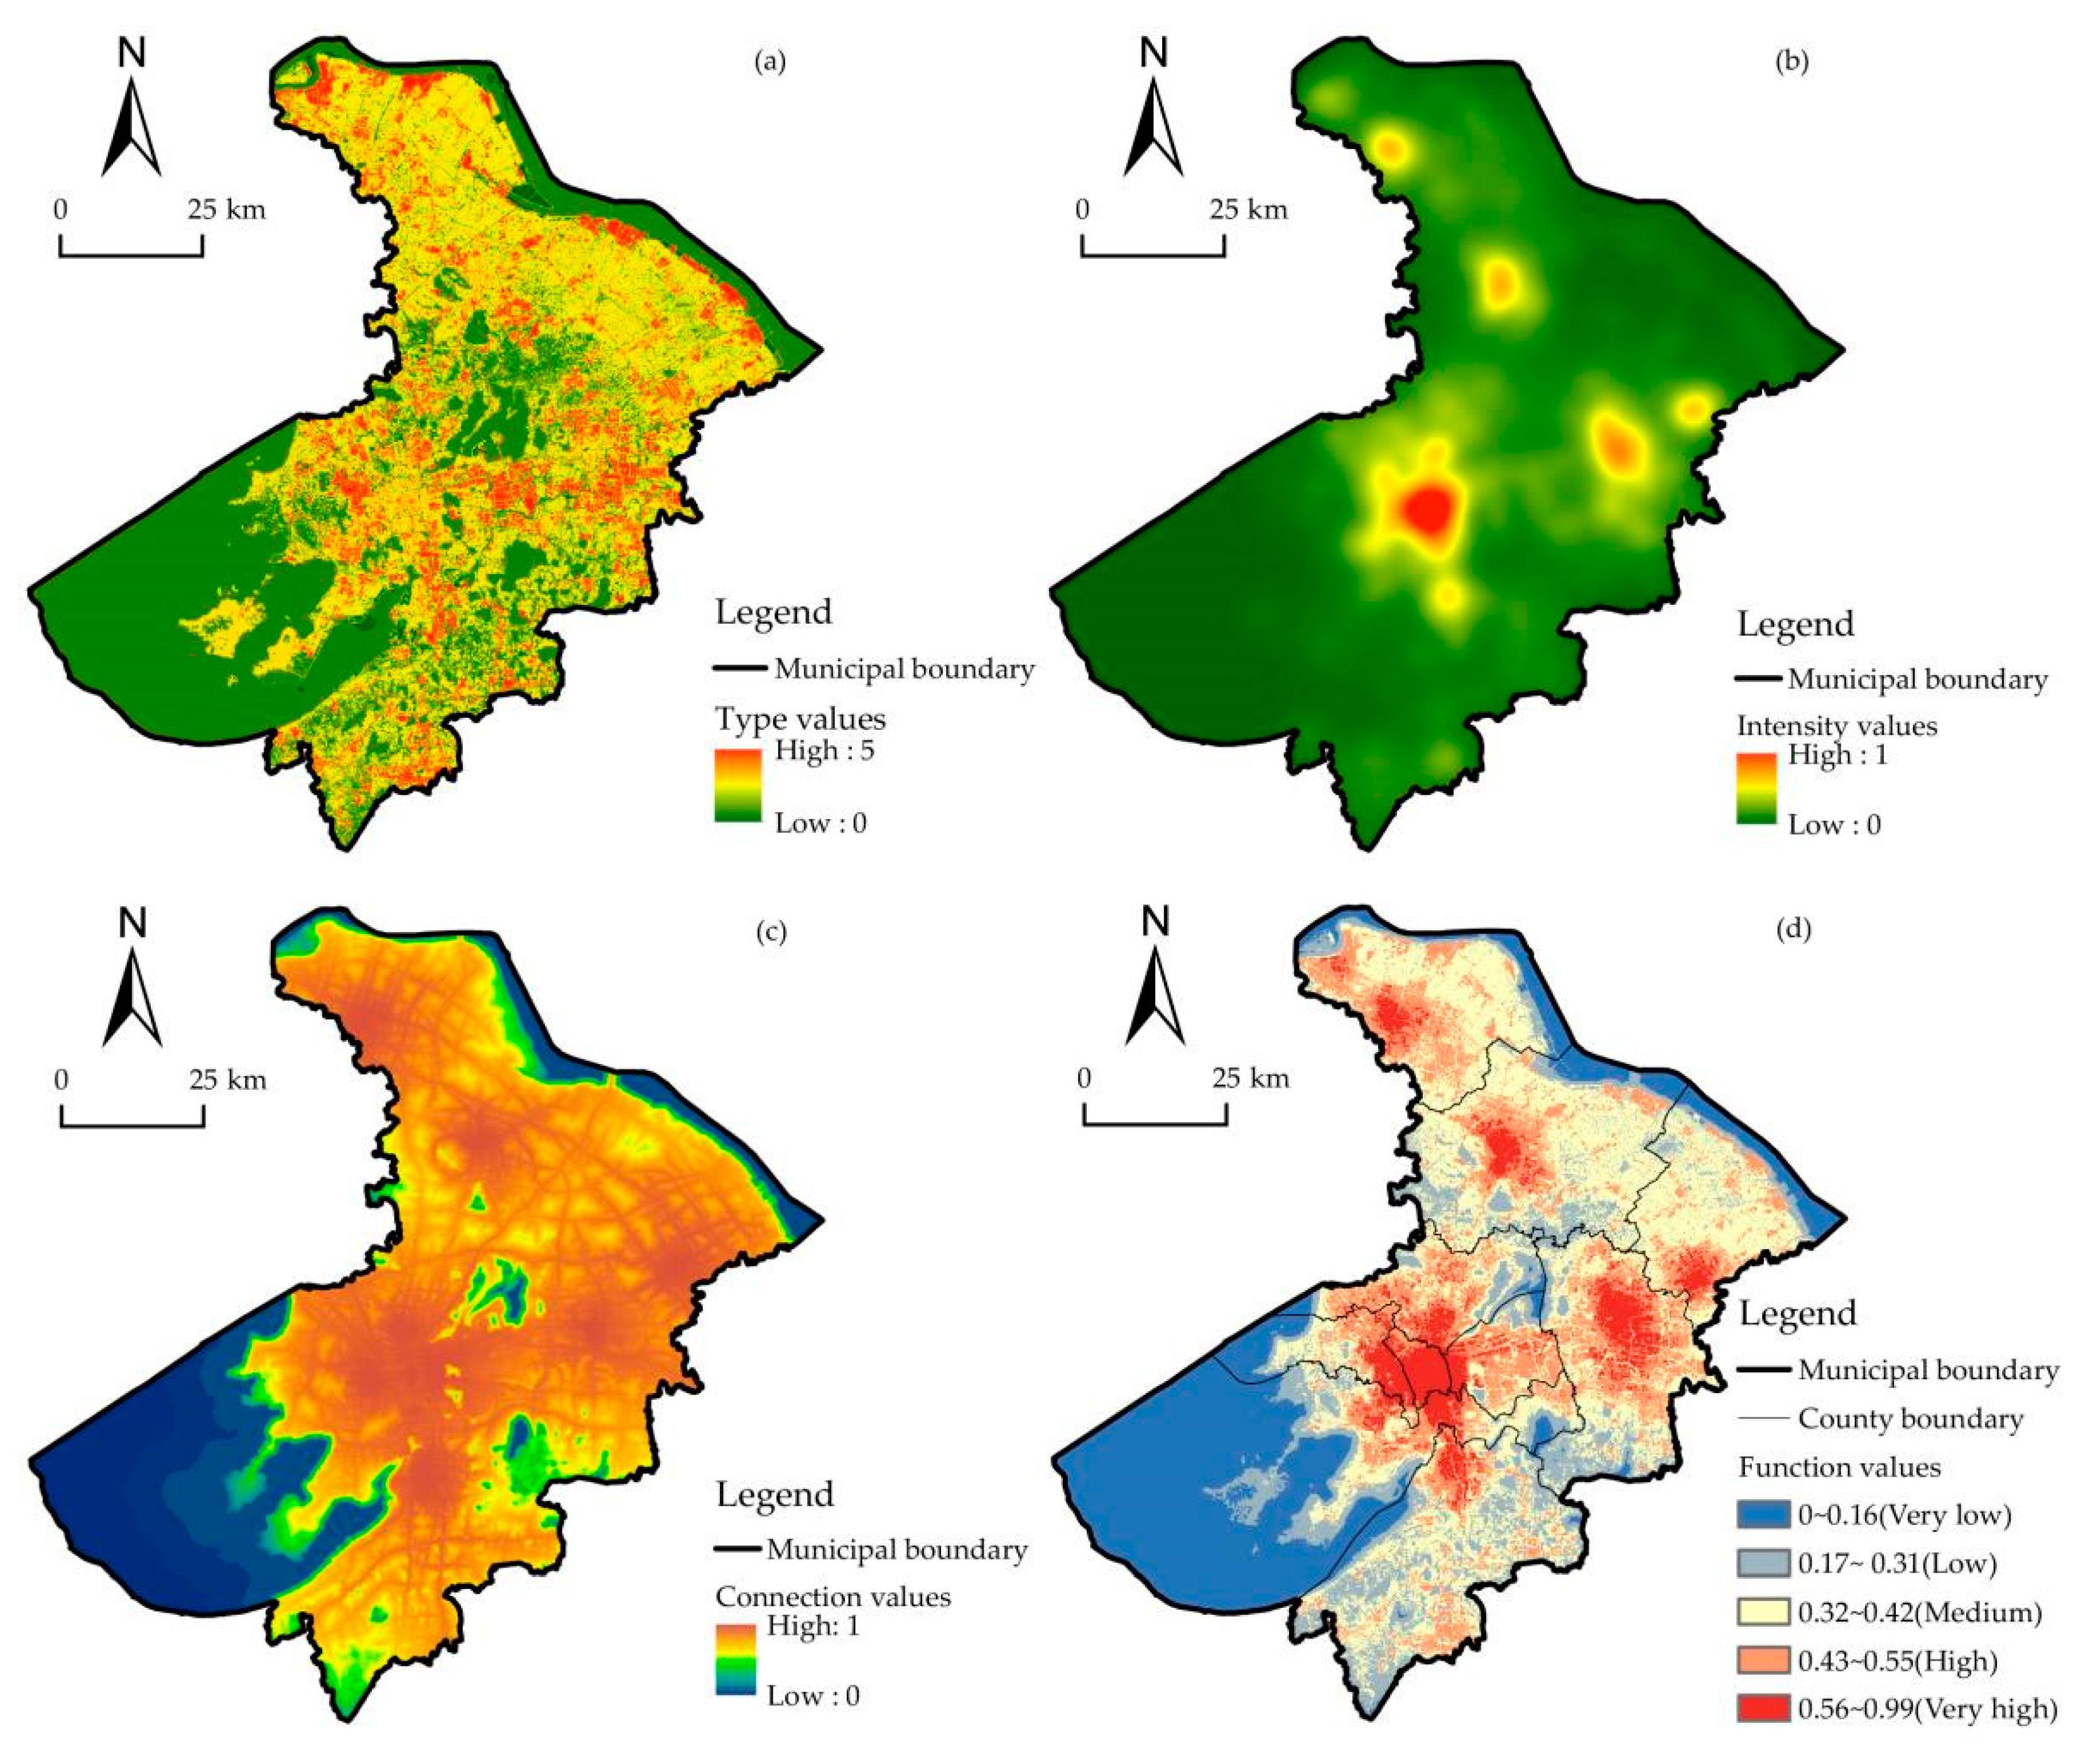
3.1.4. Comprehensive Function Level of Production–Living–Ecological Space

The production–living–ecological spatial functions were superimposed to further analyze and evaluate the comprehensive level of the three spatial functions in Suzhou. From the analysis results (Figure 6), it was concluded that (1) the comprehensive function level value in Suzhou ranged from 0.11 to 0.77, with an average value of 0.34, the low and very low type accounted for 46.2%, the medium value area accounted for 32.6%, the high and very high type accounted for 21.2%, and the overall function level was low. (2) Spatially, the very high and high value areas were distributed in the main urban areas of Suzhou and four county-level cities, which have spatial overlap with the high value areas of production and living space functions; the medium value areas were distributed in the township areas in the northern part of the city and the remote suburban areas at the edge of the city. The low value areas were mainly distributed in clusters. The very low value areas were mainly distributed in groups in Taihu Lake, Yangtze River and southern water network areas, which were consistent with the distribution of lower-value areas of living space function; the low-value areas have relatively single spatial function and weak spatial connection, and were mainly scattered in the peripheral fringes of districts and counties. (3) The reason for this may be that the good resource endowment of the central city and the attraction of elements are mainly oriented to the economic–social process, promoting the production and living of its main spatial functions and integrating part of the ecological space serving production and living spaces, with a higher overall integrated functional level, while the ecologically dominated spatial functions, lacking the integration of production and living elements, have a relatively low integrated function level.

3.2. Production–Living–Ecological Space Function Coordination Relationship

3.2.1. Quantitative Relationship

To seek the coordination of the spatial function role relationships, we further identified the mutual coordination relationship between production–living–ecological space and provided a path for the coordinated development of spatial unit functions. Using GeoDa software, a spatial weight matrix was established to carry out the analysis of bivariate spatial global autocorrelation.
As seen from Table 7, the p values of the spatial functions between production, living and ecological space were 0.001, and the z values were >2.58, with 99.9% confidence in the results; therefore, there is a significant spatial correlation between the two spatial functions. Among them, the ecological spatial function failed to be organically coupled with the other two spatial functions and played an inverse role in the coordination of spatial functions. The spatial functions of living and production could be coupled and coordinated, showing the same directional relationship to the coordination of space functions. This can be explained by not only natural reasons for the landscape pattern, but also social and economic reasons for urbanization to occupy the ecological space.

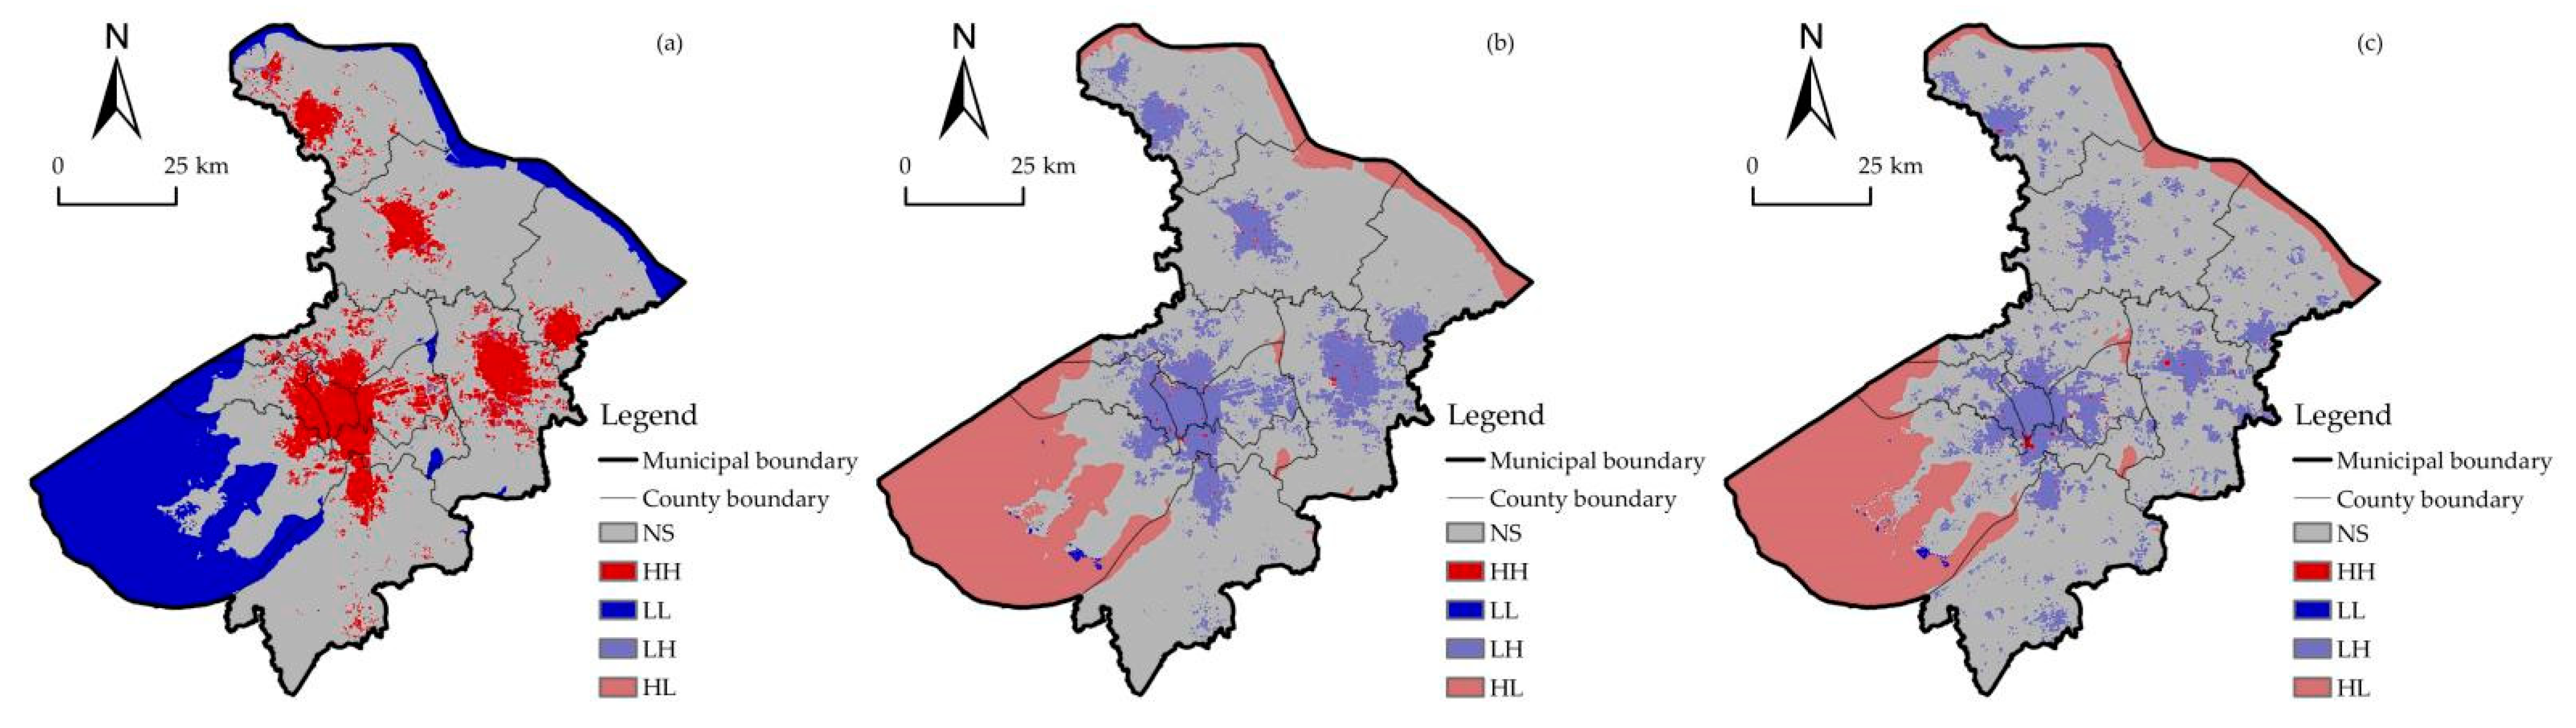
3.2.2. Spatial Relationship

(1) Living–production spatial function relationship
The local spatial distribution characteristics of the mutual coordination relationship between the two spatial functions were further analyzed. Through the bivariate spatial autocorrelation analysis of the living–production spatial function, the following results were obtained (Figure 7a): HH concentrates in the centre of Suzhou and four county-level cities. The urban areas were clustered with rapid cross-circulation of people and logistics and rich and diversified functions. Production–living spatial functions have a relatively high level; they were clustered and have adaptive development, which results in a good positive coordination effect with each other. In ecological conservation areas such as Taihu Lake and the Yangtze River, the LL type was formed, and the development of production and living space functions was restricted by the ecological base. The LH type was mainly located in the periphery of the central city, which is most likely due to the imbalance between the layout of public services and production space. The NH type lacks agglomeration mainly due to the different industrial structures and living activities, the spatially differentiated distribution of production and living elements, and the lack of dominant spatial functions.
(2) Production–ecological spatial function relationship
The HH type was scattered at the edge of the central urban areas of each district and county, which originates from the reasonable protection of ecological background space in the process of urban development and forms a good integration relationship with production space (Figure 7b). The LL type was distributed in the coastal areas of Taihu Lake, where the production and ecological functions of the space were low and fragmented from each other. Production and economic activities expand the production space while squeezing the natural ecological environment, affecting the integration of production and ecological space functions, and presenting the LH type in the central city of each county. The HL type was distributed in the Taihu Lake area, where water bodies are widespread and hills are concentrated, as well as along the Yangtze River, mainly because it is controlled by the ecological red line, which leads to restrictions on the construction and development of production space functions. The nonsignificant areas are mainly due to the decentralized layout of ecological elements and the differentiated distribution of production space, which were in a coordinated development fitting stage, and the former’s role in the latter was difficult to highlight.
(3) Living–ecological spatial function relationship
The HH type was mainly scattered in the periphery of the central city, reflecting the good functional value and integration of living–ecological space (Figure 7c). The LL type was mainly distributed along the shore of Taihu Lake because the functional values of both living space and ecological space are low and not organically integrated. The HL type was mainly distributed in Taihu Lake, the Yangtze River and large lakes in the central part of the city, where the ecological functions are conserved, but living space integration is lacking. The LH type was mainly located in the urban centres and central towns of Suzhou and four county-level cities, where the close spatial connection, population concentration and complete infrastructure have improved living spatial function, while the expansion of living space has squeezed the ecological space and reduced ecological spatial function, failing to integrate and therefore forming a negative coordination relationship. The NH type was due to the scattered layout of ecological elements. Ecological–living spatial functions are in a coordinated development fitting stage, and the former’s role in the latter is difficult to highlight.

4. Discussion

Based on the spatial endogenous order and sequence structure, the index system of the production–living–ecological spatial functions was constructed from the perspective of a type–intensity connection. Compared with the existing research [40,41], this study matches better with the mechanism of territorial spatial function. In addition, this study expands the previous methods of production–living–ecological spatial function evaluation, which were based on land functional attributes or statistical data [42,43]. Moreover, the liquidity perspective was added to break through the traditional paradigm of evaluating the functions of production–living–ecological space from a static perspective. This addition can further reveal the development status of multi-dimensional spatial functions and provide new ideas for the theoretical system of production–living–ecological spatial function evaluation. Adhering to the concept of people-oriented and ecological civilization, we selected multi-source big data to objectively and meticulously reveal the spatial function distribution characteristics of production–living–ecological space, reflecting the development pattern of territorial space development and protection. The analysis of the functional evaluation and coordination relationship of the production–living–ecological space provides some guidance and inspiration for high-quality development of the territorial space.
The distribution of the spatial functions of production–living–ecological follows the laws of urban internal differentiation and social–economic development. The functions of production space and living space were mainly concentrated in the central area of the city and scattering in the periphery of the city. Ecological space was mainly distributed in rural areas and its function depended on large natural subjects. Because the ecological space is sufficient in the countryside and insufficient in the urban center, the function of ecological space is concentrated in the countryside, mainly distributing on the periphery of cities. This has certain similarity and consistency with the conclusions of other research cases [44,45]. In general, the spatial function evaluation reflects the difference of service allocation in production and living space, which is caused by the urban functional zoning and unbalanced economic development. Additionally, it also reflects the phenomenon of ecological space compression caused by the redistribution of land resources in the process of urbanization. The production–living–ecological spatial functions have obvious coordination in both the same and opposite directions, and production–living spatial functions show positive support and are better coordinated overall, which is consistent with the results of other studies, while production and living spatial functions show negative support for ecological space, which is consistent with the results of other studies [46,47]. The difference is that this study confirms this conclusion from a more microscopic scale. On the whole, the comprehensive function relationship reflects that people’s demand and social–economic development are the main orientation of urban growth in the current process of urbanization. Cities are prone to pay excessive attention to the scale and quality improvement of the production and living space, while the supply and quality of green ecological space are often ignored. This is a common problem of urban territorial space in current highly urbanized areas. Consequently, in order to achieve the goal of high-quality territorial spatial development, the comprehensive spatial functions and their coordination should be enhanced by promoting the dynamic integration of production–living–ecological spatial areas and the self-adaptive capacity of the units.
In terms of improving the quality adequacy and balance of production–living–ecological functions, urban areas focus on the integration of production and urban areas and stock renewal, guiding the production and living space to control the quantity and improve the efficiency, making it more livable; rural areas focus on reducing the differences in production and living space between urban and rural areas, actively embedding in the regional industrial chain, strengthening the construction of transportation infrastructure and guiding the production and living space between urban and rural areas. On the basis of meeting the ecological conservation of the main ecological elements, such as Taihu Lake and Yangtze River, the ecological space strengthens the connection of different ecological space units and forms an ecological space pattern with the water network as the base and blue and green intertwined in the whole area.
With regard to improving the production–living–ecological spatial coordination relationship, urban areas should mainly focus on ecological restoration embedded in production and living, and promote the expansion and quality of urban ecological space; township areas should develop special industries according to their positioning, improve production and living service functions, promote rural revitalization, and strengthen the integration of the three industries. The main ecological function areas, on the basis of strictly guaranteeing ecological security, can play a greater ecological service value by increasing the connectivity between production, living and ecological space, and achieve overall production–living–ecological spatial coordination on a larger scale to build a spatial pattern of the territory with composite functions, appropriate appearance and coordination.

5. Conclusions

The spatial function itself is characterized by superposition, interweaving, diversity and fluidity. The study of the clarification of production–living–ecological spatial coordination has important theoretical and practical significance for the optimization and layout of territorial space. This study evaluated production–living–ecological spatial functions and coordination relationships from type–intensity connections using Suzhou as the research area to conduct a fine empirical analysis with POI, road data and land use data, and the main conclusions are as follows.
(1) The overall comprehensive production–living–ecological spatial function in Suzhou is low, with obvious differences between regions and urban-rural areas, showing a spatial pattern of “one core and four points, spreading around the city and grouping beside waters”. Among them, the level of production space function and living space function is low, and they are more concentrated and similar in space, with high values mainly in the central city and town areas where social and economic activities are active, and low values mainly in the vicinity of large water areas such as Yangtze River and Taihu Lake; the ecological space function shows a high level in the water network area with a good ecological pattern and a low function value in the central city where ecological space is fragmented.
(2) The production and living space of Suzhou can be coupled and coordinated, having the same direction relationship to the coordination of both spatial functions. The ecological space is not organically integrated with the production and living space, leading to an opposite relationship to the coordination of spatial functions. In the production–living spatial coordination relationship, the central city and town areas with a developed economic level, perfect supporting facilities and close spatial connection have a positive coordination relationship. Since the large water areas and conservation areas are difficult to carry out social and economic activities due to the restricted ecological substrate, there is a negative coordination relationship. Because the peripheral areas of the central city have an unbalanced production and living layout, it presents an uncoordinated relationship. In the production–ecological and living–ecological spatial coordination relationship, the central urban fringe, where production and life intersect with ecological protection, has a positive coordination relationship. However, in the central urban area, where socioeconomic activities are active and thus squeeze ecological space and the ecological conservation area with high ecological sensitivity, both have an uncoordinated relationship. According to the spatial and typological differences in the coordination relationship, different management strategies were adopted, such as city–industry integration, controlling development volume, improving efficiency, improving supporting facilities, strengthening ecological conservation and restoration, highlighting city characteristics and enhancing connectivity, to achieve the integration of three industries and coordination of production–living–ecological space.
At present, the global urbanization process is at more than 50%. Under the realistic dilemma of restricted environmental resources and insufficient facilities supply, some countries have gradually realized that they need to adhere to a people-oriented principle and attach equal importance to the efficient use of resources, ecological environment protection and high-quality economic development. Production–living–ecological space is a concept under the theory of ecological civilization, based on the relationship between land space utilization attributes and its protection and development. Based on the evaluation model and analysis method of production–living–ecological space, this study can scientifically and reasonably evaluate the functional quality and determine the coordination relationship of production–living–ecological space. The model and method proposed in this study are effective means to promote the optimal allocation and sustainable development of territorial space resources and can contribute wisdom to the overall coordination of cross regions on a larger scale. They are not only applicable to the Suzhou case in this study, but are also applicable to other cities in China and similar regions in the world. At the same time, this study has some limitations. First, when using the assignment method of function strength to divide the spatial type of production–living–ecological space, based on the land use data, the result lacks the elasticity in determining the same land use type. Take the residential land distributed in towns and villages for example. Because they belong to the same land use type, we assigned them a value of 5 according to the classification of this study. However, this blurs the difference in the development intensity of the actual land. Second, when using density of spatial entity elements to represent spatial intensity, although it can express emptiness, different entity elements have differences in volume and POI data blurs this attribute. As a result, in future research, we will strengthen the refinement of the depth of the data and model accuracy. Moreover, in order to respond to the requirements of people-oriented and fine governance in territorial spatial planning, we will add the role of the complexity of human activities in spatial connections. We hope in this way, the sustainable development of the comprehensive territorial spatial functions of the country, and the overall synergy across regions on a larger scale can be realized, so as to achieve the goals of promoting intensive and efficient production space, habitable and appropriate living space, and green and graceful ecological space.

Author Contributions

Conceptualization, Z.Z. and Y.H.; methodology, Y.H. and Z.Z.; software, Y.H.; validation, Z.Z. and H.S.; formal analysis, Y.H. and Y.W.; investigation, Z.Z. and Y.H.; resources, Z.Z. and Y.H.; data curation, Y.W.; writing—original draft preparation, Z.Z., Y.H. and H.S.; writing—review and editing, Y.H., Y.W., H.S. and C.X.; visualization, Y.H.; supervision, Z.Z.; funding acquisition, Z.Z. All authors have read and agreed to the published version of the manuscript.

Funding

This research was funded by the Priority Academic Foundation of Jiangsu Higher Education Institutions (Urban and Rural Planning) and the Research Innovation Program for College Postgraduates of Jiangsu Province, grant number SJCX22_1547.

Data Availability Statement

The data presented in this study are available on request from the corresponding author.

Conflicts of Interest

The authors declare no conflict of interest.

References

  1. Zhang, Y.Y.; Chen, M.J. Spatial Systematic Cognition and Ideas on Spatial Planning System Reform. China Land Sci. 2016, 30, 11–21. (In Chinese) [Google Scholar]
  2. European Commission. ESDP. European Spatial Development Perspective-Towards Balanced and Sustainable Development of the Territory of the European Union; Office for Official Publication of the European Communities: Brussels, Belgium, 1999. Available online: https://ec.europa.eu/regional_policy/sources/docoffic/official/reports/pdf/sum_en.pdf (accessed on 20 April 2021).
  3. Wang, J. National spatial strategic plan of England. J. Urban Plan. Dev. 2016, 142, 1–8. [Google Scholar] [CrossRef]
  4. Peemoeller, L. Progress through process: Preparing the Food Systems Report for the Chicago Metropolitan Agency for Planning Go To 2040 Plan. In Sustainable Food Planning: Evolving Theory and Practice; Viljoen, A., Wiskerke, J.S.C., Eds.; Wageningen Academic Publishers: Wageningen, The Netherlands, 2012. [Google Scholar]
  5. Liu, G.; Yang, Z.; Chen, B.; Zhang, Y. Ecological network determination of sectoral connections, utility relations and structural characteristic on urban ecological economic system. Ecol. Model. 2011, 222, 2825–2834. [Google Scholar] [CrossRef]
  6. Federal Ministry of Transport, Building and Urban Affairs. Concepts and Strategies for Spatial Development in Germany; Secretariat of the Standing Conference of Ministers Responsible for Spatial Planning Federal Ministry of Transport, Building and Urban Affairs: Berlin, Germany, 2006; Available online: https://www.bbsr.bund.de/BBSR/EN/publications/ministries/BMVBS/SpecialPublication/2007_2009/DL_ConceptsStrategies.pdf?__blob=publicationFile&v=1 (accessed on 30 April 2021).
  7. Wang, D.; Jiang, D.; Fu, J.; Lin, G.; Zhang, J. Comprehensive Assessment of Production–Living–Ecological Space Based on the Coupling Coordination Degree Model. Sustainability 2020, 12, 2009. [Google Scholar] [CrossRef] [Green Version]
  8. Yang, Q.Y.; Luo, K.; Lao, X. Evolution and enlightenment of foreign spatial planning Exploration from the perspective of geography. Acta Geogr. 2020, 75, 1223–1236. [Google Scholar] [CrossRef]
  9. Liu, Y. On the logical structure, balance mechanism and development principle of “production-living-ecological space”. Hubei Soc. Sci. 2016, 3, 5–9. (In Chinese) [Google Scholar] [CrossRef]
  10. Yang, Y.; Bao, W.; Liu, Y. Coupling coordination analysis of rural production-living-ecological space in the Beijing-Tianjin-Hebei region. Ecol. Indic. 2020, 117, 106512. [Google Scholar] [CrossRef]
  11. Simwanda, M.; Murayama, Y. Spatiotemporal patterns of urban land use change in the rapidly growing city of Lusaka, Zambia: Implications for sustainable urban development. Sustain. Cities Soc. 2018, 39, 262–274. [Google Scholar] [CrossRef]
  12. Wu, R.; Wang, J.Y.; Zhang, D.C.; Wang, S.J. Identifying different types of urban land use dynamics using Point-of-interest (POI) and Random Forest algorithm: The case of Huizhou, China. Cities 2021, 114, 103202. [Google Scholar] [CrossRef]
  13. Wang, B.Y.; Tian, J.F.; Wang, S.J. Process and mechanism of transition in regional land use function guided by policy: A case study from Northeast China. Ecol. Indic. 2022, 144, 109527. [Google Scholar] [CrossRef]
  14. Zhang, X.; Du, S.; Wang, Q. Hierarchical semantic cognition for urban functional zones with VHR satellite images and POI data. ISPRS J. Photogramm. Remote Sens. 2017, 132, 170–184. [Google Scholar] [CrossRef]
  15. Mastrangelo, M.E.; Weyland, F.; Villarino, S.H.; Barral, M.P.; Nahuelhual, L.; Laterra, P. Concepts and methods for landscape multifunctionality and a unifying framework based on ecosystem services. Landsc. Ecol. 2013, 29, 345–358. [Google Scholar] [CrossRef]
  16. Luo, H.J.; Zhang, L.S.; Zhang, X.Z. Shifts in land-greening hotspots in the Yellow River Eco-Economic Belt during the last four decades and their connections to human activities. Remote Sens. Appl. Soc. Environ. 2022, 27, 100783. [Google Scholar] [CrossRef]
  17. Bonney, M.T.; He, Y.H. Temporal connections between long-term Landsat time-series and tree-rings in an urban–rural temperate forest. Int. J. Appl. Earth Observ. Geoinform. 2021, 103, 102523. [Google Scholar] [CrossRef]
  18. Duan, Y.; Wang, H.; Huang, A.; Xu, Y.; Lu, L.; Ji, Z. Identification and spatial-temporal evolution of rural “production-living-ecological” space from the perspective of villagers’ behavior—A case study of Ertai Town, Zhangjiakou City. Land Use Policy 2021, 106, 457. [Google Scholar] [CrossRef]
  19. Chen, H.; Yang, Q.; Su, K.; Zhang, H.; Lu, D.; Xiang, H.; Zhou, L. Identification and Optimization of Production-Living-Ecological Space in an Ecological Foundation Area in the Upper Reaches of the Yangtze River: A Case Study of Jiangjin District of Chongqing, China. Land 2021, 10, 863. [Google Scholar] [CrossRef]
  20. Zhang, Y.; Long, H.; Tu, S.; Ge, D.; Ma, L.; Wang, L. Spatial identification of land use functions and their tradeoffs/synergies in China: Implications for sustainable land management. Ecol. Indic. 2019, 107, 105550. [Google Scholar] [CrossRef]
  21. Valujeva, K.; O’Sullivan, L.; Gutzler, C.; Fealy, R.; Schulte, R.P.O. The challenge of managing soil functions at multiple scales: An optimisation study of the synergistic and antagonistic trade-offs between soil functions in Ireland. Land Use Policy 2016, 58, 335–347. [Google Scholar] [CrossRef] [Green Version]
  22. Firbank, L.; Bradbury, R.B.; McCracken, D.I.; Stoate, C. Delivering multiple ecosystem services from Enclosed Farmland in the UK. Agric. Ecosyst. Environ. 2013, 166, 65–75. [Google Scholar] [CrossRef]
  23. Fu, C.; Tu, X.; Huang, A. Identification and Characterization of Production–Living–Ecological Space in a Central Urban Area Based on POI Data: A Case Study for Wuhan, China. Sustainability 2021, 13, 7691. [Google Scholar] [CrossRef]
  24. Blanchard, S.D.; Waddell, P. Urban Access: Generalized Methodology for Measuring Regional Accessibility with an Integrated Pedestrian and Transit Network. Transp. Res. Rec. J. Transp. Res. Board 2017, 2653, 35–44. [Google Scholar] [CrossRef]
  25. Keeble, D.; Owens, P.L.; Thompson, C. Regional accessibility and economic potential in the European community. Reg. Stud. 2007, 16, 419–432. [Google Scholar] [CrossRef]
  26. Li, F.; Ye, Y.; Song, B.; Wang, R. Evaluation of urban suitable ecological land based on the minimum cumulative resistance model: A case study from Changzhou, China. Ecol. Model. 2015, 318, 194–203. [Google Scholar] [CrossRef]
  27. Jiang, W.; Cai, Y.; Tian, J. The application of minimum cumulative resistance model in the evaluation of urban ecological land use efficiency. Arab. J. Geosci. 2019, 12, 714. [Google Scholar] [CrossRef]
  28. Lin, G.; Fu, J.Y.; Jiang, D. Production–Living–Ecological Conflict Identification Using a Multiscale Integration Model Based on Spatial Suitability Analysis and Sustainable Development Evaluation: A Case Study of Ningbo, China. Land 2021, 10, 383. [Google Scholar] [CrossRef]
  29. Kang, Q.; Guo, Q.X.; Ding, Y.; Zhang, Y. Tradeoffs/synergies analysis of “Production-Living-Ecological” functions in Shanxi province. J. Nat. Resour. 2021, 36, 1195–1207. (In Chinese) [Google Scholar] [CrossRef]
  30. Li, X.; Yin, R.M.; Fang, B.; Li, Z.J.; Dan, W. Research on the Functional Zoning and Regulation of Jiangsu Province’s Territorial Space Based on the “Production-living-ecological” Function. Resour. Environ. Yangtze Basin 2019, 28, 1833–1846. [Google Scholar] [CrossRef]
  31. Zhu, C.M.; Wang, K.; Zhang, J.; Gan, M.Y.; Yuan, S.F. The Connotation and Realization Path of Territorial Space Governance from the Perspective of “Elements- Structure- Function- Value”. China Land Sci. 2022, 36, 10–18. (In Chinese) [Google Scholar]
  32. Lu, D.F.; Jiang, M.Q. Features, logical relations and optimizing strategies of urban “Production-living-ecological space”. Hebei Acad. J. 2019, 39, 149–159. (In Chinese) [Google Scholar]
  33. Li, J.X.; Zhang, H.Q.; Xu, E.Q. Quantifying production-living-ecology functions with spatial detail using big data fusion and mining approaches: A case study of a typical karst region in Southwest China. Ecol. Indic. 2022, 142, 109210. [Google Scholar] [CrossRef]
  34. Chen, J.; Zhao, C.C.; Zhao, Q.; Lin, S.; Qiu, R.Z.; Hu, X.S. Construction of ecological network in Fujian Province based on Morphological Spatial Pattern Analysis. Acta Ecol. Sin. 2023, 2, 1–12. Available online: http://kns.cnki.net/kcms/detail/11.2031.Q.20220922.1505.022.html (accessed on 10 July 2021). (In Chinese).
  35. Liu, J.L.; Liu, Y.S.; Li, Y.R. Classification evaluation and spatial-temporal analysis of “Production-Living-Ecological” spaces in China. Acta Geogr. Sin. 2017, 72, 1290–1304. (In Chinese) [Google Scholar]
  36. Cao, G.R.; Gu, C.L.; Zhang, Q.Y. Recognition of “Ecological Space, Living Space, and Production Space” in urban central area based on POI Data: The case of Shanghai. City Plan. Rev. 2019, 2, 44–53. (In Chinese) [Google Scholar] [CrossRef]
  37. Cui, C.H.; Han, Z.G.; Miao, C.H.; Wang, B.; Liu, G.J. Spatial Coupling Features of Population and Township Accessibility Distribution in Henan Province. Hum. Geogr. 2017, 32, 98–104. (In Chinese) [Google Scholar] [CrossRef]
  38. Yin, H.W.; Kong, F.H.; Qi, Y.; Wang, H.; Zhou, Y.; Qin, Z. Developing and optimizing ecological networks in urban agglomeration of Hunan Province. Acta Ecol. Sin. 2011, 31, 2863–2874. (In Chinese) [Google Scholar]
  39. Wu, J.J.; Li, Y.Z.; Gao, M. Construction of Wetland Ecological Networks under Four Kinds of Resistance of Rivers in the Yellow River Delta and Their Comparison. Wetl. Sci. 2018, 16, 493–501. (In Chinese) [Google Scholar]
  40. Cheng, X.B.; Tao, Y.; Ou, W.X. Spatio-Temporal Characteristics and Evolutions of Rural Production-Living-Ecological Function and Coupling Coordination in Jiangsu. Resour. Environ. Yangtze Basin 2022, 31, 222–233. (In Chinese) [Google Scholar] [CrossRef]
  41. Wang, A.Y.; Liao, X.Y.; Tong, Z.J.; Du, W.L.; Zhang, J.Q.; Liu, X.P.; Liu, M.S. Spatial-temporal dynamic evaluation of the ecosystem service value from the perspective of “production-living-ecological” spaces: A case study in Dongliao River Basin, China. J. Clean. Prod. 2022, 333, 130218. [Google Scholar] [CrossRef]
  42. Fu, J.; Zhang, S. Functional Assessment and Coordination Characteristics of Production, Living, Ecological Function—A Case Study of Henan Province, China. Int. J. Environ. Res. Public Health 2021, 18, 8051. [Google Scholar] [CrossRef]
  43. Lu, C.P.; Ji, W.; Liu, Z.L.; Mao, J.H.; Li, J.Z.; Xue, B. Spatial-temporal pattern and influencing factors of the “production-living-ecological” functional space of the Yellow River Basin at county level in Gansu, China. Sci. Geogr. Sin. 2022, 42, 579–588. Available online: https://kns.cnki.net/kcms/detail/22.1124.P.20220424.1343.004.html (accessed on 12 February 2021). (In Chinese).
  44. Li, X.; Fang, B.; Yin, R.M.; Xu, X.; Chen, T.Y. Spatial pattern and association of production-living-ecological function and life quality on the village scale: A case of Yangzhong City, Jiangsu Province. Sci. Geogr. Sin. 2020, 40, 599–607. Available online: https://kns.cnki.net/kcms/detail/22.1124.P.20200428.1502.010.html (accessed on 15 May 2019). (In Chinese).
  45. Liu, P.F.; Sun, B.D. The spatial pattern of urban production-living-ecological space quality and its related factors in China. Geogr. Res. 2020, 39, 13–24. (In Chinese) [Google Scholar] [CrossRef]
  46. Li, X.; Fang, B.; Yin, R.M.; Rong, H.F. Spatial-temporal change and collaboration/trade-off relationship of “Production-Living-Ecological” functions in county area of Jiangsu province. J. Nat. Resour. 2019, 34, 2363–2377. (In Chinese) [Google Scholar] [CrossRef]
  47. Wang, Q.X.; Sun, P.J.; Liu, X.L.; Liu, Y.K.; Hai, W.J.; Zhang, X.N. Analysis on spatial-temporal pattern of trade-offs and synergies of “production-living-ecological” function in loess hilly and gully region”—A case study of wushan county. Chin. J. Agric. Resour. Reg. Plan. 2020, 41, 122–130. (In Chinese) [Google Scholar] [CrossRef]
Figure 1. (a) Location of Suzhou in the Yangtze River Delta; (b) Suzhou land use classification.
Land 11 01954 g001
Figure 2. The research technical framework.
Land 11 01954 g002
Figure 3. Functional level of production space: (a) Spatial type; (b) Spatial intensity; (c) Spatial connection; (d) Spatial function.
Land 11 01954 g003
Figure 4. Functional level of living space: (a) Spatial type; (b) Spatial intensity; (c) Spatial connection; (d) Spatial function.
Land 11 01954 g004
Figure 5. Functional level of ecological space: (a) Spatial type; (b) Spatial intensity; (c) Spatial connection; (d) Spatial function.
Land 11 01954 g005
Figure 6. Comprehensive function of production–living–ecological space.
Land 11 01954 g006
Figure 7. Comprehensive function relationship of production–living–ecological space: (a) Living–production spatial function; (b) Production–ecological spatial function; (c) Living–ecological spatial function.
Land 11 01954 g007
Table 1. Production–living–ecological space function evaluation methods and indices.
First Level IndicatorsSecond Level IndicatorsSpecific Indexes ContentComputing
Methods
Production space functionProduction space factor typeProduction land, semi-production land, weak production land, nonproduction landClassification assignment
Production space factor intensityAgriculture, industry, service industryDensity analysis
Production space factor connectionTime cost of production factorsCost distance
Living space
functions
Living space factor typeLiving land, semi-living land, weak living land, nonliving landClassification assignment
Living space factor intensityShopping, dining, medical care, education, recreation, housing, travellingDensity analysis
Living space factor connectionTime cost of life elementsCost distance
Ecological space functionEcological space factor typeEcological land, semi-ecological land, weak ecological land, nonecological landClassification assignment
Ecological space factor intensityForest land, grassland, green land, cultivated land, garden land, watersDensity analysis
Ecological space factor connectionFlow resistance of ecological factorsCost distance
Table 2. Spatial membership degree and assignment of production–living–ecological space based on land use type.
First Level ClassificationSecond Level ClassificationLand Type Assignment
CodeNameCodeNameProduction LandLiving LandEcological Land
00Wetland1106Inland tidal flat005
01Cultivated land 303
02Plantation land 303
03Forest land 105
04Grassland404Other grassland005
05Commercial services land05H1Commercial service facility land510
508Land for logistics and storage500
06Industrial and mining land 510
07Residential land 350
08Public management and public service land 330
810Park and green space133
09Special Site 330
10Transportation Land Road land330
1007Airport land310
1008Land for port and wharf500
1009Pipeline transportation land500
11Water and water conservancy facility land1101River surface105
1102Lake surface105
1103Reservoir surface105
1104Water surface of pit and pond101
1107Ditch101
1109Land for hydraulic construction500
12Other land1201Idle005
1202Facility agricultural land101
1203Ridge of field303
Note: refer to Liu [35] for the evaluation standard and adopt the four-level scoring system of 5, 3, 1 and 0.
Table 3. Evaluation index of production, living and ecological space intensity based on POI and land use data.
Spatial IntensityBroad CategoriesMinor Classes
Production space intensityAgricultureFarms, forest farms, flower nursery bases, fruit base and vegetable base; poultry breeding base, fishery and pasture
IndustryMetallurgy and chemical industry; construction company; mechatronics; mineral company
Service industryLogistics Express; bank; government organs; office; commercial trade
Living space intensityShoppingMarket; convenience store; supermarket
CateringChinese restaurant; western restaurant; snack bar
Medical treatmentGeneral hospital; specialized hospital; clinic
EducationKindergarten; primary school; middle school
Recreation & entertainmentPark plaza; sports & leisure; entertainment place
ResidentVilla; dormitory; residential quarters
TransportationMetro station; bus station; parking lot
Ecological space intensityForest landArbor forestland; bamboo forestland; shrubbery
Garden landOrchard; tea garden; other gardens
GrasslandParks and green space; other grassland
WatersRiver surface; lake surface; reservoir surface
Cultivated landPaddy field; irrigated land; dry land
Table 4. Time cost assignment of production and living space elements based on road and land type.
HighwayExpresswayTerritorial RoadProvincial RoadCounty RoadTownship RoadDry LandWaters
Speed/km/h10080806040305-
Time cost/min0.060.3750.0750.10.150.21.2999
Table 5. Assignment of ecological factors flow resistance based on land use type.
Land Use TypeResistance ValueLand Use TypeResistance Value
Wetlands 3 Ditches and pits100
Woodland 5 Reservoir300
Grassland 30 Aquaculture pond500
Garden plot 30Urban construction land 1000
FarmlandPaddy field30Village land 800
Dry land50Transportation land 500
WatersRivers and lakes600Others700
Note: refer to Yin [38] and Wu [39] for the assignment standard; the range of resistance values is 1~1000.
Table 6. Weight values of production–living–ecological space function evaluation indices.
First Level IndicatorsWeight ValuesSecond Level IndicatorsWeight Values
Production–living–ecological space integrated functionProduction space function0.267Production space factor type0.260
Production space factor intensity0.497
Production space factor connection0.243
Living space function0.453Living space factor type0.394
Living space factor intensity0.470
Living space factor connection0.137
Ecological space function0.280Ecological space factor type0.714
Ecological space factor intensity0.238
Ecological space factor connection0.048
Table 7. The directional index of production–living–ecological space functions action.
Moran’s IZ Valuep Value
Living–production space function0.7841189.10370.001
Ecological–living space function−0.769−1141.01200.001
Ecological–production space function−0.713−1065.50740.001
Publisher’s Note: MDPI stays neutral with regard to jurisdictional claims in published maps and institutional affiliations.

