Article

Urban Equity as a Challenge for the Southern Europe Historic Cities: Sustainability-Urban Morphology Interrelation through GIS Tools

by
Montaña Jiménez-Espada
1,*,
Francisco Manuel Martínez García
2 and
Rafael González-Escobar
1
1
Department of Construction, Research Institute for Sustainable Territorial Development (INTERRA), School of Technology, Universidad de Extremadura, Avda de la Universidad s/n, 10003 Cáceres, Spain
2
Department of Art and Territorial Sciences, Universidad de Extremadura, 10003 Cáceres, Spain
*
Author to whom correspondence should be addressed.
Land 2022, 11(11), 1929; https://doi.org/10.3390/land11111929
Submission received: 13 October 2022 / Revised: 25 October 2022 / Accepted: 26 October 2022 / Published: 29 October 2022

Abstract

:
At a local level, public authorities’ decision making has a significant influence on the development, structure and spatial configuration of the city. For this reason, it is considered essential to combine political positions with urban sustainability criteria, particularly in cities that have been declared World Heritage Sites by UNESCO. The objective of this research is based on establishing an analysis of the formal relationship between sustainability and spatial morphology in the city of Cáceres, taking into account the urban planning conditions in two areas of study: The Historic Centre (PCH) and the city as a whole. The methodology applies a series of urban indicators from four different fields, namely land use, public space, mobility, and urban complexity, with later GIS analysis using a 1 ha grid pattern. Results show correlation exists between historical zones and the degree of some indicators like density, compactness, acoustic comfort or street proportion, and streetscape, while others seem to depend on further conditions. The case of Caceres provides new findings in the Human Heritage Cities research field for Spain and Southern Europe. Grid pattern analysis has shown to be useful to most of the indicators, although some would require different approaches in the future. The authors consider the use of geoinformation tools as an opportunity for mid-sized and similar historical cities’ policymakers, with our ultimate goal being achieving further equity in urban quality conditions. In conclusion, it is considered that there is a knowledge gap regarding the existence of multiple open data sources belonging to different public administrations and the transformation of these data into useful parameters for their practical application at the citizen level.

1. Introduction

Sustainability concerns for our cities are an issue that is increasingly present on the political agenda; although it has origins beyond the last decade, the last ten years are showing a paradigm shift in the way the urban fact and its externalities understood [1], such as physical and climatic conditions, urban vitality and social interaction, land use, proximity economy, mobility and logistics, health and time management and noise, among many others. In 1961, the journalist Jane Jacobs [2] described the effects of urban infrastructures on the lives of their inhabitants, understanding urban planning as the backbone of the rest of urban sustainability policies. Nel·lo [3] analyses how planning can segregate or socially integrate the urban environment in the context of Iberian cities. In this sense, we understand sustainability as a state in which the environmental, economic and social needs of future generations are not compromised [4], so a sustainable city must take these three issues into account. In relation to the concept of sustainability and its relationship with the natural environment, one of the most important documents is Charter of European Cities & Towns Towards Sustainability [5], which states the need to measure sustainability in cities for two fundamental reasons: on the one hand, citizens’ access to information and, on the other hand, to provide technicians and politicians (decision-makers) with real data to be able to show them [6].
Internationally, in Europe and more specifically in Spain, it was found a very specific city typology [7,8,9,10]: World Heritage Cities with a defined historic centre, generally in the centre, accompanied by a diversity of fabrics in its periphery, normally developed since the 19th century with two or three key moments in the evolution of building typologies and the urban fabric, namely: the industrial revolution, the developmentalism of the 1960s and 1970s and, finally, the period 1996–2008 marked by low compactness and, in some cases, low-density urban developments, although centred on large housing units sometimes without the minimum social facilities [11]; to this urban fabric of the real estate bubble must be added another series of economic and demographic circumstances that mean that numerous municipalities have been in a situation of shock and stagnation in their evolution since the 2008 crisis, especially in the interior and west of the Iberian Peninsula [12]. To this end, the municipality of Cáceres has been chosen as it has very clear examples of this urban development, with the aim of analysing indicators of quality and sustainability of the existing urban area as a whole and of its historical area, as well as the viability of the territorial and urban planning instruments in force in the creation of a quality urban space.
The urban sustainability of cities has been approached from different perspectives, but with the objective to put in place urban planning policies that allow cities to develop in a sustainable way while at the same time protect their immediate urban environment [13,14]. Therefore, urban restructuring can solve problems associated with overpopulation of cities, which leads to increased social and economic needs that cause resources to be consumed more rapidly [15]. Urban growth has been leading to the deterioration of historic city centres, which need to be protected in order to preserve the historic roots of cities [16] and provide for a more compact city model, thus supporting urban sustainability in terms of mobility and accessibility to services [17]. Thus, in these historic centres, commercial revitalisation policies have been established to try to solve the existing problems of abandonment, contributing to the future subsistence of these areas [18].
Qualitative studies point to dense, compact and diverse urban fabrics as those with a higher perceived quality of public space, commercial vitality, social dynamism and sense of security. Simó, Casellas and Avellaneda determine in [19] that diverse perceptions are found on the urban fabrics of pedestrian centres, where economic vitality is related to association factors and trading strategies, in addition to the physical change of the city. Interviews conducted in Vitoria-Gasteiz gave greater relevance to issues such as real-time information, weather, climate or walking distance [20]. At the same time, the quality of the environment defines the behaviour of the inhabitants and their relationships with the city [21]. Other studies have linked the density and high social use of public space, typical of Mediterranean cities, with certain challenges for parts of the population in terms of noise and coexistence on public roads [22,23].
Moreover, quantitative studies have calculated and quantified the quality of public space with different methodologies of georeferencing, geoinformation and Geographic Information Systems. Authors Gómez-Varo, Declós-Alió and Miralles-Guasch carried out in [24], a quantitative analysis based on the ideas put forward in [2] using the “Jane’s index” with the aim of quantifying the quality of space in a district of Barcelona using a GIS grid analysis system. This type of grid analysis is commonly used in quantitative studies to evaluate and quantify existing services, as developed in [25] or, where appropriate, the potential for the application of new services and infrastructures in a given territory, as applied in [26,27] for the cities of Santiago de Chile or Thessaloniki in Greece. Other studies have used irregular polygons in order to evaluate the urban fabric, as in the case of the Spanish city of Burgos, taking into account the division into neighbourhoods [28] or the analysis of networks by means of spatial syntax, as applied by the authors in [7] for the urban fabric of a series of blocks in the city of Valdivia, Chile.
In this way, GIS are tools that can help in the management and urban planning of cities because they are able to manipulate, join, store and visualise geographically referenced information. This data processing facilitates the study of the sustainability of cities, allowing the organisation of information from different data sources and its integration in projects that contribute to the realisation of sustainable urban development strategies.

Justification for the Study

Although there are numerous studies applied to large cities, the specific case of Spanish World Heritage Cities presents an extensive bibliography that has focused on a historiographical and heritage review of their urban planning, as well as the methodologies applied to the conservation of the surroundings, the landscape, the aesthetics and their cultural and tourist use. Some clear examples similar to our area of study are Santiago de Compostela, Toledo, Segovia and Salamanca [29].
However, these bibliographical reviews are informative and sometimes informative and historiographical in nature, although they include a certain concern for the specific issues that add to the fact that many of these cities suffer from a secular population and economic stagnation, especially in the west of Spain and the interior, with the exception of the city of Madrid [12,30]. Among these factors, as pointed out by the same institutions that bring these cities together, are less urban vitality in the historic centres, which translates into less productive infrastructure, relocation of economic activities, less social interaction and degradation of urban centres, not in terms of aesthetics and heritage, but in terms of their facilities and uses, with the exception of some administrative and tourist buildings [31] and especially in the abandonment of old fabrics. In the case of the city of Cáceres, these aspects are analysed by Sánchez in [32]. Such studies, coupled with the COVID-19 pandemic and its implications for tourism, have raised concerns about public spaces and the revitalisation of dense and compact urban fabrics that call for their evaluation, especially in cities with such characteristics. This article is therefore justified both locally and internationally.
The objective of this research is to establish an analysis of the formal relationship between urban sustainability and spatial morphology in a world heritage city using urban indicators and the application of geographic information systems (GIS) tools. The methodology used combines the calculation of sustainability indicators (which allow for an in-depth analysis of the city) with GIS techniques that make it possible to generate useful graphic information for public authorities.
The analysis of sustainability has been considered of great interest when comparing the historic centre (PCH) with the entire city. This makes it easier to evaluate the variation of the calculated indicators to compare consolidated urban structures with new urban developments. The purpose of this article would be to be able to extrapolate the results obtained in the research to other World Heritage cities of a similar size, population size and urban structure. In summary, the main objective of the research is to analyse the degree of sustainability of the city of Cáceres in conjunction with the consolidated urban structure (urban design) using GIS tools and urban indicators. In this sense, it is observed that there is a knowledge gap regarding the existence of information from open data sources of multiple origin belonging to public administrations. The key factor is based on the transformation of these data into useful parameters for their practical application at the city level for society.

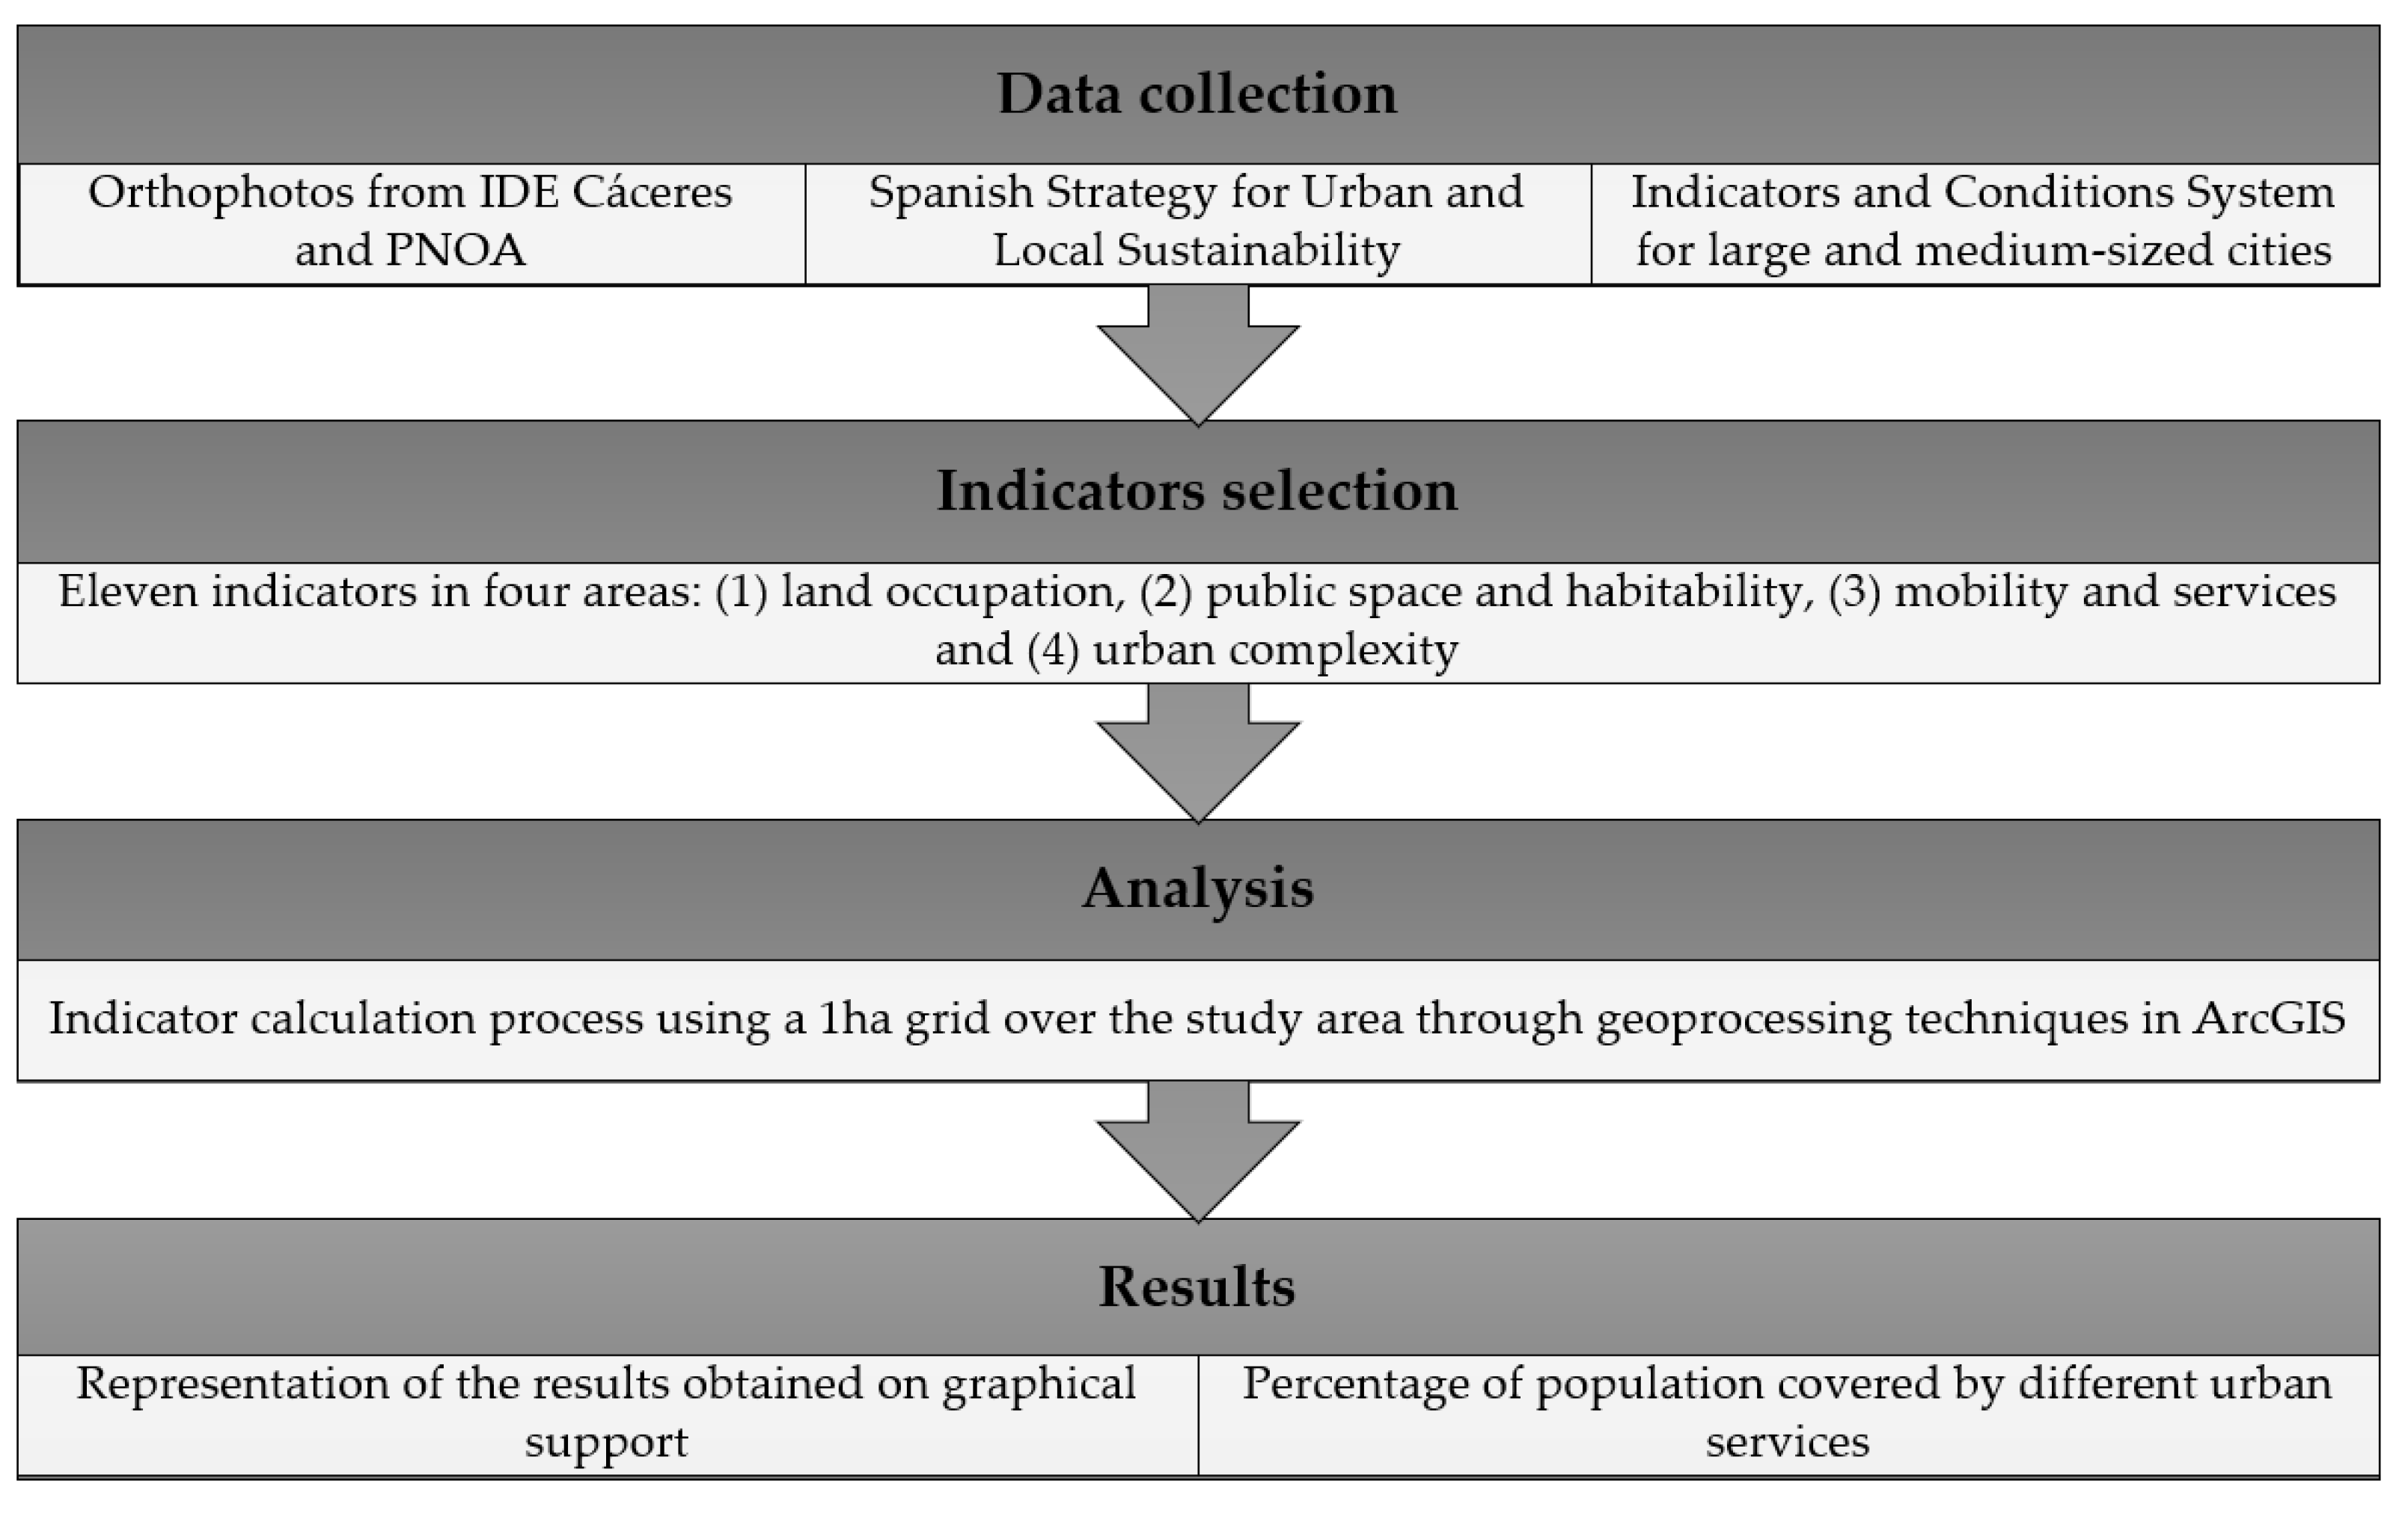
2. Materials and Methods
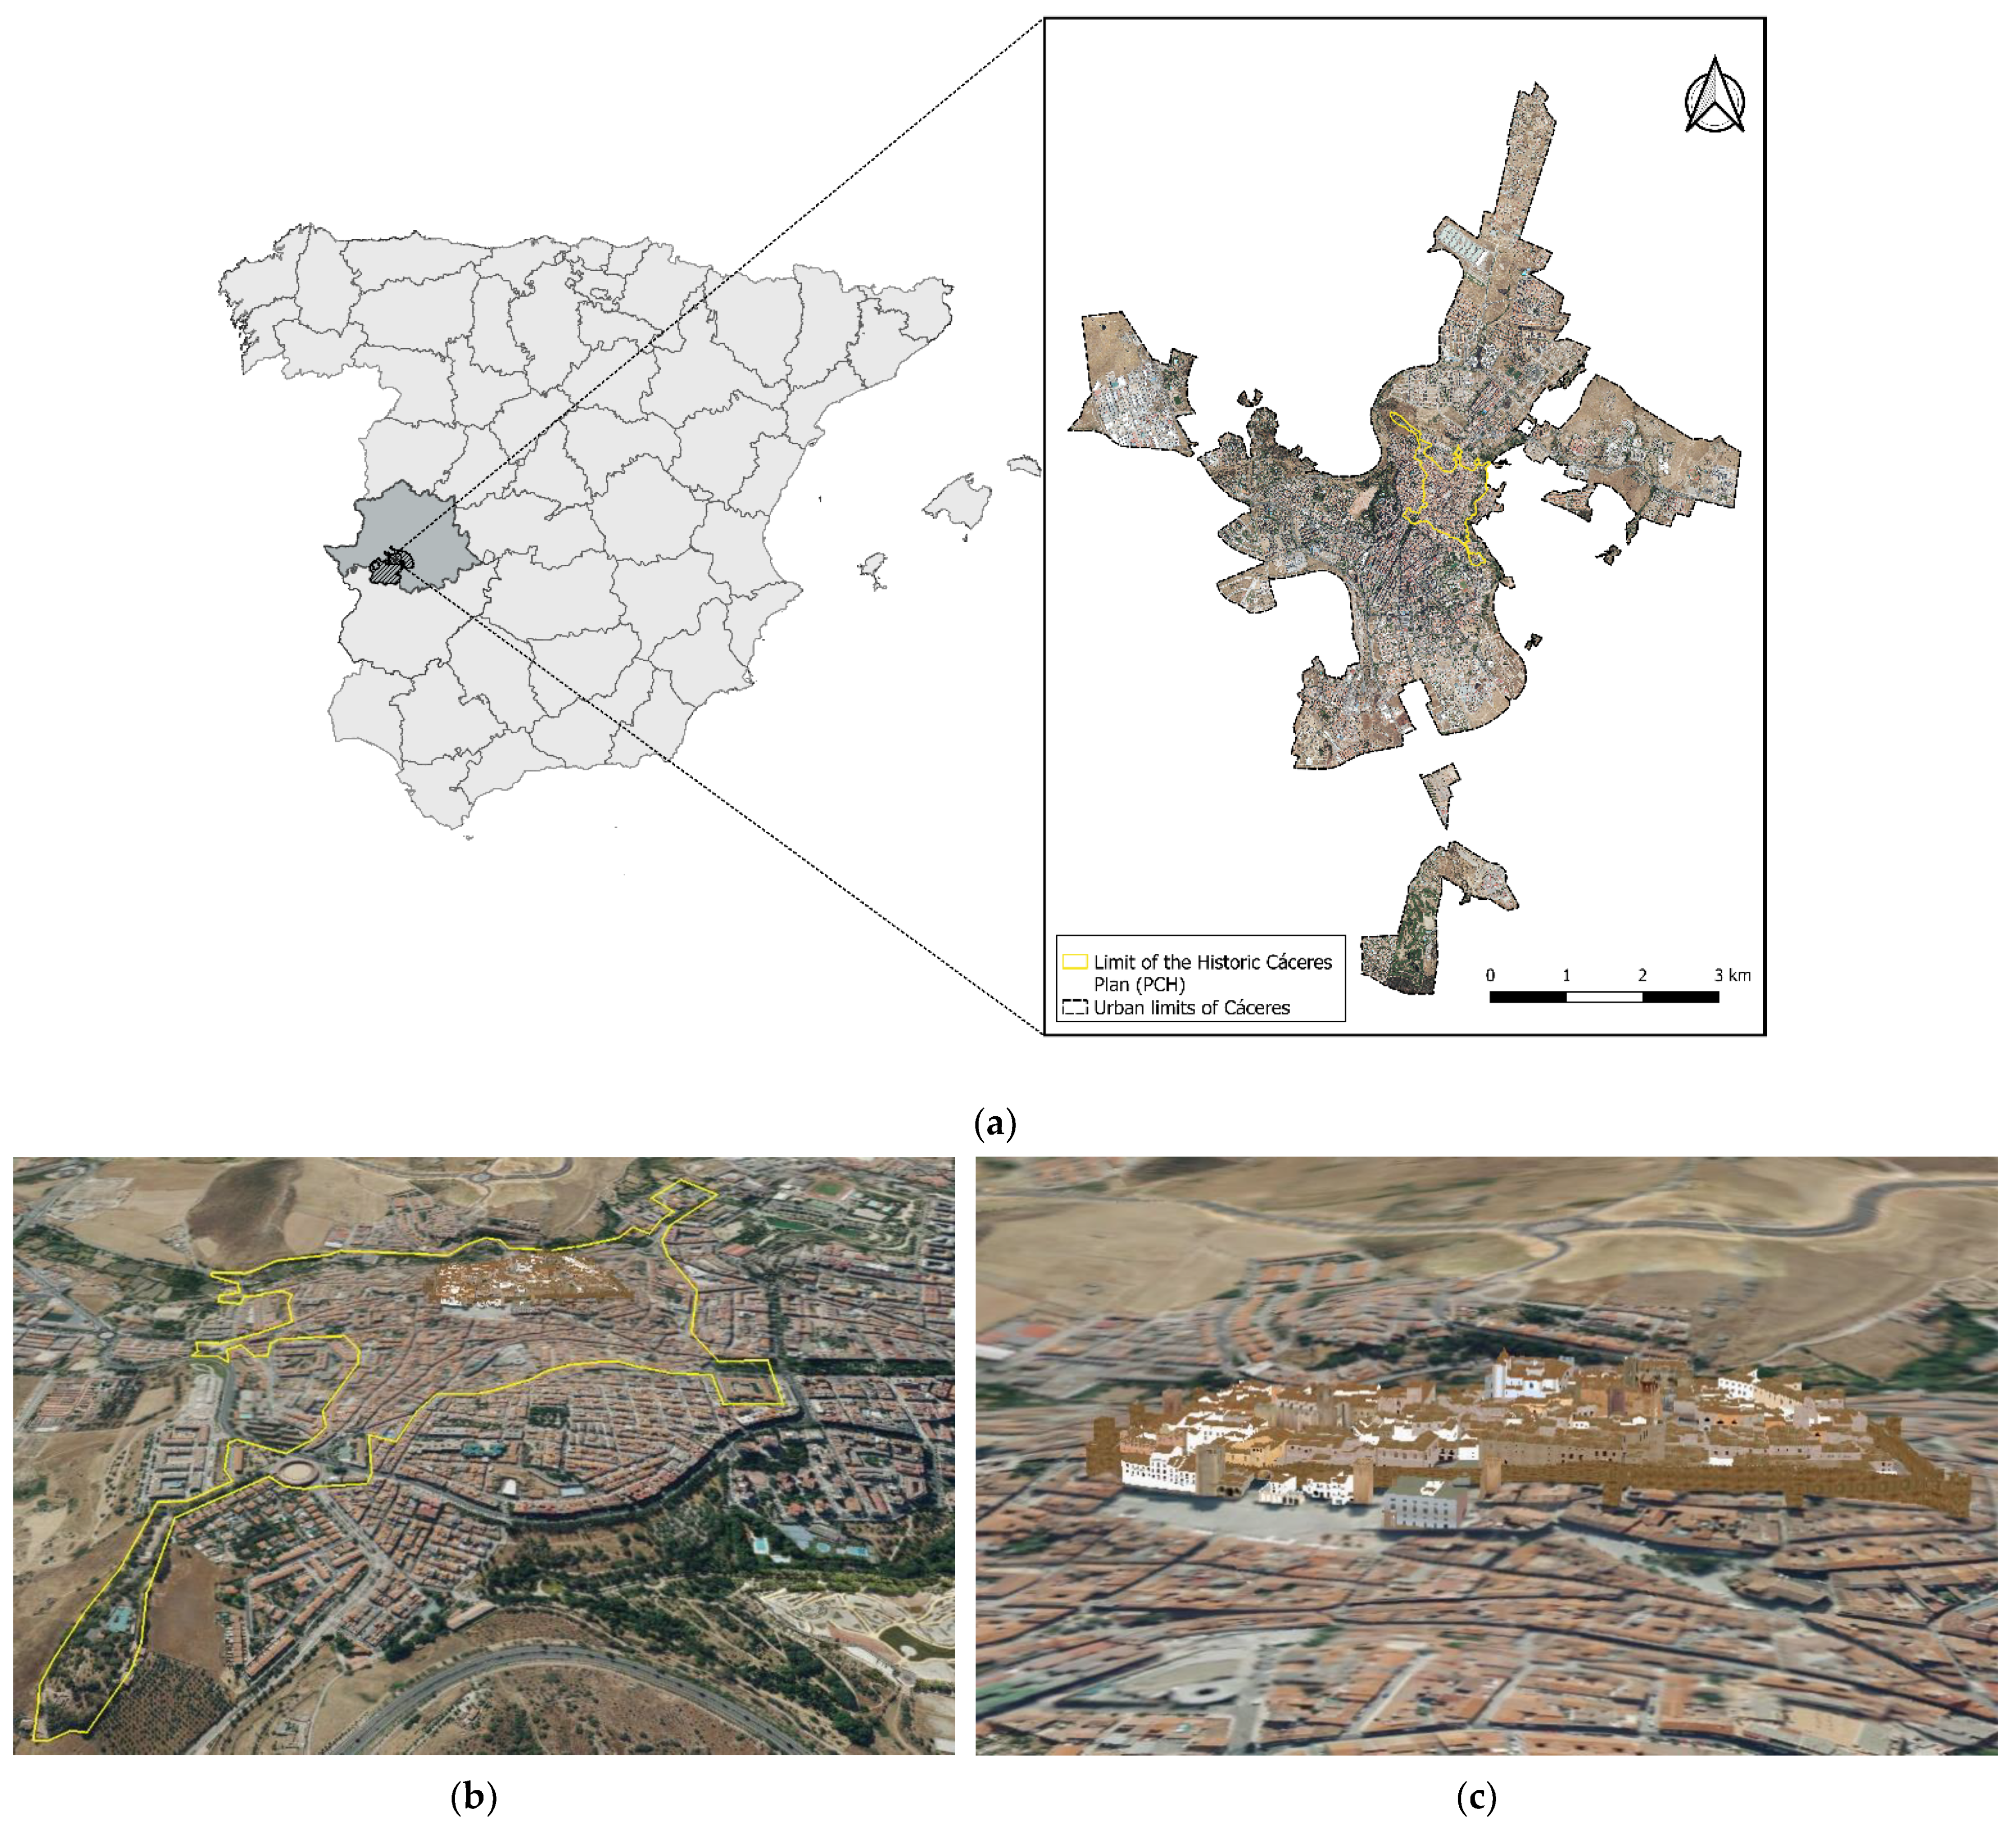
2.1. Study Area

Cáceres (Figure 1) is in the centre of Extremadura, between the Tagus and Guadiana rivers, with a population of about 95,000 inhabitants (INE 2021). It is the capital of the province of the same name, of which it accounts for about 30% of the population; 80% of an urban functional area in a centralising phase of about 125,000 people [12]. The city is bordered to the east by the Ribera del Marco and the Sierra de la Mosca, to the west by the Sierra de Aguas Vivas and to the north and south by the Trujillo-Cacereña peneplain. The urban core under study is administratively divided into 4 districts: centre, north, south and west [33]; it also has some districts that will not be taken into account for the analysis. The study area is therefore 2352.81 ha. For the historic centre, the study limits correspond to the 78 ha of the Historic Cáceres Plan, 3.3% of the total area.
The historic centre of Cáceres is recognised worldwide, and the monumental city was declared a World Heritage City by UNESCO in 1986. This status is mainly due to its excellent heritage conservation, being the best-preserved monumental complex in Spain and the third best-preserved in Europe. As for its four districts which Cáceres is divided present relevant differences in terms of their history, urban fabric, building typology and demography. Basically, it can be said that there is a densely populated district (centre) made up of the historic quarter inside and outside the city walls, as well as neighbourhoods typical of the widening of Spanish cities between 1960 and 1990 [32]. Beyond the central district, there are three districts with lower density and greater zoning: the western district, eminently residential and low-density, the northern district, with greater diversity, with residential areas and university campus and other peri-urban facilities, with a large area based on high-capacity road infrastructures and the southern district, which also has a very low-density urbanisation of a peri-urban nature, housing estates and small industries and a greater diversity of land uses in the areas closest to the centre. In addition, the railway line divides some neighbourhoods with a marked social segregation, such as the industrial mining town of Aldea Moret [35,36], while other traditionally popular neighbourhoods of peripheral origin have been integrated into the compact urban fabric, such as Las Trescientas or Llopis Iborra. These 4 districts are mainly structured by a series of radial road infrastructures, present in the urban planning since 1923, which converge in the centre district, in the Plaza de América, as well as by a series of ring roads proposed by the planning of 1979 and developed with the planning of 1998 and 2010 [37].
Therefore, the city under study presents a typical urban fabric in the national panorama, with a historic centre accompanied by a dense urban development and a series of expansion areas, well visible in its General Plan, which have resulted in an increase in occupied space 5 times greater than the increase in population since 1965. In this respect, the historic centre of Cáceres has suffered a subtraction of everyday facilities in favour of peri-urban spaces, especially during the last 30 years, as well as a refunctionalisation of a sector of housing and heritage in favour of tourist uses [32,38,39]. These bibliographic studies are added to the geographical information available for the city of Cáceres, which allows us to elaborate a quantitative study to evaluate the quality conditions of the city. Comparatively, it is of interest to explore the hypothesis of possible disparate results between two specific areas: the Historic Cáceres Plan (PCH) and the built-up city.

2.2. Variables and Data Sources

In order to address the ideas of sustainability/quality of the urban environment in the study area in an applied manner, the criteria proposed by the Spanish Government have been adopted, as expressly defined on the website of the Ministry of Transport, Mobility and Urban Agenda (MITMA) and reflected in the document entitled “System of Indicators and Conditions for large and middle-sized cities” [40]. This work defines a system of urban sustainability indicators that is divided into seven groups or areas of work: 1. Land occupation, 2. Public space and habitability, 3. Mobility and Services, 4. Urban Complexity, 5. Green Spaces and Biodiversity, 6. Urban metabolism and 7. Social cohesion. The authors of [41] discusses the need to identify urban indicators in order to quantify the degree of sustainability of cities and which could additionally serve as an additional support for political decision making. In this sense, urban indicators are postulated as one of the most appropriate ways to achieve this objective.
In this research, considering the relationship between sustainability and urban morphology as the object of analysis, it has been decided to synthesise the principles to be evaluated into 11 indicators belonging to four areas, as shown in Table 1:
Data input for the calculation of the different variables have been obtained from the continuous census of the National Institute of Statistics (INE), Municipal Cadastre, Municipal GIS, Spatial Data Infrastructure (SDI) of Cáceres, Open Data Cáceres, National Plan of Aerial Orthophotography of the National Centre of Geographic Information (CNIG), Historic Cáceres Plan. The following flow chart (Figure 2) shows the methodological process carried out.

2.2.1. Land Occupation

The sustainable land use model configures compact cities that reduce land consumption and maximise resource efficiency, with integrated and preferably dense growth, but with a degree of diversity in building types to accommodate specific and collective needs, considering energy efficiency related to the physical conditions of the environment. Two measurement indicators have been considered for land occupation: density of dwellings (Ddwelling) and absolute compactness (Cabs).
Within the same space, the first indicator used (Ddwelling) aims to bring together a sufficient critical mass of inhabitants for social and economic relations to exist, as well as efficient public transport and basic infrastructures and facilities to provide for a larger population in its area of influence. A population balance is established between 220 and 350 inhabitants per hectare, which translates into a minimum value (>80 dwellings/ha) and a desirable value (>100 dwellings/ha), although the number depends on the degree of occupation of the municipality.
As for the second indicator (Cabs), it looks to promote efficiency in the use of natural resources and to bring distances between different uses closer, developing patterns of proximity that allow for active travel, neighbourhood relations and the probability of contact between the agents that make up the city, understood as a meeting point. A minimum value of (5 m for 50% of the area of consolidated urban land or land for development) and a desirable value of (5 m for 75%) are established. Table 2 defines the expressions used for the calculation of each indicator in the field of “Land use”.

2.2.2. Public Space and Habitability

The liveable city model is related to variables of comfort and other activities typical of cities developed on a human scale that allow a measurement of vitality and the degree of collective coexistence to be established, prioritising habitat for people and not for vehicles. In this way, a minimum of 10 m2 of living space per inhabitant is sought. The maximum expression of quality in the urban environment is proposed through the superblocks, rebalancing the dichotomy of the 20th century. At the same time, habitability defines those public spaces where an evaluation of the conditions considered favourable for the physiological, physical and psychological well-being of the people who live in cities must be established. To determine the aspects concerning public space and habitability in the city of Cáceres, the following indicators have been used: corrected compactness, air quality, acoustic comfort, road accessibility and proximity of the population to basic services.
Corrected compactness (Ccor) aims to compare the built volume with those public living spaces that are in a specific area, correcting the calculation of absolute compactness (since excessive compactness can cause important problems of congestion and urban saturation). In this way, the main objective of this indicator becomes the search for a balance between built spaces and open spaces, establishing an adequate proportion between areas related to the activity and organisation of the urban system and those spaces that are oriented towards satisfying the recreational needs of the population. Therefore, for this indicator, a desirable value between 10 and 50 m of public recreational space per dwelling is established.
Additionally, air pollution (Cair) represents an environmental threat to public health. The current model of urban mobility based on the massive use of private vehicles already considers road traffic as the main source of pollutant emissions. Improving urban air quality requires the implementation of mobility and public space plans that involve a shift in distribution from private vehicles to less polluting modes [63]. This indicator uses the values of the air quality index provided by the Ministry for Ecological Transition and Demographic Challenge (MITECO) [64], as a reference, in order to know the impact on the population of different polluting particles, namely: nitrogen dioxide (NO2), tropospheric ozone (O3), suspended particulate matter (PM10) and sulphur dioxide (SO2). Table 3 shows the values that categorise air quality according to each of the pollutants analysed.
Another of the fundamental aspects at the urban level would be to identify the degree of noise pollution present in the streets. To determine the areas and population exposed to noise levels that alter the quality of life of citizens, the acoustic comfort indicator (Cacoustic) is applied. Externalities are usually related to congestion caused by vehicle traffic, and a solution to the acoustic impact can be found through the application of different measures such as: the restriction of public roads for vehicles, the reduction of speed in streets with priority use for pedestrians or the use of sound-absorbing pavements. In order to detect those areas where noise levels could be higher, noise measurement data provided by the Cáceres City Council’s OpenData platform were used.
The reduction or elimination of the physical barriers present in the daily movements of people in a municipality is a major issue. Through the estimation of the indicator (Aroad) it is intended to weight the accessibility of street sections according to the width of the pavement and the slope of the layout sections to know the areas that could limit the movements of citizens and, mainly, of those people with reduced mobility. In this way, assessment criteria are based on the basic accessibility requirements for people with reduced mobility in terms of the slope and width of pavements, the general criterion for which is that pavements with a width of more than 90 cm and a maximum slope of 5% are accessible.
To complete the analysis of the area of public space and liveability, it is important to know the degree of proximity of the population to public services. One of the main objectives for a spatially cohesive city would be to have adequate access to basic services. Based on this premise, the indicator (Pservices) ims to study the number of services that are located less than 10 min’ walk from the user, establishing a range of 600 m to determine those areas that the citizen can reach on foot. In this sense, the degree of simultaneous accessibility to the four types of basic services considered will be assessed:
  • Basic equipment (<600 m);
  • Proximity commercial activities (<300 m);
  • Mobility networks (<300 m);
  • Green spaces (<200 m).
Table 4 sets out the formula used for the calculation of the indicators for the “Public space and habitability” domain.

2.2.3. Mobility and Services

Urban modelling should make a priority of a system that operates with minimum values for energy consumption, air pollution and noise emissions, which would appropriately increase safety and reduce road accidents. In this way, urban mobility policies of public administrations should be based on the use of sustainable modes of transport (alternative to the private vehicle), since in a city that is moving towards sustainability, the percentage of trips by private vehicle should not exceed 10% of total trips and the percentage of street occupation by motorisation should not exceed 25%, with pedestrians dominating the remaining space. Mobility and services are analysed in this research using the following indicators: population travel mode, distribution of public roads and off-street parking for private vehicles.
Cities must commit strongly to a sustainable mobility model based on the use of soft modes of transport as an alternative to the private car. The first indicator studied in this area (RMprivate) reflects the distribution of citizens’ travel mode and aims to analyse the city’s situation with the objective of reducing dependence on the private vehicle to reverse its growth in terms of modal distribution.
The second indicator (Vpedestrians) values the importance of public space for pedestrian mobility and the quality of life of citizens to promote pedestrian networks where there is no friction with private vehicles. The aim is to achieve values of pedestrian public road surface of more than 75% in relation to the total road surface, as well as to allocate a maximum of 25% of the public road surface for the circulation of cars and public transport. Therefore, pedestrian streets, promenades and pavements will be counted as public roads for pedestrians, while public vehicular roads will be carriageways, car parks and traffic dividers.
The spatial distribution of on-street and off-street parking (APVehicles) is calculated to show the relationship between the number of on-street parking spaces and the number of parking spaces in other locations. For the calculation of this indicator, the information available on the car parks in the city of Cáceres that are located on public roads, as well as those located in public and public-private (off-street) parking areas, has been used to represent them graphically using a 100 × 100 m grid.
The expressions used for the indicators used in “mobility and services” are listed in Table 5.

2.2.4. Urban Complexity

The degree of urban organisation of a territory (urban complexity) is key to improving the efficiency of urban systems. In both natural and urban systems, an increase in complexity implies an increase in organisation, contributing to the stability and continuity of these systems, in which an advanced society can reach a degree of organisation that favours the development of a competitive strategy based on information and knowledge to reduce the impact on natural resources. The following indicator has been used for this area: balance between activity and residence.
The balance between public space and the activities carried out by the population in their daily lives affects the dynamics of citizen mobility; if the physical properties of the residential fabric contain sufficient work and commercial activity, it is relatively likely that mobility will be reduced, establishing synergies between the place of residence of citizens and their place of work within the same area of the city. In this sense, the indicator (Eqact) calculates the total built-up area of tertiary use in relation to the total built-up area, finally represented by a 100 × 100 m grid. Table 6 shows the expression used for the “Urban Complexity” indicator.

2.3. Spatial GIS Analysis

In this research, GIS tools have been used as a method of formal representation of the results that have been obtained from the calculation of the indicators. The use of GIS facilitates the identification of those areas of the city where the calculated values are included within the sustainability standards. The proper management of geographic data allows GIS tools to integrate maps and represent the necessary information in order to spatially identify the results of the analysis. In other research projects, GIS have been used in order to analyse the morphology of the city and support the design of sustainable urban planning for public administrations.
The methodology carried out initially consisted of collecting spatial data from different documentary sources to later proceed to calculate the different sustainability indicators using GIS tools. To approach the calculation, a grid with an area of 1 ha × 1 ha was created and placed over the urban centre of Cáceres and the PCH in order to be able to represent the sustainability values of the study area. In this way, the calculation of the indicators was applied to the grid, which later allowed the graphical representation of the results obtained.

3. Results

The results obtained in the research are presented below through the spatial representation by means of maps produced with GIS tools. The graphs provided allow a complete visualisation of the indicators analysed in the two study areas (PCH and the entire city). Based on these results, the degree of adaptation to the desirable sustainability objectives set out in the methodology of the article for each indicator is evaluated, with the aim of diagnosing the level of adaptation of the current situation of the municipality with respect to the previously defined model. In a complementary manner, the results are discussed to put the values obtained into context.

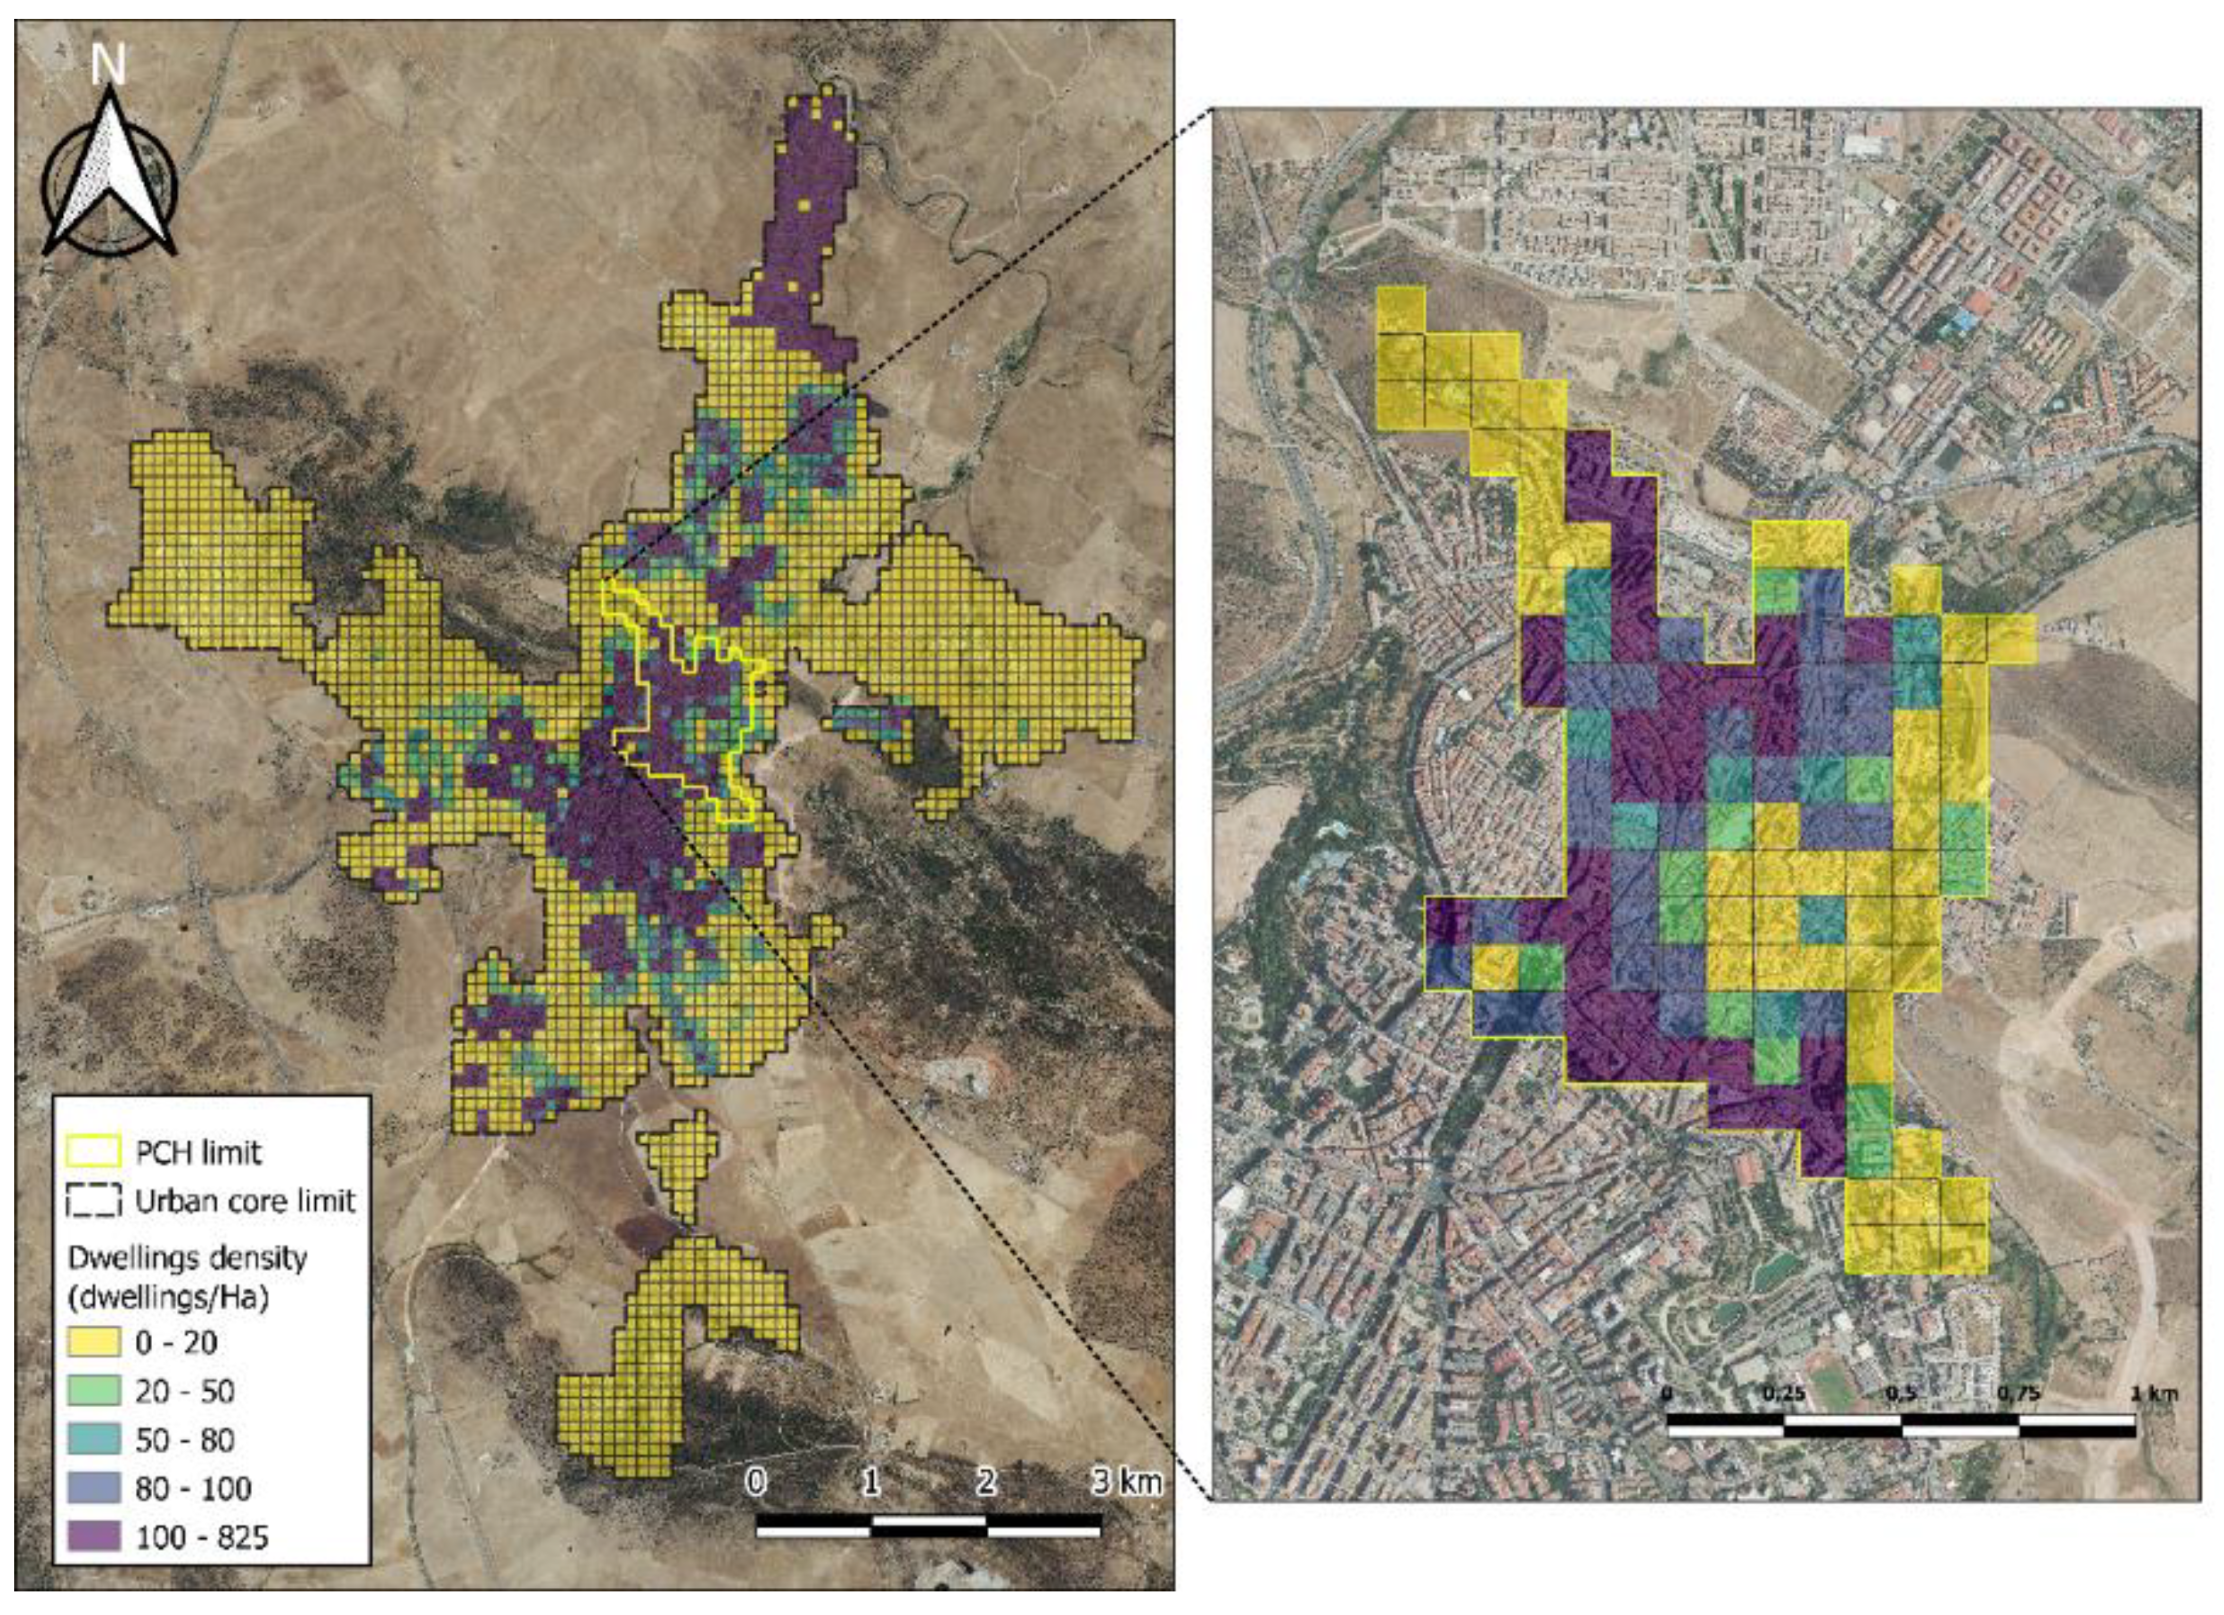
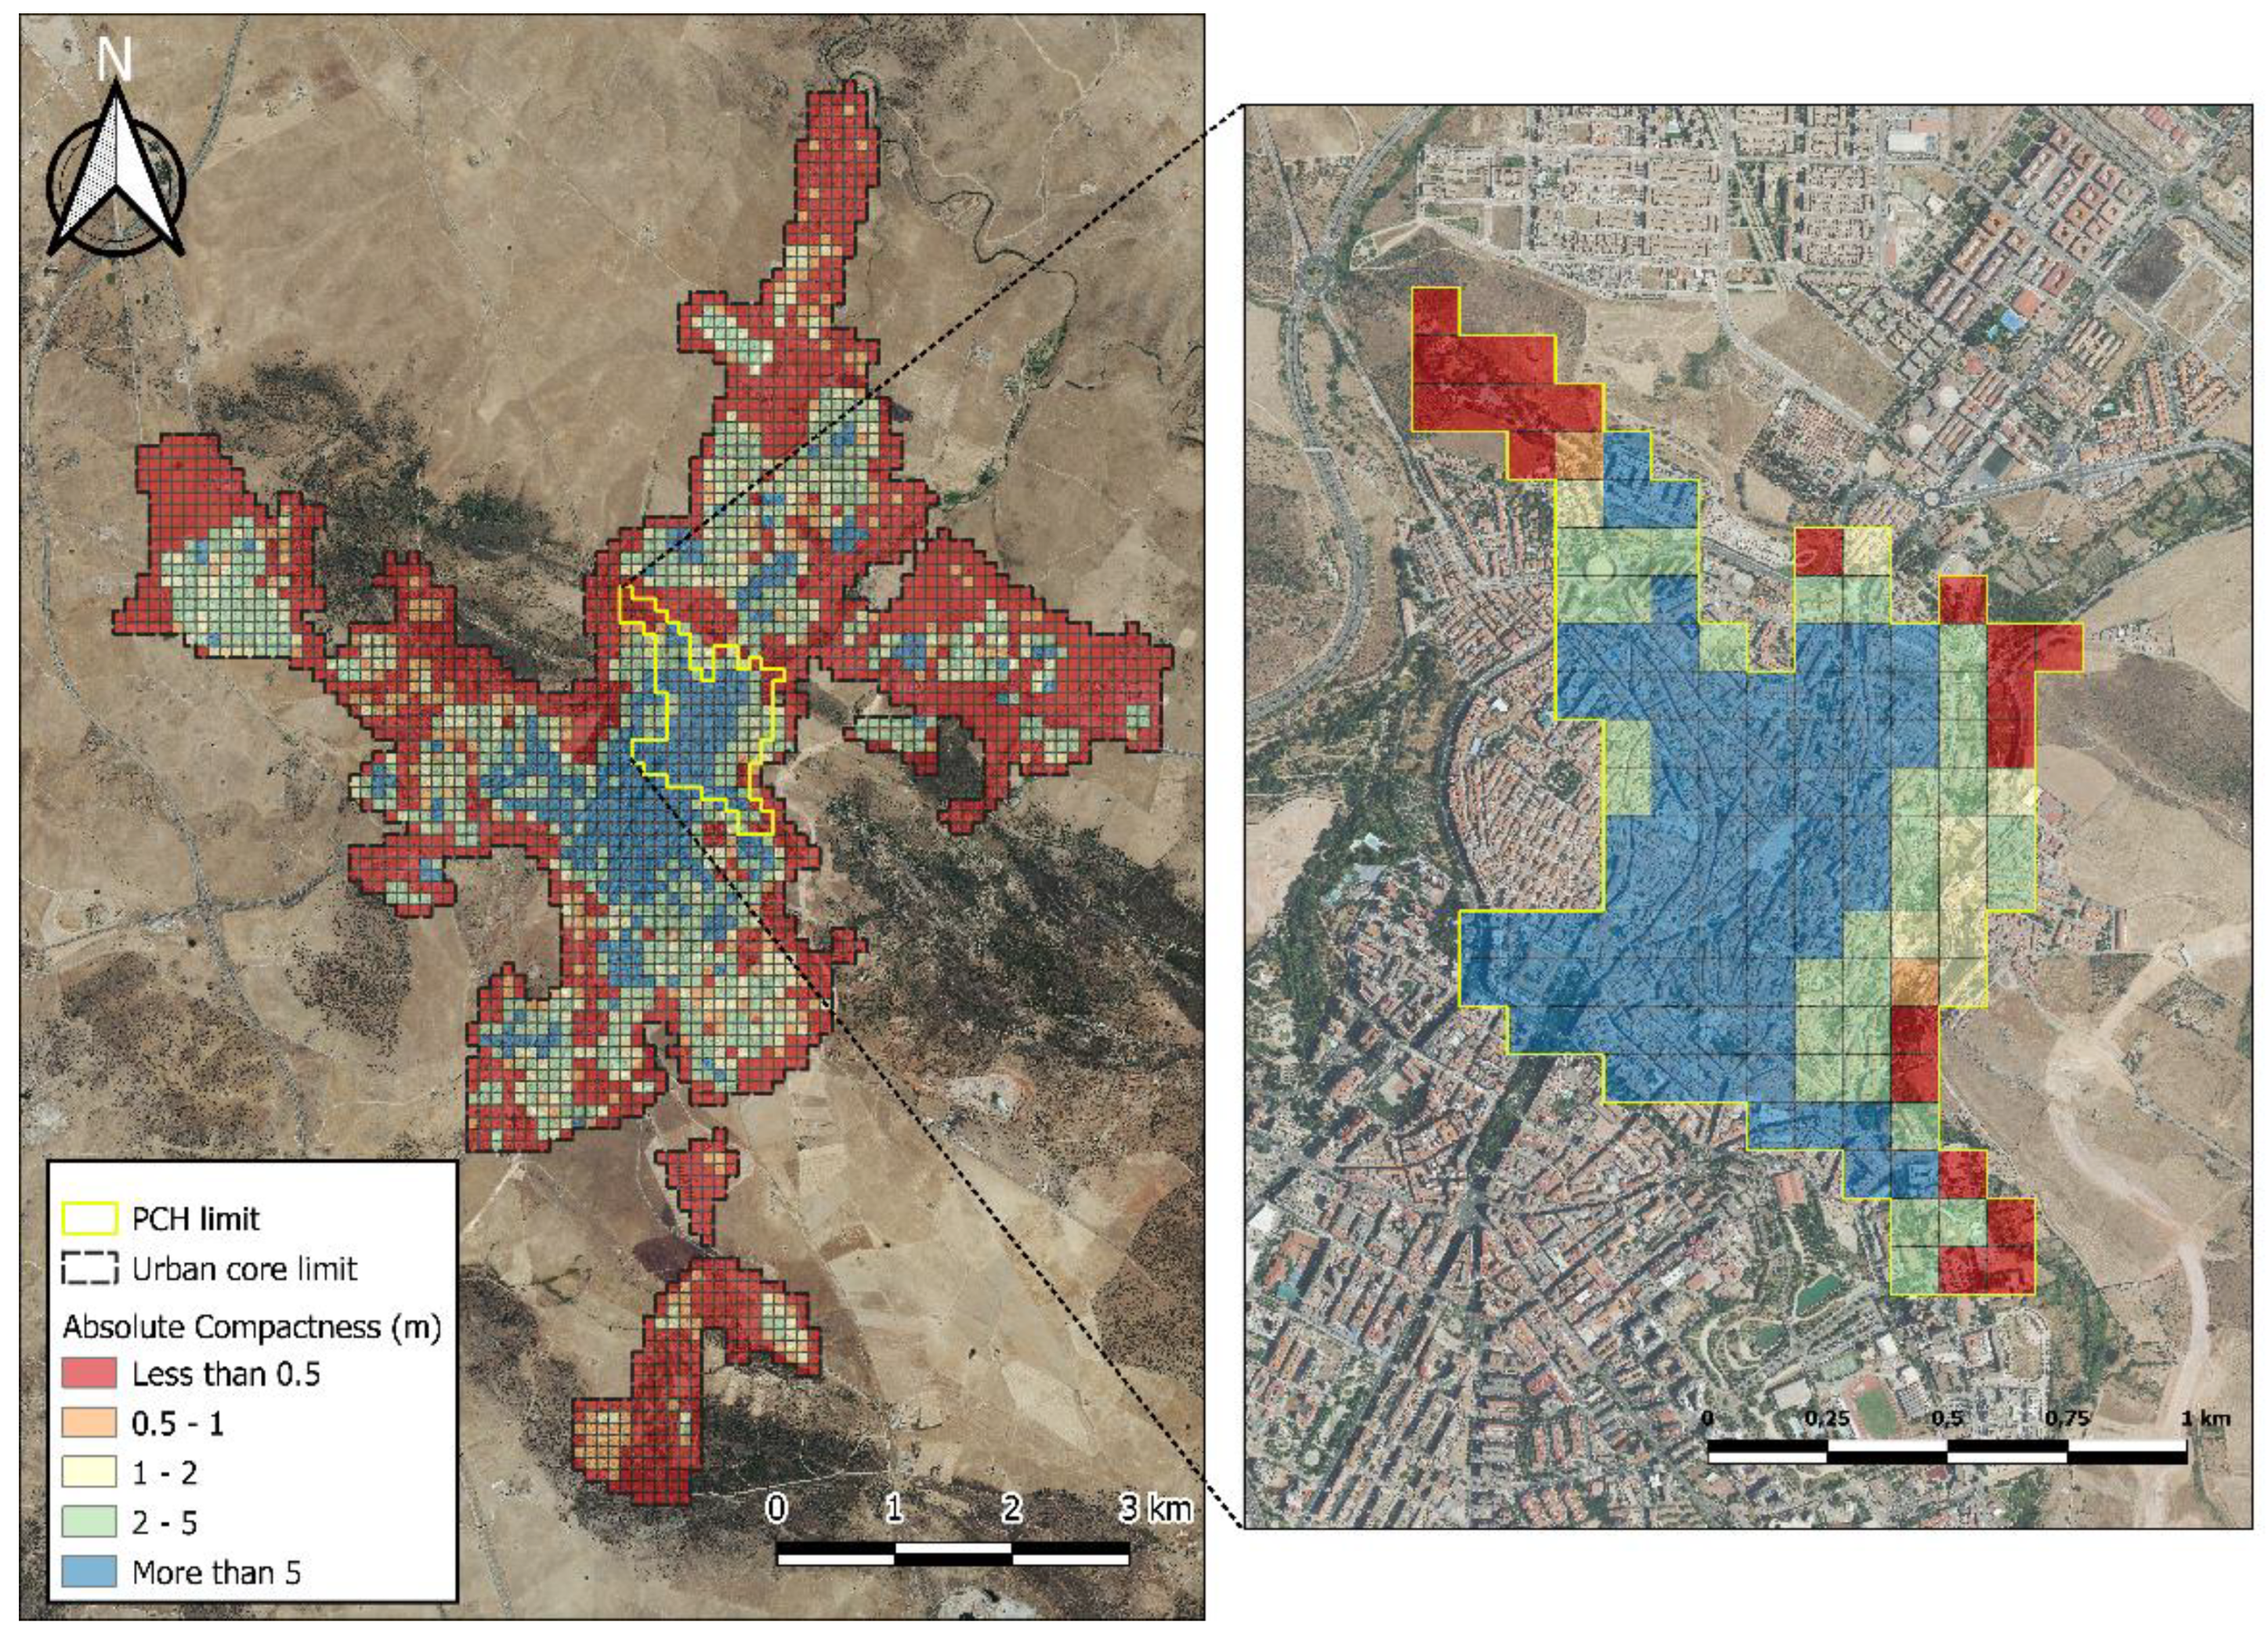
3.1. Land Occupation

3.1.1. Dwellings Density

City dynamism can be identified with the number of people that are in certain areas of the urban nucleus. For an urban fabric to have adequate tension, it is necessary to have enough people to provide it with life. For this reason, there must be a balance in the range of density in order to achieve a sustainable scenario, where there are not very disparate or extreme values of the indicator used. Thus, if there are areas where there is a higher concentration of dwellings, this could result in a cost to the population in terms of competition between users for the same public space and services; on the other hand, those areas where the building typology is too dispersed lead to a greater use of resources, which means that there is not enough tension to allow urban functions to develop normally
Figure 3 shows the result obtained from the analysis of the density of dwellings in the city of Cáceres and its specific situation in the delimitation of the PCH.
The urban core of the city of Cáceres shows higher dwelling density values in the areas located in the epicentre of the commercial and administrative activity of the municipality, with values of over 100 dwellings/ha. There is also a high density of dwellings in areas located to the north and southwest of the city, those areas of expansion where a high concentration of population has been established, allowing the city to grow. This high rate of housing density is closely related to the areas of the city where a greater number of basic services are concentrated as a priority.
Much of the urban core shows density values of less than 20 dwellings/ha, distributed mainly in the peripheral areas of the city, which correspond to neighbourhoods where the main building typology consists of single-family dwellings.
At the scale of the PCH, the lowest values of housing density are located around the banks of the Marco (to the east of this delimitation) and the Paseo Alto Park (to the southwest of the same), both areas being clearly influenced by their orography and not having a preferential residential use. To the west of the PCH delimitation there is a higher concentration of housing density, with values of more than 50 dwellings/ha. In the centre of the delimitation there are areas with a density of less than 20 dwellings/ha, a situation which corresponds to private ground floor properties or ancestral buildings of high historical or monumental value inside the walled area, in which a large part of them have lost their original residential use.
Therefore, the area of occupation of the PCH concentrates a percentage of housing density higher than 100 dwellings/ha in more than 45% of the territory. As for the urban core of the city, 20% of the area analysed has values higher than 100 dwellings/ha. This fact is attributed to the fact that most of the city’s dwellings are in the central area, which covers part of the boundaries of the PCH, mainly in the areas surrounding the walled enclosure on the western side.

3.1.2. Absolute Compactness

The use of this variable is designed to analyse at a morphological level the building situation of the city and, above all, of the urban centre, determining the places of preferential social contact, exchange and communication, as elements that define the essential nature of a city. This indicator can be considered a fundamental axis of urban sustainability, as it has direct implications on the morphology of the city, its functionality and the organisation of mobility and open space networks.
With the calculation of this parameter, the idea was to locate those areas where the compact city model is most developed, which pursues the efficiency of land (a basic, non-renewable natural resource). This model aims to promote the social cohesion of the city’s inhabitants, as well as the renunciation of functionalist zoning, increasing the multi-functionality of uses as an efficiency strategy to minimise the pressure generated by the diffuse city model.
Figure 4 shows the results obtained from the GIS analysis of the absolute compactness, both at the level of the whole city and the PCH:
In relation to the calculation of absolute compactness at the level of the urban core of the entire city, it is shown that the building intensity is concentrated in the city centre, fundamentally in the areas close to the main streets and commercial avenues that form the structure of the city, where compactness is maintained at values of over 5 m. As the distance from these central areas increases, the value of compactness decreases, with some slight upturns in figures between 2 and 5 m, which correspond to the industrial estate to the west of the city, as well as in the north of the city.
On the other hand, in the area comprising the PCH, a large part of its delimitation has a building intensity of more than 5 m. The values of less than 0.5 m are in areas where there is hardly any type of building, being identified with green areas or riverbanks. Thus, the area covered by the PCH has a building intensity of more than 5 m in more than 53% of the territory. In the case of the urban area, the percentage decreases considerably to around 12%.

3.2. Public Space and Habitability

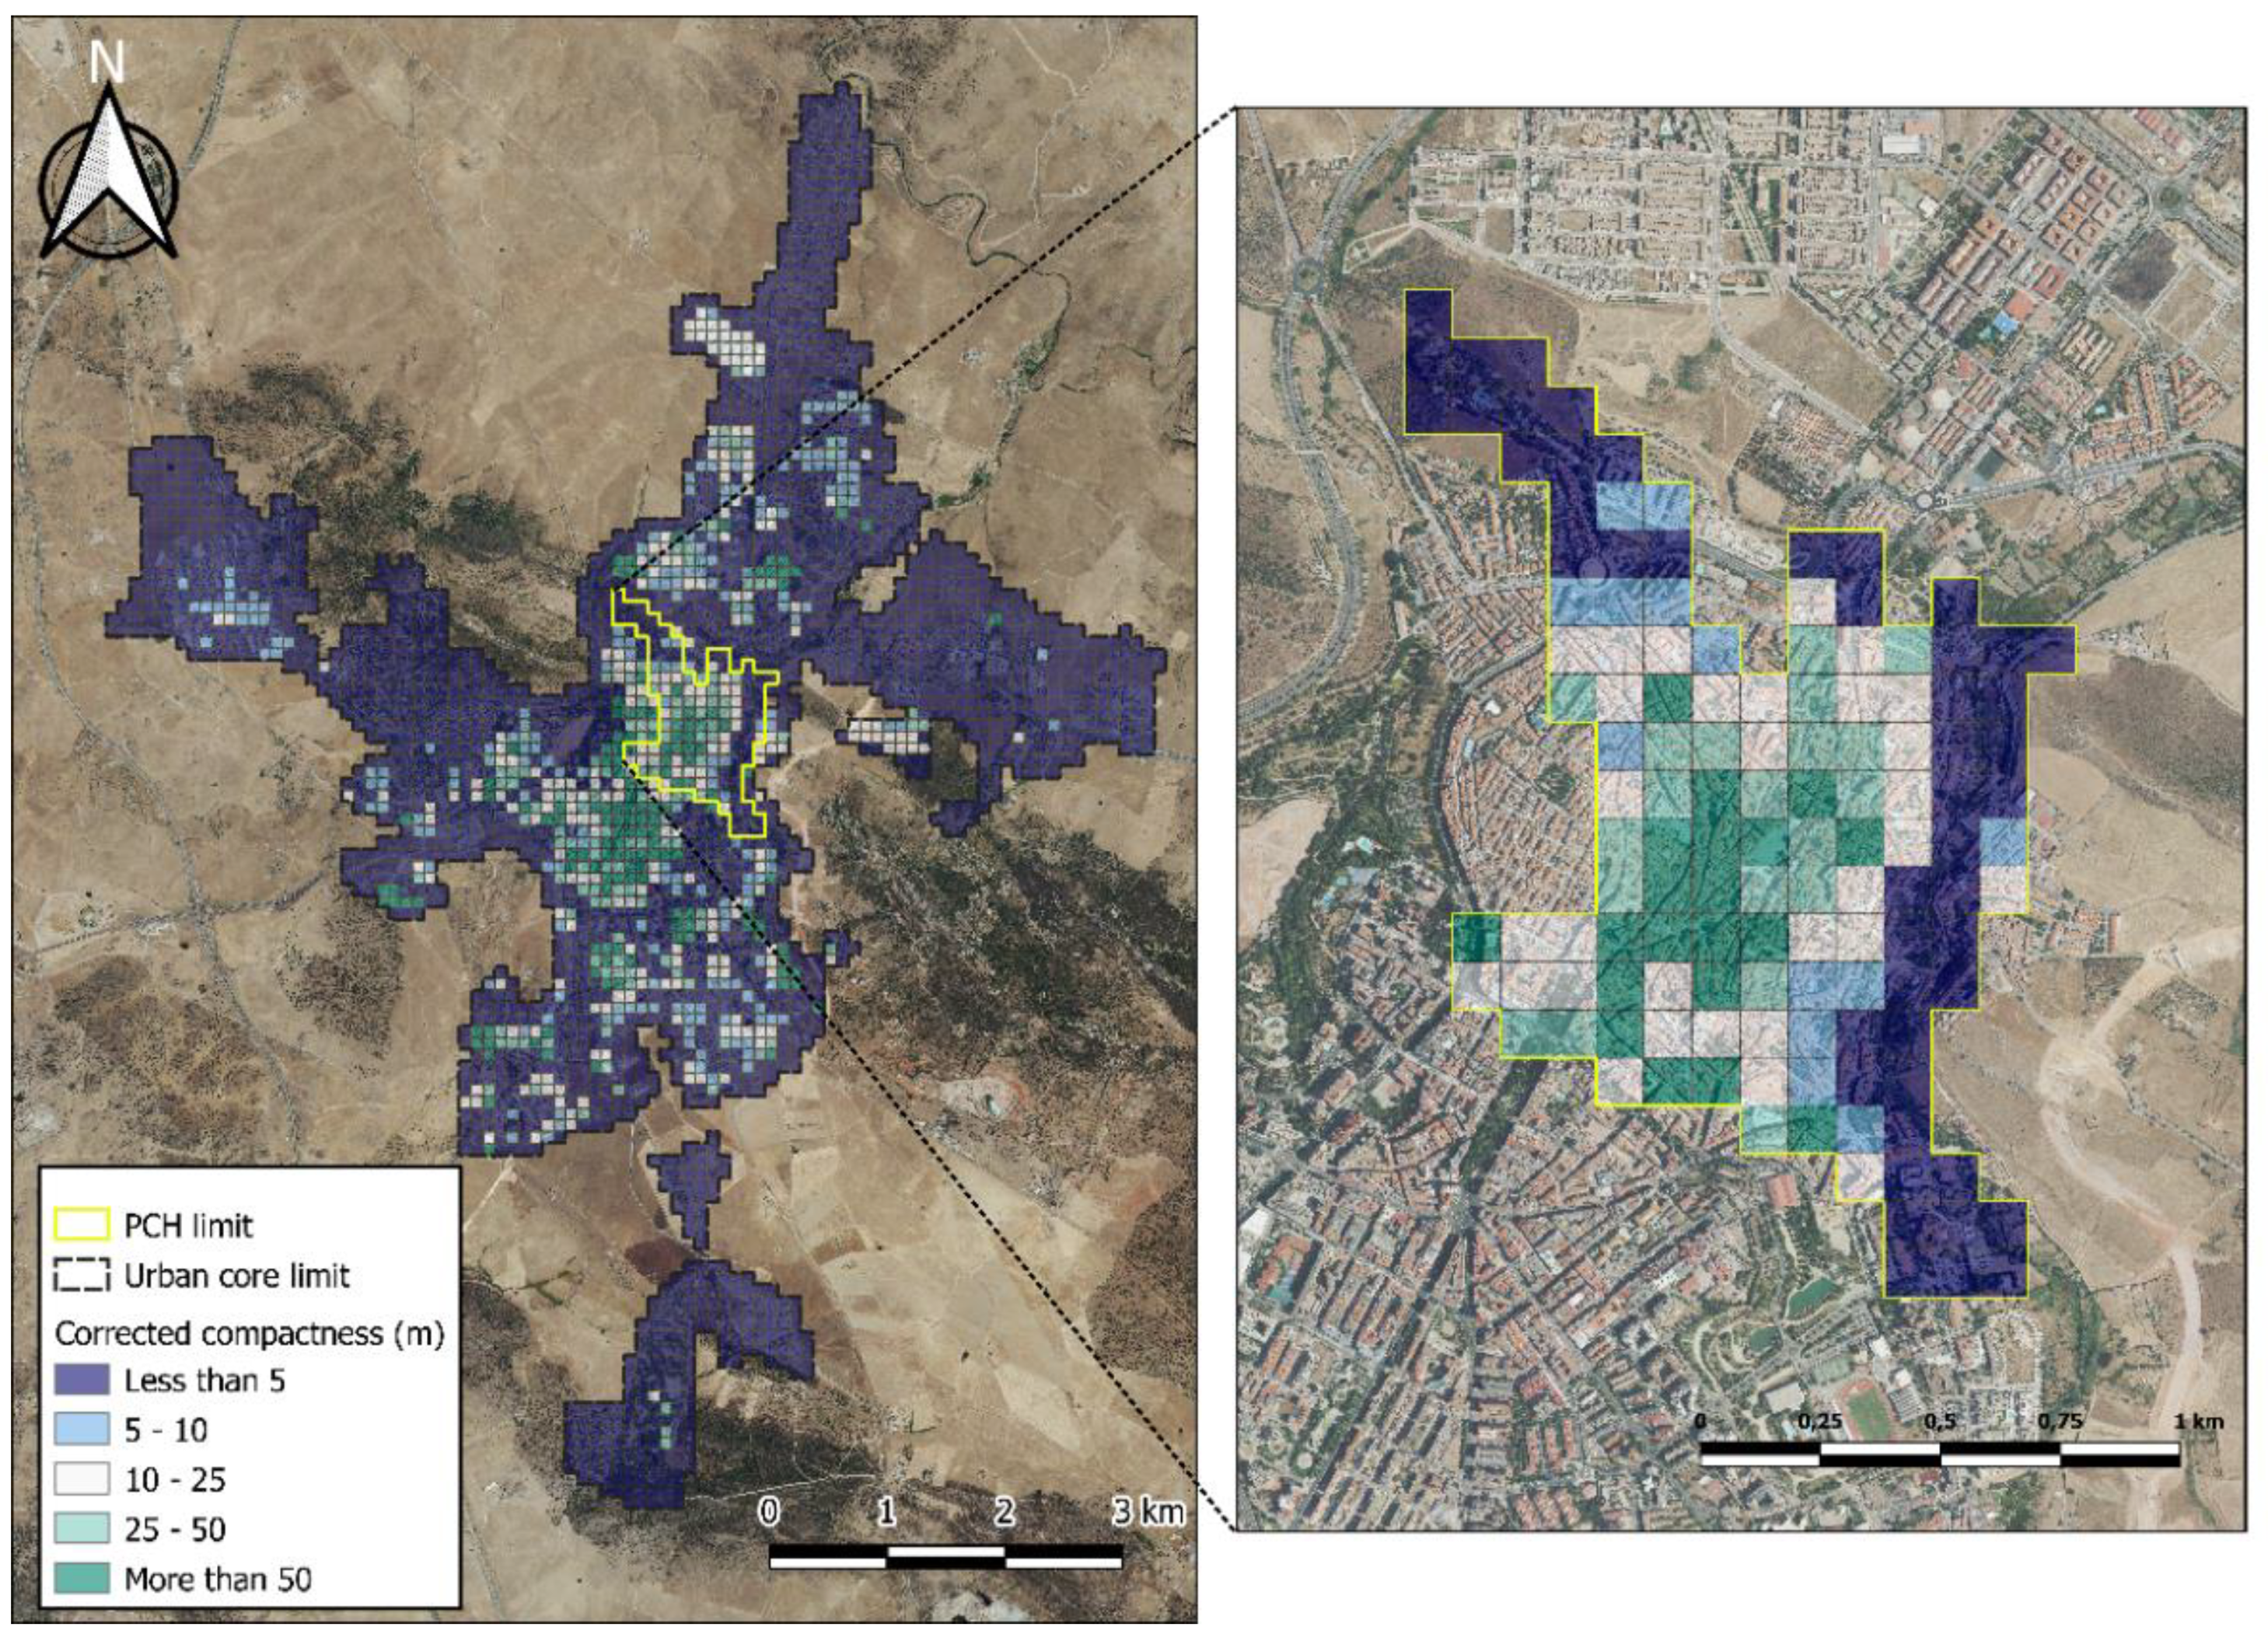
3.2.1. Corrected Compactness
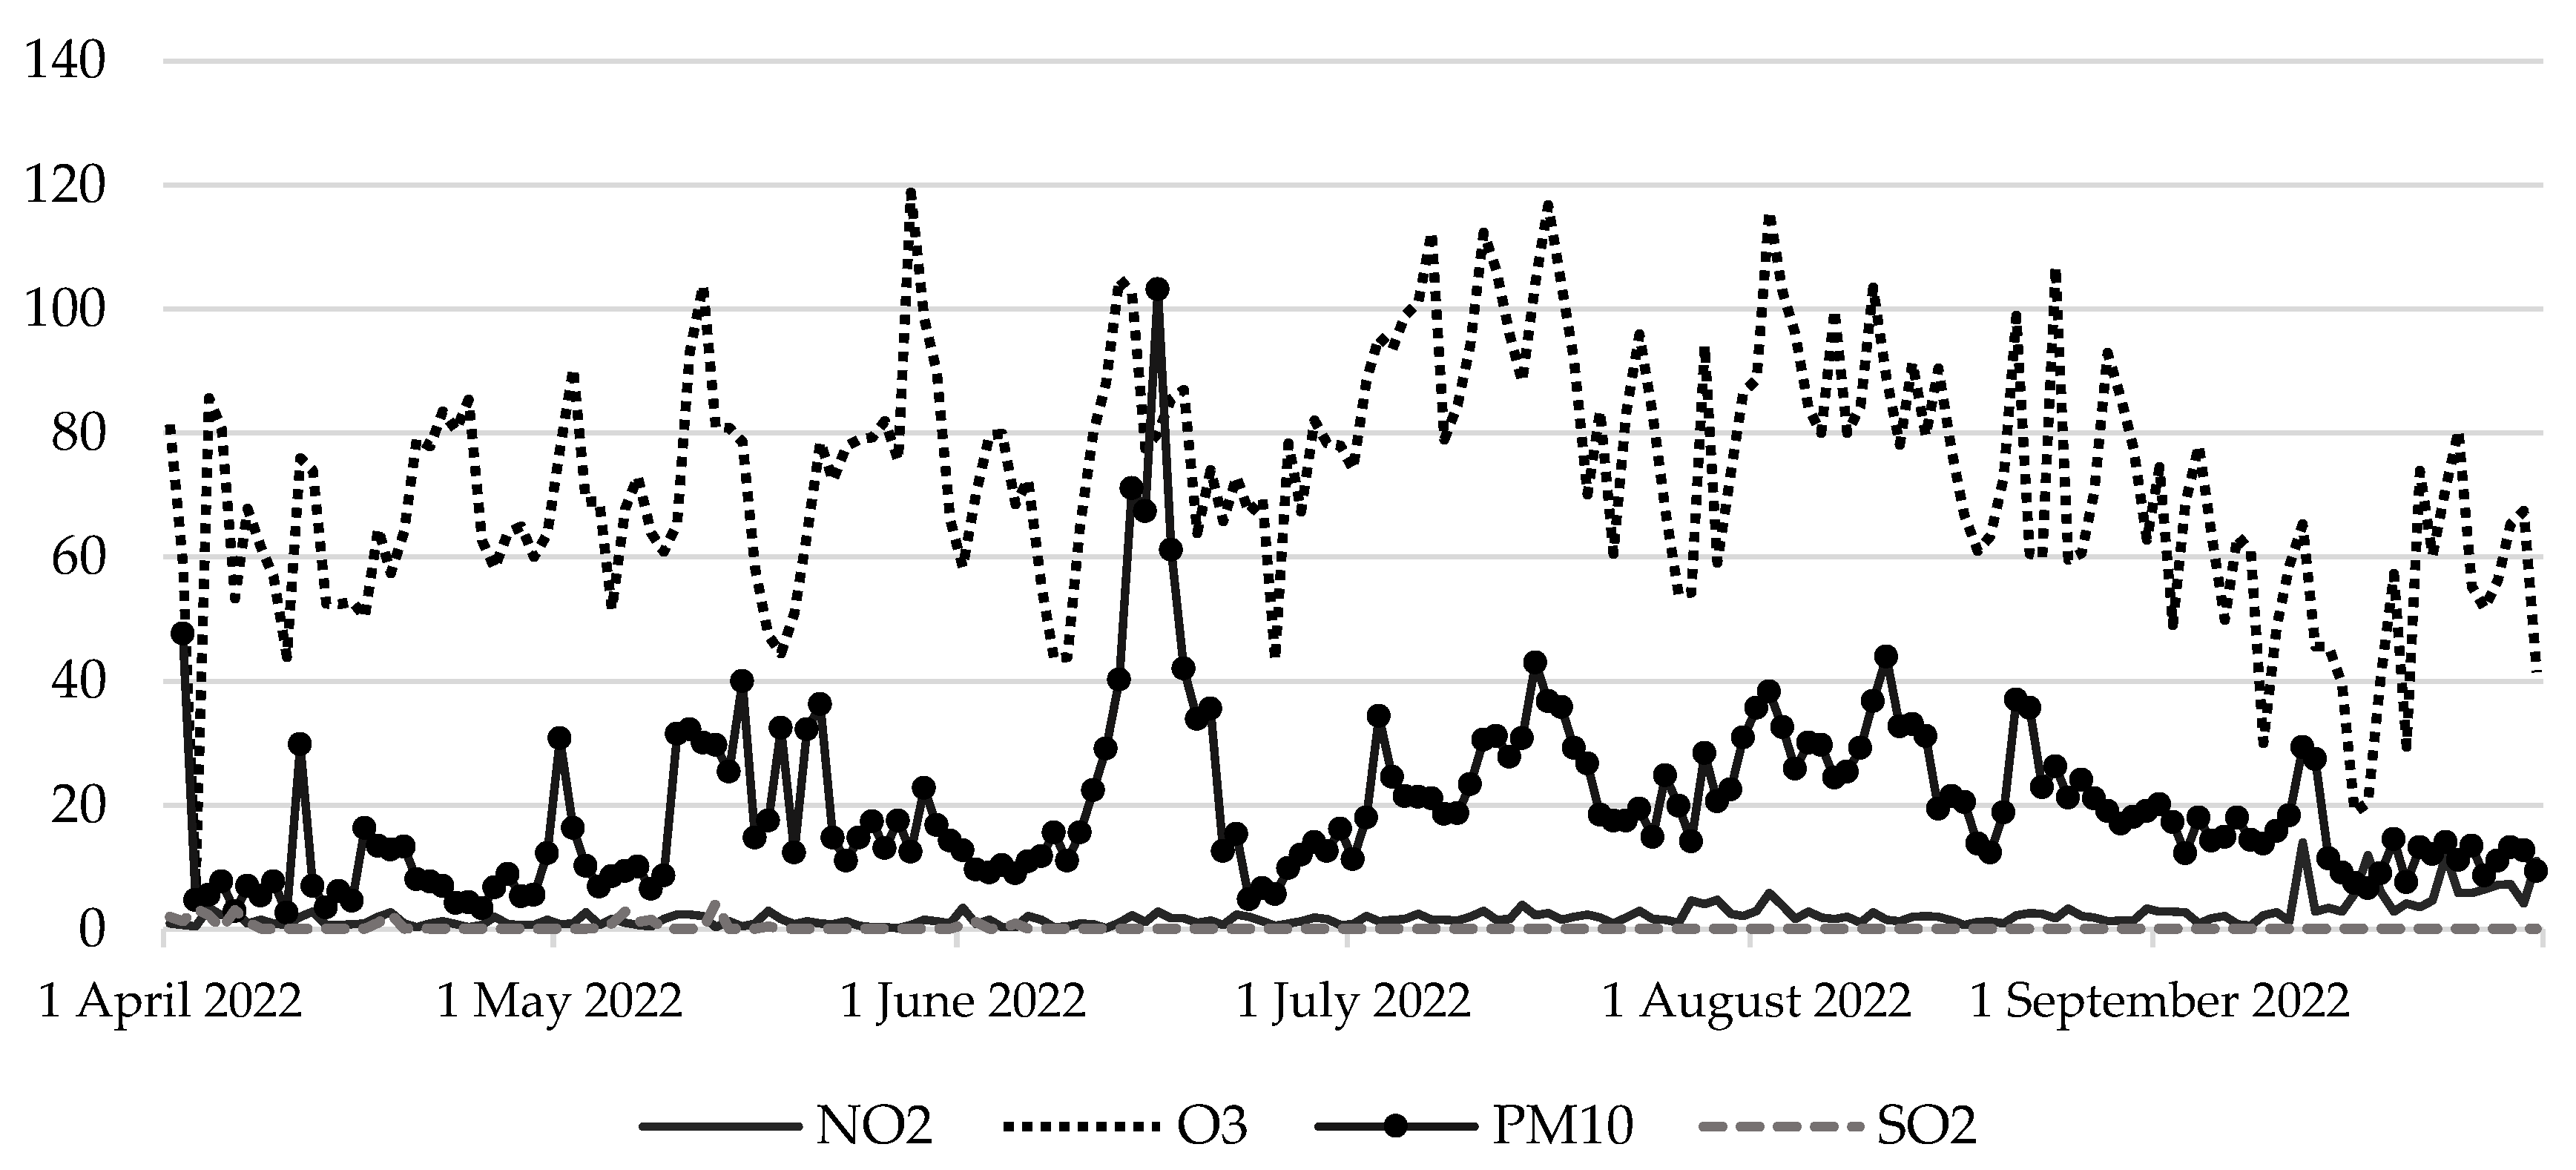
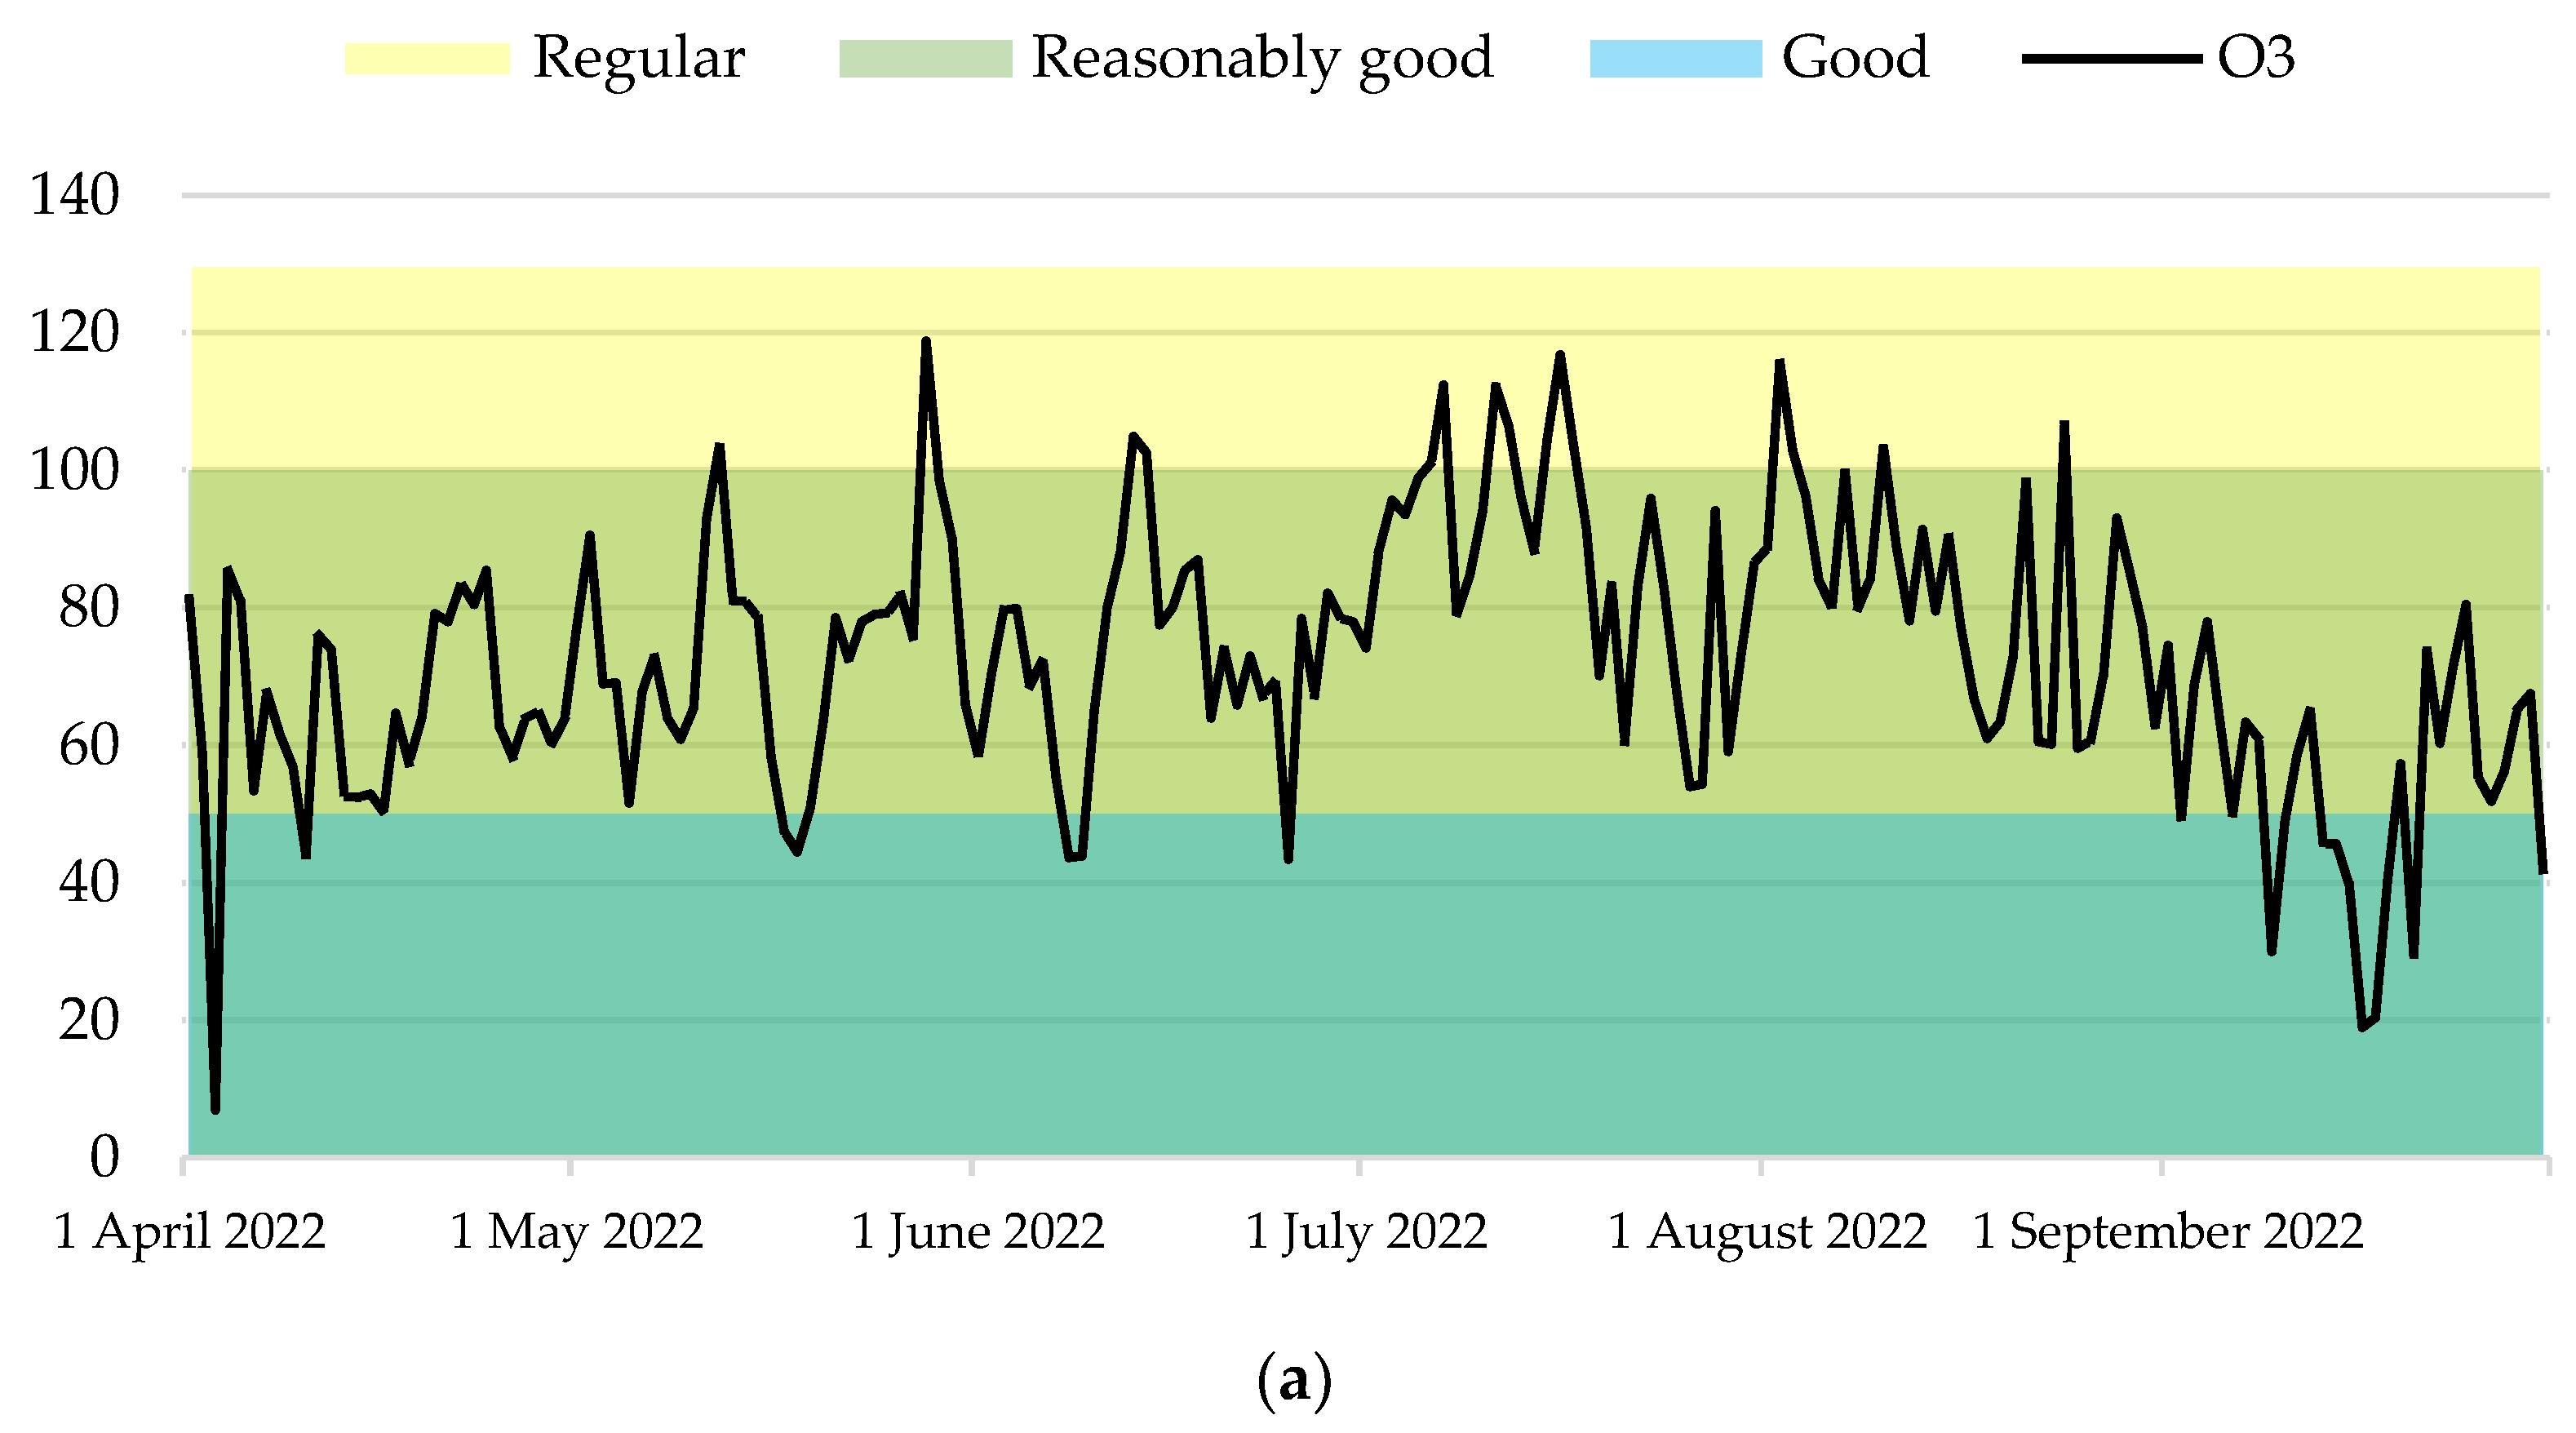
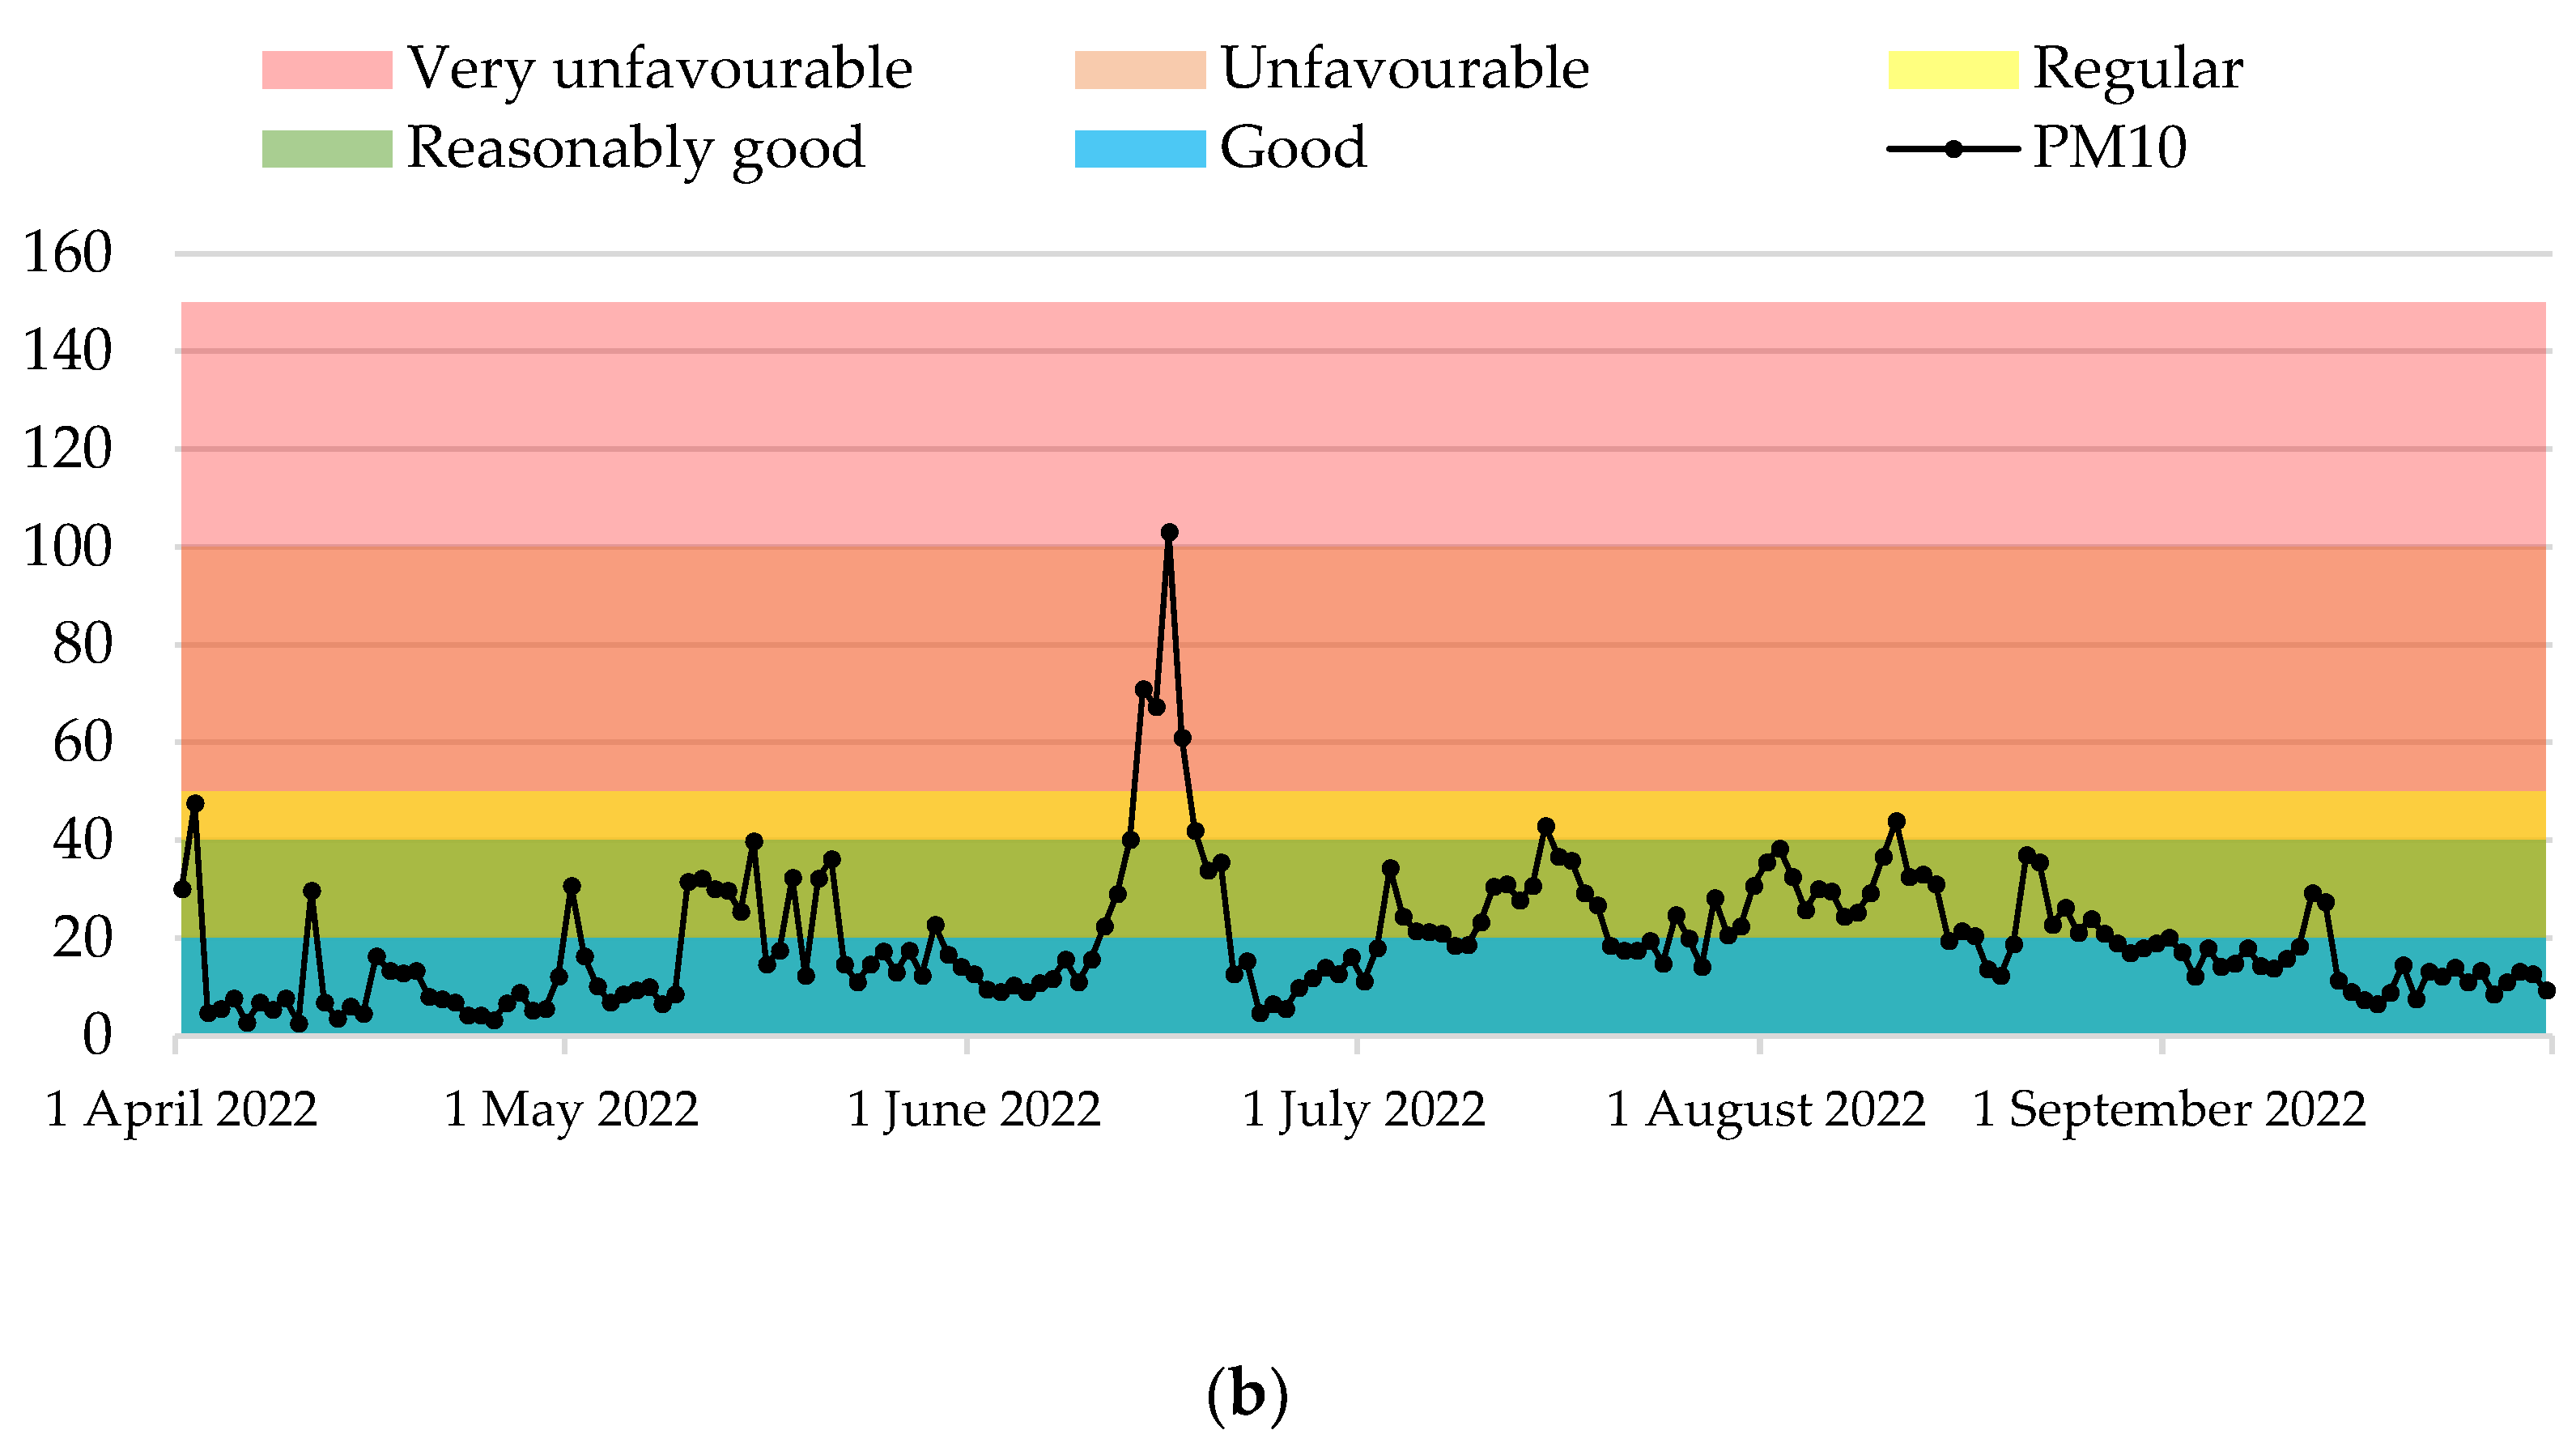
There must be an acceptable proportion between the areas destined to the activity of the urban system and the recreational areas to satisfy the recreational needs of the citizen to find a balance between the built-up area and the open spaces in a given area. In this way, Figure 5 shows the distribution of the built volume, as well as those public recreational spaces present in each area of the city.
Related to the previous section, corrected compactness makes it possible to identify those areas of the city where there is a relative balance between built and open spaces. In comparison with absolute compactness, the corrected compactness parameter shows a notable reduction in those areas of the city centre where the values are more sustainable in terms of building intensity. Even so, in the most dynamic areas of the city, which are located around the main avenues, the corrected compactness values are higher than 10 m, and there are areas where the figures can be higher than 50 m. Although there are areas with desirable values for this indicator, it is considered necessary to point out that a large part of the city is below 5 m.
Based on the results obtained in the PCH, the eastern and south-western areas of this delimitation show values of less than 5 m in the area located in the Plaza Mayor (the true historic centre of the city), while in the outlying streets figures of more than 50 m are observed, with the rest of the grids in the range of 10–50 m.
A comparison between the two study areas under investigation both in the PCH and in the entire city, the corrected compactness shows a distribution much lower than the absolute compactness. For those areas with a corrected compactness value greater than 50 m, a figure of around 8% is obtained for the PCH, and 5% for the entire city. This means that there are few areas in the city of Cáceres where there is a real balance between built spaces and free spaces for citizens, and these are distributed unevenly throughout the municipality.

3.2.2. Air Quality

The air quality index is a qualitative value assigned to the municipality under analysis. It is based on the suitability of the air for breathing and is a specific measure of quality, depending on the effects on human health of the different exposures of the citizen to the urban environment, given that the daily activities of the individual can cause different levels of air pollution. Figure 6 shows the results obtained for the quantification of air quality in the city of Cáceres. For the analysis, the values of particulate pollutants NO2, O3, PM10 and SO2 for the period from 1 April to 30 September 2022 have been selected.
Figure 6 shows the evolution of air quality in the city of Cáceres considering the values between April and September 2022 for the four pollutants considered and collected by the ministry to assess the conditions existing in Spanish cities. In this way, a significant variability of the results can be seen, especially the values obtained for O3 and PM10, which show significant increases. In these cases, the air quality data can reach values that are considered unfavourable. About the evaluation of NO2 and SO2, the results obtained confirm that the analysis carried out in the period considered provides good air quality for these pollutants.
Figure 7 shows in detail the fluctuation of air quality in the city of Cáceres in terms of O3 and PM10 pollutants due to their greater variability and impact on the data collected.
Figure 7a shows that most of the results show a reasonably good air quality, with values ranging from 50–100 µg/m3. Similarly, during a period of 15 days the limit of 100 µg/m3 has been exceeded, which implies that the air quality category of the city of Cáceres has been regular. In relation to Figure 7b, which refers to PM10, the results obtained are characterised by significant variability, with most of the values being in the range of good (0–20 µg/m3) or reasonably good (20–40 µg/m3) air quality. It should be noted that the highest PM10 values were reached during the month of June, due to the intrusion of air from the Sahara.
Therefore, although there are some specific time periods in which values higher than those set out in the World Health Organization (WHO) guidelines have been reached, the air quality in the city of Cáceres is considered good enough to achieve the values set by the WHO and reduce the risk to the population of suffering from acute and chronic illnesses (externalities derived from air pollution).

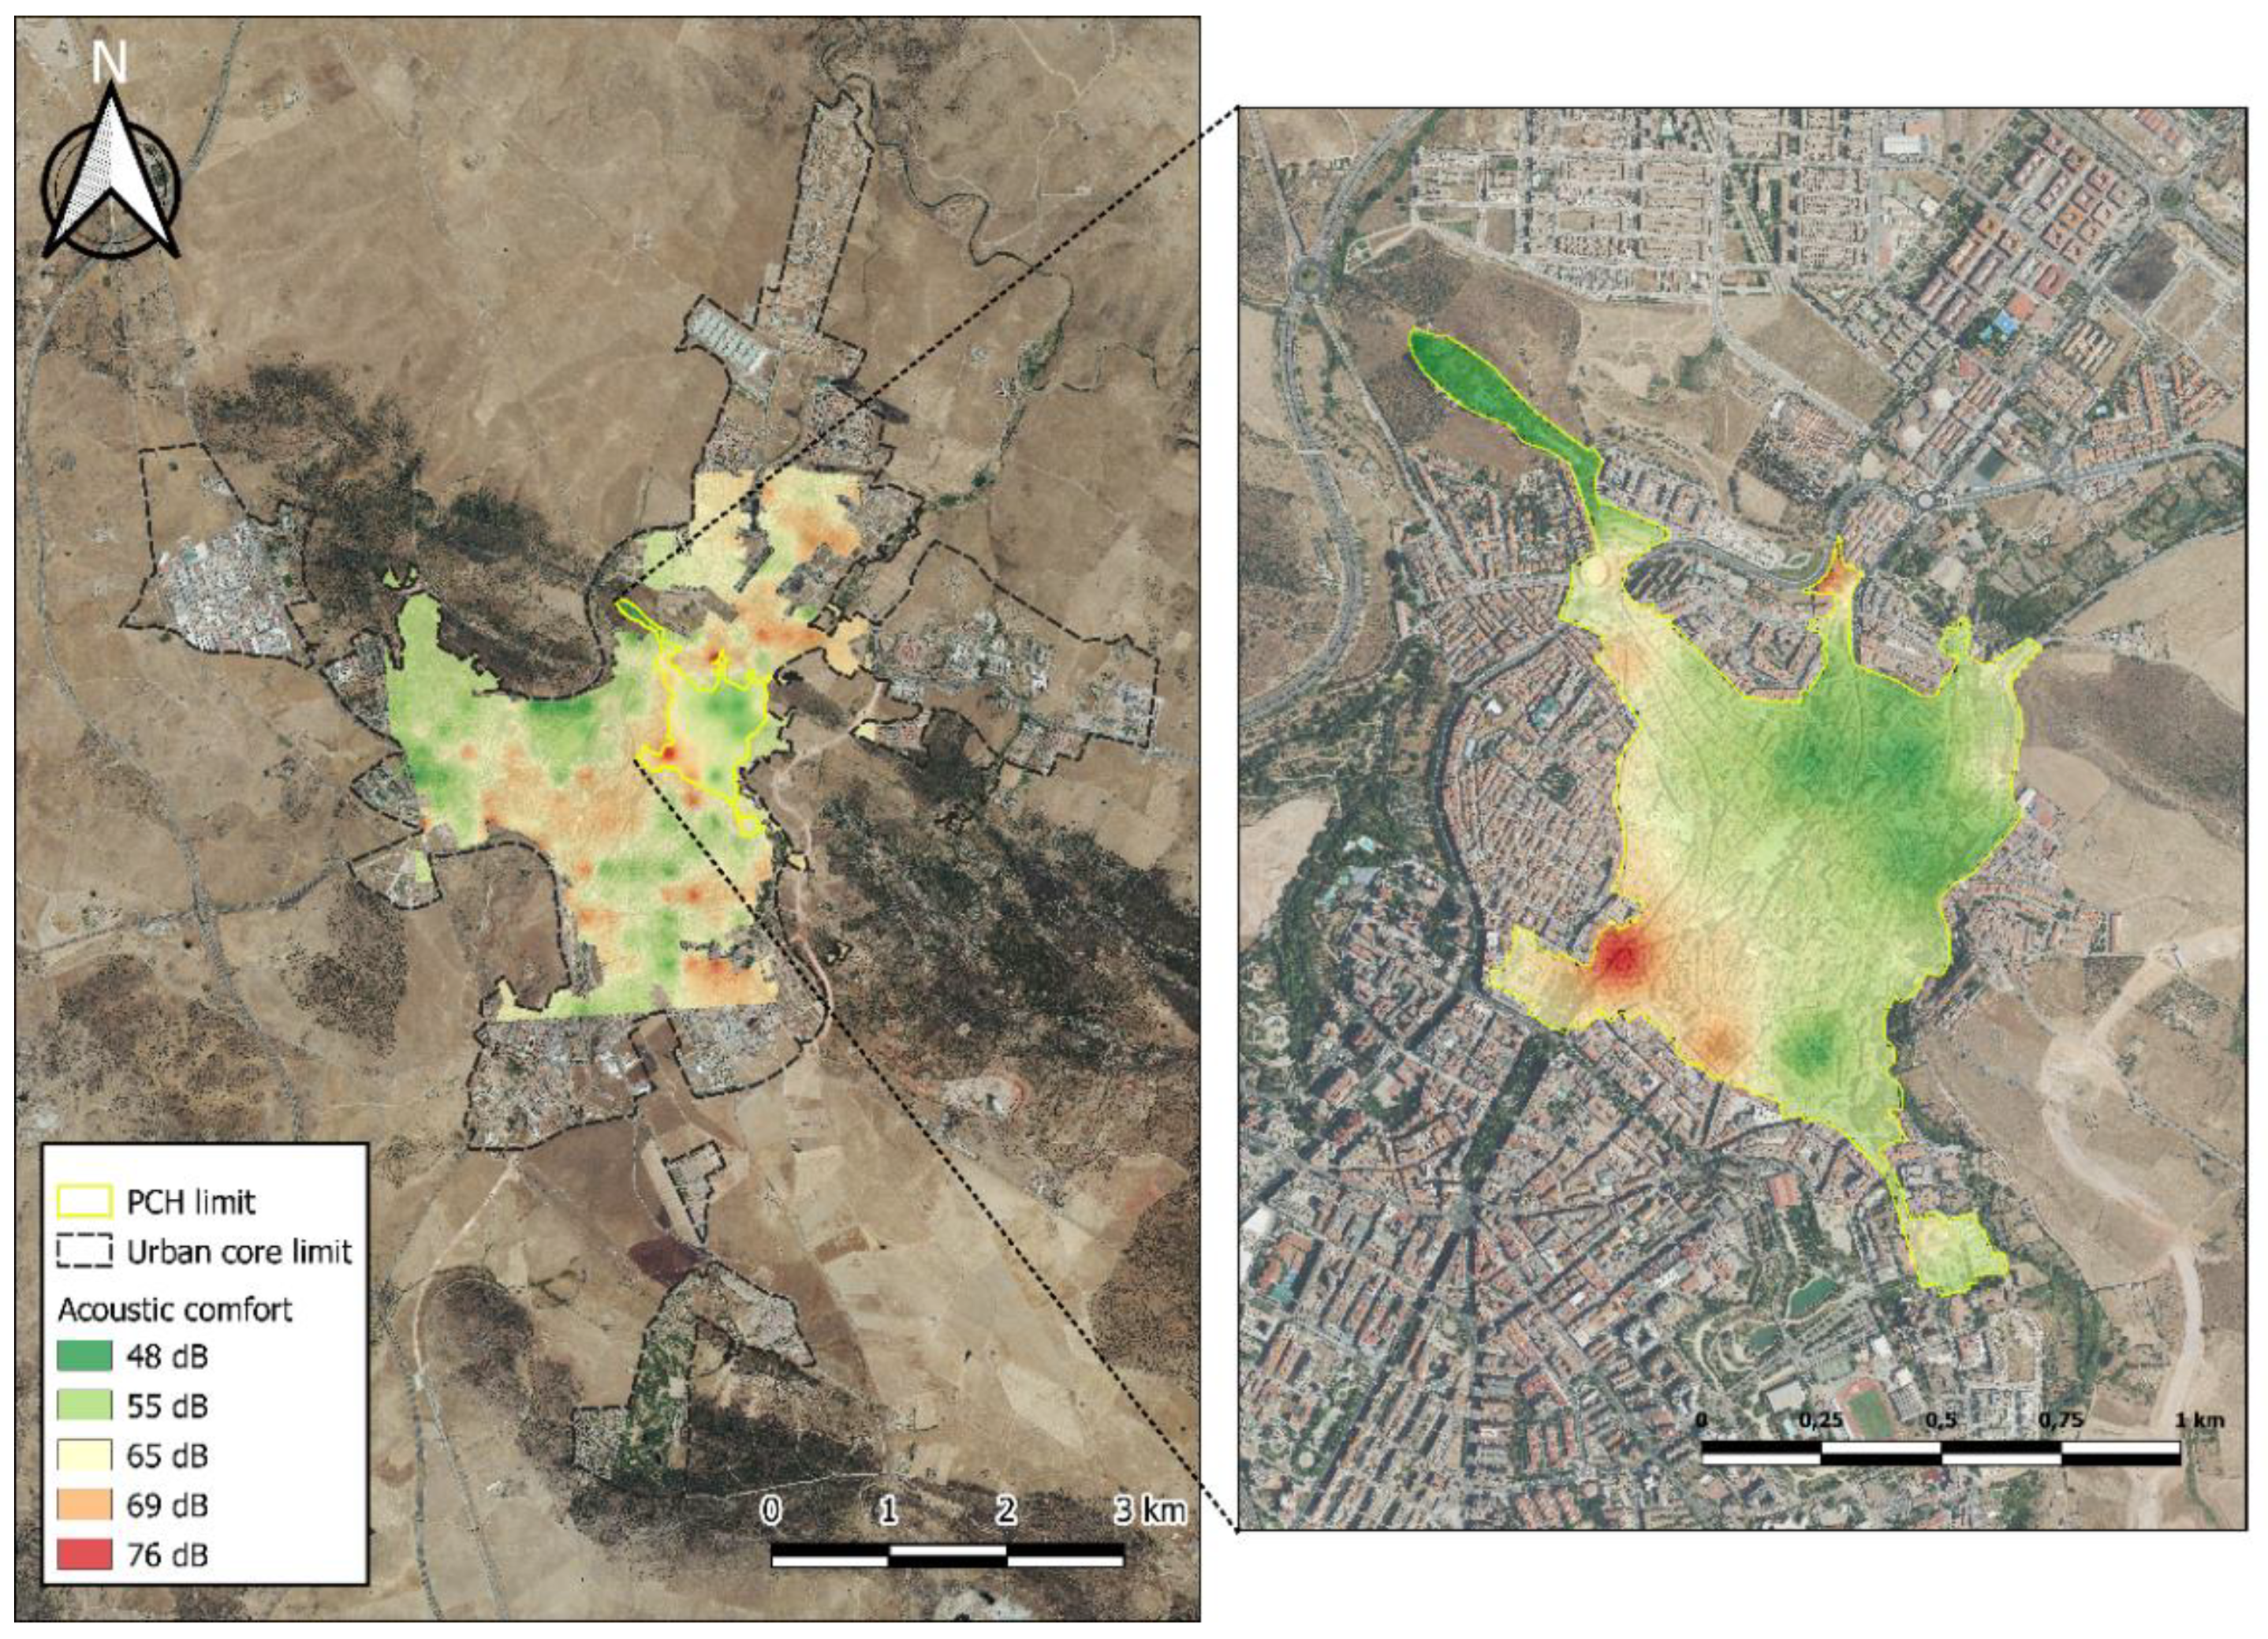
3.2.3. Acoustic Comfort

Using data obtained from the official Opendata website for the city of Cáceres, the acoustic comfort of the municipality was analysed and graphically represented in Figure 8.
The colour map shows the areas where there is a greater exposure of the population to different levels of noise nuisance, making it possible to determine possible locations where there could be greater problems of traffic congestion generated by the continuous traffic of vehicles. A georeferenced spatial representation of the values of each of the acoustic control points on the open data platform of the city of Cáceres has been carried out, showing that the highest values (above 69 dB) correspond to the main streets of the city, which are home to commercial and administrative enclaves. The rest of the city exhibits values between 48 and 55 dB. On the other hand, as can be seen in Figure 8, results covering the entire urban core of the city of Cáceres are not available due to the lack of data at source, which makes the analysis slightly more difficult.
Looking exclusively at the PCH, there is a location where the acoustic comfort levels exceed 75 dB, identifying this point as the priority place for road access to the historic environment from more dynamic areas where private vehicles, public transport and pedestrian mobility coexist. The rest of the PCH delimitation shows figures between 48 and 55 dB, mainly due to the fact that it is a pedestrian zone with a single platform section, in which the passage of vehicles is almost exclusively for people living inside the walled enclosure, as well as for public services and the hotel and catering trade. This is an area where fewer and fewer people live, partly due to the loss of residential use of certain buildings in favour of foundations, the tertiary sector or gentrification processes.

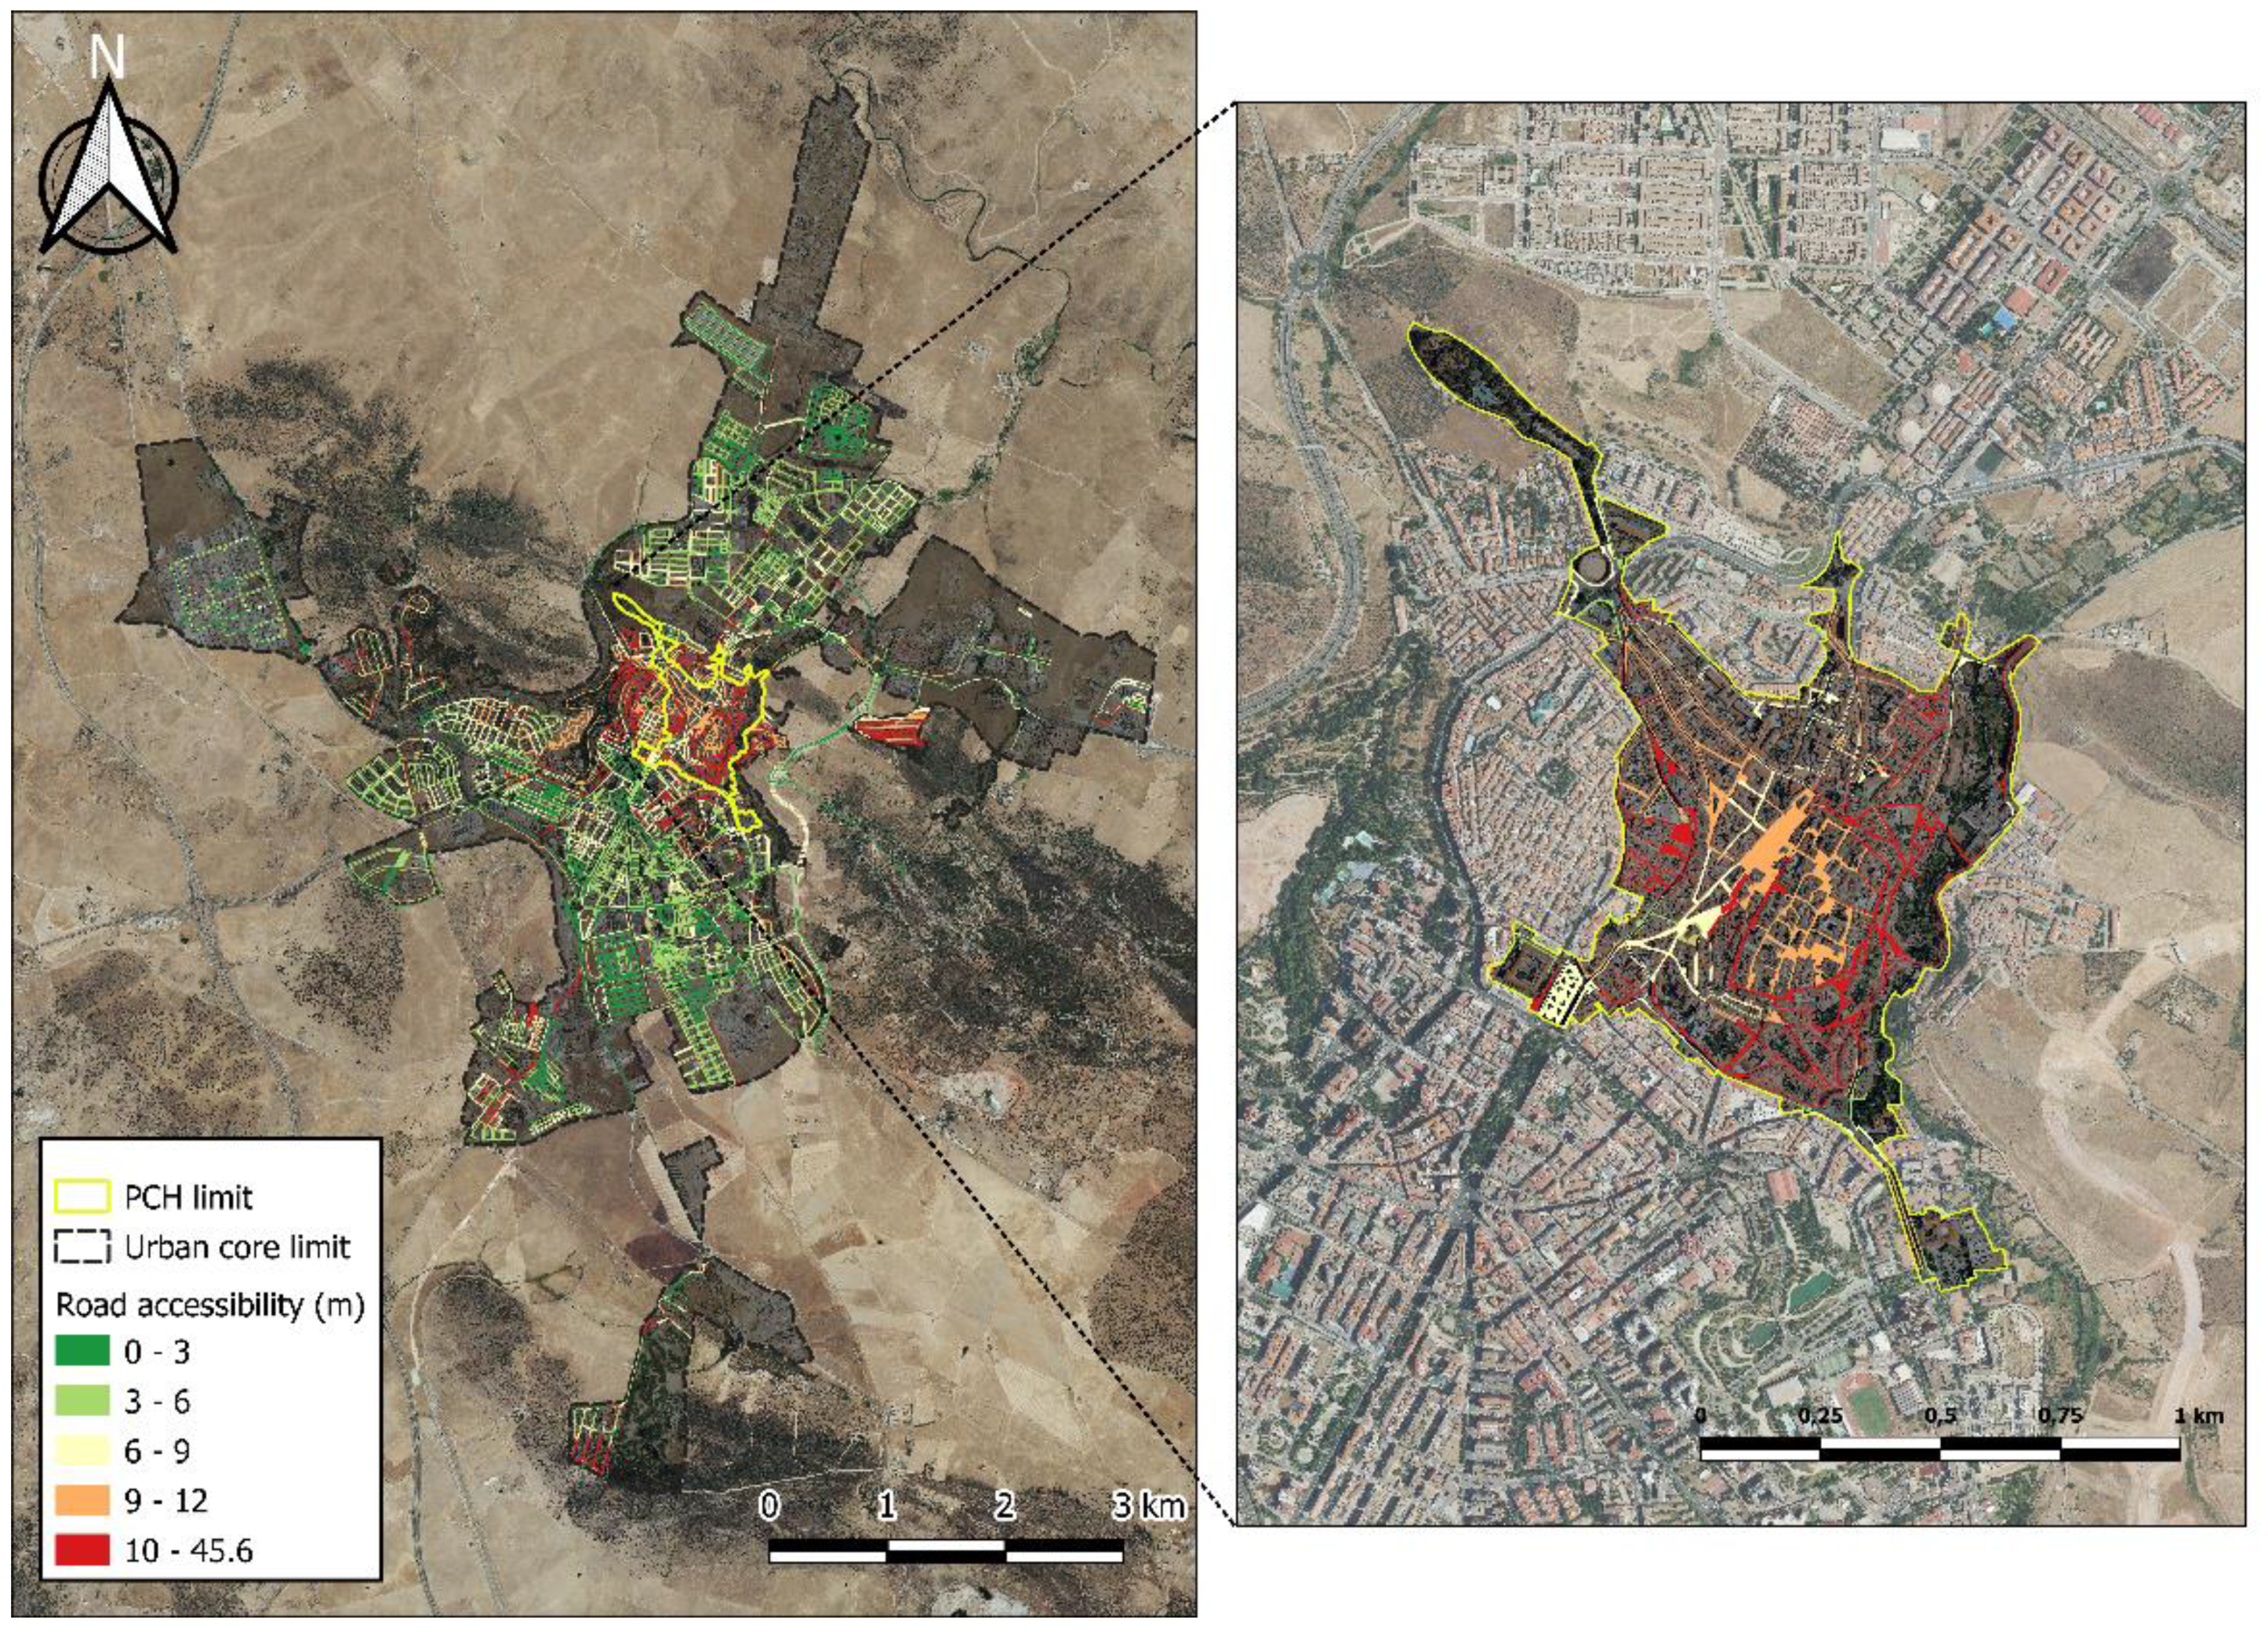
3.2.4. Road Accessibility

Improvement of accessibility in cities is considered a priority to provide a better quality of life for citizens. In this sense, it is essential to reduce as far as possible the possible physical barriers existing in urban centres. These obstacles directly affect people’s daily movements and their access to the different types of buildings, basic urban services, parks and any other public space. Figure 9 shows the stretches of pavement in the city of Cáceres with a greater or lesser degree of accessibility, considering the width of the pavement and its slope.
In the urban core of the city, it can be observed that a large part of the pavement sections has a gradient of less than 6%, mainly located in the areas of development and expansion of the city. These areas are characterised by large avenues where the width of the pavement is more than 2 m. Because of the orography of the city, there are also areas where the slopes are above 9%, which is most characteristic of the area delimited by the PCH. Considering the considerations set out in Order TMA/851/2021, of 23 July, which develops the technical document on basic conditions of accessibility and non-discrimination for access to and use of urbanised public spaces, the width of pavements must not be less than 1.80 metres and the maximum longitudinal slope may not exceed 6%.
Since the urban morphology of the PCH is influenced by the orography that characterises this area of the city, a large part of the pavements within this delimitation are below the minimum width that guarantees accessibility for all citizens. Similarly, a considerable part of the road has a gradient of over 12%. Even so, in recent years, public administrations have tried to solve these accessibility problems by creating coexistence traffic zones (single platform) in which pavements have been eliminated to prioritise mobility on foot.

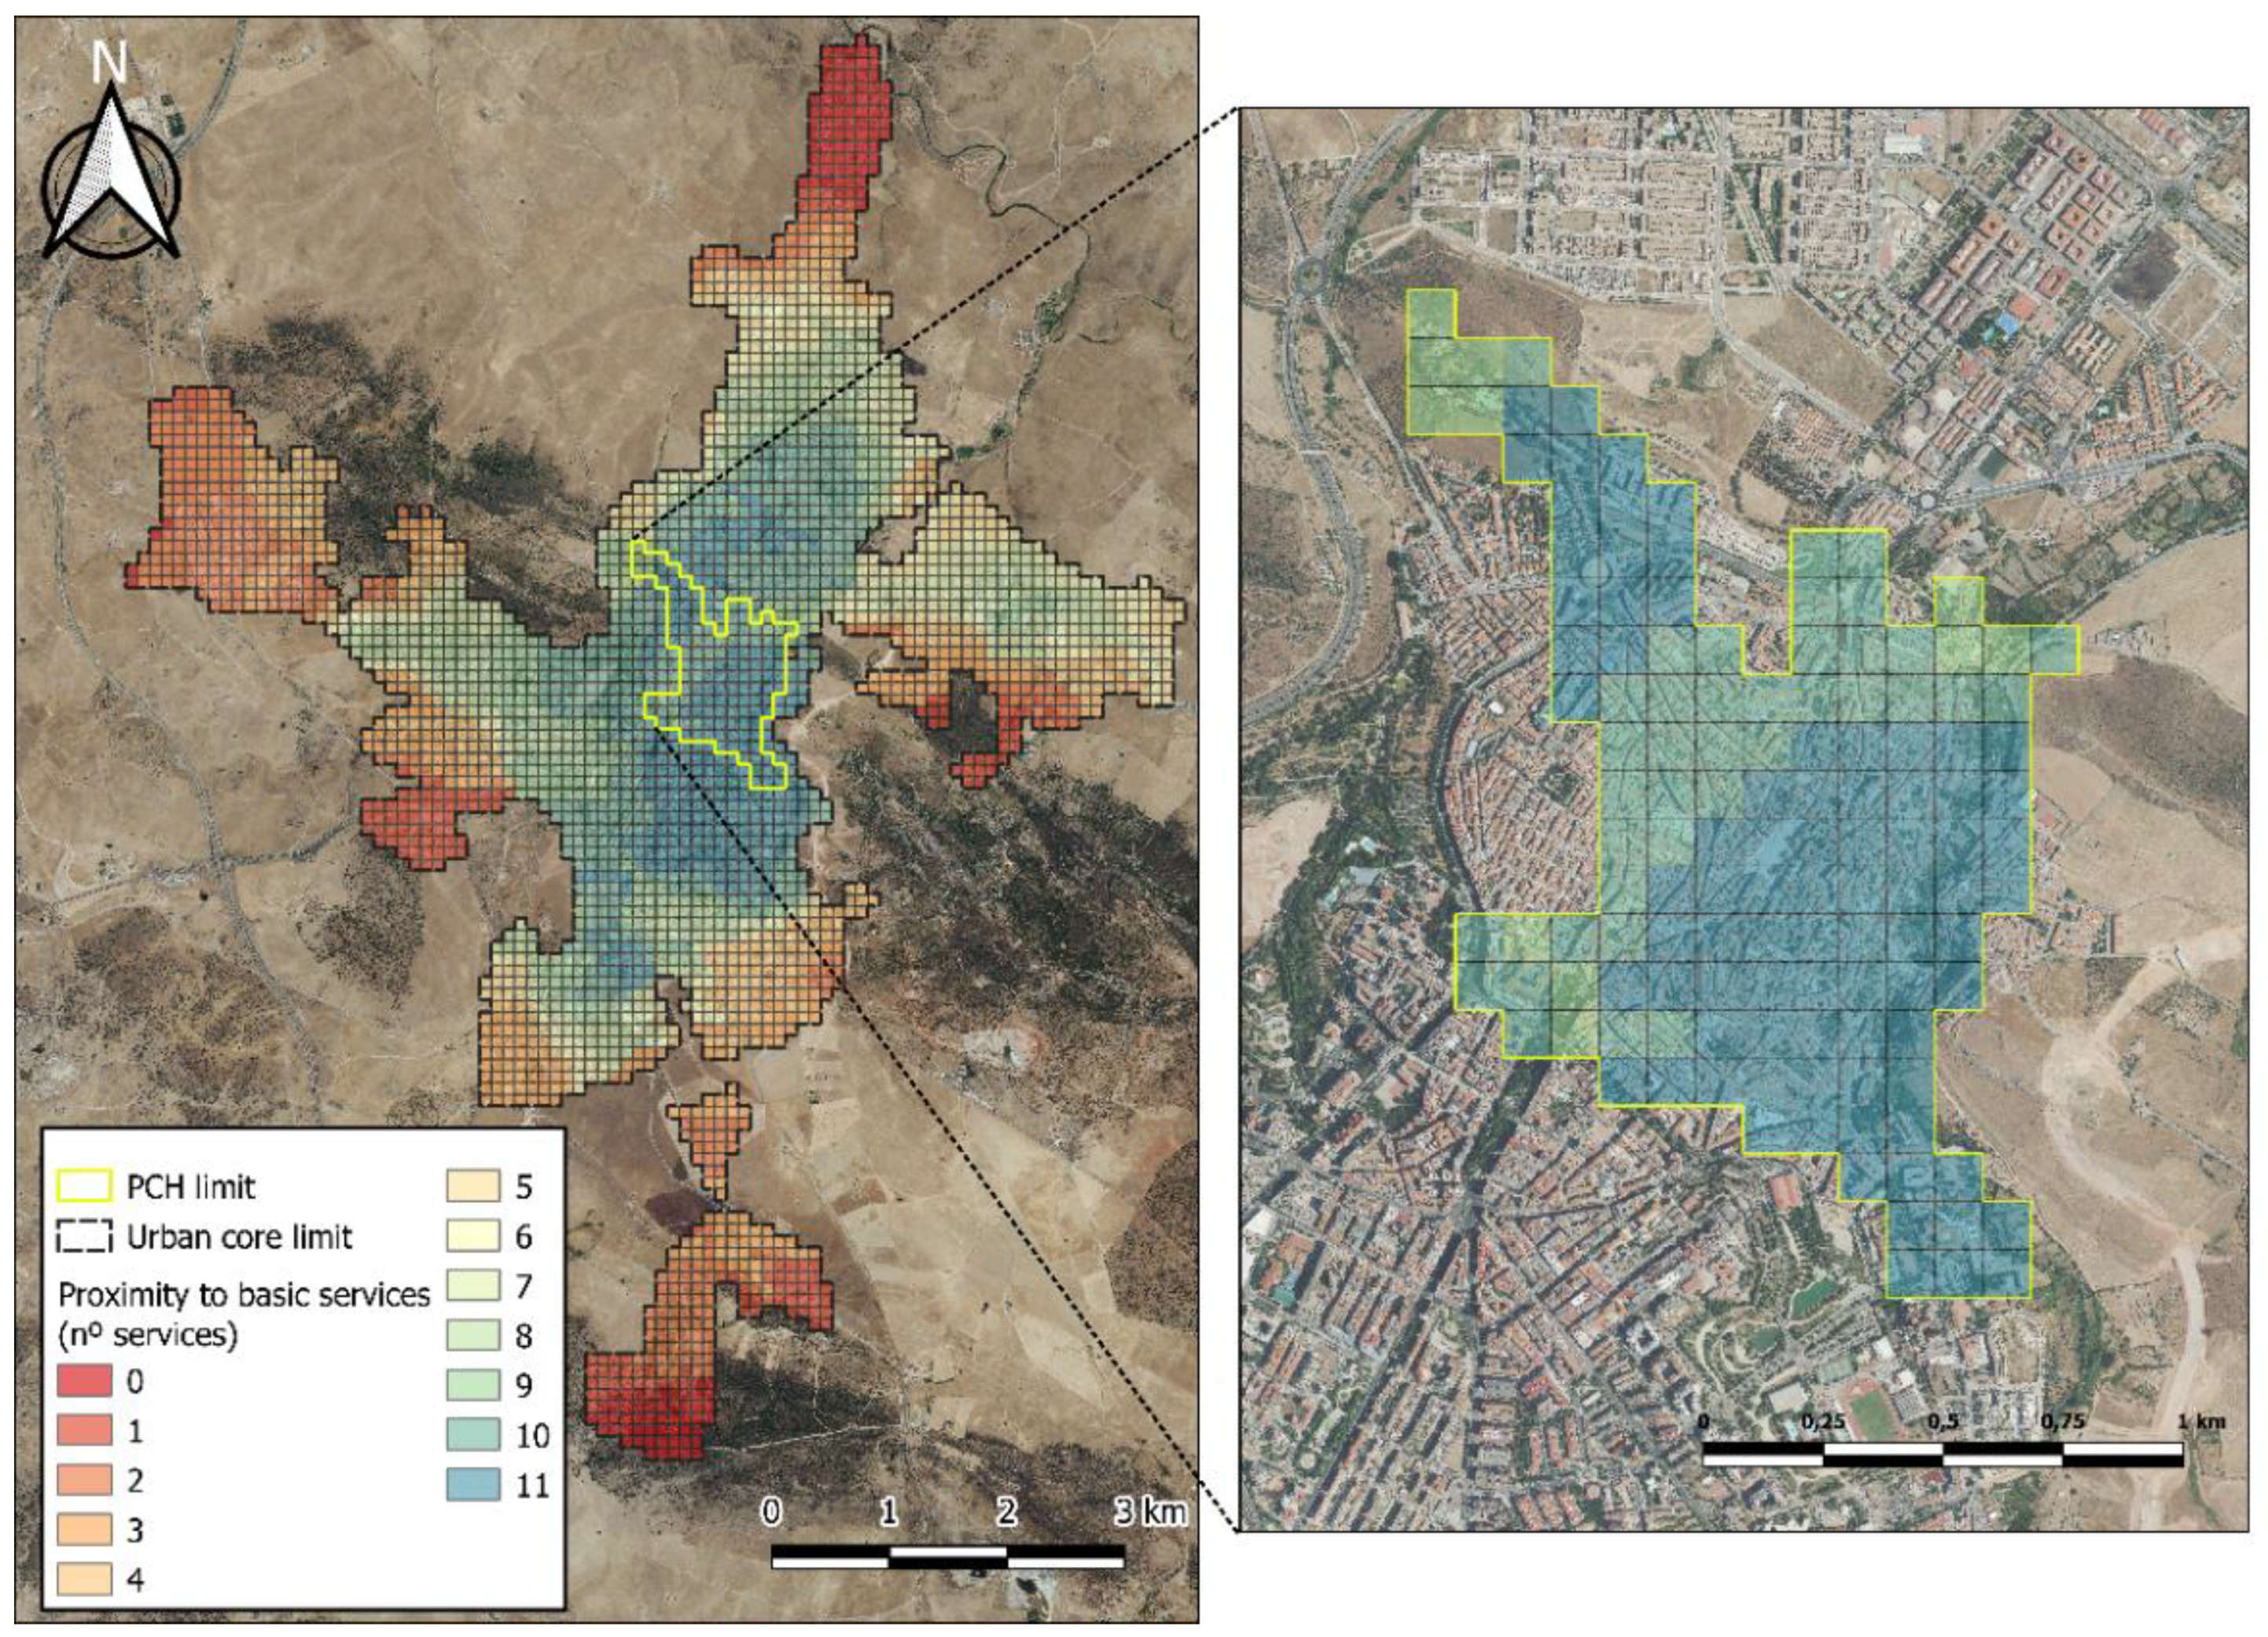
3.2.5. Proximity of Population to Basic Services

Identifying the proximity to the multiplicity of basic services in a city is a determining factor in order to define the city model, as it makes it possible to locate those areas of the city that have a greater degree of simultaneous accessibility to different services, and therefore those that do not enjoy this status. Figure 10 shows those areas of the city that have simultaneous coverage of public facilities, transport networks, local commercial activities and green spaces within a 10 min walk (action range of 600 m).
It is clear from the map shown that the proximity to basic services is concentrated in the central areas of the urban core, with the bordering areas barely having several of the services established in the prefixed radius of action. In the central area of the municipality, up to 10 and 11 basic services are available, due to its proximity to educational, cultural, sports, health and social welfare facilities, as well as its proximity to local commercial activities, mobility networks and green spaces. However, in the northern and southern areas of the city centre, as they are further away from the daily dynamism of the city, there are several areas that are not close to any of the services analysed.
The situation of the PCH about basic services is very optimistic, given that a large part of this area has access to all the established services and the rest of the area also has access to 9–10 services, but is further away from the cycle lane networks and green spaces.
In the case of the PCH, it is obtained that in 63% of its territory the population has access to basic services at less than 600 m, with values close to 12% at the level of the entire city. The areas outside the urban nucleus of Cáceres show a significant lack of proximity services, with values of less than 3 services in this area. However, it is determined that in the PCH the citizen has access to 9, 10 or 11 basic services of proximity in all its delimitation.

3.3. Mobility and Services

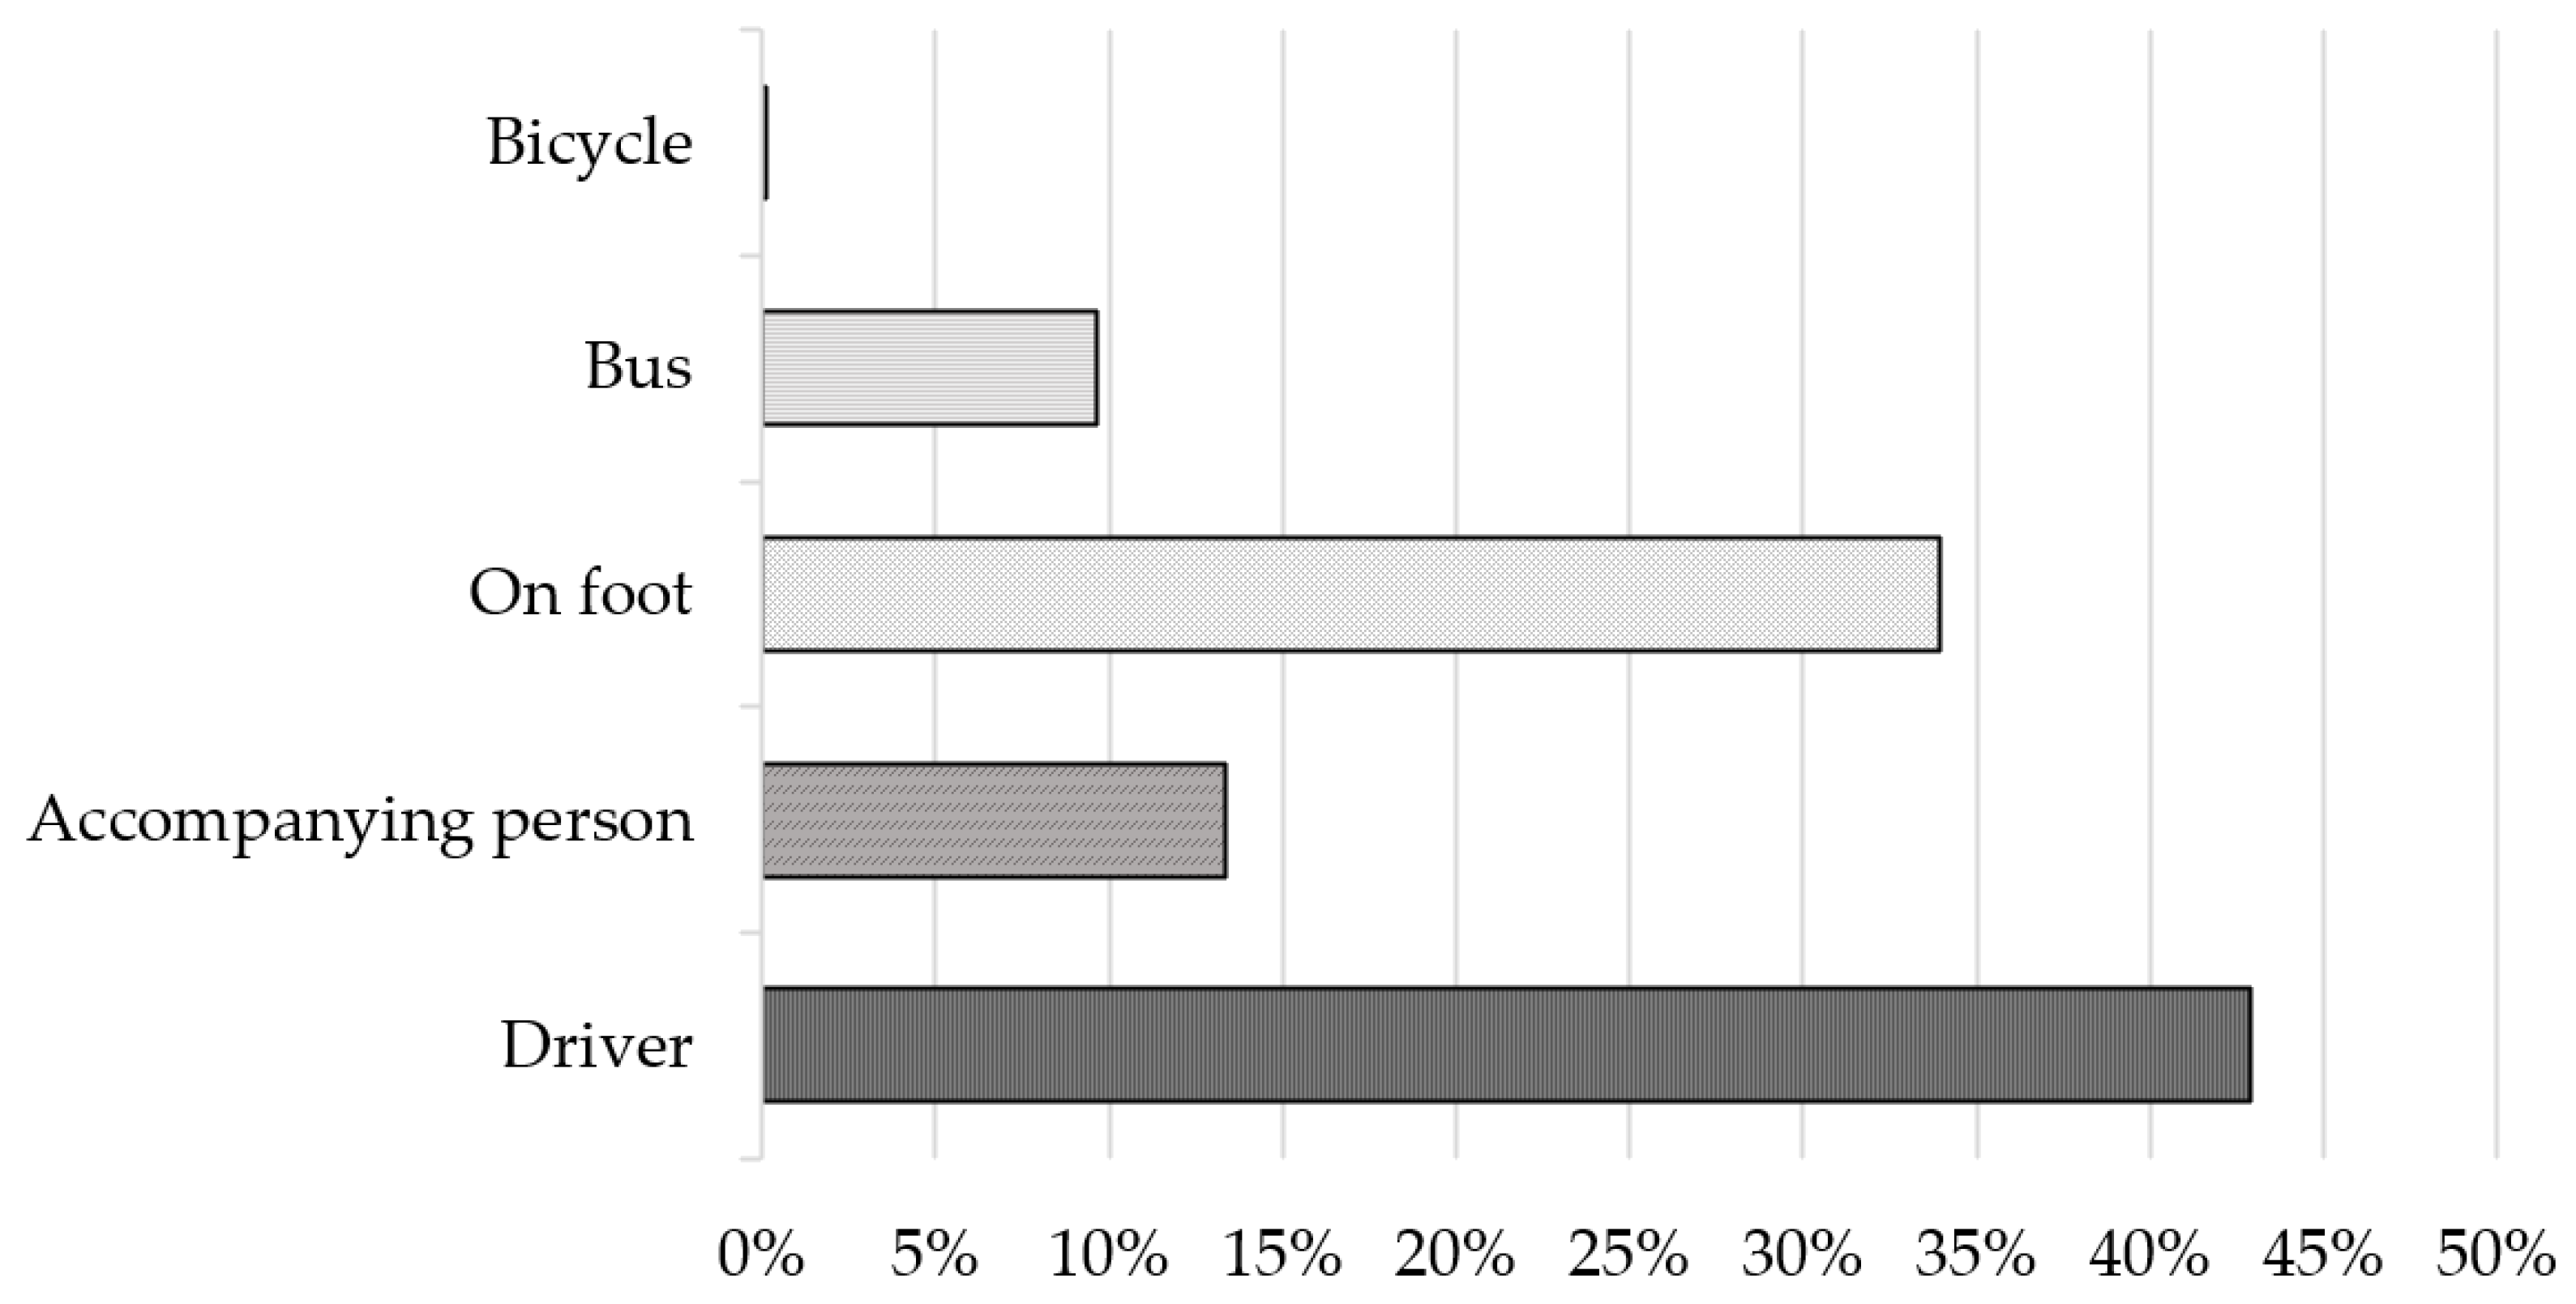
3.3.1. Population Movement Mode

The mobility trend in the city of Cáceres is characterised by an increasing use of private vehicles compared to other cities of similar size, where most short trips are made on foot. This could be attributed to the orographic characteristics of the city, which makes walking less attractive, as well as the peculiar distribution of areas in the city, which makes good public transport planning quite difficult.
The overall mobility of the municipality amounts to a total of more than 185,000 internal trips on a working day, which is almost two trips per person per day. As for the modal split, the distribution of trips can be seen in Figure 11. The data presented have been obtained from [65] and need to be slightly updated, as changes have occurred and new forms of mobility have emerged, such as the emergence of personal mobility vehicles on public roads.
The graph shows that private vehicle journeys account for approximately 55% of journeys, pedestrian mobility 34%, public transport 10% and cycling is a mere token of participation with less than 1%. These data show the population’s predisposition to travel by private vehicle, which causes problems associated with traffic congestion, worsening the quality of life of citizens in terms of occupation of public space, road safety and air quality.

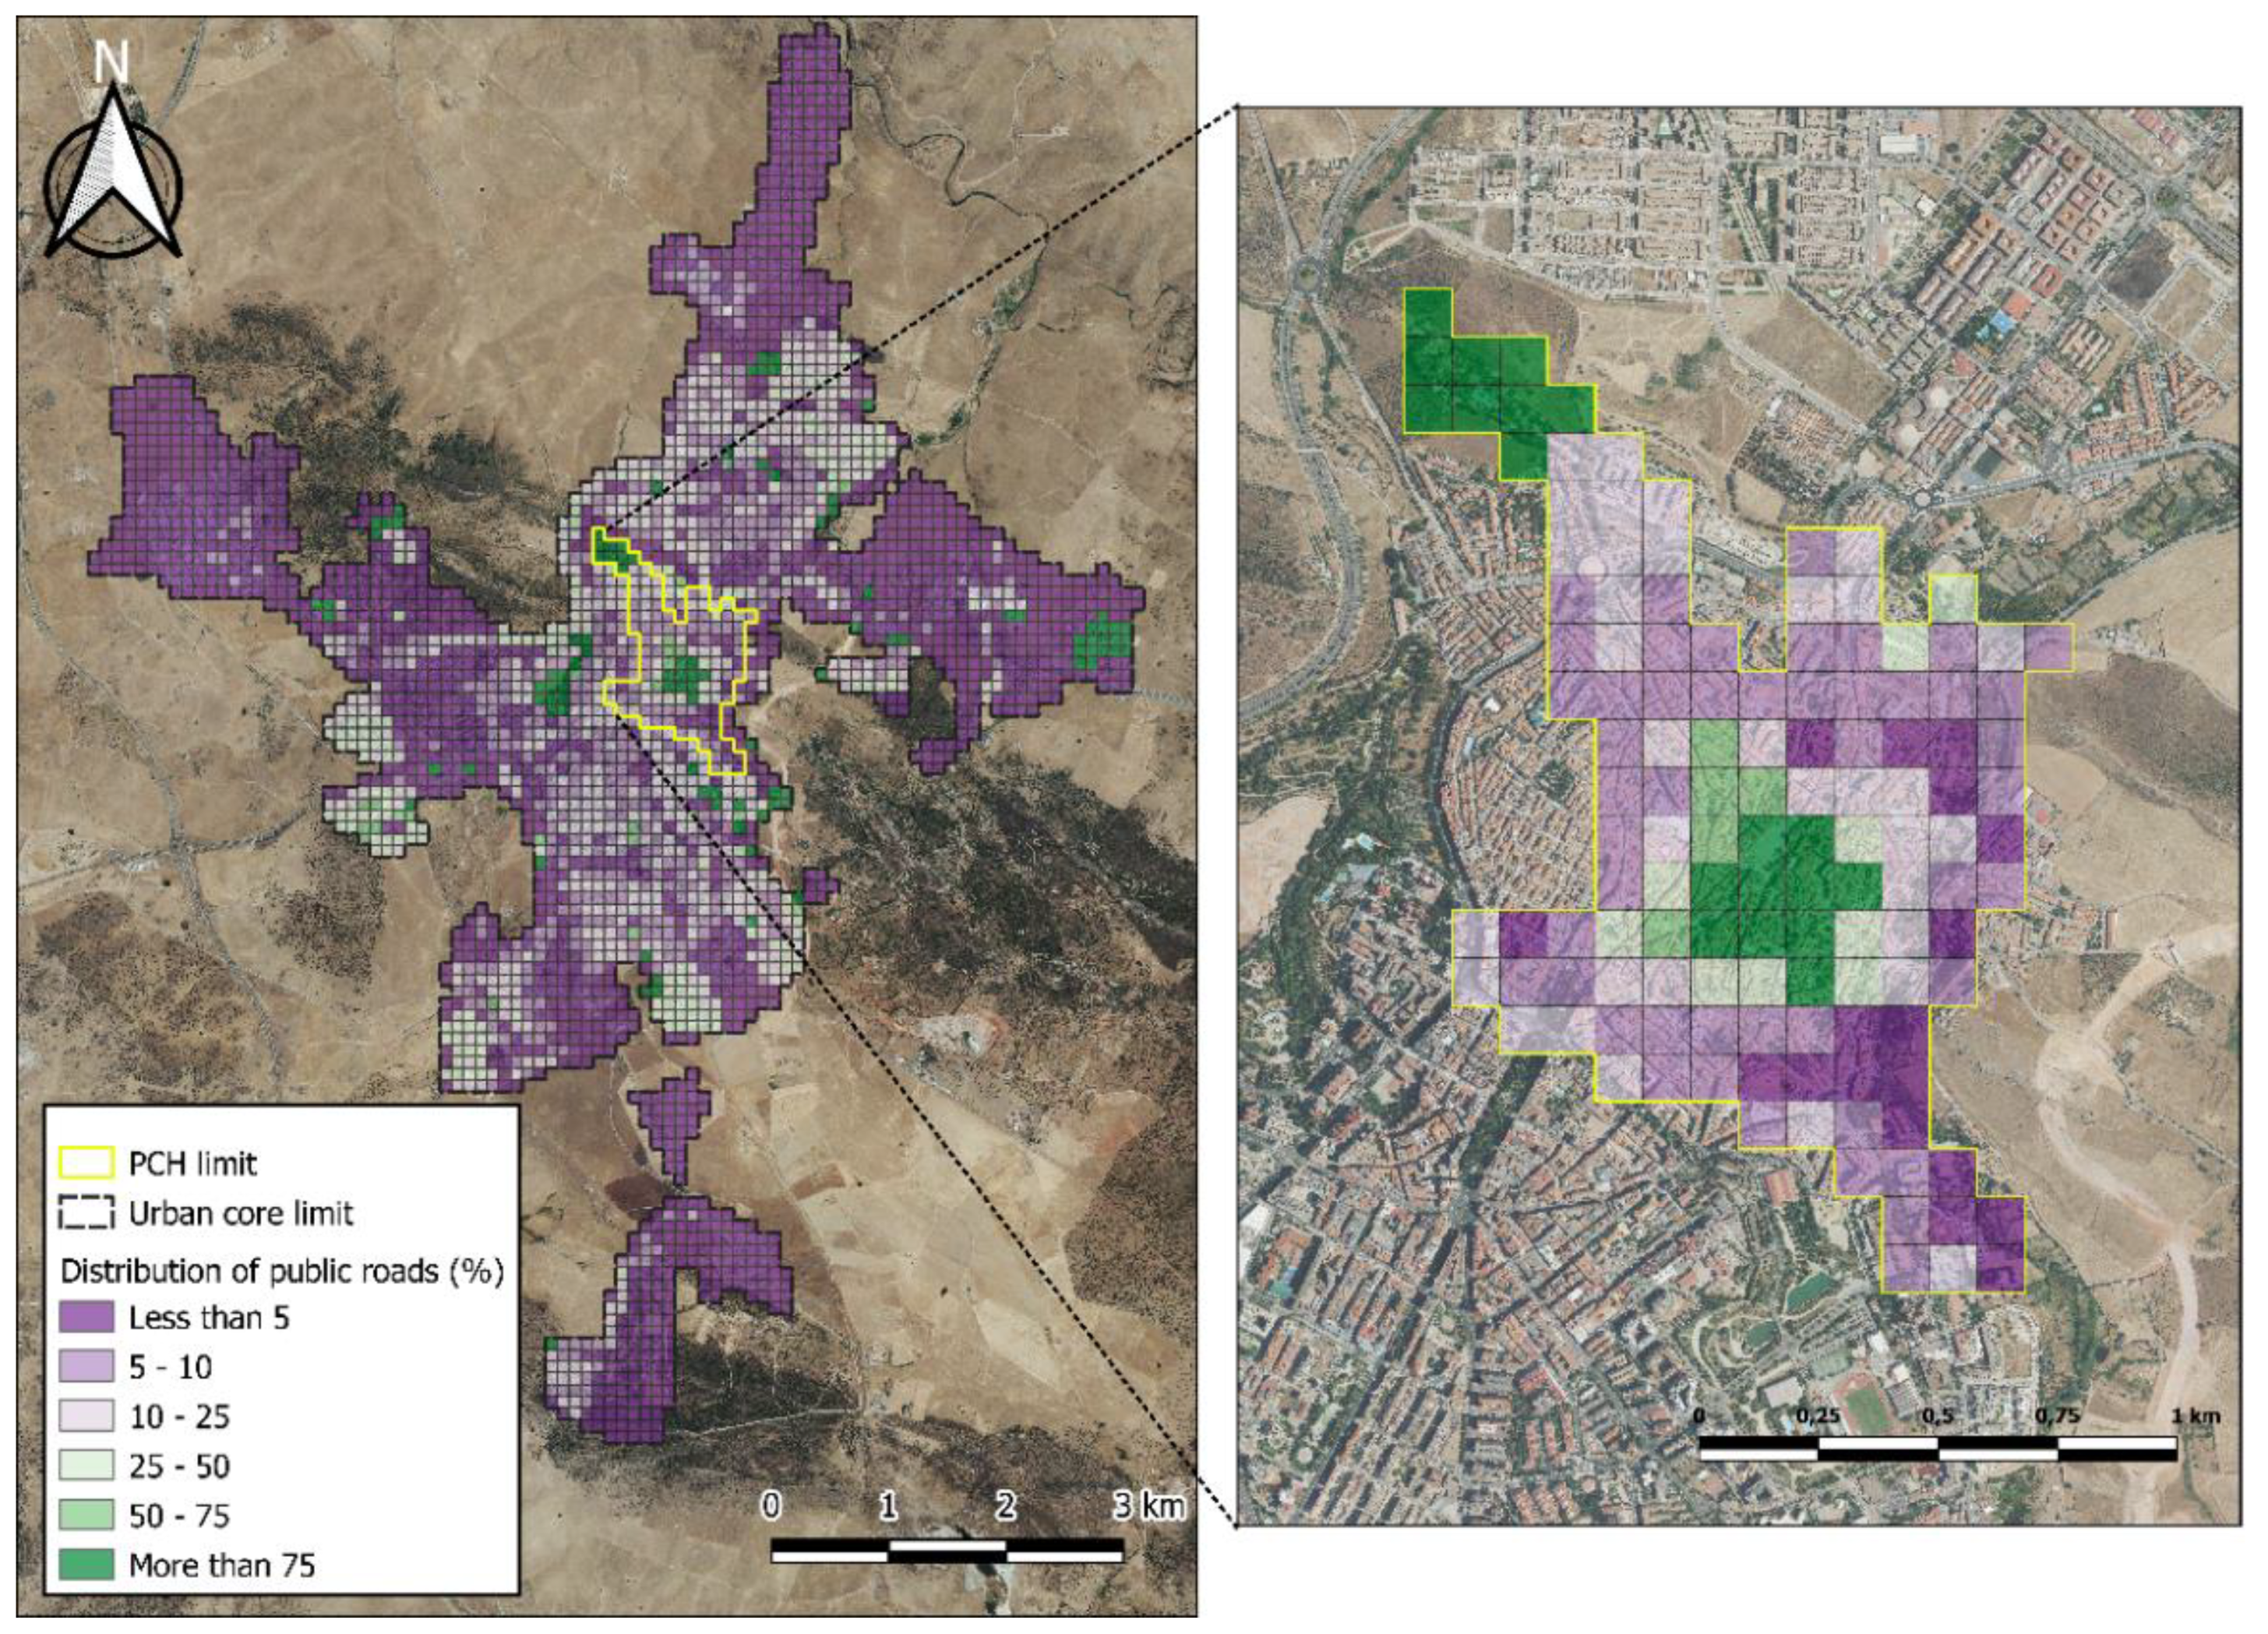
3.3.2. Public Road Distribution

Conceiving public space as the central backbone of a city makes it possible to adopt actions that gradually free the road from motorised vehicles and turn the street into a space for coexistence and leisure designed for pedestrians. Figure 12 shows a comparative map of the distribution of public roads, showing the areas of the city with the highest values of pedestrian public road surface area, with optimum figures of over 75% in relation to the total surface area.
Figure 12 shows clearly that the distribution of public roads in the city is mixed, with areas (mainly on the periphery) where the percentage of pedestrian roads in relation to vehicular roads does not reach 5% of the total, and another large part of the city centre (closer to the centre) where the values range between 25 and 50% of the total city road network. The only areas with restricted access for cars are concentrated around parks and green spaces.
Moreover, the PCH shows a high percentage of public roads for pedestrians, with values from 25 to 75% in the areas corresponding to the consolidated historic centre. The old town gives priority to pedestrian mobility but must also allow access to private vehicles owned by the residents of the dwellings inside the walled area. This area of the city is characterised by the fact that it has a single platform for almost its entire length. The lack of pavements means that there is a lower percentage of exclusively pedestrian roads, with coexistence roads having grown up in which pedestrians and vehicles coexist (but with a certain preference given to pedestrian mobility
In the case of the PCH, this indicator shows that 15% of its territory offers values higher than 75% of public roads for pedestrian mobility, with only 4% for the city. These results show that in the city of Cáceres there are no large areas where pedestrian mobility is prioritised and there is no room for vehicles.

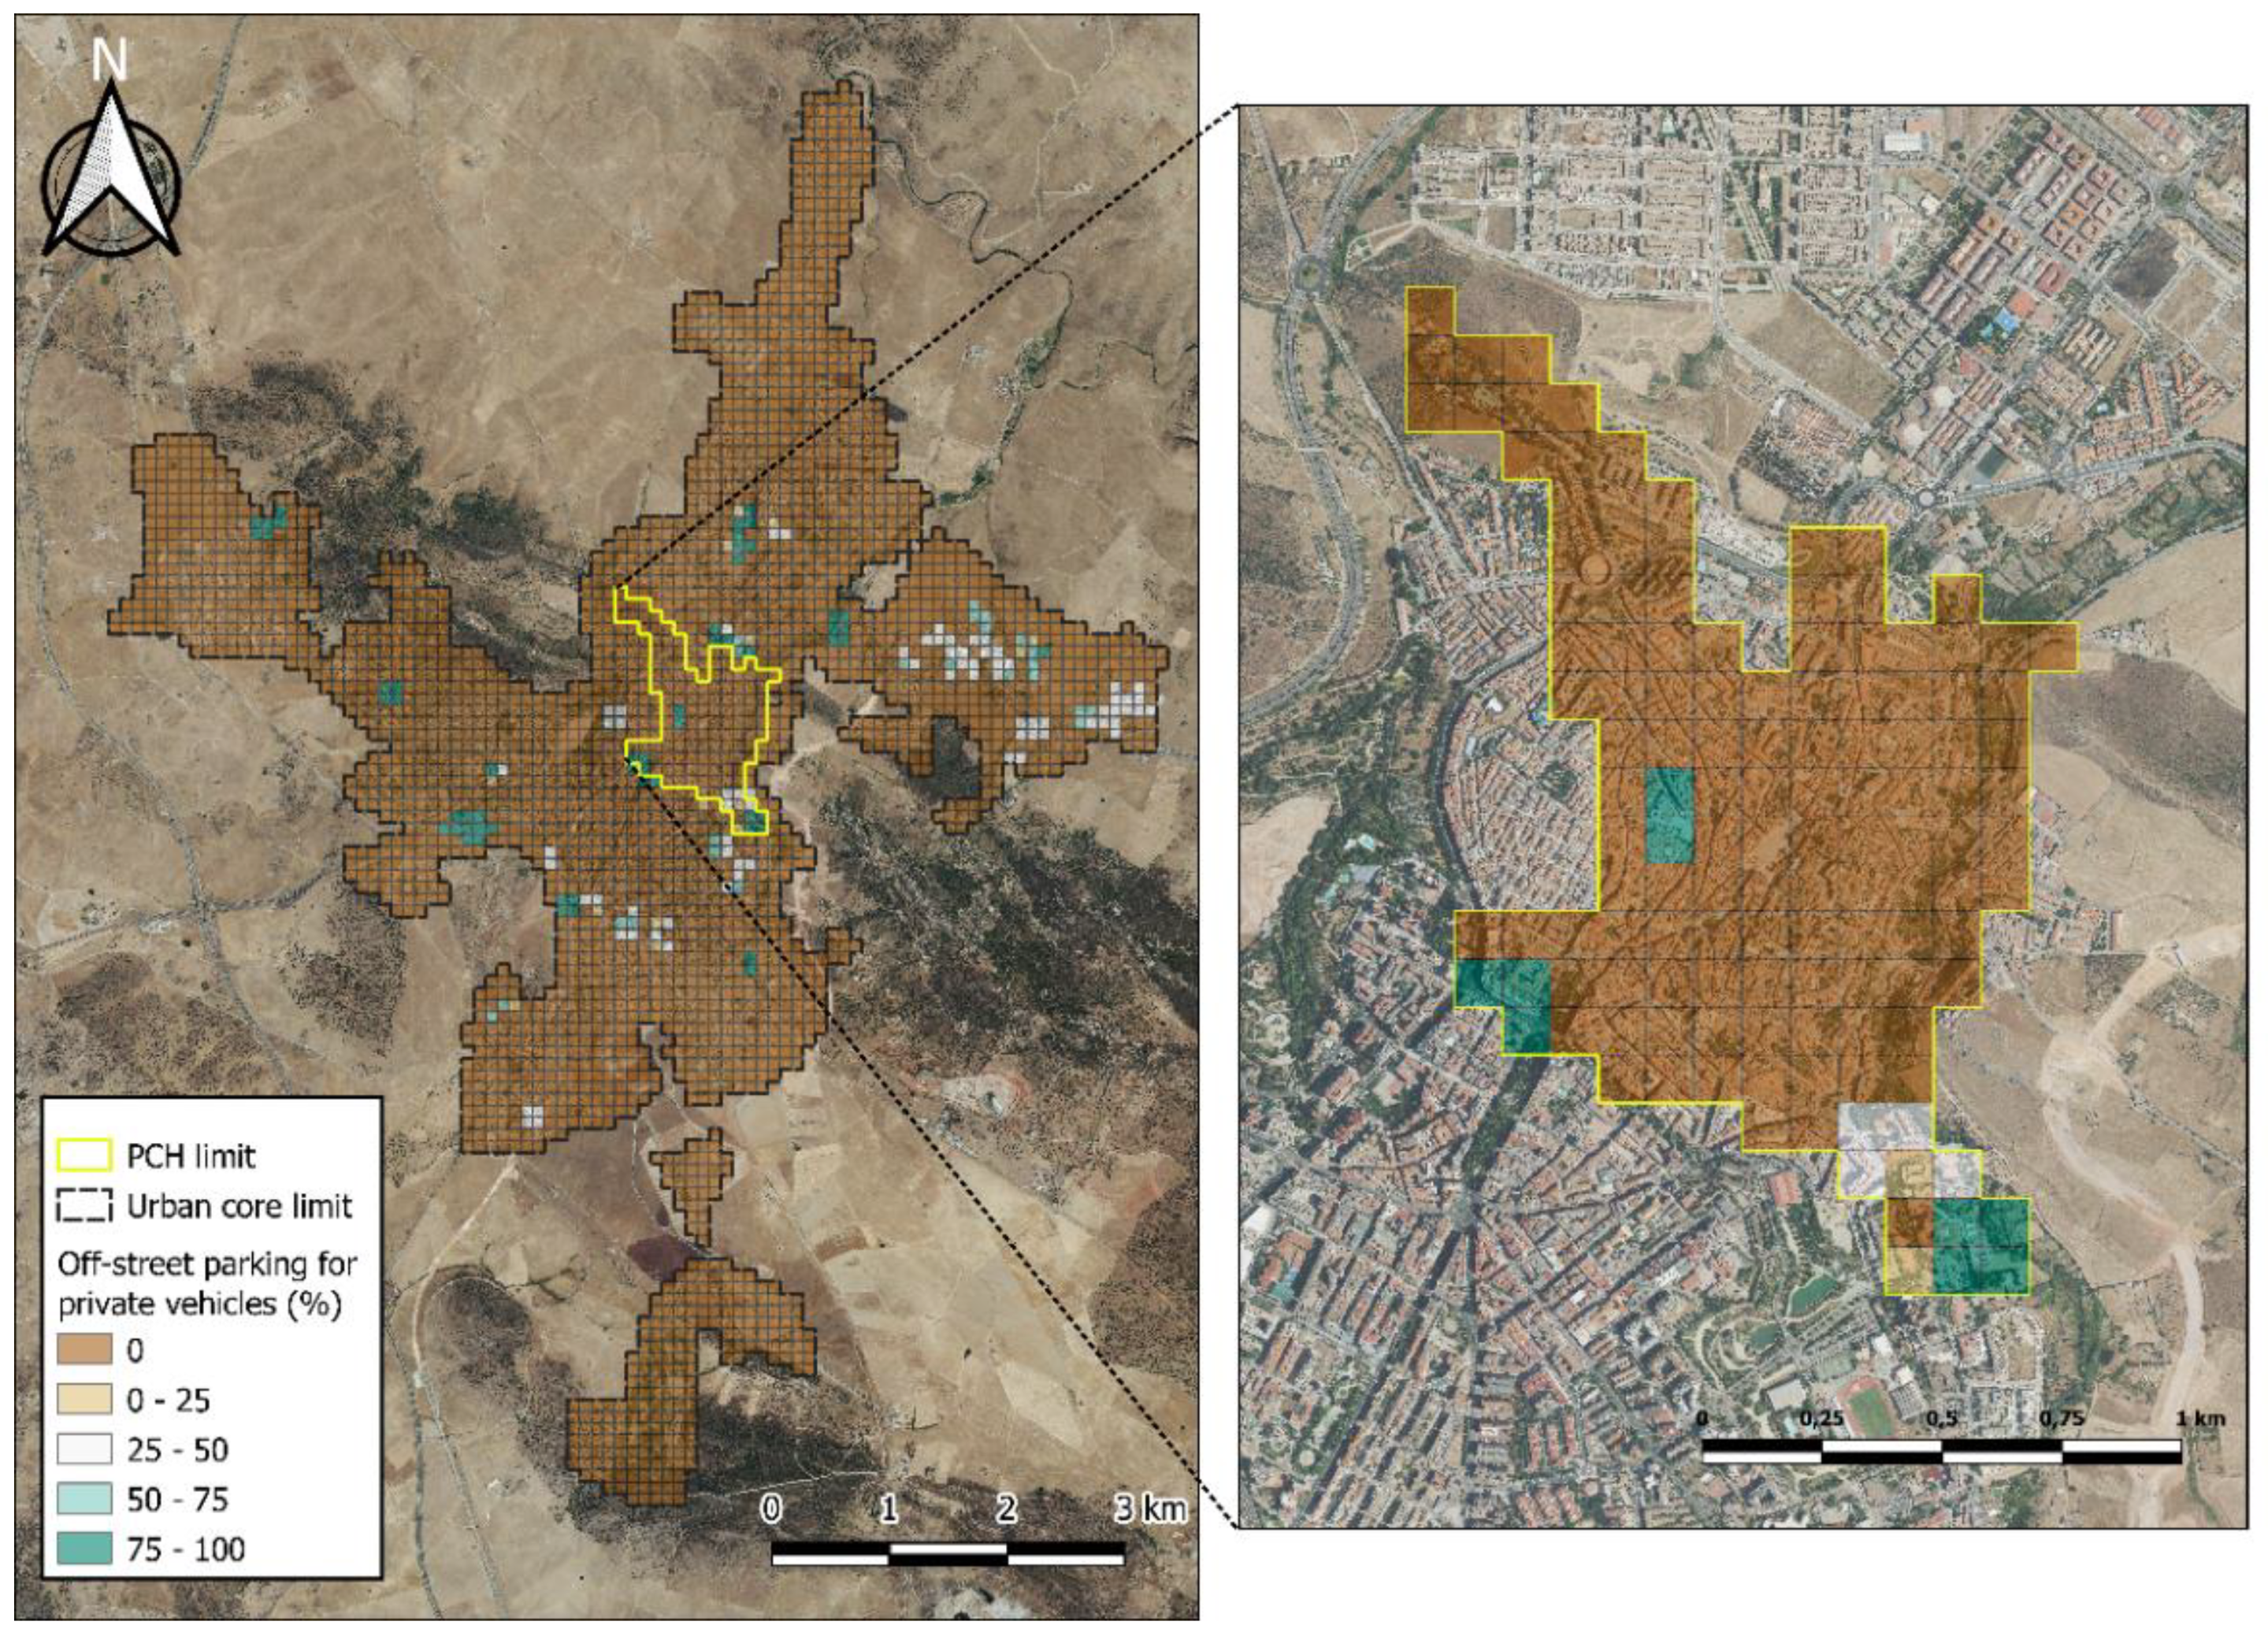
3.3.3. Off-Street Parking for Private Vehicles

The considerable occupation of public roads by private vehicles is a constant in most cities. As a result, the public space available to citizens is reduced and prevents them from fully carrying out their private leisure and recreational activities, such as staying, travelling and socialising. In this section, the distribution of on-street and off-street parking shows the relationship between the number of parking spaces located on and off the public road. Figure 13 shows the percentage of parking spaces located off the road.
As Figure 13 shows, the shortage of off-street parking spaces can be a significant challenge for sustainable urban mobility in the city. There are a limited number of areas suitable for both public and private vehicle parking within the urban core. In this sense, the grids with the highest percentage of off-street parking (over 75%) are located on sites where there is already some form of private covered or open-air parking or in existing public car parks. The material impossibility of counting the parking spaces associated with private individuals in their homes (private garages), means that a large part of the urban core shows a value of 0% of available off-street parking.
Additionally, in the area covered by the PCH, off-street parking areas exceeding 75% (of the ratio of off-street parking spaces/total parking spaces) are in both private car parks and public car parks.

3.4. Urban Complexity

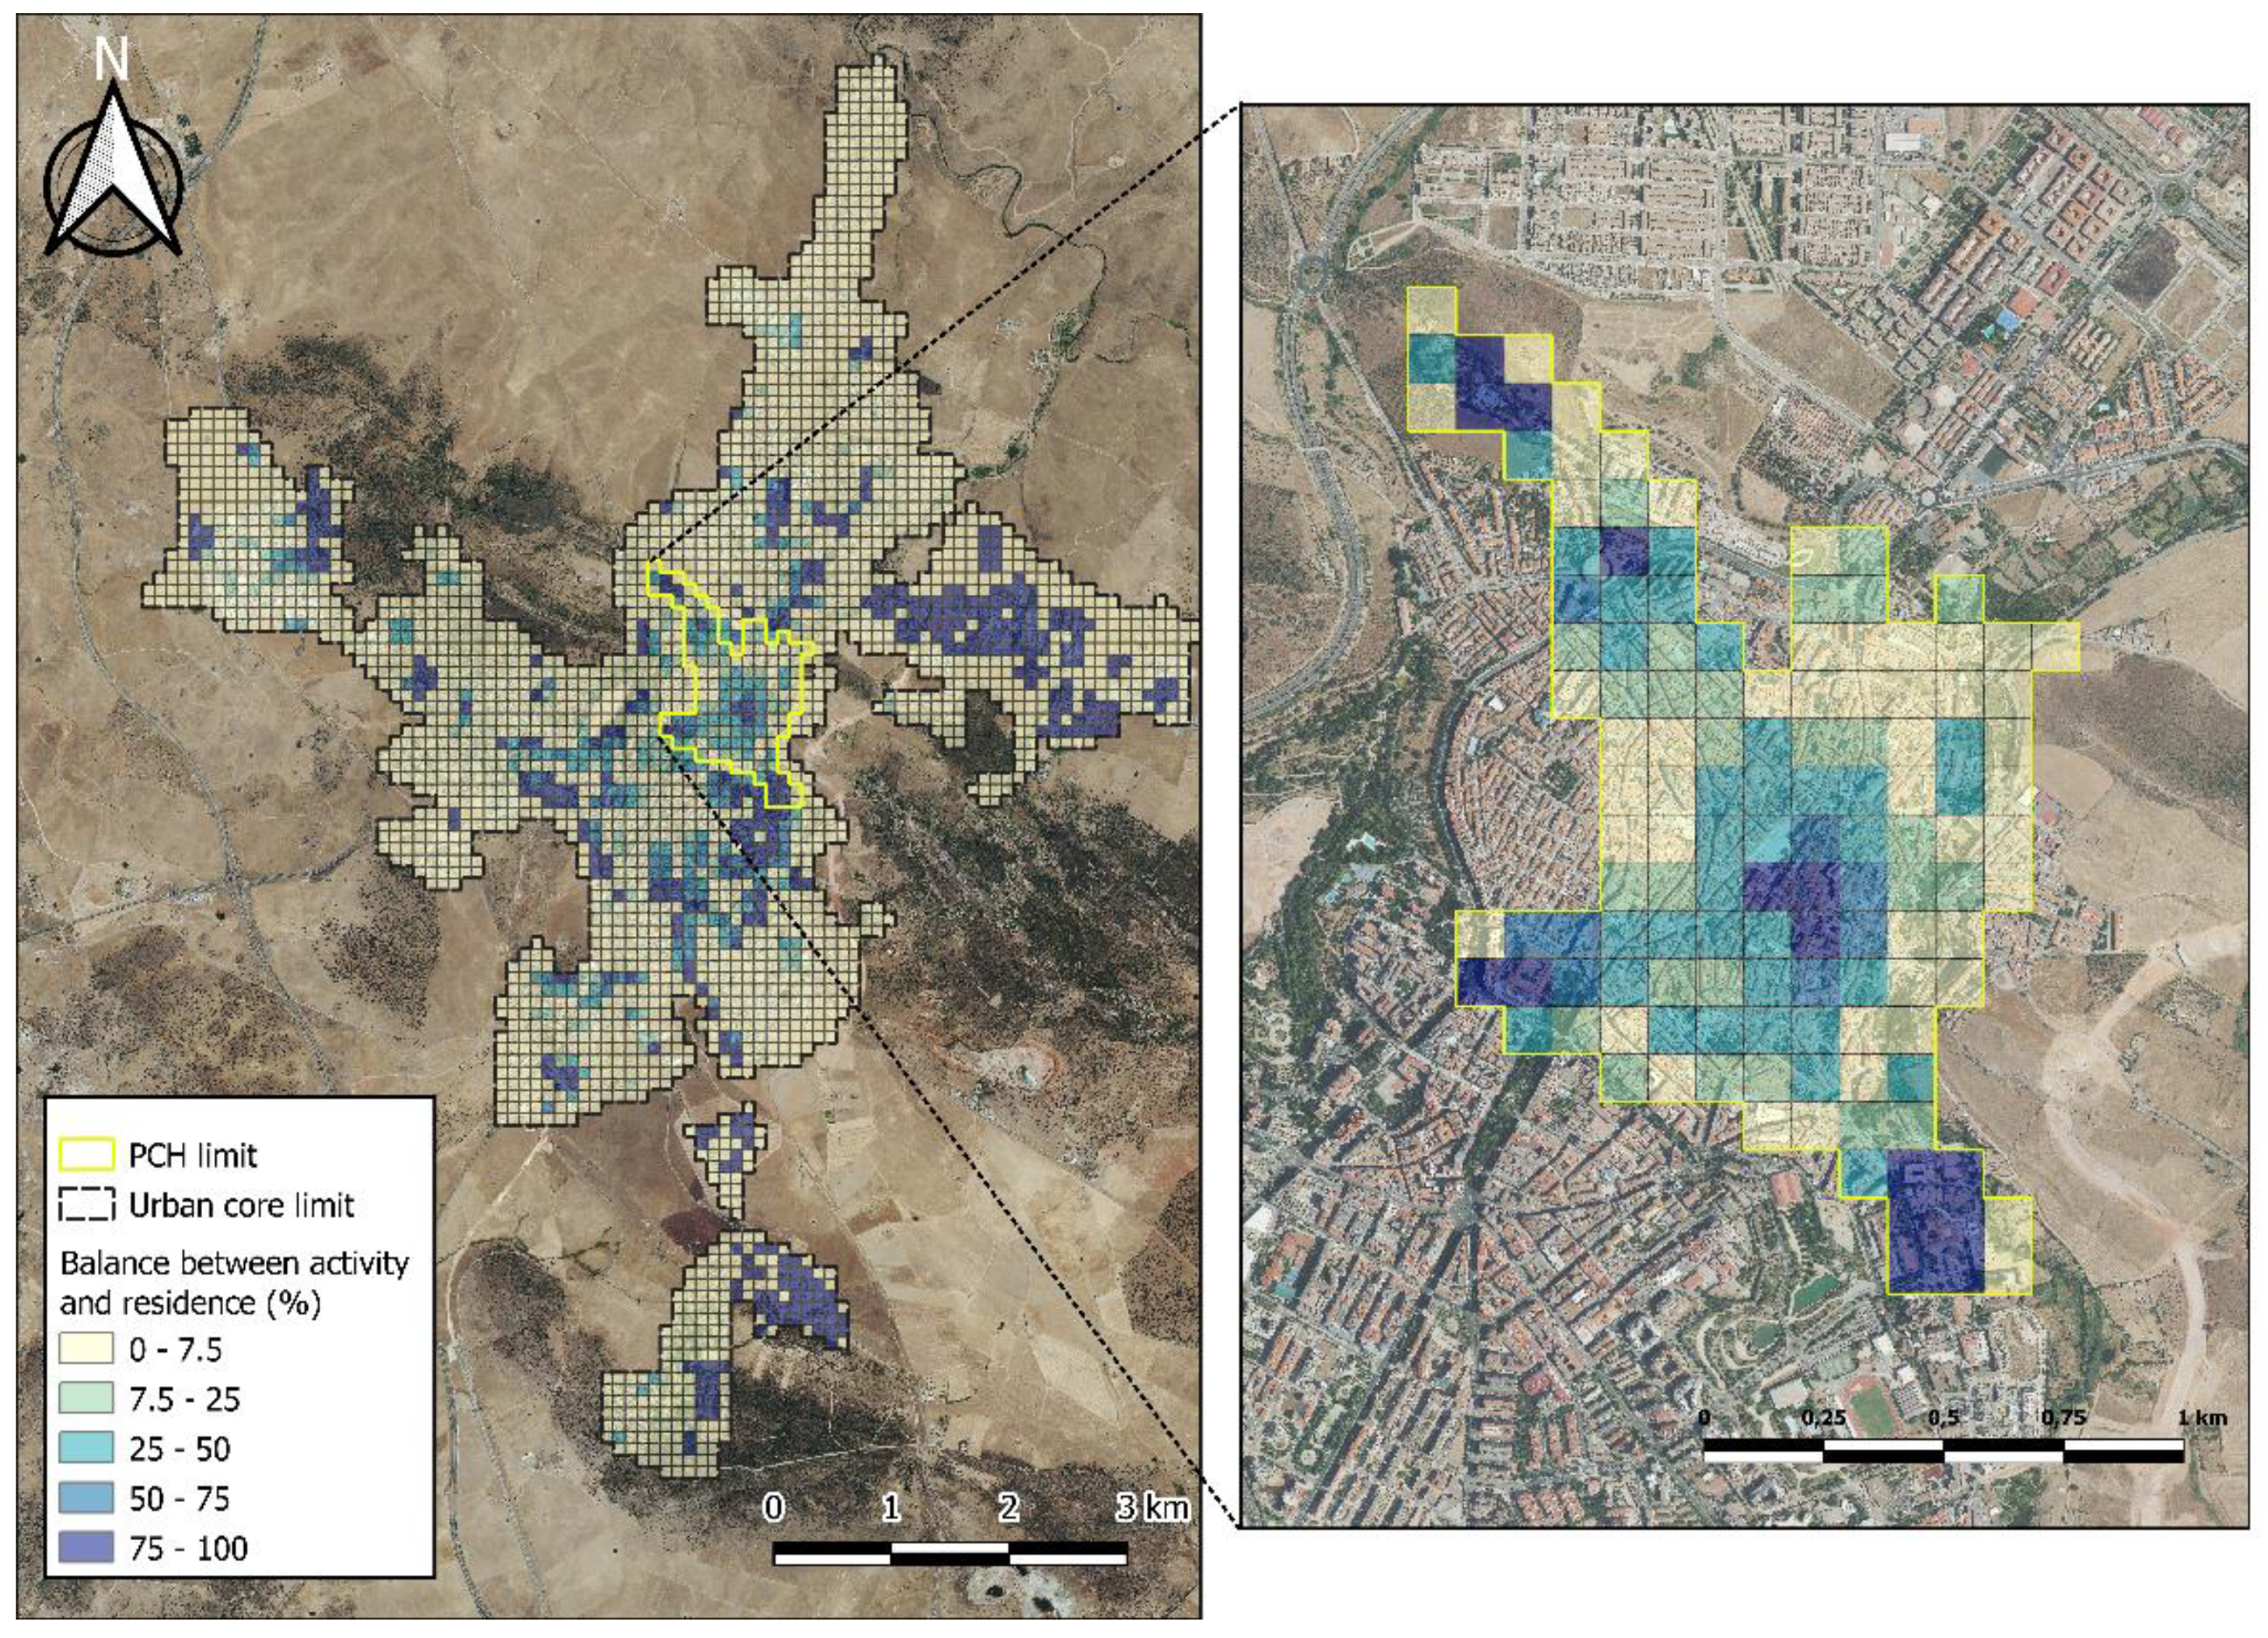
Balance between Activity and Residency

With the need to achieve a balance between residential and commercial public space, patterns of proximity between work and home are generated which, with the right measures, can improve self-containment in mobility and the satisfaction of daily needs by the resident population. Figure 14 shows the urban complexity of the city, where the mix of urban functions and uses in the same study area can be appreciated.
Figure 14 shows the existence of areas in the urban core that reveal a well-consolidated balance between activity and residence, even with areas showing values of over 75%. In the rest of the urban core there is a predominance of values below 7.5%, although higher percentages appear in some specific areas.
The area within the interior of the PCH is dominated by areas where the balance between residence and activity is above 25% (places where the coexistence between residence, office and shops is integrated to a greater extent, allowing these spaces to accommodate activities of different typologies), but not in the perimeter sites of this delimitation, where the values are below 7.5%.
This indicator shows how a large part of the territory of the city of Cáceres offers a low percentage of balance between activity and residence, with values just over 13% in the urban area and 11% in the PCH. It could be said that this indicator is the only one that has shown higher values in the total of the city of Cáceres compared to the PCH, which could possibly be attributed to the fact that a large part of the work activities is located outside the delimitation of the historic centre of the city.

4. Discussion

Spatial analysis through sustainability indicators has corroborated how the compact city is the urban model that provides greater efficiency and habitability due to its morphology, organisation and social cohesion. It is considered that sustainable urban planning must establish a model that pursues the transformation of the elements that make up a city connected to a rational design of new urban developments that guarantee the relationship of the city with all its components. This research, developed through the use of GIS tools, has made it possible to deepen the analysis of urban sustainability through indicators, in the same way as other authors have done on a different scale [23,66].
The materialisation of this study based on the use of sustainable development parameters can be crucial, as other authors have commented [67], for the urban planning of cities, and can sometimes be very useful for the identification of the main problems suffered by the urban environment. Therefore, the indicator methodology could be considered as a tool for monitoring urban sustainability. Its application in urban planning would provide very important information regarding certain areas of the city, although, as alluded to in [68], the model used could generate significant controversy among experts. A number of research studies [1,54] have echoed the need to identify aspects of cities that can be linked to urban sustainability data. In this way, it would be possible for them to have an impact on the decisions taken by the different administrations and lead to more environmentally sustainable actions.
Gómez-Varo, Declós-Alió and Miralles-Guasch in [24] designed a model for measuring sustainability through the use of urban indicators has been proposed as a key part of promoting sustainable development at the local level. In that sense, the concept of sustainability is already in the DNA of urban management, with indicator-based assessment being a highly valued means to that end.
In this way, areas have been located where a compact occupation model is configured in which land consumption is reduced and maximum efficiency in the use of natural resources has been achieved, thus reducing the pressure of the urban system on the environment [6]. The building typologies analysed are mainly collective dwellings that bring together a significant number of citizens in the same space, promoting personal interrelationships and the services of a city, for which a territorial fit with the immediate surroundings and the different spatial scales of urban interaction must be established [9].
Cities must be designed as a more liveable place where sustainable urban planning drives the transformation of public space and guarantees the quality of life and social cohesion of its inhabitants. The elements that make up the city must be configured in a more sustainable city model with a strong link to mobility flows, comfort variables and activities that manage to dynamize the life of the city [18,28]. As has been suggested by some authors [13,69], sustainability has to seek an urban balance between those spaces that are dedicated to functionality and urban organisation and those spaces oriented towards citizens, mainly those recreational areas in which to find tranquillity and contact with the environment.
When cities have the necessary tools for the effective implementation of sustainable urban planning policies, the assessment of the quality of life of the citizen should be very present to determine the environmental, social and urban characteristics of the study area. In Europe, studies have been carried out such as by Garau and Pavan in [70] where the case study of the city of Cagliari (Italy) cannot yet be described as an example of a sustainable municipality and good urban practices through the analysis of urban indicators, even though it has implemented various urban regeneration projects that have significantly improved certain aspects of the city. Meanwhile, in [71], the situation of Vitoria-Gasteiz (considered one of the most sustainable cities in Spain) is analysed through the application of different urban indicators in order to create a more desirable city model and provide a planning tool based on sustainable development to improve the well-being of its inhabitants. More generally [72], approaches urban sustainability in Portuguese cities with the intention of showing a balance between business and city management that addresses social and environmental concerns through the promotion of an environment associated with tangible and intangible resources. Akuraju et al. makes a comparison in [73] between cities in various European Union countries, taking into account the scale of the city and showing the advantages and disadvantages of different city sizes.
Medium-sized cities are ranked as the best urban category in relation to sustainability and play a central role in the territorial structure. These cities have the potential to establish creative dynamics, however, they have some disadvantages such as lower capacity for socio-cultural diversity, worse economic competitiveness or worse access to resources.
As stated by other authors [1], the mobility model for the city of Cáceres in this case should be based on guaranteeing accessibility to all the city’s fabrics and sets of mobility poles from any mode of transport, prioritising the use of more sustainable means of transport such as public transport, cycling or walking. Thus, infrastructures must be created that allow access to the main transport interchanges, community facilities, commercial areas and free spaces throughout the city, in order to guarantee a large part of these services to its population.
Cáceres is one of the World Heritage Cities (WHC), which have increased in number all over the world, and the main problem of its management revolves around the synergy of preserving the heritage and allowing the development of the current activity of its inhabitants; recent studies show that the problem in historic centres lies in their damage due to the impact of urban development [74]. Certainly most of the models based on urban indicators are applicable to heritage cities, but they are not oriented to their state of conservation [75], nevertheless, for a historic centre to remain “liveable” and habitable it should integrate the capacity to adapt to the new habitability needs of its population. Urban indicators play a fundamental role in the model of “participatory management” of historic centres, which have three main objectives in urban management: to compare different cities in order to identify the most efficient practices; to identify the strengths and weaknesses of a given urban environment in order to develop regeneration strategies; and finally, to monitor the effectiveness of these strategies.
With the purpose of a more sustainable city model, an urban system should be implemented that configures spaces with a certain degree of compactness, centrality and accessibility, being conditions for urban maturation through the evolution of strategic planning of urban environments. Carpio and Lamíquiz refer in [53], the reduction of interurban mobility through the creation of patterns of proximity between housing and work, leisure and service activities.

Research Limitations and Future Recommendations

This work has required the collaboration of different institutions and organisations that have provided the necessary data for the analyses carried out. Thus, the implementation of a sustainability analysis based on urban indicators would serve the competent administrations as a real planning tool that would allow the application of measures that promote the improvement of the quality of life of citizens, turning the city into a much more habitable space in which the maximum efficiency of the urban system is achieved. According to [76], indicators in our urban areas as an exact tool to help us interpret the need to incorporate them into our urban environments, quantitative and qualitative tool that allows us to assess the evolution and achievement of the proposed goals and objectives.
To conclude the discussion, this study could be considered by the authors as a starting point for different research on urban sustainability, with other systems of indicators included, for example, in the Spanish Urban Agenda (AUE) or criteria for Sustainable Planning defined in the Law 11/2018 on Sustainable Land and Urban Planning of Extremadura (LOTUS). At the same time, comparative studies between different medium-sized cities or World Heritage Cities with similar socio-economic and historical characteristics would also be considered.

5. Conclusions

The principal objective of this research consisted of analysing the urban sustainability of the city of Cáceres (declared a World Heritage Site by UNESCO in 1987) in the areas of: (a) land occupation, (b) public space and habitability, (c) mobility and services, and (d) urban complexity, with emphasis on the results obtained in the area delimited by the historic city (PCH). The results obtained in terms of sustainability (considering the indicators proposed) show an important contrast in the urban core of Cáceres. It is observed that, at a complete city level, the city centre shows more appropriate parameters in terms of housing concentration, compactness, proximity to basic services, as well as an acceptable percentage of pedestrian roads, in contrast to what is observed in the outer areas of the city, where these indicators show more dispersed values that generate a greater land occupation. A greater urban compactness has been detected around the main roads that converge towards the administrative centre, with higher values of housing density, absolute compactness and corrected compactness.
Focusing on the PCH, a large part of the delimited area offers very favourable results in terms of urban sustainability for the following indicators analysed: housing density, absolute compactness, corrected compactness, acoustic comfort, road distribution and proximity to basic services, except for some areas where the lack of housing and buildings has not favoured the obtaining of sufficiently conclusive results.
The use of GIS tools for the spatial representation of the analyses carried out with the different indicators of urban sustainability has allowed for a better identification of those areas of the city that need to be improved. The fundamental intention is to reduce the problems suffered by some sectors of the population and to achieve greater social cohesion and successful management of the city. The authors consider that the application of GIS techniques in combination with resources and sources of information offered by public administrations (based on the principles of transparency) and the methodology of calculation through urban indicators is a powerful tool for public decision-making, especially when the aim is to relate the concepts of sustainability and urban morphology with the firm premise of social equity. Therefore, it is argued that the main limitation in carrying out this type of research is the large volume of initial data necessary to consider the study viable, irrespective of other considerations.

Author Contributions

M.J.-E. conceived and designed the research. F.M.M.G. performed the calculations with SIG. M.J.-E., F.M.M.G. and R.G.-E. wrote and revised the paper. F.M.M.G. edited the Maps with ArcGIS. M.J.-E., F.M.M.G. and R.G.-E. made formal analysis. M.J.-E. and F.M.M.G. supervised the paper. All authors have read and agreed to the published version of the manuscript.

Funding

This publication has been made possible thanks to funding granted by the Consejería de Economía, Ciencia y Agenda Digital de la Junta de Extremadura, and by the European Regional Development Fund of the European Union through the contribution to the COMPHAS research group under reference GR21159.

Institutional Review Board Statement

Not applicable.

Informed Consent Statement

Not applicable.

Acknowledgments

We would like to formally express our gratitude to José Cáceres Merino for his altruistic initial collaboration and also the technical staff of the City Council of Cáceres, especially Luis Álvarez Llorente and Faustino Cordero Montero (responsible for the GIS service), for their kind attention.

Conflicts of Interest

The authors declare no conflict of interest.

References

  1. Lopez-Carreiro, I.; Monzon, A. Evaluating sustainability and innovation of mobility patterns in Spanish cities. Analysis by size and urban typology. Sustain. Cities Soc. 2018, 38, 684–696. [Google Scholar] [CrossRef]
  2. Jacobs, J. The Death and Life of Great American Cities; Random House: New York, NY, USA, 1961. [Google Scholar]
  3. Nel·lo, O. Efecto Barrio. Segregación Residencial, Desigualdad Social Y Políticas Urbanas en Las Grandes Ciudades Ibéricas; Blanch, T.L., Ed.; Editorial Tirant lo Blanch: Valencia, Spain, 2021. [Google Scholar]
  4. United Nations. Brundtland Report of the World Commission on Environment and Development: Our Common Future; The World Commission on Environment and Development: Oslo, Norway, 1987. [Google Scholar]
  5. Charter of European Cities & Towns towards Sustainability Consensus Declaration: European Cities & Towns towards Sustainability I.1: The Role of European Cities and Towns. In Proceedings of the European Conference on Sustainable Cities and Towns, Aalborg, Denmark, 24–27 May 1994.
  6. Del Espino Hidalgo, B. Assessing sustainability within territorial and urban heritage: An indicator-based evaluation in the case of medium-sized cities in inner Andalusia. J. Cult. Herit. Manag. Sustain. Dev. 2019, 9, 121–132. [Google Scholar] [CrossRef]
  7. Pizarro-Reyes, L.; Díaz-Lazcano, V.; Zumelzu, A.; Prieto, A.J. Resilience and sustainability assessment of cultural heritage and built environment: The Libertad pedestrian walkway in Valdivia, Chile. J. Cult. Herit. 2022, 53, 154–164. [Google Scholar] [CrossRef]
  8. Martins, A.N.; Forbes, C.; Pereira, A.A.; Matos, D. The changing city: Risk and built heritage. The case of Lisbon downtown. Procedia Eng. 2018, 212, 921–928. [Google Scholar] [CrossRef]
  9. García, F. Compacidad y densidad de las ciudades españolas. EURE 2016, 42, 5–27. [Google Scholar] [CrossRef]
  10. Valdenebro de la Cerda, A. La problemática del tráfico en los cascos históricos y sus posibles soluciones. In Libro Blanco sobre la Movilidad en los Conjuntos Históricos en las Ciudades Patrimonio de la Humanidad; Grupo Ciudades Patrimonio de la Humanidad de España: Ávila, Spain, 2021. [Google Scholar]
  11. López, G.A. Las ciudades medias industriales en España: Caracterización geográfica, clasificación y tipologías. Cuad. Geogr. 2020, 59, 99–125. [Google Scholar] [CrossRef]
  12. Gómez Giménez, J.M.; de Sá Marques, T.V.; Hernández Aja, A. Procesos urbanos funcionales en Iberia: Una aproximación a la integración del territorio urbano más allá de la metropolización. Cuad. Geográficos 2020, 59, 93–128. [Google Scholar] [CrossRef]
  13. Campbell, S. Green Cities, Growing Cities, Just Cities? Urban Planning and the Contradictions of Sustainable Development. In Readings in Planning Theory, 4th ed.; John Wiley & Sons: Hoboken, NJ, USA, 2016; pp. 214–240. [Google Scholar] [CrossRef]
  14. Selim, S.; Demir, N. Detection of ecological networks and connectivity with analyzing their effects on sustainable urban development. Int. J. Eng. Geosci. 2019, 4, 63–70. [Google Scholar] [CrossRef] [Green Version]
  15. Sari, S.; Türk, T. An Investigation of Urban Development With Geographic Information Systems: 100-Year Change of Sivas City, Turkey. Int. J. Eng. Geosci. 2021, 6, 51–63. [Google Scholar] [CrossRef]
  16. Doğan, Y.; Yakar, M. GIS and three-dimensional modeling for cultural heritages. Int. J. Eng. Geosci. 2018, 3, 50–55. [Google Scholar] [CrossRef] [Green Version]
  17. Ghabouli, E. Tourism and Urban Planning for Intermediate Cities: An Empirical Approach toward Cultural Heritage Conservation in Damavand, Iran. Int. Sch. Sci. Res. Innov. 2015, 9, 721–724. [Google Scholar]
  18. Mehanna, W.A.E.H.; Mehanna, W.A.E.H. Urban renewal for traditional commercial streets at the historical centers of cities. Alexandria Eng. J. 2019, 58, 1127–1143. [Google Scholar] [CrossRef]
  19. Simó López, M.; Casellas, A.; Avellaneda, P. Retail shops and pedestrian areas: Evolution and adaptation in the coastal city of Malgrat de Mar (Barcelona). An. Geogr. Univ. Complut. 2018, 38, 219–238. [Google Scholar] [CrossRef]
  20. Cascajo, R.; Lopez, E.; Herrero, F.; Monzon, A. User perception of transfers in multimodal urban trips: A qualitative study. Int. J. Sustain. Transp. 2019, 13, 393–406. [Google Scholar] [CrossRef]
  21. Tarriño-Ortiz, J.; Gómez, J.; Soria-Lara, J.A.; Vassallo, J.M. Analyzing the impact of Low Emission Zones on modal shift. Sustain. Cities Soc. 2022, 77, 103562. [Google Scholar] [CrossRef]
  22. Van Cauwenberg, J.; Van Holle, V.; Simons, D.; Deridder, R.; Clarys, P.; Goubert, L.; Nasar, J.; Salmon, J.; De Bourdeauhuij, I.; Deforche, B. Using walk-along interviews to explore the environmental factors related to older adults, walking for transportation. J. Sci. Med. Sport 2012, 15, S269. [Google Scholar]
  23. Hand, C.L.; Rudman, D.L.; Huot, S.; Gilliland, J.A.; Pack, R.L. Toward Understanding Person-Place Transactions in Neighborhoods: A Qualitative-Participatory Geospatial Approach. Gerontologist 2018, 58, 89–100. [Google Scholar] [CrossRef] [Green Version]
  24. Gómez-Varo, I.; Delclòs-Alió, X.; Miralles-Guasch, C. Jane Jacobs reloaded: A contemporary operationalization of urban vitality in a district in Barcelona. Cities 2022, 123, 103565. [Google Scholar] [CrossRef]
  25. Delclòs-Alió, X.; Miralles-Guasch, C. Looking at Barcelona through Jane Jacobs’s eyes: Mapping the basic conditions for urban vitality in a Mediterranean conurbation. Land Use Policy 2018, 75, 505–517. [Google Scholar] [CrossRef]
  26. Mix, R.; Hurtubia, R.; Raveau, S. Optimal location of bike-sharing stations: A built environment and accessibility approach. Transp. Res. Part A Policy Pract. 2022, 160, 126–142. [Google Scholar] [CrossRef]
  27. Politis, I.; Georgiadis, G.; Papadopoulos, E.; Fyrogenis, I.; Nikolaidou, A.; Kopsacheilis, A.; Sdoukopoulos, A.; Verani, E. COVID-19 lockdown measures and travel behavior: The case of Thessaloniki, Greece. Transp. Res. Interdiscip. Perspect. 2021, 10, 100345. [Google Scholar] [CrossRef]
  28. Serrano-López, R.; Linares-Unamunzaga, A.; Muñoz San Emeterio, C. Urban sustainable mobility and planning policies. A Spanish mid-sized city case. Cities 2019, 95, 102356. [Google Scholar] [CrossRef]
  29. La Evolución Urbana de las 15 Ciudades Españolas Patrimonio de la Humanidad. Available online: https://www.ciudadespatrimonio.org/mpublicaciones/urbanismo.php (accessed on 15 June 2022).
  30. González Leonardo, M. Declive demográfico y envejecimiento en las capitales de provincia. Cuad. Geográficos 2021, 60, 168–191. [Google Scholar] [CrossRef]
  31. Gobierno de España. Ministerio de Cultura y Deporte. Estudio Comparado de los Sistemas de Gestión del Patrimonio Mundial de las 15 Ciudades del Grupo para Afrontar los Retos de Futuro y Visibilizar la Operatividad de los Planes de Gestión; Gobierno de España: Madrid, Spain, 2021. [Google Scholar]
  32. Sánchez Franco, C. El desarrollo urbano de Cáceres a través de su planeamiento (1961–2018); Universidad de Extremadura: Badajoz, Spain, 2021. [Google Scholar]
  33. Ayuntamiento de Cáceres. Reglamento de los Distritos y de la Participación Ciudadana del Ayuntamiento de Cáceres; Ayuntamiento de Cáceres: Cáceres, Spain, 2010. [Google Scholar]
  34. Cáceres 3D. Available online: https://ide.caceres.es/caceresview3d/ (accessed on 4 October 2022).
  35. Ortiz García, J.; Rufo Rey, M.Á. Percepción de inseguridad en los barrios y eficacia colectiva: Un estudio de caso. Anu. Fac. Derecho. Univ. Extrem. 2020, 36, 757–795. [Google Scholar] [CrossRef]
  36. Amelia, G.D. Aldea Moret de poblado minero a suburbio cacereño; Aula de Cultura de la Caja de Ahorros y Monte de Piedad: Cáceres, Spain, 1978. [Google Scholar]
  37. Ruíz García, J. La Evolución Urbana de Cáceres; Grupo Ciudades Patrimonio de la Humanidad de España: Ávila, Spain, 2011. [Google Scholar]
  38. Fernández Campesino, J.A.; Salcedo Hernández, J.C. Campus universitarios en ciudades patrimoniales: Contrastes entre Cáceres y Toledo. Rev. De Hist. De Las Univ. 2014, 17, 101–137. [Google Scholar]
  39. Rengifo Gallego, J.I.; Campesino Fernández, A.-J.; Sánchez Martín, J.M.; Salcedo Hernández, J.C.; Martín Delgado, L.M. Los apartamentos turísticos de la ciudad de Cáceres: Rehabilitación y refuncionalización del centro histórico. Cuad. Geográficos 2020, 59, 238–263. [Google Scholar] [CrossRef]
  40. Gobierno de España. Sistema de Indicadores y Condicionantes para Ciudades Grandes y Medianas; Gobierno de España: Madrid, Spain, 2010. [Google Scholar]
  41. United Nations. Conference on Environment & Development. Río de Janeiro, Brazil, 3–14 June 1992. [Google Scholar]
  42. Monzon, A.; Vega, L.A.; Lopez-Lambas, M.E. Potential to attract drivers out of their cars in dense urban areas. Eur. Transp. Res. Rev. 2011, 3, 129–137. [Google Scholar] [CrossRef] [Green Version]
  43. Brüchert, T.; Hasselder, P.; Quentin, P.; Bolte, G. Walking for transport among older adults: A cross-sectional study on the role of the built environment in less densely populated areas in northern Germany. Int. J. Environ. Res. Public Health 2020, 17, 9479. [Google Scholar] [CrossRef]
  44. Rodríguez-Romo, G.; Garrido-Muñoz, M.; Lucía, A.; Mayorga, J.I.; Ruiz, J.R. Asociación entre las características del entorno de residencia y la actividad física. Gac. Sanit. 2013, 27, 487–493. [Google Scholar] [CrossRef] [Green Version]
  45. Jarass, J.; Heinrichs, D. New Urban Living and Mobility. In Transportation Research Procedia; Elsevier: Amsterdam, The Netherlands, 2014; Volume 1, pp. 142–153. [Google Scholar]
  46. Azcárate Luxána, M.V.; Cocero Matesanza, D.; Fernández Fernández, A.; García Lázaro, F.J.; Muguruza Cañasa, C.; Santos Preciadoa, J.M. El proceso de urbanización dispersa de las metrópolis españolas, en el contexto del desarrollo urbano europeo. Espac. Tiempo Forma. Ser. VI Nueva Epoca. Geogr. 2010, 3, 13–26. [Google Scholar] [CrossRef] [Green Version]
  47. Romero, F.; Gomez, J.; Rangel, T.; Vassallo, J.M. Impact of restrictions to tackle high pollution episodes in Madrid: Modal share change in commuting corridors. Transp. Res. Part D Transp. Environ. 2019, 77, 77–91. [Google Scholar] [CrossRef]
  48. García-Ayllón, S.; Kyriakidis, P. Spatial Analysis of Environmental Impacts Linked to Changes in Urban Mobility Patterns during COVID-19: Lessons Learned from the Cartagena Case Study. Land 2022, 11, 81. [Google Scholar] [CrossRef]
  49. Jiménez-Espada, M.; González-Escobar, R. Diagnosis of Urban Public Transport in the City of Cáceres. Procedia Eng. 2016, 161, 1379–1384. [Google Scholar] [CrossRef] [Green Version]
  50. Aletta, F.; Brinchi, S.; Carrese, S.; Gemma, A.; Guattari, C.; Mannini, L.; Patella, S.M. Analysing urban traffic volumes and mapping noise emissions in Rome (Italy) in the context of containment measures for the COVID-19 disease. Noise Mapp. 2020, 7, 114–122. [Google Scholar] [CrossRef]
  51. Jacobo, P.; Vargas, G. Accesibilidad Y Movilidad en El Casco Histórico de Toledo: La Movilidad de Los Estudiantes Universitarios Del Casco Antiguo Y SU Impacto en El Territorio; Universidad Complutense de Madrid: Madrid, Spain, 2011. [Google Scholar]
  52. Talavera García, R.; Valenzuela Montes, L.M.; Soria Lara, J.A. Evaluando la influencia de la calidad de la distancia peatonal en la cobertura de paradas del metro ligero de Granada (España). Boletín la Asoc. Geógrafos Españoles 2018, 79, 1–25. [Google Scholar] [CrossRef]
  53. Carpio Pinedo, J.; Lamíquiz Daudén, P.J. Proximidad del comercio e indicadores de accesibilidad: Aplicación a la planificación y regulación en el marco normativo actual. Ciudades 2015, 18, 217–237. [Google Scholar] [CrossRef] [Green Version]
  54. Jiménez-Espada, M.; Cuartero, A.; Le Breton, M. Sustainability Assessment through Urban Accessibility Indicators and GIS in a Middle-Sized World Heritage City: The Case of Cáceres, Spain. Buildings 2022, 12, 813. [Google Scholar] [CrossRef]
  55. Ton, D.; Zomer, L.B.; Schneider, F.; Hoogendoorn-Lanser, S.; Duives, D.; Cats, O.; Hoogendoorn, S. Latent classes of daily mobility patterns: The relationship with attitudes towards modes. Transportation 2020, 47, 1843–1866. [Google Scholar] [CrossRef] [Green Version]
  56. Crozet, Y. Cars and Space Consumption. Rethinking the Regulation of Urban Mobility Discussion Paper; International Transport Forum Discussion Papers; OECD Publishing: Paris, France, 2020. [Google Scholar]
  57. Zheng, N.; Geroliminis, N. On the distribution of urban road space for multimodal congested networks. Procedia-Social Behav. Sci. 2013, 80, 119–138. [Google Scholar] [CrossRef] [Green Version]
  58. Grahn, P.; Stigsdotter, U.A. Landscape planning and stress. Urban For. Urban Green. 2003, 2, 1–18. [Google Scholar] [CrossRef] [Green Version]
  59. Szell, M. Crowdsourced quantification and visualization of urban mobility space inequality. Urban Plan. 2018, 3, 1–20. [Google Scholar] [CrossRef] [Green Version]
  60. Small, K.A.; Verhoef, E.T. The Economics of Urban Transportation; Routledge Taylor & Francis Group: London, UK, 2007; ISBN 0203642309. [Google Scholar]
  61. Clark, B.; Chatterjee, K.; Melia, S. Changes to commute mode: The role of life events, spatial context and environmental attitude. Transp. Res. Part A Policy Pract. 2016, 89, 89–105. [Google Scholar] [CrossRef]
  62. Arranz-López, A.; Soria-Lara, J.A.; Badía-Lázaro, R. La accesibilidad a la actividad comercial minorista en áreas rurales y despobladas: Diagnóstico y desafíos para la planificación. Estud. Geográficos 2020, 81, e030. [Google Scholar] [CrossRef]
  63. Jiménez-Espada, M.; Vega Naranjo, J.M.; Martínez García, F.M. Identification of Mobility Patterns in Rural Areas of Low Demographic Density through Stated Preference Surveys. Appl. Sci. 2022, 12, 10034. [Google Scholar] [CrossRef]
  64. Ministerio para la Transición Ecológica y el Reto Demográfico. Índice de Calidad del Aire. Available online: https://www.miteco.gob.es/es/calidad-y-evaluacion-ambiental/temas/atmosfera-y-calidad-del-aire/calidad-del-aire/ (accessed on 4 October 2022).
  65. Ayuntamiento de Cáceres. Plan de Infraestruturas para la Movilidad Urbana Sostenible; Ayuntamiento de Cáceres: Cáceres, Spain, 2014. [Google Scholar]
  66. García-González, J.A. De la topología a la geometría: Implementación de mapas mentales a los Sistemas de Información Geográfica. Cuad. Geogr. 2022, 61, 88–107. [Google Scholar] [CrossRef]
  67. Rama, M.; Andrade, E.; Moreira, M.T.; Feijoo, G.; González-García, S. Defining a procedure to identify key sustainability indicators in Spanish urban systems: Development and application. Sustain. Cities Soc. 2021, 70, 102919. [Google Scholar] [CrossRef]
  68. Turcu, C. Re-thinking sustainability indicators: Local perspectives of urban sustainability. J. Environ. Plan. Manag. 2013, 56, 695–719. [Google Scholar] [CrossRef] [Green Version]
  69. Casellas, A.; Poli, C. Planificación urbana e innovación: De la tecnología y la práctica profesional a la innovación social y política. Doc. d’Anàlisi Geogràfica 2013, 59, 435. [Google Scholar] [CrossRef] [Green Version]
  70. Garau, C.; Pavan, V.M. Evaluating urban quality: Indicators and assessment tools for smart sustainable cities. Sustainability 2018, 10, 575. [Google Scholar] [CrossRef] [Green Version]
  71. Tudorie, C.M.; Gielen, E.; Vallés-Planells, M.; Galiana, F. Urban green indicators: A tool to estimate the sustainability of our cities. Int. J. Des. Nat. Ecodynamics 2019, 14, 19–29. [Google Scholar] [CrossRef]
  72. Franco, M.; Rodrigues, M. Indicators to measure the performance of sustainable urban entrepreneurship: An empirical case study applied to Portuguese cities and towns. Smart Sustain. Built Environ. 2022, 11, 19–38. [Google Scholar] [CrossRef]
  73. Akuraju, V.; Pradhan, P.; Haase, D.; Kropp, J.P.; Rybski, D. Relating SDG11 indicators and urban scaling—An exploratory study. Sustain. Cities Soc. 2020, 52, 101853. [Google Scholar] [CrossRef]
  74. Othman, R.N.R.; Hamzah, A.; Abdullah, J. A conceptual foundation and methodological framework for developing urban indicator of heritage city. Procedia-Social Behav. Sci. 2013, 85, 474–483. [Google Scholar] [CrossRef] [Green Version]
  75. Hugony, C.; Cladera, J.R. Indicadores para la evaluación de ciudades históricas. Archit. City Environ. 2008, 3, 8. [Google Scholar] [CrossRef]
  76. Sdoukopoulos, A.; Pitsiava-Latinopoulo, M. Assessing urban mobility sustainability through a system of indicators: The case of Greek cities. WIT Trans. Ecol. Environ. 2017, 226, 617–631. [Google Scholar]
Figure 1. (a) Study area location; (b) PCH panoramic image; (c) Historical centre of Cáceres, 3D image [34].
Land 11 01929 g001
Figure 2. Flow chart of the applied methodology.
Land 11 01929 g002
Figure 3. Dwelling density comparison.
Land 11 01929 g003
Figure 4. Absolute compactness comparison.
Land 11 01929 g004
Figure 5. Corrected compactness comparison.
Land 11 01929 g005
Figure 6. Variation in air quality in the city of Cáceres.
Land 11 01929 g006
Figure 7. (a) Air quality assessment for pollutant O3; (b) and PM10.
Land 11 01929 g007aLand 11 01929 g007b
Figure 8. Acoustic comfort comparison.
Land 11 01929 g008
Figure 9. Road accessibility comparison.
Land 11 01929 g009
Figure 10. Proximity of population to basic services comparison.
Land 11 01929 g010
Figure 11. Travel modes of the city of Cáceres (PIMUS).
Land 11 01929 g011
Figure 12. Public road distribution comparison.
Land 11 01929 g012
Figure 13. Off-street parking for private vehicles comparison.
Land 11 01929 g013
Figure 14. Balance between activity and residency comparison.
Land 11 01929 g014
Table 1. Study indicator system.
ScopeIndicatorDescriptionReferences
Land
occupation
Dwellings densityIt determines the potential population of a territory and the efficient development of urban functions.[42,43,44]
Absolute compactnessEnsures resource efficiency, less pressure on systems and greater social cohesion.[9,45,46]
Public space and habitabilityCorrected compactnessCalculate the balance between built-up and living space.
Air qualityCalculates exposure to nitrogen dioxide (NO2), tropospheric ozone (O3), particulate matter (PM10) and sulphur dioxide (SO2).[21,47,48]
Acoustic comfortDetects the areas where the population is exposed to the greatest noise impact, mainly due to transport.[49,50]
Road accessibilityThe width and gradient of the pedestrian walkway is measured considering people with reduced mobility.[51,52]
Proximity of population to basic servicesIt defines simultaneous access to basic facilities, commercial activities, sustainable mobility networks and green infrastructure.[53,54]
Mobility and
Services
Population movement modeCalculate the sustainability of the modal split of the population.[55]
Public road distributionCalculate the proportion of public space allocated to pedestrians.[56,57,58]
Off-street parking for private vehiclesCalculates the percentage of off-street parking spaces with access to the network.[59,60]
Urban
Complexity
Balance between activity and residencyIt defines the mix of urban functions and uses in the same residential space, generating patterns of proximity to everyday needs.[61,62]
Table 2. Indicators used in the scope of Land Occupation.
ScopeIndicatorCalculation Formula
Land
occupation
Housing densityDdwelling (dwellings/ha) = number of dwellings/ha
Absolute compactnessCabs (m) = Built-up volume/ha
Table 3. Air quality index Category [64].
SO2PM10O3NO2Index Category
0100020050040Good
1012002140511004190Reasonably good
201350415010113091120Regular
35150051100131240121230Unfavourable
501750101150241380231340Very unfavourable
751–1250151–1200381–800341–1000Extremely unfavourable
Table 4. Indicators used in the scope of public space and habitability.
ScopeIndicatorCalculation Formula
Public space and habitabilityCorrected compactnessmCcor (m) = Built-up volume/public living space
Air qualityCair (μg/m3) = Levels of NO2, O3, PM10 and SO2
Acoustic comfortCacoustic (dB) = Acoustic comfort levels
Road accessibilityAroad (m) = Street sections (linear meters) with sufficient, good or excellent accessibility
Proximity of population to basic servicesPservices (Nº of services) = Simultaneous coverage of basic facilities, local commercial services, mobility services and green space services.
Table 5. Indicators used in the scope of Mobility and services.
ScopeIndicatorCalculation Formula
Mobility andServicesPopulation movement modeRMprivate (%) = Journeys by type
Public road distributionVpedestrians (%) = Pedestrian road surface area/Public road surface area
Off-street parking for private vehiclesAPVehicles (%) = Off-street parking spaces/total number of spaces
Table 6. Indicator used in the Urban Complexity scope.
ScopeIndicatorCalculation Formula
Urban
Complexity
Balance between activity and residencyEqact (%) = Superficie construida (m2c) de uso terciario/Superficie construida total
Publisher’s Note: MDPI stays neutral with regard to jurisdictional claims in published maps and institutional affiliations.

