1. Introduction
Urban construction land (UCL) is the material carrier of regional spatial complex functions, and its economic efficiency changes directly influence the high-quality and sustainable development of urban systems [
1,
2]. Under the new circumstances of China’s “dual goals” strategy (the carbon peaking and carbon neutrality goals) and the promotion of high-quality economic development, the issue of carbon emission effect from UCL use is gradually receiving widespread attention. The rapid expansion of urbanization is accompanied by excessive consumption of fossil energy, which enhances the scale of urban economy and development speed; however, it exacerbates greenhouse gas emissions and reduces the carbon sequestration capacity of land, which has a negative effect on the comprehensive benefits and long-term economic interests generated by urban land use. At present, regional economic development is limited by the compulsory constraints of the resources and environment, depending on the “high cost, low efficiency” rough development mode that cannot meet the realistic needs of China’s regional economic high-quality development. In particular, in the context of less than 10 years to reach the carbon peak, how to resist the double pressure of carbon reduction and economic efficiency growth for UCL development is a crucial scientific matter that urgently needs to be solved.
As an essential political and economic core area in China, the Beijing–Tianjin–Hebei (BTH) region is characterized by the dense population distribution and the reliance on heavy industrial economy, and a number of cities (Beijing, Tianjin, Shijiazhuang, Qinhuangdao and Baoding) are currently listed as national low-carbon pilot cities. Along with the accelerated development of urbanization and the growing scale of urban population in recent years, the demand of UCL has been increasing gradually. The urban population in the BTH region increased by 21.65 million from 2002 to 2019, and the urbanization rate increased by nearly 20 percentage points; the scale of UCL expanded by 1.7 times to 4370 km2, while its carbon emissions increased 2.5 times from 183 to 464 million tons. The constraints of the ecological environment and land elements on urbanization and industrialization are becoming increasingly severe. Therefore, based on the example of BTH urban agglomeration, exploring the spatial and temporal dynamics of EEUCL under the effect of carbon emission and the driving factors can provide a practical reference for promoting regional synergistic development, enhancing eco-economic sustainability and boosting resource-intensive and economical utilization.
In the past few decades, scholars worldwide have designed and applied numerous tools to assess the economic efficiency of land use. Existing mainstream evaluation methods on land use efficiency can be divided into two categories: (1) Parametric method. Stochastic frontier analysis (SFA) is a representative parametric method [
3], for example, Yuan et al. [
4] constructed the SFA model to analyze whether the efficiency of the rural land transfer market in 30 provinces presented an involution effect from 2005 to 2020 in China. The advantage of the SFA model is involving the effect of stochastic factors on output, but it requires a demanding production function form setting for the basic structure of the model, which is highly demanding on data, and the obtained efficiency values may not correspond to the actual situation [
5,
6]. (2) Data envelopment analysis (DEA). Compared with the SFA model, the non-parametric form of the DEA model is more objective, as it does not require setting the form of the production function and estimating the model parameters [
7]. Traditional DEA models can be divided into two categories, one is the CCR model based on constant returns to scale, and the other is the BCC model based on variable returns to scale [
8]. However, both types of models do not consider the problem of slack variables for inefficiency measurement and have an efficiency value of up to 1 when there are multiple evaluated decision units that are effective, thus making it impossible to further distinguish the efficiency of effective decision units [
9]. In 2002, Tone proposed the super-efficiency SBM-DEA model, which solved the problem of slack variables in the traditional DEA model, as well as achieved the comparable effective decision units [
10]. Therefore, based on the multiple advantages of the above super-efficiency SBM-DEA model, this paper evaluates the EEUCL with the method.
However, the super-efficiency SBM-DEA model cannot dynamically analyze the data, while the Malmquist index is a method to process time series data, and the two are usually combined to compensate for the limitations of the model [
11]. Since the EEUCL is affected by a variety of factors, it is impossible to make effective suggestions for improvement when evaluation is conducted alone. Therefore, this paper integrates the super-efficient SBM-DEA model, the Malmquist index model and the Tobit model to evaluate 14 administrative regions of the BTH urban agglomeration and to systematically analyze the influencing factors.
For the reasons above, this paper focuses on the following aspects: (1) calculate carbon emissions based on urban energy consumption and take it as a non-desired output to construct an index evaluation system for the EEUCL; (2) dynamically assess the EEUCL in 14 administrative regions of BTH urban agglomeration from 2002 to 2019 through the super-efficiency SBM–Malmquist model; (3) identify the main influencing factors of UCL in the BTH region with the Tobit model and dissect the causes of its economic efficiency development changes.
2. Literature Review
The EEUCL represents the strength of the synergistic coupling between the economic system and the construction land system, which can be understood as the adequacy of land resource allocation under certain economic output constraints [
12]. It is also an important indicator of the level of intensive and economical land use [
13], the degree of ecological civilization, the health of the urbanization process [
14], and the efficiency of the quality of the low-carbon economic development [
15]. The current research on the EEUCL or related areas can be traced back to the 1920s in theoretical and empirical studies on urban land use efficiency, focusing on urban territorial structure [
16] and exploring and summarizing the spatial distribution patterns of urban land use types [
17,
18], which laid the theoretical foundation for urban land use research [
19]. The focus of empirical research has shifted from the early induction of urban spatial succession patterns to the excavation of determination processes and dynamic mechanisms of urban development changes. In recent years, relevant studies have mainly concentrated on the evaluation and optimization of urban land use efficiency, the characteristics of land use efficiency changes, and the influencing factors. For example, Liu et al. [
20] explored the spatial and temporal characteristics of urban land use efficiency changes in the Yangtze River Economic Zone in conjunction with an economic transformation perspective. Yao et al. [
21] explored the spatial and temporal evolution characteristics of urban land use efficiency in Sichuan Province based on data from 32 cities from 2002–2018, and used the SDM model to verify the optimization of urban land use efficiency. Masini et al. [
22] conducted a multidimensional analysis of land use efficiency in 417 metropolitan areas in 27 European countries, using floor area per capita as a benchmark. Zhu et al. [
23] combined a DEA model with a PLS-SEM model to assess the land use efficiency of 35 typical cities in China from 2007 to 2015 and to estimate the impact of their key driver factors.
In view of previous studies, Chinese scholars have conducted many in-depth studies on UCL. The research content is explored around the basic theory of UCL use efficiency [
24], evaluation system [
25], model construction method and application [
26], influencing factors, and optimization enhancement path [
27]. The study scale was extended from counties [
28] and prefecture-level cities [
29] to urban agglomerations [
30] and national provinces and regions [
31]. In terms of research methods, the traditional DEA model [
32] and SFA model [
33] are usually used to evaluate the efficiency of UCL use, and the GLS model [
12] and Tobit model [
34] are mostly used to analyze the influencing factors and development mechanisms of UCL efficiency, and a large number of studies have also used the Malmquist index method [
35] to dissect the dynamic efficiency of UCL use. Overall, in recent years, the relevant studies around the world have measured UCL use efficiency, analyzed its development mechanism, summarized its evolution pattern and explored various impact factors, and scholars have substantially enriched the research on UCL from the content, methodology, and dimension.
In recent years, with carbon emission research gradually being widely concerned in the world, the methods of carbon emission accounting directly influence the reliability of carbon emission data. These have included carbon emission-factor approach, mass-balance approach and experimental approach. The experiment method requires the collection of primary data through on-site measurements and is only applicable to small-scale, simple production and emission chain carbon sources [
36]. The mass-balance method involves a number of intermediate processes that need to be taken into account and is prone to systematic errors [
37]. Meanwhile, both of the above methods are difficult to use to obtain the data. The carbon emission-factor method is the first carbon emission estimation method proposed by the IPCC, which is currently extensively applied in empirical research [
38], and China has also completed the “Guidelines for the Preparation of Provincial Greenhouse Gas Inventories” accordingly. In this paper, based on this method, the product of urban production and domestic energy consumption data and emission factors is taken as the estimated value of carbon emissions from UCL. Compared with the other two methods, the carbon emission-factor method is more suitable for carbon emission calculation at the provincial or urban level, and its results are more authoritative.
In summary, few studies focus on the characteristics of changes in the EEUCL through taking carbon emissions as an output constraint. As the world’s largest emitter of carbon emissions, China is bound to affect the economic development of its cities and towns under the dual goals. Therefore, it is essential to analyze the current situation of EEUCL under the carbon emission constraint and the influencing factors to explore the low carbon economic development model of “low consumption and stable growth” in the future. In this paper, the EEUCL in the BTH region is measured using the super-efficiency SBM-DEA model with carbon emissions as the non-desired output. The methodology features and article structure are: Firstly, compared with traditional radial models such as CCR-DEA, non-radial, non-angle SBM-DEA models can solve the input factor redundancy problem, while overcoming the one-sidedness of evaluating only from the input or output perspective. Secondly, this study combines the super-efficiency SBM-DEA model with the Malmquist index to achieve a dynamic evaluation of the EEUCL in the BTH region. Finally, this paper uses the Tobit model to analyze the determinants of EEUCL and dissect the causes of changes in the development of EEUCL in the BTH region.
3. Research Methods
3.1. Calculation of Carbon Emissions for UCL
As the land for urban construction, which carries the development of the secondary and tertiary industries, its carbon emissions mainly originate from urban production and urban residents’ living and therefore can be indirectly estimated through carbon emissions generated by energy consumption. The selected energy types and individual coefficients refer to the “IPCC Guidelines for National Greenhouse Gas Inventories” and previous studies [
29]. The carbon emission factors for each energy type are shown in
Table 1, and the calculation formula is as follows in (1).
where
is the total carbon emission of UCL;
is the energy type;
is the energy consumption;
is the energy conversion standard coal coefficient;
is the energy carbon emission coefficient.
Due to the inaccessibility of energy consumption data at the prefecture-level municipal scale in Hebei Province (the data are available from Beijing and Tianjin, which are municipalities directly under the central government), the energy consumption data of each prefecture-level city was measured by processing the GDP data of Hebei Province and its prefecture-level cities according to the method of existing research [
2,
29]. Firstly, the GDP and total energy consumption of Hebei Province (million tons of standard coal) are used to calculate the province’s energy consumption coefficient per unit of GDP (million tons of standard coal/yuan). After that, the total energy consumption of each city is indirectly measured based on the GDP and energy consumption coefficient of each city in Hebei.
3.2. Super-Efficiency SBM-DEA Model
This paper evaluates the EEUCL in the BTH region using a super-efficiency SBM-DEA model that considers non-desired outputs. The model combines the advantages of the super-efficiency DEA model and the traditional SBM model. Meanwhile, compared with the radial DEA model, the non-radial, non-angle SBM-DEA model solves the input factor redundancy problem, while overcoming the one-sidedness of evaluating only from the input or output perspective. The formula is as follows in (2).
In Formula (2), is the objective function that is the economic efficiency value of UCL, where there are input variables and s output variables ( desired output and non-desired output). , and are input, desired output, and non-desired output indicators, respectively; , and are input variables, desired output and non-desired output slack variables, respectively; is the weight vector.
When
,
=
=
= 0, the super-efficiency SBM-DEA model proposed by Tone [
10] is introduced to distinguish the effective decision units, as shown in Formula (3).
In Formula (3), is the efficiency value of the super-efficiency SBM-DEA, and the rest of the parameters have the same meaning as in Formula (2). When < 1, it indicates that the decision unit is inefficient and needs to be made more efficient by improving the input or output variables. When > 1, it means that the decision unit can achieve a relatively efficient state with constant output and increasing input or constant input and shrinking output.
3.3. Malmquist Index
The Malmquist index method proposed based on the DEA model can effectively process multiple input and multiple output data sets and is suitable for analyzing dynamic efficiency change trends. It can decompose the index change of total factor productivity (TFP) into the index change of technical efficiency (TE) and technical progress (TP), where technical efficiency can be further decomposed into pure technical efficiency (PTE) and scale efficiency (SE) under the condition of variable returns to scale, and the causes of each index change can be analyzed in conjunction with the selected index.
The TFP index between period t + 1 and the base period t is decomposed according to the basis of Fare et al.’s [
39] Malmquist Total Factor Productivity Index algorithm, which is decomposed as follows in (4).
In Formula (4),
represents the output-based distance function, and m and n represent the input and output variables, respectively. To avoid the heterogeneity brought by different base periods, the geometric mean of multiple periods is used to measure total factor productivity, and further variations are obtained in Formula (5).
In Formula (5), is the index of change in technical efficiency, is the technological progress index.
Under the premise of variable returns to scale, the technical efficiency change index can be further decomposed into a pure technical efficiency index and a scaling efficiency index, as follows in Formula (6).
In Formula (6), is the pure technical efficiency index, is the scale efficiency index.
In summary: . When the value is greater than 1, it indicates an increase in the EEUCL, and vice versa; when the value is greater than 1, it indicates an effective technical contribution, and vice versa, a technical failure. When both are greater than 1, it means that the technology level is improving, and the evaluated object is close to the optimal production and operation scale, respectively, while the opposite means that the technology level is decreasing and the production and operation scale is deteriorating, respectively.
3.4. Tobit Model
The impact factor analysis uses the efficiency value of each unit DMU as the dependent variable, and regression using a traditional OLS model would result in severely biased and inconsistent parameter estimates. Therefore, the truncated regression method (Tobit model) in the dependent variable constrained model can be used to effectively solve such problems. The model is as follows in Formula (7).
In Formula (7), is the dependent variable, indicating the economic efficiency value of UCL. is the independent variable, representing each influence factor; is the constant term; represents the regression coefficient of the respective variable; is the random disturbance term; represents the normal distribution; and is the variance.
4. Indicator Selection and Data Sources
4.1. Evaluation Indicator System of EEUCL and Influencing Factors
4.1.1. Input and Output Variables
The intensive use of UCL is the process of continuous accumulation and concentration of labor, capital and other factors on the land [
2]. Therefore, the measurement of the economic input and output efficiency of UCL must authentically and effectively represent the adequacy of the allocation of three types of input factors: capital, land and labor, as well as the actual current situation of economic output. Based on the above demands and principles, the following evaluation system is constructed by combining existing research and accessible index data, as shown in
Table 2.
In terms of input indicators, based on the Theory of Growth in Classical Economics, indicators are selected from three categories of factors: capital, land and labor. First of all, the fixed capital stock of secondary and tertiary industries can truthfully reflect the total amount of capital for economic development of UCL at the respective time points; thus, it is taken as the capital input indicator. Secondly, UCL is an essential material carrier for urban economic development, and the scale of its land impacts the effectivity of industrial economic development; therefore, the area is regarded as the indicator of land input. Finally, the labor force of secondary and tertiary industries is the major contributor to the stable economic development of UCL, and the high efficiency of the employees has a strong promotion to economic efficiency, thereby using it as a labor input indicator.
In terms of output indicators, compared with GDP, the value added of secondary and tertiary industries more realistically indicates the socio-economic development in the objective year; therefore, it is used as the desired output, and under the requirement of low-carbon economic development, excessive carbon emission from UCL would restrict the economic transformation of urban development, and thus, it is non-desired output and serves as a negative externality constraint limiting high-efficiency economic development.
4.1.2. Influencing Factor Selection
To further explore the factors influencing the EEUCL, nine impact factors were selected from political, economic, energy, and other regional factors based on existing literature research (
Table 3). The explained variable is the EEUCL of each administrative region, the explanatory variables and their descriptions are as follows:
- (1)
Socio-economic development level (SDL) influences the expansion of UCL in the 14 administrative regions of the BTH urban agglomeration [
40]. At the same time, the research has shown that the improvement of SDL would promote the upgrading of the spatial allocation of UCL [
41]. The SDL is expressed as the per capita disposable income of urban residents.
- (2)
Industrial structure (IS) changing is the primary driver of the shift in the allocation of UCL resources [
42], while there has been research indicating that IS has a significant impact on changes in the EEUCL [
12]. In addition, since arable land is only land for the primary industry, while UCL is the principal carrier for the development of the secondary and tertiary industries, the ratio of the added value of the tertiary industry to the added value of the secondary industry is chosen to represent the industrial structure [
43].
- (3)
Urban scale (US) growth corresponds to the expansion of UCL, which to a certain extent could reflect the level of regional socio-economic development [
44]. The number of the urban population in the administrative region is used to indicate the expansion of US.
- (4)
The intensity of government intervention (IGI) is an essential factor in the efficiency of the green economy [
45]. Moderate government intervention can regulate the allocation of market resources and stimulate dynamic market mechanisms, leading to improved EEUCL. The IGI is represented by the ratio of local fiscal expenditure to local GDP.
- (5)
Scientific and technical support intensity (STSI) is the key to technological progress, which is an essential means to balance carbon reduction and economic development. Current scholars have discovered that technological progress has a positive effect on the EEUCL [
46]. The STSI is indicated by the ratio of science and technology expenditure to GDP.
- (6)
Outward opening level (OUL) is expressed in terms of the number of new foreign investment projects signed by each administrative region in the year. Currently, scholars consider foreign investment as one of the main factors influencing land use change [
47].
- (7)
The population density (PD) growth rate determines the expansion rate of land for urban construction. Related research shows that higher urban population density will lead to the problem of uneconomical agglomeration, and excessive population agglomeration brings about the “congestion effect” [
44]. The PD is expressed by the ratio of the total population of the area at the end of the year to the area of the area.
- (8)
Green economy development level (GEDL) increasing would drive the low-carbon intensive use of land and further promote healthy and sustainable development of the economy. The GEDL can be indicated by the energy consumption per unit of GDP [
48].
- (9)
Urban greening construction level (UGCL) can be expressed by using the area of park green space per capita [
26]. The reasonable increase in urban green space in UCL is beneficial to revitalize the stock and promote the improvement of EEUCL [
49].
Table 3.
Influencing factors index system.
Table 3.
Influencing factors index system.
| Statistical Variables | Variable Items | Symbol | Definition | References |
|---|
| Explained variable | Economic efficiency of urban construction land | EEUCL | Dynamic UCL performance | / |
| Explanatory variables | Socio-economic development level | SDL | Per capita disposable income of urban residents | [41] |
| Industrial structure | IS | The ratio of value-added in the tertiary sector to value-added in the secondary sector | [43] |
| Urban scale | US | The number of the urban population | [44] |
| Intensity of government intervention | IGI | The ratio of local fiscal expenditure to local GDP | [45] |
| Scientific and technical support intensity | STSI | The ratio of science and technology expenditure to GDP | [46] |
| Outward opening level | OUL | The number of new foreign investment projects signed in the year | [47] |
| Population density | PD | The ratio of the total population of the area at the end of the year to the area of the area | [44] |
| Green economy development level | GEDL | Energy consumption per unit of GDP | [48] |
| Urban greening construction level | UGCL | The area of park green space per capita | [26] |
4.2. Data Sources
In this paper, the 14 administrative regions of the BTH urban agglomeration are selected as the study units, including the two municipalities of Beijing and Tianjin, Hebei Provinces and their 11 prefecture-level cities (Shijiazhuang, Tangshan, Handan, Zhangjiakou, Baoding, Cangzhou, Qinhuangdao, Xingtai, Langfang, Chengde, and Hengshui). The study period of this article is from 2002 to 2019, and all statistics for the corresponding years are obtained from the original data of the “China Statistical Yearbook”, the “China Energy Statistical Yearbook”, the “China Urban Construction Statistical Yearbook”, the “China Urban Statistical Yearbook”, the “China GDP Accounting History (1952–2004)” (
http://www.stats.gov.cn/ (accessed on 17 October 2022)) and the National Bureau of Statistics.
In particular, the missing data on the UCL area in Beijing in 2005 and 2010 are supplemented by STATA 16 software using the interpolation method; the missing data of total fixed asset formation in Beijing, Tianjin and Hebei Provinces in 2019 are supplemented by applying the high-order autoregression of a smooth time series to their data in the last 20 years and calculating the predicted values by STATA 16 software.
The data processing of the relevant indicators is as follows: (1) the perpetual inventory method is used to measure the fixed capital stock of secondary and tertiary industries in the city, and the calculation formula is
, where
, taken as 9.6%, and
is the fixed asset investment price index calculated with 1952 as the base period, using the product of total social fixed asset investment and the proportion of value added of secondary and tertiary industries in the calendar year to obtain the total fixed asset investment in secondary and tertiary industries. The base period capital stock is calculated concerning Zhang Jun et al. [
50]. Firstly, the fixed capital stock in Beijing, Tianjin and Hebei from 2002–2019 by constant 1952 prices and reduced to 2002 prices was calculated. Secondly, the value-added shares of secondary and tertiary industries from 2002–2019 to obtain the fixed capital stocks of secondary and tertiary industries in Beijing, Tianjin and Hebei were used, and the product of the proportion of total fixed asset investment in secondary and tertiary industries in each city from 2002–2019 and the fixed capital stock of secondary and tertiary industries in Hebei Province to obtain the fixed capital stock of secondary and tertiary industries in each city in the base period were further used; (2) the data for urban secondary and tertiary industry labor force in each year are the number of employees in secondary and tertiary industries at the end of that year; (3) price deflators were used to deflate the value-added data of urban secondary and tertiary industries for each year to constant 2002 prices.
5. Results and Influence Factors
5.1. Evolution of Carbon Emissions for UCL in the BTH Region
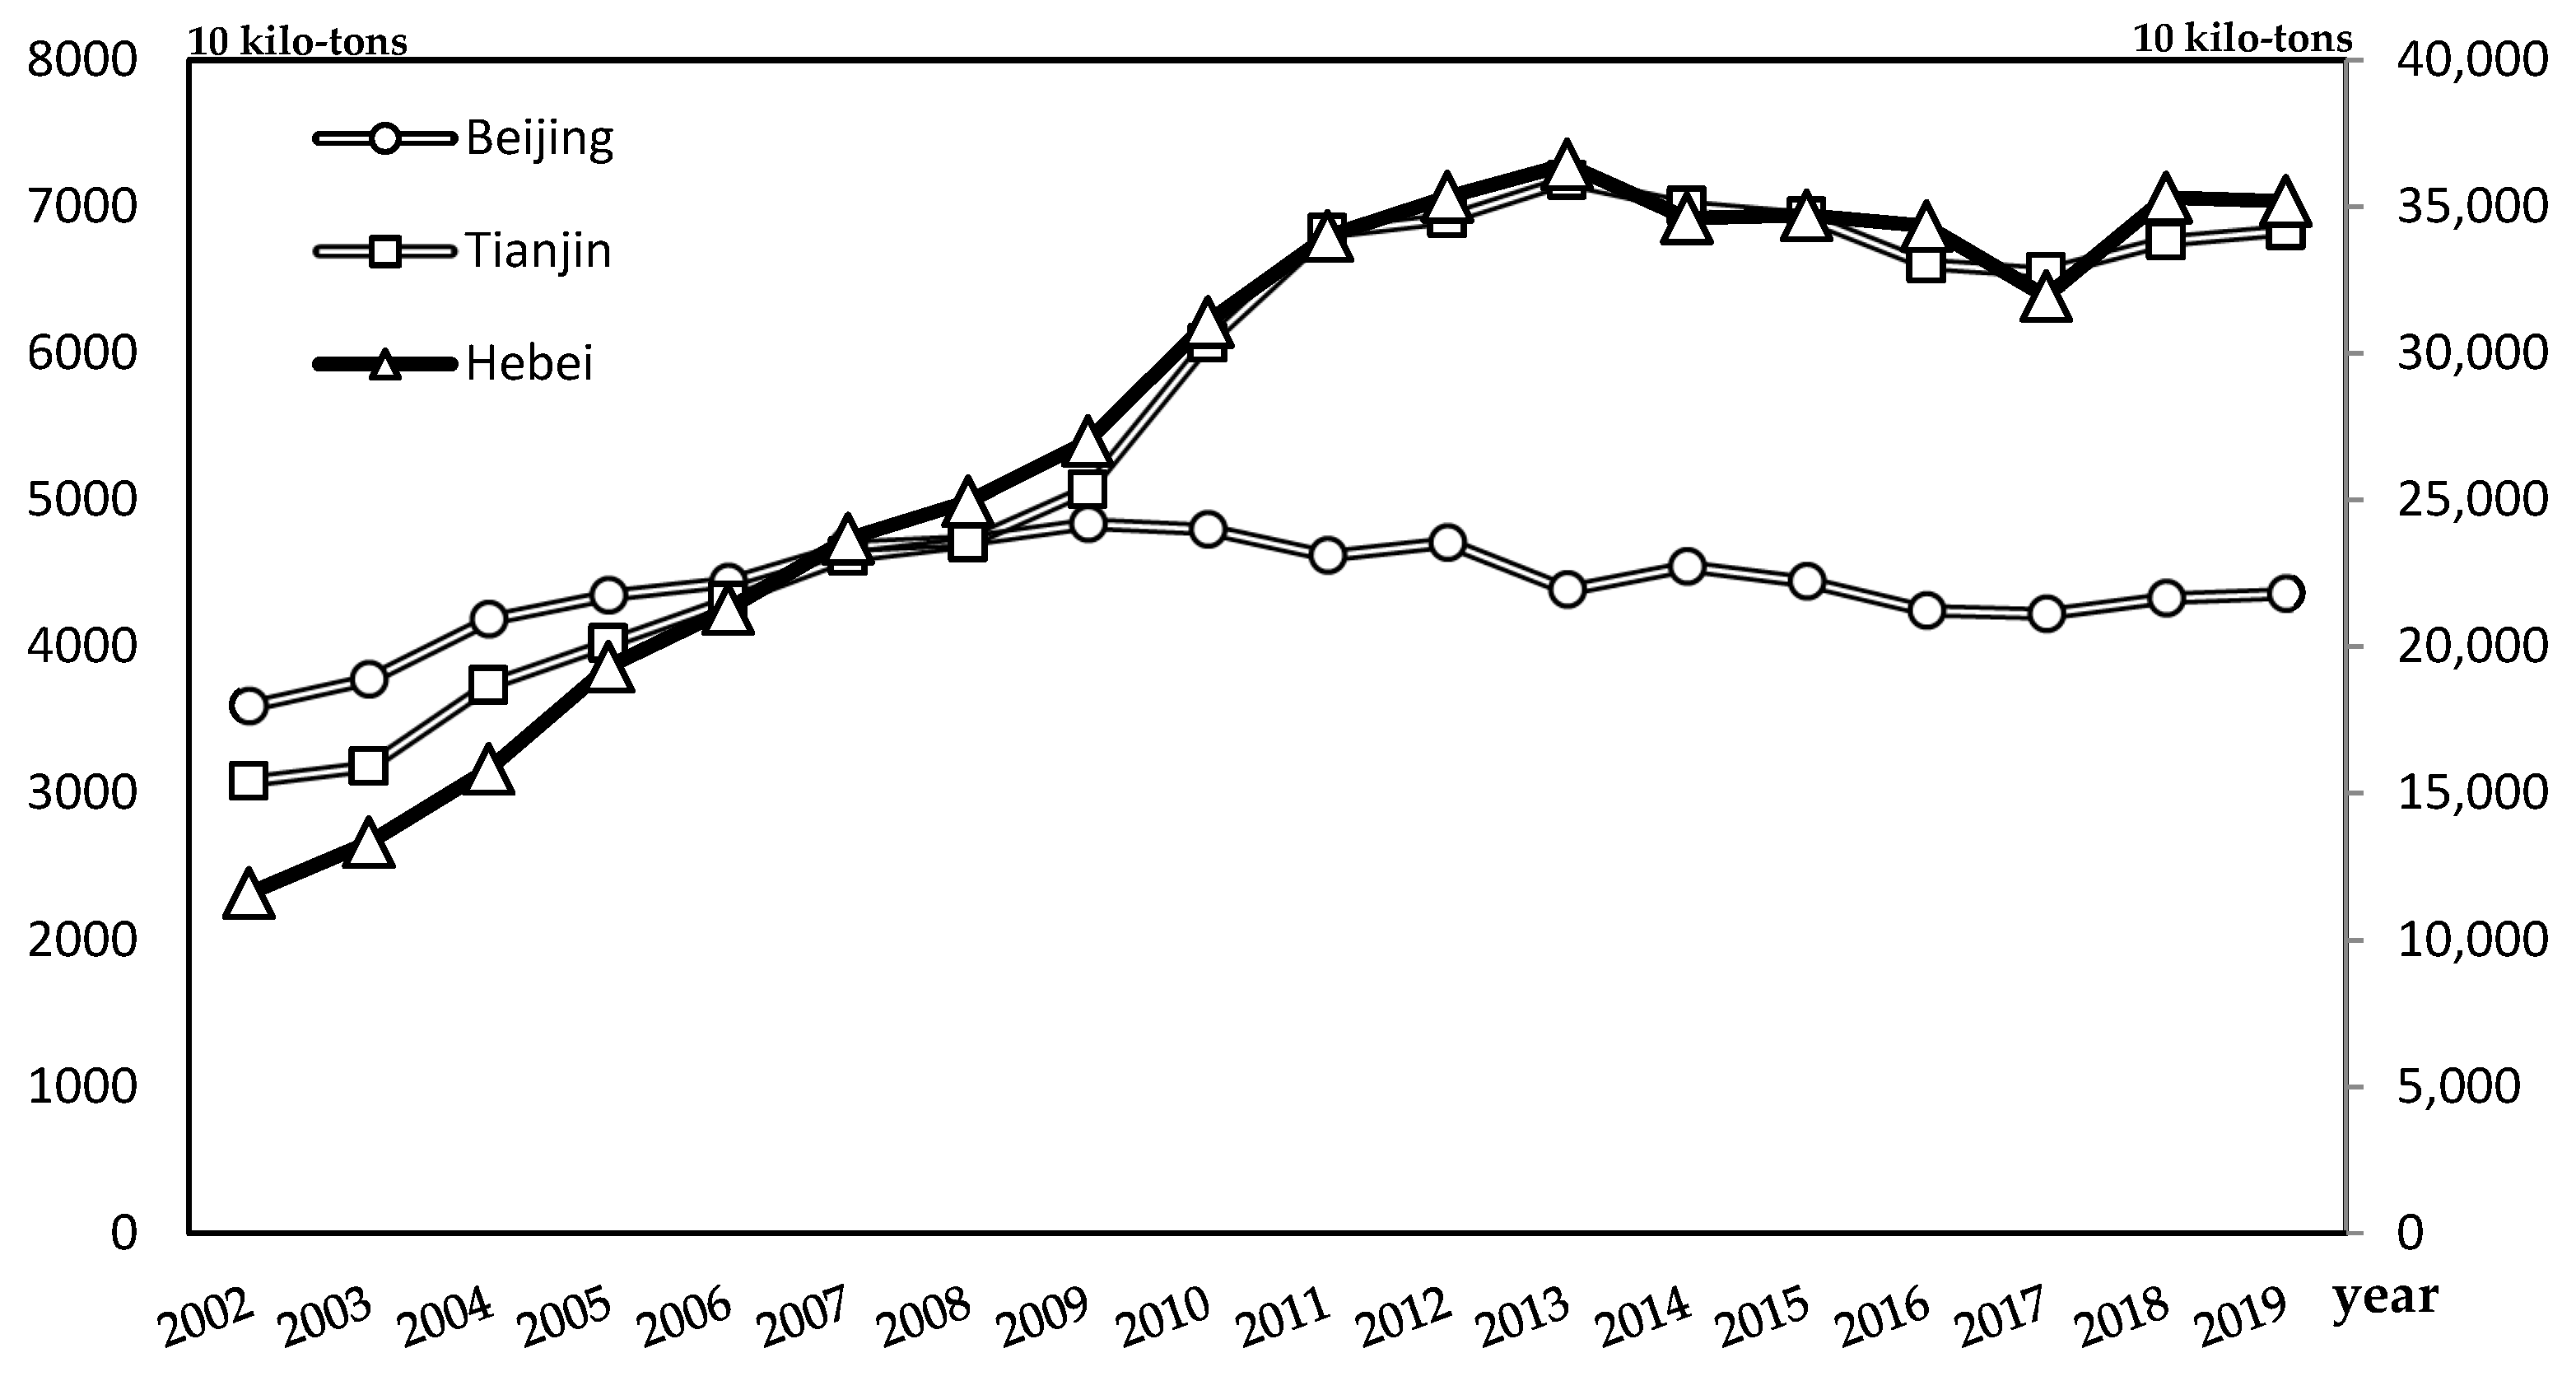
During the research period, the total carbon emissions from UCL in Beijing, Tianjin and Hebei Provinces all reached their peaks, with Beijing’s carbon emissions showing a trend of “rising first and then fluctuating down” (see
Figure 1). From 2002 to 2009, the total carbon emissions from UCL in the city showed a gradual and slow increase, from 35.99 million tons in 2002 to 48.42 million tons in 2009, and then fluctuated down to 43.66 million tons in 2019. The carbon emissions of Tianjin and Hebei Provinces showed a trend of “rising, then falling, then slightly rising”. The total carbon emissions from UCL continued to rise from 2002 to 2013, rising rapidly from 30.89 and 115.97 million tons in 2002 to a peak of 71.78 and 364.38 million tons in 2013, respectively, and then gradually and slowly decreased to 65.51 and 319.44 million tons, followed by a slight rebound to 68.37 and 351.88 million tons in 2019. The period from 2002 to 2009 was the period of the “10th Five-Year Plan” and “11th Five-Year Plan” when Beijing, Tianjin and Hebei Provinces experienced rapid socio-economic development, and the effect of carbon emission growth was significant. Since China reaffirmed its commitment to carbon emission reduction at the Copenhagen Climate Conference in 2009, Beijing, which has a high proportion of tertiary industries and is relatively developed, has been implementing the “Green Beijing” action plan, adjusting its energy structure, and promoting policies and measures for energy conservation and consumption reduction (e.g., the “Beijing Municipal 12th Five-Year Plan (2011–2015) for Energy Conservation and Climate Change”, the “Beijing Municipal 12th Five-Year Plan for the Development and Construction of Green Beijing”, and the “Beijing Municipal Measures for the Management of Carbon Emission Offsets”), and has been gradually reducing its energy consumption and intensity and carbon emissions since 2010. In Tianjin and Hebei Provinces, where the value added of the secondary industry is relatively strong, energy consumption keeps growing in the short term due to the inertia of economic development, and the growth effect of carbon emissions remains significant but starts to slow down during the first and middle of the 12th Five-Year Plan period from 2011 to 2013. Afterward, as Tianjin and Hebei gradually promote industrial transformation and upgrading, the energy consumption structure was adjusted, and the carbon emission reduction policies (such as the “Tianjin 12th Five-Year Plan for the Implementation of Comprehensive Work on Energy Conservation and Emission Reduction” and the “Hebei Province 12th Five-Year Plan for Energy Conservation and Emission Reduction”) were strictly implemented. Carbon emission levels have gradually decreased since 2014, and although the total carbon emissions have rebounded slightly from 2017 to 2019 due to the decentralization of non-core functions of the capital, the overall annual growth rate of carbon emissions in the 13th Five-Year Plan period (2016–2019) was much lower than the previous period.
As can be seen from
Figure 2, the more developed the secondary and tertiary industries of cities are, the more carbon emissions they emit. In particular, Shijiazhuang and Tangshan, which are large provincial capitals and old industrial cities, have the largest contribution to the total carbon emissions from UCL in the province because of their location and industrial base, and their energy consumption has been increasing as a proportion of the province’s total carbon emissions. The trend of “rising, then falling, then rising again” is consistent with the overall change in the province.
5.2. Spatial and Temporal Changes in the EEUCL in the BTH Region
5.2.1. Analysis of Results of Super-Efficiency SBM Model
This paper uses MaxDEA 7.0 software to measure the EEUCL in 14 administrative regions in the BTH urban agglomeration from 2002 to 2019 based on the super-efficiency SBM-DEA model with non-expected output, and the calculation results are presented in
Table 4 and
Table 5. In addition, to compare the evolution of EEUCL in Beijing, Tianjin and Hebei, the study period is divided into four stages from the 10th Five-Year Plan (2002–2005) to the 13th Five-Year Plan (2016–2019), and the EEUCL in each stage is expressed as the average value of efficiency in the corresponding period. The results and trends are shown in
Table 4 and
Figure 3.
From
Figure 3, it can be seen that from the 10th to the 13th Five-Year Plan period, Beijing has maintained a high level of EEUCL, and the trend is slowly increasing, which indicates that in recent years, Beijing has better balanced the relationship between industrial development and carbon emissions under the premise of ensuring stable economic development, and has initially realized the low-carbon economic development model of “low consumption and stable growth”. The efficient development of Beijing’s economy is mainly attributed to the “low carbon emission and high value-added” tertiary industry, which can achieve higher economic and industrial value added and lower carbon emission with the same capital, land, and labor input. In addition, the five-year plans in each phase have promoted the transformation of the industrial structure to the tertiary sector, which has led to an increase in the EEUCL in Beijing. Compared with Beijing, the EEUCL values of Tianjin and Hebei have gradually declined from 0.915 and 0.542 in the 10th Five-Year Plan period to 0.621 and 0.414 in the 13th Five-Year Plan period, respectively. The main reason for the gradual decline of EEUCL is that the economic and industrial development of Tianjin and Hebei still depend on the “high energy consumption and low efficiency” of the secondary industry. Although Beijing, Tianjin and Hebei have been promoting the transformation of the industrial structure to the tertiary industry in recent years, the ratio of the added value of the tertiary industry to the added value of the secondary industry in Tianjin and Hebei is still less than 1 at the end of the 12th Five-Year Plan period (2011–2015). This has resulted in Tianjin and Hebei relying on high inputs and high energy consumption to maintain economic industries for its development, which in turn directly lead to low levels of EEUCL. At the same time, in the early stage of the low-carbon transition, industrial development, economic growth and energy carbon emissions in Tianjin and Hebei are still in a state of weak decoupling, and the inertia of high-speed economic development cannot achieve a sudden decay in energy consumption, thus showing a gradual decline in the EEUCL. Hebei Province accounts for 74% of carbon emissions in the BTH region from 2002 to 2019, and its economic efficiency level of UCL has been at the lowest level. Benefiting from the emission reduction plan and industrial transformation policy during the 12th Five-Year Plan period, the ratio of the added value of the tertiary industry to the added value of the secondary industry in Hebei Province was greater than 1 and gradually increased since the 13th Five-Year Plan period. Along with the industrial transformation development, the EEUCL slightly increased compared with the 12th Five-Year Plan period, although the increase is not infinite, which indicates that with the change of the decoupling relationship between energy and carbon emissions and economic development from weak to strong, the decline of EEUCL will gradually slow down, and when the relevant industries complete the transformation and upgrading, and the energy structure is further optimized, and the EEUCL will gradually rebound.
According to the mean values of EEUCL in each city in
Table 5, they can be divided into four echelons: the first echelon of EEUCL is greater than 1, including Beijing, Tangshan, Cangzhou, Langfang and Hengshui. The second echelon, with efficiency values between 0.9 and 1, includes Shijiazhuang, Baoding and Qinhuangdao. The third echelon efficiency lies between 0.7 and 0.9, including Tianjin Handan and Xingtai. The fourth echelon efficiency value is less than 0.7, including Zhangjiakou and Chengde.
In the first echelon, except for Langfang, whose efficiency value in 2014 and Hengshui, whose efficiency value in 2002–2005 did not reach 1, the efficiency values of all cities in the rest of the years were greater than 1. This indicates that the economic factor input–output structure of cities in this echelon is more reasonable and resources are more adequately utilized in the process of economic efficiency transformation, but cities in Hebei Province still need to promote the transformation and upgrading of their industrial structure to the tertiary industry, gradually reduce the economic share at the cost of increased carbon emissions, and further improve the efficiency of their resource allocation.
In the second tier, the EEUCL in both Baoding and Qinhuangdao cities roughly shows a fluctuating upward trend. Among them, the EEUCL in Baoding and Qinhuangdao has increased significantly from 2012 to 2017, mainly due to the gradual improvement in the rationality of input–output structure and the reduction of redundancy in land and labor, as well as the reduction of redundancy in carbon emissions. From 2002 to 2013, the EEUCL in Shijiazhuang showed a trend of fluctuating downward and then upward, and the efficiency value began to decrease slowly in 2014 but remained above 1. In order to boost the intensive use of resources and industrial structure adjustment at the provincial level, Shijiazhuang has promulgated and implemented relevant policy documents such as giving priority to supporting land planning for construction in industrial agglomerations and accelerating the development of the tertiary industry since 2010, and the redundancy of land and labor has been significantly reduced since 2010, and the EEUCL in Shijiazhuang has increased rapidly. Along with the increasing proportion of added value in the tertiary industry, the steady economic development has been accompanied by a gradual reduction in the incremental carbon emissions over the calendar year, and the efficiency remains high from 2014 to 2019.
In the third echelon, the EEUCL in Tianjin and Xingtai cities shows a fluctuating downward trend. Among them, the efficiency values from 2010–2014 in Tianjin and 2005–2010 in Xingtai both decreased sharply, because the redundancy of capital, land, and labor inputs in both cities became more and more serious during the period, while the output of value added of secondary and tertiary industries was seriously insufficient, and it is still necessary to further improve the mechanism of intensive use of construction land in the future and continuously improve resource allocation and utilization capacity. The EEUCL in Handan City roughly shows a steady upward trend, rising from 0.663 in 2002 to 0.779 in 2019, due to the reduction of redundancy of various input factors and carbon emission output redundancy.
In the fourth echelon, the EEUCL in Zhangjiakou and Chengde from 2002 to 2019 shows fluctuations and changes. Compared with other cities in Hebei Province, the efficiency values of Zhangjiakou and Chengde in the “northern compartment” region are stable below 0.6 due to their poor location and low level of economic development, and neither of them has reached the frontier of comprehensive efficiency technical level.
5.2.2. Productivity Analysis Based on the Malmquist Index Model
From the calculation results in
Table 6, it can be seen that overall the total factor productivity of the UCL economy in the BTH region from 2002 to 2019 showed fluctuating changes but maintained a growth trend with an average value of 1.083 and an average annual growth rate of 8.3%, indicating that the overall economic development of UCL in the BTH region during the study period was positive. From its index decomposition, the technical efficiency change (EFFCH) index and the technological progress change (TECH) index show fluctuations from 2002 to 2019, with annual changes fluctuating, with average growth rates of 1.5% and 6.9%, respectively, and total factor productivity growth mainly driven by the combined effect of both. As can be shown in
Figure 4, the total factor productivity and TECH finally show a synchronous trend, indicating that total factor productivity is more influenced by the role of technological progress.
Further decomposition of the TECH index reveals that technical efficiency is affected by both scale efficiency change (SECH) and pure technical efficiency change (PECH), except for 2005–2006, 2006–2007 and 2010–2011, when it is mainly influenced by PECH. The increased technical efficiency relies mostly on small growth in pure technical efficiency and scale efficiency, both averaging 0.3% and 1.2%, respectively, from 2002–2019.
From the results of the calculation of the 14 administrative regions in
Table 7, the total factor productivity of the 14 administrative regions in the BTH region from 2002–2019 is greater than 1, indicating an overall positive trend in the economic development of UCL in the research area. Among them, Tianjin has the highest total factor productivity, with an average annual growth rate of 18.7%, and Cangzhou has the lowest total factor productivity, with an average annual growth trend of 3.6%. Except for Tangshan, Langfang and Cangzhou, the remaining administrative regions have seen a more comprehensive increase in various efficiency values, and the EFFCH index and the TECH index are not less than 1. This indicates that the above administrative regions have seen positive results in the reform of the economic input–output structure and development mechanism of UCL in recent years, while for Tangshan City, Langfang City and Cangzhou City, with their own superior economic and industrial base, technological progress has offset the impact of declining technical efficiency and should focus on improving pure technical efficiency in the future.
From the decomposition index, most of the administrative regions, such as Beijing and Tianjin, are in a growing state of technical efficiency, mainly by the combined effect of pure technical efficiency and scale efficiency, which is consistent with the results of the above analysis. Tangshan, Langfang and Cangzhou show a decreasing trend of EFFCH index, among which Tangshan is mainly negatively influenced by pure technical efficiency, while Langfang and Cangzhou need to be improved in both pure technical efficiency and scale efficiency.
5.3. Analysis of Factors Influencing the EEUCL in the BTH Region
Through the above measurement, the economic efficiency values of UCL in the BTH region from 2002 to 2019 were acquired. To further analyze the influencing factors of EEUCL, the measured comprehensive efficiency values are taken as the explained variables, and nine indicators such as per capita disposable income of urban residents, the ratio of the added value of the tertiary industry to the added value of the secondary industry, and the number of the urban population are taken as the explanatory variables to construct a Tobit model for quantitatively analyzing the degree of influence of factors such as the socio-economic development level, industry structure, and urban scale on the EEUCL in the BTH region.
To eliminate the effect of data heteroskedasticity, some of the dependent variable data were treated by taking the natural logarithm. The regression model is as follows in (8).
where the letter meaning is the same as the formula above.
Table 8 shows the results of the Tobit model regression, and the results of the analysis are as follows:
- (1)
The socio-economic development level has a significant positive impact on the EEUCL, with an increase of 0.146% for every 1% increase in per capita disposable income of urban residents. The increasing level of social and economic development in the BTH region has influenced the expansion and structural changes in the scale of UCL in most cities. By realizing the improvement of social and economic benefits, the government is prompted to further rationalize the allocation of land resources and capital investment, thereby enhancing the EEUCL.
- (2)
The industrial structure has a significant positive impact on the EEUCL, with a 0.290% increase in economic efficiency for every 1% increase in the ratio of the added value of tertiary industries to the added value of secondary industries. The optimization and upgrading of the industrial structure require the comprehensive improvement of management and technology, which in turn can force the continuous optimization of industrial structure, while the optimization of industrial structure develops the low energy consumption and high-efficiency tertiary industry, provides investment fields for the construction of low carbon economy, and promotes the improvement of EEUCL.
- (3)
Urban scale has a significant negative effect on the EEUCL, with a 0.0003% decrease in economic efficiency for every 1% increase in the number of the urban population. While promoting the development of economic agglomeration, the expansion of urban scale is accompanied by the rapid expansion of urban population, which to a certain extent causes the wasteful phenomenon of capital investment and land resources and thus adversely affects the EEUCL. However, since the market system for UCL in the BTH region has become well established, the positive impact of government intervention on the EEUCL has become weaker and weaker, and the promotion effect is not significant.
- (4)
There is a positive correlation between the intensity of government intervention on the EEUCL, but it does not pass the significance test, indicating that government intervention has a certain contribution to economic efficiency. Reasonable government intervention is conducive to the adequate allocation of resources, pulling in capital and labor input.
- (5)
The scientific and technical support intensity has a significant negative effect on the EEUCL, with a 0.049% decrease in economic efficiency for every 1% increase in the ratio of science and technology expenditures to GDP. Although the overall share of science spending in the BTH region is increasing year by year, because science spending funds are mostly directed to basic and applied research in research institutions and universities, it is difficult for such research to produce “revolutionary” benefits in the short term, which can promote the transformation and upgrading of economic industries and energy structures. At the same time, the improvement of EEUCL requires science and technology to empower the development of low-carbon industries to achieve the “decoupling” of economic growth and carbon emissions, while the current science and technology support system around the development of the low-carbon economy has not been perfected, the green science and technology innovation capacity is weak, and the effective combination of scientific and technical support and low-carbon economy is seriously inadequate.
- (6)
There is a significant negative impact of the outward opening level on the EEUCL, and with each 1% increase in the number of new foreign-invested projects in the year, the economic efficiency decreases by 0.04%. Through the introduction of foreign investment, domestic enterprises can learn from the more advanced international technology and management experience, but the BTH region still needs to further develop policies to attract investment in line with the development of a low-carbon economy, to help the localization of international knowledge and experience, and to promote the development of high-consumption, rough construction land use to intensive UCL use [
51].
- (7)
There is a significant negative effect of the population density on the EEUCL, with each 1% increase in population density decreasing the economic efficiency by 0.00002%. In the process of urbanization, along with the increasing density of the urban population, when the benefits of crowding outweigh the benefits of economic agglomeration, the increase in population density to a certain extent reduces the resources per capita and increases the redundancy of labor, inhibiting the EEUCL.
- (8)
The development of a green economy has a significant positive impact on the EEUCL. For every 1% reduction in energy consumption per unit of GDP, the higher the level of green economic development, and the economic efficiency increases by 0.154%. In recent years, energy consumption per unit of GDP in Beijing, Tianjin and Hebei have all been gradually reduced, with Beijing’s energy consumption per unit of GDP being as low as 0.208 tons of standard coal/yuan in 2019, and 0.584 and 0.930 tons of standard coal/yuan in Tianjin and Hebei, respectively. Therefore, the BTH region still has much room for improvement in green economic development, and Tianjin and Hebei Provinces should further promote economic and industrial transformation and upgrading, vigorously develop low-energy-consuming and high-output economic activities, and comprehensively improve the EEUCL, relying on the background of the “double carbon” strategy development.
- (9)
There is a positive correlation between the urban greening construction level and the EEUCL, but it does not pass the significance test, which may be due to the following reasons: The investment in urban ecological construction can provide the impetus for the development of a low-carbon economy, but because the distribution area of urban park green space is mostly concentrated in the urban area with better greening, the marginal effect of increasing park green space gradually decreases. Furthermore, compared with forest and protection forest planting, the carbon absorption effect of park green space is limited and does not effectively relieve the pressure of quality and efficiency improvement and carbon reduction development faced by cities.
6. Conclusions
This paper explores the spatial and temporal variability and changes in characteristics of the EEUCL in 14 administrative regions in the BTH urban agglomeration from 2002 to 2019, based on the super-efficiency SBM-DEA model and Malmquist index, using carbon emissions as the non-desired output. On this basis, the Tobit model is used to study the role of nine impact factors on the EEUCL. The major results are summarized as follows:
(1) In terms of changes in carbon emissions, the total carbon emissions from UCL in Beijing reached its peak in 2009, while both Tianjin and Hebei Province reached their peaks in 2013 and have been gradually reducing their carbon emissions since 2014. Although there is a small rebound in total carbon emissions in Tianjin and Hebei from 2017–2019 due to the deconstruction of non-core functions of the capital, the overall annual growth rate of carbon emissions in the 13th Five-Year Plan period is much lower than the previous period and has a declining trend.
(2) Concerning the characteristics of EEUCL in the BTH region, from the overall perspective, Beijing has maintained a high level of EEUCL from the 10th Five-Year Plan period to the 13th Five-Year Plan period, and the trend is slowly increasing. In contrast, the economic efficiency values of Tianjin and Hebei, which are mainly focused on the “high energy consumption and low efficiency” secondary industry, are gradually declining.
(3) Total factor productivity of the economy of UCL in the BTH region from 2002 to 2019 generally maintains a growth trend, where total factor productivity is more influenced by the role of technological progress.
(4) During the study period, factors such as the socio-economic development level, industrial structure, intensity of government intervention, green economy development level and urban greening construction level positively influenced the EEUCL in the BTH region. On the contrary, factors such as the urban scale, scientific and technical support intensity, outward opening level and population density had a negative impact on the EEUCL in the BTH region.
According to the above conclusions, the policy recommendations are as follows: (1) Maintain and strengthen the advantageous external environmental factors, perpetuate reasonable government intervention in the market, and promote the flourishing of economic industries; increase the transformation of industrial structure, vigorously develop low-consumption, high-value-added tertiary industries, and deepen the development of the regional green economy. (2) Improve the disadvantageous external environmental factors, evacuate non-capital functions while also focusing on the evacuation and transfer of population; build a science and technology support system around the development of a low-carbon economy, strengthen the ability to innovate in green science and technology, and improve the effectiveness of the use of scientific expenditure funds. (3) Through the development of cross-provincial and municipal regional carbon emission reduction collaboration to break the traditional administrative boundaries, guide the reasonable allocation and flow of various resources in the region, thereby reducing the cost of economic and industrial development and fully tapping and releasing the regional carbon emission reduction potential.
In the context of global countries’ efforts to promote carbon emission reduction, this research brings the carbon emissions of UCL into the measurement of its economic efficiency. Through static and dynamic analyses, the study not only scientifically reveals the actual economic efficiency of UCL, but also identifies the key driving forces affecting its change based on the analysis of impact factors, providing practical and theoretical support for the optimal allocation and efficient utilization of UCL under the carbon emission constraint. However, there may be some limitations in this study: In this study, the analysis of the factors influencing the economic efficiency of urban construction land is examined with macrodata only, which are insufficient to capture the impact of microfactors on its economic efficiency. In addition, this paper only conducts an empirical study on 14 administrative regions of the BTH urban agglomeration and does not select other urban agglomerations for comparative analysis to explore the differences and the causes of the EEUCL among various types and structures of urban agglomerations. Therefore, the next step will be to use microdata, taking into account the heterogeneity of land elements and appropriate models to further explore the driving factors affecting the changes in economic efficiency of urban construction land. Meanwhile, the study will take various types of urban agglomerations as research objects and provide more accurate suggestions for a sound policy system of urban construction land by analyzing the similarities and differences of their empirical results.

