1. Introduction
The capacity of urban space in providing thermal comfort is essential for urban livability, health, social cohesiveness, and conviviality [
1]. In the context of global climate change, downtown regions are especially exposed to the impacts of extreme weather conditions [
2], while more than half of the world’s population currently resides in cities [
3]. However, a comprehensive explanation of outdoor thermal comfort cannot be provided by only evaluating micrometeorological circumstances, heat exchange, and human energy balance research. The human body lacks any selective sensors for sensing certain climatic factors, and the temperature that is felt in outdoor environments is affected by the combined effect of all climatic characteristics, which are interrelated [
4]. The relevance of the mean radiant temperature with the body’s heat balance is similar to that of the air temperature with different wind speeds. Thus, a heat-balance model of the human body must be used. The Munich Energy-balance Model for Individuals (MEMI), which simulates the thermal parameters of the human body in a physiologically realistic manner, is the foundation for the physiological equivalent temperature (PET). PET is defined as the air temperature at which the human body’s heat budget is balanced with the same core and skin temperatures as under the challenging outside parameters to be evaluated in a normal indoor environment (without wind and solar radiation) [
4]. Over the last two decades, over 110 research papers have been published on thermal conditions and subjective thermal perception most of which are on PET, PMV, UTCI, and SET [
5,
6,
7,
8,
9,
10].
Climate-sensitive urban design (CSUD) is a design strategy to reduce urban heat; it involves urban landscape planning and design that aims at creating more sustainable and thermally comfortable urban environments [
11]. Street trees are considered an important factor in CSUD and, specifically, in relieving heat stress in cities [
11,
12,
13,
14,
15]. Tree canopies block shortwave solar radiation and decrease the level of heat stress [
13]. Urban green areas offer a range of ecosystem services, including lowering noise, air, and water pollution, controlling local climate, and enabling recreational activities [
16]. Urban vegetation has been considered in many studies on a variety of levels, from microscale to mesoscale [
17,
18,
19,
20]. Designing accurate models for urban environments is extremely difficult because tree canopies and buildings are significantly different in their radiative, thermal, and drag properties and also because there is radiation exchange between buildings and trees [
21].
2. Literature Review
2.1. Three-Dimensional Urban Digital Twin
It is impossible to think about a city as being made up of distinct, independent pieces of land, buildings, and infrastructure that are then put together after being constructed in isolation. Researchers and academics argue that the city must concurrently create its infrastructure, buildings, and functional areas interactively as a cohesive system rather than as separate, disjointed parts [
22]. A city model is based on a multilevel modeling approach and consists of various interdependent models [
23] that are considering different functions in an urban environment [
24]. Generating a city model that is representative of the interdependent individual elements in the urban environments is not easy. These city models mainly include data collection and analysis such as digital twins that are based on information technology [
25]. Every digital twin is a virtual space for the integration of key components of urban infrastructures. Digital twins are based on virtual models that propose real-world city environments [
26]. A city digital twin is a series of interconnected digital twins representing certain aspects of the functioning of the urban environments. Every digital twin receives a continuous flow of data collected by sensors in real time, analyses the data, and presents the outcome in various virtual models [
27]. A three-dimensional city microclimate digital twin should provide complementary and supportive roles in the collection and processing of micrometeorological data and automated modelling and it cannot be a context-free technology. Thus, a city microclimate digital twin provides complementary and supportive roles in the collection and processing of micrometeorological data, and automated microclimate modelling and representation of urban climatic interactions virtually.
2.2. Connecting Pedestrian Routes in a Green Net
In reality, connecting green spaces has a significant impact on cities. If urban green spaces stay disconnected, parcels cannot be effectively utilized. Planning urban green spaces as nodes limits safety and physical accessibility, while corridors connect people, green, and the ecosystem [
28]. These corridors provide people with the smooth functioning of the city, thereby prioritizing the need for natural urban corridors would be a practical way to more effectively activate urban nodes [
29]. Urban design must now incorporate integrating city “green nodes” through a green network that covers a small urban fabric [
30]. The creation of modular designs for green infrastructure helps to organize the intricate interactions between urban green areas and the built environment, according to research conducted in Dresden, Germany. The recommendations created through the research of the Dresden landscape plan reflect the geographical variability of green areas in the city and consider integrated socio-ecological systems [
31].
In this study, the objective is to enhance the practicality of planning pedestrian-level thermal comfort in a high-density historical urban context and to assess the feasibility of creating a green pedestrian network at the city level. The method described in
Section 3 is developed based on open-source datasets to investigate the accessibility and connectivity of streets and the level of thermal comfort and evaluate the possible impact of a green pedestrian network in the city centre of Imola, Italy.
Section 4 is focused on reliability and the results are analysed in
Section 5, in
Section 6, the functionality of the model is discussed in several aspects in comparison to previous studies. The study is concluded in
Section 7, the research findings are expected to help urban planners and policymakers in analysing street thermal comfort and the role of greenery in walkability in a city context.
3. Methods
To accomplish this, a model is developed based on quantifying walkability indicators, PET criteria, and a green pedestrian network. We demonstrate a hypothetical implementation of a thermal comfort digital twin made up of (a) the physical world, (b) an integrating section, and (c) the digital world (
Figure 1). The main aim of the proposed digital twin is to mirror the physical world in three steps: (1) data collection, (2) learning process, and analysing (3) post-implementation processes and decision making. Post-implementation is a validation process that is intended to mitigate the effects of incomplete urban climate data sources and to address the situation when a significant amount of uncertainty raises questions about the model’s reliability. A model for integrating offline microclimate simulations with real-time data sources is provided in this study. The template also demonstrates how the digital twin may be enhanced to accommodate a wide range of data sources and simulations on different scales and topics.
3.1. Thermal Comfort Computation
The PET estimation is the primary goal of the first section of this 3-Dimensional GPN Digital Twin. PET is estimated by using a hybrid model built in Python 3.8.1 code, which simulates each parameter in a distinct engine. To guarantee the precision of input and output ordering in each phase and specifically the model outcome in the final step, the interrelations of the parameters are programmed as a thorough Python script. Three engines—EnergyPlus, Grasshopper, and OpenFOAM—are the foundation of the model. The connection between the stages and their order is shown in
Figure 2.
3.2. Meteorological Real-Time Input Data
The creation of a weather data file for short-term prediction is the initial stage in creating this 3-dimensional digital twin. The regeneration of the weather data file demands the following four file components: dry bulb temperature, relative humidity, wind speed, and sky cover. Models for hourly dew point temperature, solar radiation on Earth, and direct and diffuse decomposition will be indicated using these factors. Since grasshopper cannot connect with EnergyPlus explicitly, the Honeybee tool was used to connect Open Studio, EnergyPlus, Radiance, and Daysim for an automated process to rebuild a weather file based on the current epw file. Using an automated method, the hourly formatted weather components were changed. The following steps’ computations will make use of this weather information.
3.3. Turbulent Exchange and Wind Speed
To provide precise, high-resolution modelling of wind patterns at height 1.1, the airflow patterns were simulated in a number of computational fluid dynamics (CFD) models [
32]. To guarantee the precision of the examined domain, a predominantly hexahedral mesh was first created, along with further refinements at 5 m above ground level and greater density cells at 2 m from the trees. The local weather dataset was statistically processed to provide the wind speed and mean velocity. A logarithmic law was used to build the vertical exchange, with a roughness length (z
0) default value of 1 m. The turbulence exchange was estimated using Equation (1) [
33].
U(z): the speed at height z
Umet: meteorological wind speed
zref: meteorological reference height
z0: roughness length
z: the height of the selected point
The boundaries were at a height of 300 m twice of Hmax (for the top boundary), and at 400 m for the lateral extension that is three-time of Hmax, and for simulation of flow re-development a 15 × Hmax was chosen. The models were simulated in OpenFOAM [
34].
3.4. PET Computation
The following steps are involved in the PET calculation:
- -
Using MEMI, calculation of the body’s thermal state for a certain set of meteorological variables (
Table 1).
- -
Inputting the computed mean skin and core temperatures into the MEMI model and resolving the energy balance equation system for Ta (with v = 0.1 m/s, VP = 12 hPa, and Tmrt = Ta).
3.5. Walkability Indicators
Recently, the idea of walkability and walkable neighbourhoods has emerged as a central theme in urban planning. In this theme, the majority of citizens’ daily needs are met by foot, bicycle, or local transportation within a short distance from their homes [
36]. Urban morphology represents the layout of the city including buildings, open spaces, and street patterns. Accessibility and connectivity are two important factors in urban morphology that impacts walkability. Accessibility can be defined as how much a place is related to other locations spatially. So if one area is more likely to be accessed and attract more pedestrians. Connectivity, however, is the directness and availability of routes between two places. To guarantee accessibility and connectivity in this digital twin, the urban land use of the neighbourhood is imported into Rhino 6 (
Figure 3). Public green nodes, public transportation nodes, and public urban space nodes are considered a destination, and residential parcels as the beginning nodes of pedestrian routes. Walkability is often calculated within a small local area, probability of walking sufficiently to meet recommendations for health is 3 km [
37]. Thus, in this model, the maximum distance between the beginning nodes and the destinations is 3 km. the map considers different scores for every distance level from 0 to 3 km. over the next steps, this map will be overplayed by the PET map to define the scenarios of a green pedestrian network.
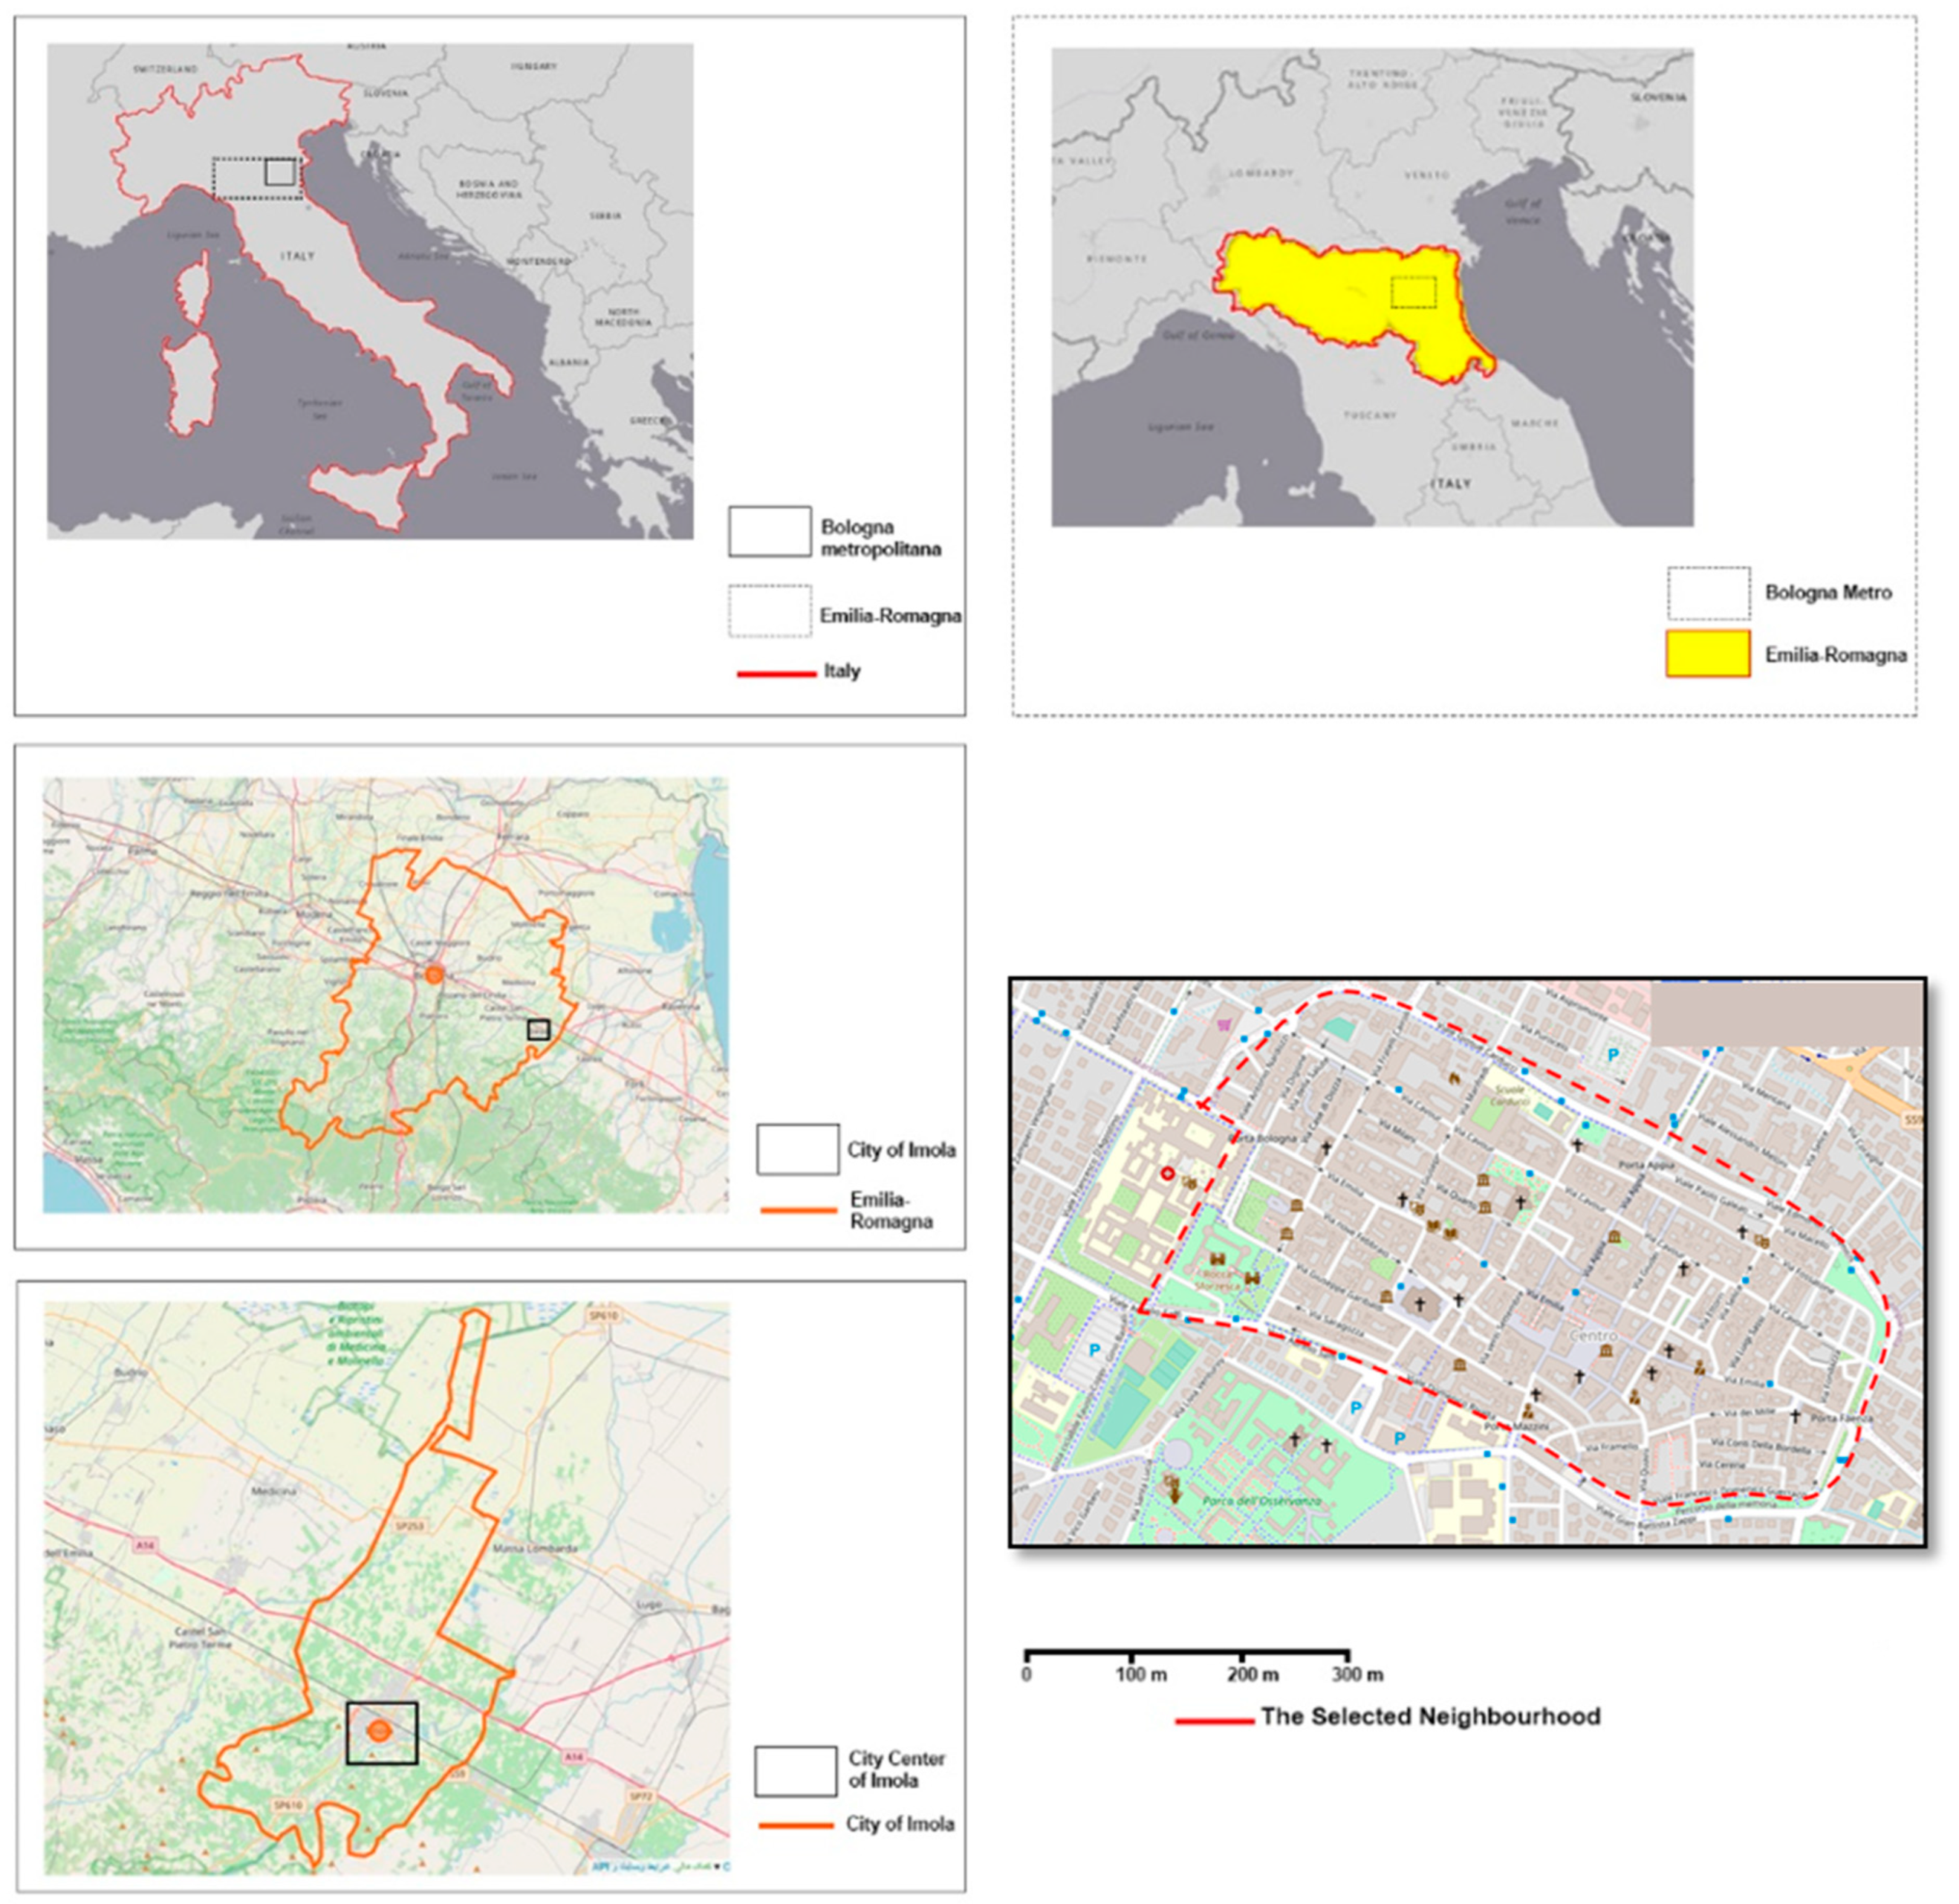
3.6. Study Site
Imola is a historical city with a 204 km
2 area and a population of about 70,000, located in the metropolitan region of Bologna, Italy (
Figure 4). It has a humid subtropical climate with mid-latitudes, with frigid winters and hot, muggy summers. Winters are chilly and somewhat overcast, whereas summers are pleasant and almost clear. The average annual range of the air temperature is between −0.5 °C and 31.11 °C, seldom falling below −5 °C or rising beyond 35.5 °C. Maximum temperatures in July typically range from 30 to C. With a low temperature of −1 °C on average, January is the coldest month. With 95 mm of precipitation, November is the wettest month. August is the sunniest month, with about 11 h of sunlight. With only 43 mm of precipitation, July is the driest month. The selected neighbourhood in Imola is the historical core of the city with scarce street tree canopy cover and low-rise building structures.
4. Model Validation
The results are validated by in-situ measurements based on hourly mean radiation transects on 7 and 8 June 2018, from 8:30 to 20:30, and on 3 and 8 July 2019, at 12:30 (peak solar radiation), 15:30 (peak Tair), and 20:30 (peak solar radiation), (after sunset). The validation days were typical summer days with a clear sky, light breeze (0.7 ms−1 on average), and relative humidity (11.1% on average), peak Tair of 39.0 to 40.9 °C, and peak MRT of 64.8 to 69.4 °C. With an overall RMSE of 5.37 °C and an index of agreement of 0.96, the model performed well. The model’s low systematic RMSE of 0.6 °C and high unsystematic RMSE of 4.6 °C show that model parameters are suitable and that most of the error is accidental. As a whole, our model tends to overestimate MRT with a mean bias error (MBE) of 3.5 °C. 4.5 °C is the MAE, or Mean Absolute Error. In comparison with the majority of other models, our model performs best for open locations with an RMSE of 5.1 °C.
5. Results
A typical summer day, the 25th of June, is selected for the simulation. The weather data according to the weather input data in the method section was generated for Imola. The simulation was run on a PC with a 3.19 GHz CPU and 32 GB of RAM. Each run of sun path charts to estimate the effects of shading took 3–4 h and each hour of PET simulation is run for less than 2 min. It is worth noting that the sun path runs for every site were run only once and later on the generated chart was used for hourly PET simulation that made possible the real-time running of the 3-dimensional city digital twin. The output of thermal comfort indices for 7 a.m., 12 p.m., and 5 p.m. was extracted for the analysis of the city microclimate since these have the most pedestrian flow in the city center part of Imola. The high level of pedestrian flow inside the city center makes it the most crucial hours for thermal comfort. The results on the pedestrian level are visualized in the Rhino platform.
Figure 5 shows the spatial variation of PET over the study site.
5.1. The Pedestrian Urban Comfort through the Routs Based on PET Values
The PET value is considered based on (4). This model considers a human body of a 35 years old, male and 180 cm tall, 75 kg, and a clothing index of 0.5 in a lightweight activity level. Some preliminary results can be derived from the spatial variation map of PET. The main point is that when the L/W of the street is high, the vegetation coverage of the street does not impact the PET range; however, previous studies have indicated a meaningful correlation between enhancing greenery and PET value based on air temperature [
38].
The maximum reduction of the PET value in engineering shades (building shades) can be up to 4 degrees while under the trees’ shade the maximum cooling effect can be approximately 5–6 therefore trees can afford cooler shade during a typical summer day. However, a tree’s shade depends on whether it is coniferous or deciduous and also on the level of leaf area can have different impacts on T
mrt and PET. The core part of Imola has a scarce vegetation cover but the compact urban context creates a shaded area in most of the pedestrian routes. However, in the sub-centres and open spaces with a lower L/W ratio a considerably higher level of PET is indicated. As
Figure 6 shows, the range of PET over the day 25th of June goes from moderate cold stress to moderate heat stress which means during the peak heat hour of the day pedestrian feels the heat of over 35 degrees on the streets, especially in sub-centres of the historical core of Imola.
5.2. The Pedestrian Routes from Residential Buildings to Urban Public Nodes
This section presents the results of the walkability. The level of connectivity depends on the number of connections every street has and highly dense connectivity in a street means that the street has a higher capacity for enhancing walkability. In the historical core of Imola, the level of connectivity varies from 1 to 5, however, the majority of them are connected to less than 2 other streets. The city core of Imola is structured based on local access and each building block is surrounded by E-W and N-S streets. There are several sub centers defined by historical attractions, and nearly zero number of dead-end streets indicates the potential for creating a green pedestrian network in the historical core.
Figure 7 shows the distribution of tourist attractions and local destinations that will define the form of the GPN in the next design step. The core city of Imola is divided into segments and this can create spatial pedestrian movement and accessible patterns.
These results provide a proof of concept for the application of microclimatic simulations in urban development to illustrate the possible cooling advantages of GPN designs and integrate the adaptation of greening schemes. As it is indicated in earlier studies, there is a strong correlation between greenery, leaf area index (LAI), street orientation and width, building layouts, and local microclimatic conditions. These considerations should also be involved in the GPN design of the central part of the city. As
Figure 8 indicates, overlaying the PET and walkability maps can generate the possible scenario for the site. The connectivity of the urban green area and creating the circulation of the green routes to make the most common local destinations inside the GPN are achieved. The area with the highest level of PET has been targeted in this GPN. Application of this GPN indicates a decrease of approximately 3 degrees in urban open spaces. However, a well-designed GPN needs to address a wide variety of factors, including local businesses, safety criteria, social concerns, and environmental aspects and there is not a single solution to work in any urban context. Planning for a functional GPN depends on the urban context and should not be considered a solid framework.
6. Discussion
In accordance with ISO 7226, our model worked well with an overall RMSE for MRT of little over 5 °C. While, most of the studies have noted higher MRT inconsistencies for the current models, particularly in replicating sites with tree cover. The majority of the models that are suggested in PET have been evaluated by ENVI-met [
39,
40,
41,
42]. These studies have examined the effect of different parameters on thermal comfort and mutually have reached the conclusion that a considerable decrease in mean radiant and air temperatures at the pedestrian level can be obtained, creating improved microclimate conditions, and increasing the plant ratio within the research area adds to noticeably lower PET [
43,
44,
45]. Studies based on ENVI-met simplifies long-wave radiation of building surfaces and CFD modeling. However, due to the recent advancements in the model’s radiation strategy in ENVI-met, which further increases computational complexity but greatly improves accuracy, upcoming ENVI-met investigations may reveal reduced inaccuracies [
46,
47]. There are other studies that have used Rayman [
35,
48,
49,
50] and did not simulate CFD and also the long-wave radiation from building surfaces. Studies based on SOLWEIG [
51] have neglected wind velocity. In most of the thermal comfort studies, the radiative and convective models are employed separately, while in this model both models are calculated in parallel.
In a nutshell, the model accuracy of our 3-dimensional GPN digital twin, which links several Rhinoceros engines, is equivalent to that of other Ladybug tool studies, but it outperforms microscale models like RayMan, ENVI-met, and SOLWEIG, particularly in areas with tree cover. There are some restrictions on our model’s handling of atmospheric variables. First, and this is crucial in open highrise LCZs, reflected shortwave radiation from facades is not taken into account by the MRT calculations. Second, the SolarCal method presently overestimates incoming shortwave radiation because of its simplifications. Last but not least, our methodology overestimates heat in the research domain by excluding evapotranspiration from trees.
To the best knowledge of the authors, this digital twin is the first real-time thermal comfort model that can also consider the walkability of a neighborhood instead of keeping the scale limited to a street. Outdoor thermal comfort and the level of outdoor activity are closely linked and this study fills the gap between these two concepts and gives a mutual understanding about it on a neighborhood scale.
7. Conclusions
Urban population growth has resulted in economic and environmental problems at a global level that negatively affects cities and, as a result, urban planning practices. The reduction of carbon emissions has been the focus of urban planning and architecture more and more in recent years [
52]. One technique to create low-carbon and liveable cities is through the remodeling strategy of reconfiguring urban tree plantings. In this regard, one of the most cutting-edge technological innovations for urban planning is employing digital twins. This paper proposed a 3-dimensional city digital twin for evaluating pedestrian-level thermal comfort in urban spaces. The model explores the potential for walkability in the city center of Imola and the possibility of planning a GPN. The method involves modeling PET and walkability indicators based on accessibility and connectivity criteria. The proposed model in this study highlights the advantages that greenery has for the pedestrian in compact urban contexts.
The suggested GPN digital twin, which comprises a hybrid model that adopts a unique approach to MRT and PET modeling, contributes to the literature of this subject by simplifies difficult ideas and critical procedures for the construction of an urban climate comfort and walkability digital twin. It is a holistic strategy that employs a variety of engines and uses the result of one stage as the data for the following step in an integrated manner to reduce computation error. Second, it makes use of a precise 3D representation of the geometric characteristics of trees and structures, along with DSMs from previous case studies. Additionally, a method for producing real-time meteorological data files for the experiment day is suggested for analyzing surface temperatures to get precise hourly results. Practically, the model can assist policy-makers and decision-makers in developing a greening master plan for street greening to create sustainable and climate-sensitive, and healthy cities.
In the future, our fast and easy-to-use model can assist urban planners and designers determine optimal spaces for tree planting. The cooling potential of added street trees is greater in urban areas with lower L/W ratios such as open spaces in urban contexts. This model also in the future can be used to further determine the optimal type of tree spacing (clustered vs. dispersed), leaf area density, and crown size in various urban contexts.
Author Contributions
Conceptualization, M.G., D.T., P.T. and A.B.; Data curation, M.G. and A.B.; Formal analysis, M.G.; Funding acquisition, D.T., P.T. and A.B.; Investigation, M.G. and D.T.; Methodology, M.G. and D.T.; Project administration, D.T., P.T. and A.B.; Resources, D.T.; Software, M.G.; Supervision, D.T., P.T. and A.B.; Validation, M.G.; Visualization, M.G.; Writing—original draft, M.G.; Writing—review & editing, M.G., D.T., P.T. and A.B. All authors have read and agreed to the published version of the manuscript.
Funding
This research received no external funding.
Acknowledgments
The authors would like to acknowledge the research-oriented vision of the Ph.D. program in Health, safety and green systems of the University of Bologna as a multidisciplinary Ph.D. program supporting sustainable development in the city of Imola. Besides, the authors would like to express their gratitude to the Cassa di Risparmio di Imola Foundation for supporting the research, and to the City of Imola for the kind collaboration. Any opinions, findings, and conclusions or recommendations expressed in this material are those of the authors and do not necessarily reflect the views of the mentioned organizations.
Conflicts of Interest
The authors declare no conflict of interest.
References
- Chen, L.; Ng, E. Outdoor thermal comfort and outdoor activities: A review of research in the past decade. Cities 2012, 29, 118–125. [Google Scholar] [CrossRef]
- Gholami, M.; Barbaresi, A.; Tassinari, P.; Bovo, M.; Torreggiani, D. A Comparison of Energy and Thermal Performance of Rooftop Greenhouses and Green Roofs in Mediterranean Climate: A Hygrothermal Assessment in WUFI. Energies 2020, 13, 2030. [Google Scholar] [CrossRef]
- Chen, L.; Ng, E. Simulation of the effect of downtown greenery on thermal comfort in subtropical climate using PET index: A case study in Hong Kong. Archit. Sci. Rev. 2014, 56, 297–305. [Google Scholar] [CrossRef]
- Höppe, P. The physiological equivalent temperature—A universal index for the biometeorological assessment of the thermal environment. Int. J. Biometeorol. 1999, 43, 71–75. [Google Scholar] [CrossRef] [PubMed]
- Potchter, O.; Cohen, P.; Lin, T.P.; Matzarakis, A. Outdoor human thermal perception in various climates: A comprehensive review of approaches, methods and quantification. Sci. Total Environ. 2018, 631–632, 390–406. [Google Scholar] [CrossRef]
- Matzarakis, A.; Rutz, F.; Mayer, H. Modelling radiation fluxes in simple and complex environments—Application of the RayMan model. Int. J. Biometeorol. 2007, 51, 323–334. [Google Scholar] [CrossRef]
- Gulyás, Á.; Unger, J.; Matzarakis, A. Assessment of the microclimatic and human comfort conditions in a complex urban environment: Modelling and measurements. Build. Environ. 2006, 41, 1713–1722. [Google Scholar] [CrossRef]
- Johansson, E.; Thorsson, S.; Emmanuel, R.; Krüger, E. Instruments and methods in outdoor thermal comfort studies—The need for standardization. Urban Clim. 2014, 10, 346–366. [Google Scholar] [CrossRef]
- Lai, D.; Guo, D.; Hou, Y.; Lin, C.; Chen, Q. Studies of outdoor thermal comfort in northern China. Build. Environ. 2014, 77, 110–118. [Google Scholar] [CrossRef]
- Elnabawi, M.H.; Hamza, N.; Dudek, S. Thermal perception of outdoor urban spaces in the hot arid region of Cairo, Egypt. Sustain. Cities Soc. 2016, 22, 136–145. [Google Scholar] [CrossRef]
- Coutts, A.M.; White, E.C.; Tapper, N.J.; Beringer, J.; Livesley, S.J. Temperature and human thermal comfort effects of street trees across three contrasting street canyon environments. Theor. Appl. Climatol. 2016, 124, 55–68. [Google Scholar] [CrossRef]
- Shashua-Bar, L.; Pearlmutter, D.; Erell, E. The cooling efficiency of urban landscape strategies in a hot dry climate. Landsc. Urban Plan. 2009, 92, 179–186. [Google Scholar] [CrossRef]
- Armson, D.; Stringer, P.; Ennos, A.R. The effect of tree shade and grass on surface and globe temperatures in an urban area. Urban For. Urban Green. 2012, 11, 245–255. [Google Scholar] [CrossRef]
- Manickathan, L.; Defraeye, T.; Allegrini, J.; Derome, D.; Carmeliet, J. Parametric study of the influence of environmental factors and tree properties on the transpirative cooling effect of trees. Agric. For. Meteorol. 2018, 248, 259–274. [Google Scholar] [CrossRef]
- Gholami, M.; Mofidi Shemirani, M.; Fayaz, R. A modelling methodology for a solar energy-efficient neighbourhood. Smart Sustain. Built Environ. 2018, 7, 117–132. [Google Scholar] [CrossRef]
- Bolund, P.; Hunhammar, S. Ecosystem services in urban areas. Ecol. Econ. 1999, 29, 293–301. [Google Scholar] [CrossRef]
- Thom, J.K.; Coutts, A.M.; Broadbent, A.M.; Tapper, N.J. The influence of increasing tree cover on mean radiant temperature across a mixed development suburb in Adelaide, Australia. Urban For. Urban Green. 2016, 20, 233–242. [Google Scholar] [CrossRef]
- Krayenhoff, E.S.; Jiang, T.; Christen, A.; Martilli, A.; Oke, T.R.; Bailey, B.N.; Nazarian, N.; Voogt, J.A.; Giometto, M.G.; Stastny, A.; et al. A multi-layer urban canopy meteorological model with trees (BEP-Tree): Street tree impacts on pedestrian-level climate. Urban Clim. 2020, 32, 100590. [Google Scholar] [CrossRef]
- Mussetti, G.; Brunner, D.; Henne, S.; Allegrini, J.; Scott Krayenhoff, E.; Schubert, S.; Carmeliet, J. COSMO-BEP-Tree v1.0: A coupled urban climate model with explicit representation of street trees. Geosci. Model Dev. 2020, 13, 1685–1710. [Google Scholar] [CrossRef]
- De Munck, C.; Lemonsu, A.; Masson, V.; Le Bras, J.; Bonhomme, M. Evaluating the impacts of greening scenarios on thermal comfort and energy and water consumptions for adapting Paris city to climate change. Urban Clim. 2018, 23, 260–286. [Google Scholar] [CrossRef]
- Krayenhoff, E.S.; Christen, A.; Martilli, A.; Oke, T.R. A Multi-layer Radiation Model for Urban Neighbourhoods with Trees. Bound.-Layer Meteorol. 2014, 151, 139–178. [Google Scholar] [CrossRef]
- Rossi, A. The Architecture of the City; Oppositions Books; Mit Press: Cambridge, MA, USA, 1984. [Google Scholar]
- Gholami, M.; Barbaresi, A.; Torreggiani, D.; Tassinari, P. Upscaling of spatial energy planning, phases, methods, and techniques: A systematic review through meta-analysis. Renew. Sustain. Energy Rev. 2020, 132, 110036. [Google Scholar] [CrossRef]
- Austin, M.; Delgoshaei, P.; Coelho, M.; Heidarinejad, M. Architecting Smart City Digital Twins: Combined Semantic Model and Machine Learning Approach. J. Manag. Eng. 2020, 36, 4020026. [Google Scholar] [CrossRef]
- Qi, Q.; Tao, F. Digital Twin and Big Data Towards Smart Manufacturing and Industry 4.0: 360 Degree Comparison. IEEE Access 2018, 6, 3585–3593. [Google Scholar] [CrossRef]
- Cioara, T.; Anghel, I.; Antal, M.; Salomie, I.; Antal, C.; Ioan, A.G. An Overview of Digital Twins Application Domains in Smart Energy Grid. arXiv 2021, arXiv:2104.07904. [Google Scholar]
- Coelho, M.; Austin, M.; Blackburn, M. Semantic Behavior Modeling and Event-Driven Reasoning for Urban System of Systems. Int. J. Adv. Intell. Syst. 2017, 10, 365–382. [Google Scholar]
- Lynch, K. The Image of the City, 11th ed.; Harvard-MIT Joint Center for Urban Studies: Cambridge, MA, USA, 1960. [Google Scholar]
- Roberts, P.; Sykes, H.; Granger, R. Urban Regeneration; Sage Publications Ltd.: Thousand Oaks, CA, USA, 2017. [Google Scholar] [CrossRef]
- Gottdiener, M.; Hohle, R.; King, C.R. The New Urban Sociology; Routledge: London, UK, 2019. [Google Scholar]
- Artmann, M.; Bastian, O.; Grunewald, K. Using the Concepts of Green Infrastructure and Ecosystem Services to Specify Leitbilder for Compact and Green Cities—The Example of the Landscape Plan of Dresden (Germany). Sustainability 2017, 9, 198. [Google Scholar] [CrossRef]
- Franke, J.; Hellsten, A.; Schlünzen, H.; Carissimo, B. Best Practice Guideline for the Cfd Simulation of Flows in the Urban Environment: Cost 732: Quality Assurance and Improvement of Microscale Meteorological Models; Meteorological Inst.: Berlin, Germany, 2007. [Google Scholar]
- Mackey, C.; Galanos, T.; Norford, L.; Roudsari, M.S.; Bhd, N.S. Wind, sun, surface temperature, and heat island: Critical variables for high-resolution outdoor thermal comfort. In Proceedings of the 15th IBPSA Conference, San Francisco, CA, USA, 7–9 August 2017; pp. 985–993. [Google Scholar]
- Robertson, F.; Samy, M. Factors Affecting the Diffusion of Integrated Reporting—A UK FTSE 100 perspective. Sustain. Account. Manag. Policy J. 2015, 6, 190–223. [Google Scholar] [CrossRef]
- Matzarakis, A.; Rutz, F.; Mayer, H. Modelling radiation fluxes in simple and complex environments: Basics of the RayMan model. Int. J. Biometeorol. 2009, 54, 131–139. [Google Scholar] [CrossRef]
- Rosi, M.; Strmšek, L.; Dragan, D.; Rosi, B. Walkable neighbourhoods in smart cities. In Proceedings of the 21st International Scientific Conference Business Logistics in Modern Management, Osijek, Croatia, 7–8 October 2021. [Google Scholar]
- Moudon, A.V.; Lee, C.; Cheadle, A.D.; Garvin, C.; Johnson, D.; Schmid, T.L.; Weathers, R.D.; Lin, L. Operational Definitions of Walkable Neighborhood: Theoretical and Empirical Insights. J. Phys. Act. Health 2006, 3, S99–S117. [Google Scholar] [CrossRef]
- Hua, J.; Cai, M.; Shi, Y.; Ren, C.; Xie, J.; Chung, L.C.H.; Webster, C. Investigating pedestrian-level greenery in urban forms in a high-density city for urban planning. Sustain. Cities Soc. 2022, 80, 103755. [Google Scholar] [CrossRef]
- Ma, X.; Leung, T.M.; Chau, C.K.; Yung, E.H.K. Analyzing the influence of urban morphological features on pedestrian thermal comfort. Urban Clim. 2022, 44, 101192. [Google Scholar] [CrossRef]
- Weng, J.; Luo, B.; Xiang, H.; Gao, B. Effects of Bottom-Overhead Design Variables on Pedestrian-Level Thermal Comfort during Summertime in Different High-Rise Residential Buildings: A Case Study in Chongqing, China. Buildings 2022, 12, 265. [Google Scholar] [CrossRef]
- Eslamirad, N.; De Luca, F.; Lylykangas, K.S. The role of building morphology on pedestrian level comfort in Northern climate. J. Phys. Conf. Ser. 2021, 2042, 12053. [Google Scholar] [CrossRef]
- Hamizan Hazeman, M.; Hashim, N.; Mohammad Salim, P. Climate change and built environment—the role of urban greenery as a mitigation strategy in Greek urban areas. IOP Conf. Ser. Earth Environ. Sci. 2021, 899, 12018. [Google Scholar] [CrossRef]
- Mohammad, P.; Aghlmand, S.; Fadaei, A.; Gachkar, S.; Gachkar, D.; Karimi, A. Evaluating the role of the albedo of material and vegetation scenarios along the urban street canyon for improving pedestrian thermal comfort outdoors. Urban Clim. 2021, 40, 100993. [Google Scholar] [CrossRef]
- Hess, J.; Meister, A.; Melnikov, V.; Axhausen, K.W. A GIS-Based Model of Outdoor Thermal Comfort: Case Study for Zurich; Working Paper n.d.; IVT, ETH Zurich: Zurich, Switzerland, 2021. [Google Scholar] [CrossRef]
- Segura, R.; Krayenhoff, E.S.; Martilli, A.; Badia, A.; Estruch, C.; Ventura, S. Observational and numerical evaluation of the pedestrian-level microclimatic effect of street trees in a highly-compact city. In Proceedings of the 24th EGU General Assembly, Vienna, Austria, 23–27 May 2022. [Google Scholar]
- Ouyang, W.; Liu, Z.; Lau, K.; Shi, Y.; Ng, E. Comparing different recalibrated methods for estimating mean radiant temperature in outdoor environment. Build. Environ. 2022, 216, 109004. [Google Scholar] [CrossRef]
- Simon, H.; Sinsel, T.; Bruse, M.; Isabel, M.; Galdo, L.; Naji, H. Advances in Simulating Radiative Transfer in Complex Environments. Appl. Sci. 2021, 11, 5449. [Google Scholar] [CrossRef]
- Naboni, E.; Meloni, M.; Coccolo, S.; Kaempf, J.; Scartezzini, J.L. An overview of simulation tools for predicting the mean radiant temperature in an outdoor space. Energy Procedia 2017, 122, 1111–1116. [Google Scholar] [CrossRef]
- Taleghani, M. The impact of increasing urban surface albedo on outdoor summer thermal comfort within a university campus. Urban Clim. 2018, 24, 175–184. [Google Scholar] [CrossRef]
- Galindo, T.; Hermida, M.A. Effects of thermophysiological and non-thermal factors on outdoor thermal perceptions: The Tomebamba Riverbanks case. Build. Environ. 2018, 138, 235–249. [Google Scholar] [CrossRef]
- Lindberg, F.; Holmer, B.; Thorsson, S. SOLWEIG 1.0—Modelling spatial variations of 3D radiant fluxes and mean radiant temperature in complex urban settings. Int. J. Biometeorol. 2008, 52, 697–713. [Google Scholar] [CrossRef]
- Gholami, M.; Torreggiani, D.; Tassinari, P.; Barbaresi, A. Narrowing uncertainties in forecasting urban building energy demand through an optimal archetyping method. Renew. Sustain. Energy Rev. 2021, 148, 111312. [Google Scholar] [CrossRef]
| Publisher’s Note: MDPI stays neutral with regard to jurisdictional claims in published maps and institutional affiliations. |
© 2022 by the authors. Licensee MDPI, Basel, Switzerland. This article is an open access article distributed under the terms and conditions of the Creative Commons Attribution (CC BY) license (https://creativecommons.org/licenses/by/4.0/).


