Article

Soil Quality Assessment in a Landslide Chronosequence of Indian Himalayan Region

1
University School of Environment Management, Guru Gobind Singh Indraprastha University, New Delhi 110078, India
2
Institute of Environment and Development Studies, Bundelkhand University, Jhansi 284128, India
3
Geobiotec Research Centre, Department of Geoscience, University of Aveiro, 3810-193 Aveiro, Portugal
*
Author to whom correspondence should be addressed.
Land 2022, 11(10), 1819; https://doi.org/10.3390/land11101819
Submission received: 23 August 2022 / Revised: 6 October 2022 / Accepted: 13 October 2022 / Published: 17 October 2022
(This article belongs to the Special Issue Geochemical Mapping in Land Managing)

Abstract

:
Landslides cause ecosystem degradation; they can significantly alter and deteriorate the soil quality. The analysis of deterioration in soil quality is critical as it provides baseline evidence for subsequent revegetation and management of forest. The effects of landslides on the natural environment (losses of soil resources), on the other hand, have received little consideration. Such information about the status of loss of soil resources in the landslide–disturbed areas of the Garhwal Himalayas is lacking. Therefore, the objective of the study is to assess the changes in soil quality restoration after the occurrence of landslides. A chronosequence of four landslide disturbed sites, L6–6–year–old, L16–16–year–old, L21–21–year–old and L26–26–year–old, was selected in the Alaknanda watershed of Uttarakhand. Seventy–six samples have been collected from the four landslide sites and a reference site (undisturbed site). The sites L6 and L16 are considered as recent landslide sites, whereas L21 and L26 are considered as old landslide sites. Entisols (Lithic–Udorthents) predominate in all the studied sites. The results have demonstrated that with the increasing age of landslides, the soil quality progressively improves with time, and the concentration of soil nutrients, viz., available phosphorus (AP), available potassium (AK) and mineralisable nitrogen (MN), in old landslide sites reaches to about 84%, 87% and 97%, respectively, of the reference site. Soil Quality Index (SQI) scores have been calculated using the Integrated Quality Index (IQI) equation. The disturbed sites L6, L16, L21 and L26 and the reference site have SQI scores of 0.136, 0.279, 0.447, 0.604 and 0.882, respectively. However, significant differences exist between the SQI of all the studied sites (p < 0.05, Tukey’s HSD), which implies that the concentration of soil organic carbon (SOC) and available nutrients was reduced due to the occurrence of landslides. The results also suggested that SOC, AP and clay fraction can be considered important evaluation indicators to assess soil quality and development.

1. Introduction

Landslides are one of the destructive geological processes that occur throughout the world, and they are especially more frequent in certain areas [1]. The entire Indian Himalayan Region (IHR) is one such area due to the intense monsoon precipitation, frequent tectonic activity, weak geologic condition and very steep and rugged topography [2,3,4,5,6]. Landslides are responsible for huge economic and social losses endangering the people living in the mountains in terms of human life, livelihood, infrastructure and natural resources [7,8,9]. In the Garhwal Himalayas of Uttarakhand state in the IHR, landslides occur frequently because the area is traversed by many faults such as Main Central Thrust (MCT), Main Boundary Thrust (MBT) and Tethyan Thrust, which are tectonically active zones [10,11,12].
Landslides can have long–term impacts on the ecosystem and environment [13]. They can have profound effects on biodiversity and significantly alter soil quality [7,14,15]. Landslides alter soil properties primarily by exposing parent material (C horizon) by removing the upper fertile organic layer (O, A, and B horizons) which is carried downslope. Variations in soil characteristics may include degradation of its structure [16], loss of nutrients and fertility, loss of organic matter, compaction and erosion of soil particles [17]. Soil compaction can be caused by soil homogenisation, removal of forest cover and, fragmentation of forest floor, which is due to an enormous pressure exerted by gravity on the abrupt downward movement of the land [18]. Several authors reported that the concentrations of available nitrogen (AN) [19], available phosphorus (AP) [7], soil organic carbon (SOC) [20,21] and exchangeable cations such as Ca2+, Mg2+ and K+ [22], decreased in landslide–affected sites, resulting in the deterioration of soil quality.
The analysis of specific locations with the passage of time is considered to be the most effective method for an assessment of changes in soil quality [19,23]. However, after any natural or anthropogenic disturbances, the restoration and recovery processes are too slow on a human timescale and may require hundreds of years to achieve equilibrium [24,25,26]. This difficulty in the assessment of soil quality with time has prompted an alternative approach that is less time–consuming and more feasible, i.e., the establishment of chronosequences (discussed in detail in the methodology section). Chronosequences can be helpful for studying the short–term temporal variations [27] in soil properties over a time period of ca. 1–100 years [28].
The idea of soil quality (SQ) incorporates the appraisal of soil properties as they relate to soils’ capacity to perform ecosystem services efficiently as a part of a sustainable natural environment. Broadly, soil quality is defined as “the ability of a particular type of soil to function within natural or managed ecosystems, to preserve biological productivity, to enhance or preserve the environmental (air and water) quality, and to promote human health and habitat” [29,30,31].
According to [32], soil nutrients and other physicochemical characteristics are effective indicators for soil quality assessment. Currently, there is no widely accepted specific standard or criteria for evaluation of soil quality [33,34]. However, in view of the variability and complexity of soil properties, many evaluation methods have been developed so far, such as soil quality models [35], soil quality index (SQI) methods [29,30,36,37,38], soil health cards and testing kit [39], the fuzzy association rules [40], and the soil multifunctionality index [41]. Among these methodologies, the soil quality index (SQI) is generally incorporated for the assessment of soil quality [36] because of its simplicity and it can be used flexibly to quantify the changes in different types of soil.
The effects of landslides on the natural environment have received little consideration in the last two decades in India because most authors have focused their attention on socio–economic impacts and livelihood status. The aspect of environment has been overlooked by researchers for years. Even the status of soil quality loss in the landslide–disturbed areas of the Garhwal Himalayas has not been reported so far. Therefore, the present study aimed at (1) evaluating the soil quality in a chronosequence of landslide disturbed sites, (2) determining the soil characteristics that may limit the recovery of soil with time, (3) assessing the damage to the soil quality caused by landslides, and (4) recovery status of soil after the landslide occurrence.

2. Materials and Methods
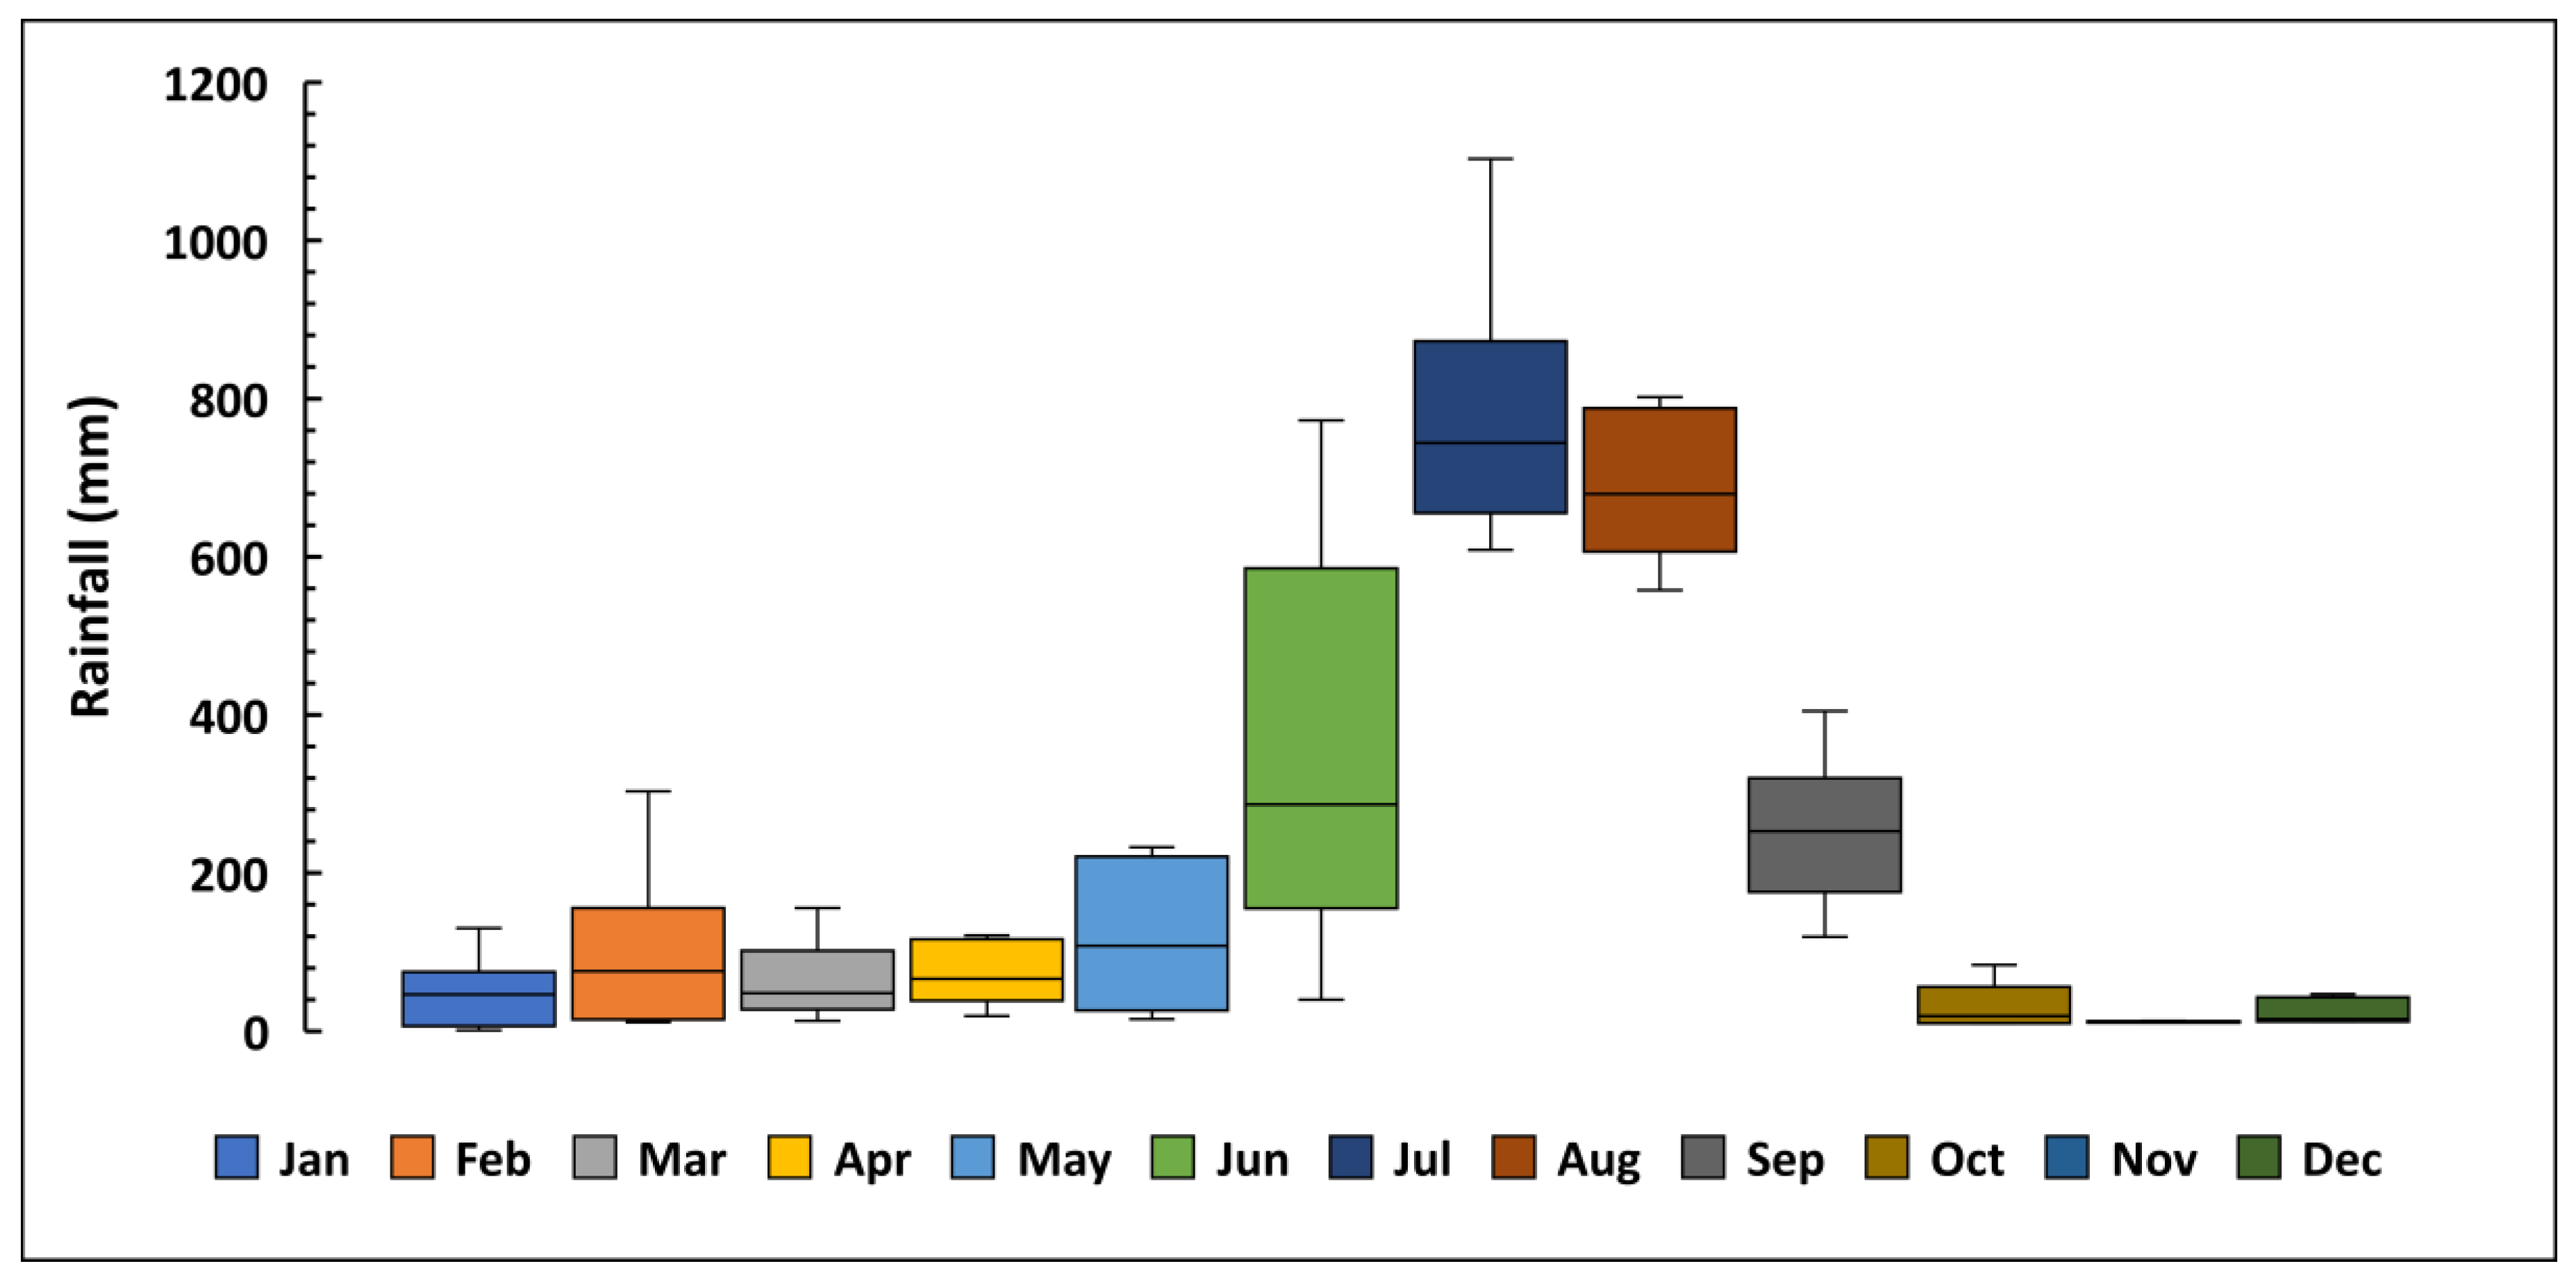
2.1. Study Area

The area selected for the present study is the Alaknanda watershed (latitude 30° to 31° N and longitude 78°30′ to 80° E) of the Garhwal Himalayas (Figure 1). The area lies in seismic Zone—IV and V and receives heavy precipitation during the monsoon season [42]. The area is highly prone to landslide activities. Geographically, this area lies in the Lesser and Higher Himalayas, which is a highly dissected terrain and a seismically active zone [43]. The area is traversed by many faults, including the Main Central Thrust (MCT), Main Boundary Thrust (MBT) and Tethyan Thrust, which is a tectonically active zone [10,11,44]. The sites considered for this study lie in the two districts of Uttarakhand, viz. Rudraprayag and Chamoli in the Alaknanda watershed. In the entire watershed area, the southwest monsoon prevails, which comes in late June and continues till the end of September [11]. The average annual precipitation of the study area is 1747.2 mm (IMD, 2018) (Figure 2).

2.2. Chronosequence of Landslides- Site Selection

There are two techniques for soil quality assessment at recovering landslide sites (the sites that naturally try to regain their original position after disturbance)- (a) perspective technique, and (b) retrospective technique. The ‘perspective technique’ involves the analysis of changes in soil characteristics of the degraded/landslide–affected sites with time. Soil formation is a prolonged process and hence this technique becomes a long–lasting method. It is also considered that the selected site in this technique becomes susceptible to future landslide events and other disturbances. However, the ’retrospective technique’ involves various past landslide sites of different ages. The age of the landslide is described as the difference between the time (year) of triggering of the landslide and the time of sample collection. Contrary to the perspective technique, in the retrospective technique it is considered that the landslide will not trigger again on the selected sites before the sample collection. Upon comparing both methods, the latter was found to be less time–consuming and more feasible. Moreover, one–time sampling of the chronosequence of landslides is considered as reliable as the resampling done on the particular site with time. Hence, the retrospective method has been applied in the present study.
In the study area, 22 landslide sites were identified based on the field survey, available literature and information from local people. Among these sites, four landslide sites were selected varying in age from 6 to 26 years after the occurrence of landslide (Table 1 and Figure 3). Based on the age, sites L6 and L16 are considered as the young or recent landslide sites, whereas sites L21 and L26 are considered as the old landslide sites. In addition, a reference site was also selected adjacent to the youngest landslide site, where no landslide disturbance or any other type disturbance has occurred in the past.

2.3. Site Characteristics

The soils of the selected disturbed sites and the reference site are Lithic Udorthents belonging to the order–Entisols and suborder–Orthents (soil map of Uttar Pradesh published by NBSS&LUP–ICAR, 1999) (Figure 4). The young sites L6 and L16 are dominated by Ageratina adenophora, an early coloniser which is a perennial shrub native to central Mexico and considered as an invasive species in India. Site L21 is dominated by the large shrub Colebrookea oppositifolia. Site L26 is dominated by the tree species Quercus leucotrichophora along with the shrub species Debregeasia salicifolia and Rumex hastatus. The undisturbed site is dominated by Quercus leucotrichophora with Betula alnoides and Rhododendron arboretum as the main associates. The reference site also includes shrubs (e.g., Debregeasia salicifolia, Reinwardtia indica) and herbs (e.g., Pilea racemosa, Scutellaria scandens).

2.4. Soil Sampling and Analysis

The composite soil samples were collected from each sampling site at a regular grid/interval of 5 m at two depths: 0–15 cm and 15–30 cm. A total of 76 soil samples were collected during the post–monsoon season (October 2019). At sites L6 and L21, eighteen soil samples, at site L16 sixteen samples, and twelve samples each have been collected from both site L26 and the reference site.
The collected soil samples were air dried, ground and passed through a 2 mm sieve for analysis of various physical characteristics. The following physical parameters were analyzed- bulk density (BD), particle density (PD), total porosity (TP), moisture content (MC), sand (0.02–2.0 mm), silt (0.002–0.02 mm) and clay (<0.002 mm). The air–dried and ground samples were passed through a 0.2 mm sieve for further chemical analysis. The parameters included are electrical conductivity (EC), soil organic carbon (SOC), available phosphorus (AP), available potassium (AK) and mineralisable nitrogen (MN). The adopted analytical methods for each parameter are listed in Table 2.

2.5. Soil Quality Assessment

To assess the soil quality through the soil quality index (SQI), six steps have been followed- (a) examination of the significant differences in the parameters, (b) selection of significant variables for PCA, (c) selection of indicators as MDS and assigning their weights, (d) correlation analysis to check whether the weighted indicators are redundant or not, (e) linear scoring to score the selected indicators, and (f) calculating SQI according to score and weight of the selected indicators.

2.5.1. Adequacy of the Data

Adequacy and multivariate normality of the parameters are measured by Kaiser–Meyer–Olkin (KMO) and the Bartlett test of sphericity, respectively. A value for the KMO test above 0.8 is considered to be ‘great’ [53,54,55]. In the Bartlett test, a significance value less than 0.05 suggests that the data is normal and can be accepted for further analysis [53,56,57]. In the present study, the data has fulfilled both conditions (Table S1).

2.5.2. Selection of Indicators for Minimum Data Set (MDS)

One–way ANOVA was performed to evaluate differences between the soil characteristics (indicators) and to observe the differences at 0.05 level of significance using Tukey’s HSD post hoc test. The indicators having significant differences (p < 0.05) are considered for the minimum data set (MDS). Those significant indicators were selected for the principal component analysis (PCA) [36,58,59] to minimise the number of independent indicators [58,60].
The PCs explaining ≥ 5% of the variance and having eigenvalues ≥ 1 [36,61,62] were selected. The selected PCs were subjected to the varimax rotation to increase the correlation between the indicators. The ‘highly weighted’ (factor loading value within 10% of the highest weighted indicator) indicators are selected under a particular PC that are retained for the MDS. However, when more than one indicator is retained in a particular PC, multivariate correlation matrix has been used to calculate correlation coefficients between the indicators. The indicators are retained if the value of coefficients is less than 0.7, which indicates that each of the indicators is important within a particular PC [63]. If the indicators are significantly correlated (r > 0.7) in a certain PC, the indicator having the highest correlation sum had been retained in the MDS [58,64].

2.5.3. Weight Assignment

In the present study, the weight of MDS indicators is calculated as the ratio of communality of a particular indicator to the sum of communalities of all the indicators in the minimum data set [58,65].

2.5.4. Scoring of Indicators

Indicators selected in MDS were transformed into a dimensionless value ranging from 0 to 1 by the linear scoring method [58]. Selected indicators are arranged in either ascending or descending order depending on whether the higher observed value is “good” or “bad” in terms of soil ecosystem functions. ‘More is better’ or ‘less is better’ function is applied to the indicators retained in the MDS (where best soil functions are attributed to more or less values, respectively). For ‘more is better’ indicators, each observed value of the indicator was divided by the highest value. For ‘less is better’ indicators, the lowest observed value was divided by each observed value [63,66].

2.5.5. Soil Quality Index (SQI) Calculation

The weight and score of the indicators retained in the MDS are multiplied and then summation has been done to calculate the soil quality index using the Integrated Quality Index (IQI) Equation (1) as per [29]
S Q I = i = 1 n W i *   S i    
where Wi is the weight assigned to the indicator, Si is the score given to each indicator and n is the number of indicators retained in the MDS.

2.6. Statistical Analysis

Mean has been calculated for all indicators of both depths. The data had been transformed using an inverse method for PCA analysis as the data is not normally distributed. One–way analysis of variance (ANOVA, p < 0.05) is used to find an overall significant difference between all the studied sites, and if significant differences have been found, Tukey’s HSD post hoc test (p < 0.05) has been employed to identify the differences between the sites. The relationship strength between variables is determined by using the Pearson’s correlation coefficient. All the computation of statistics had been performed using the SPSS software v. 26 (2019) and Microsoft Excel (2016) for windows.

3. Results

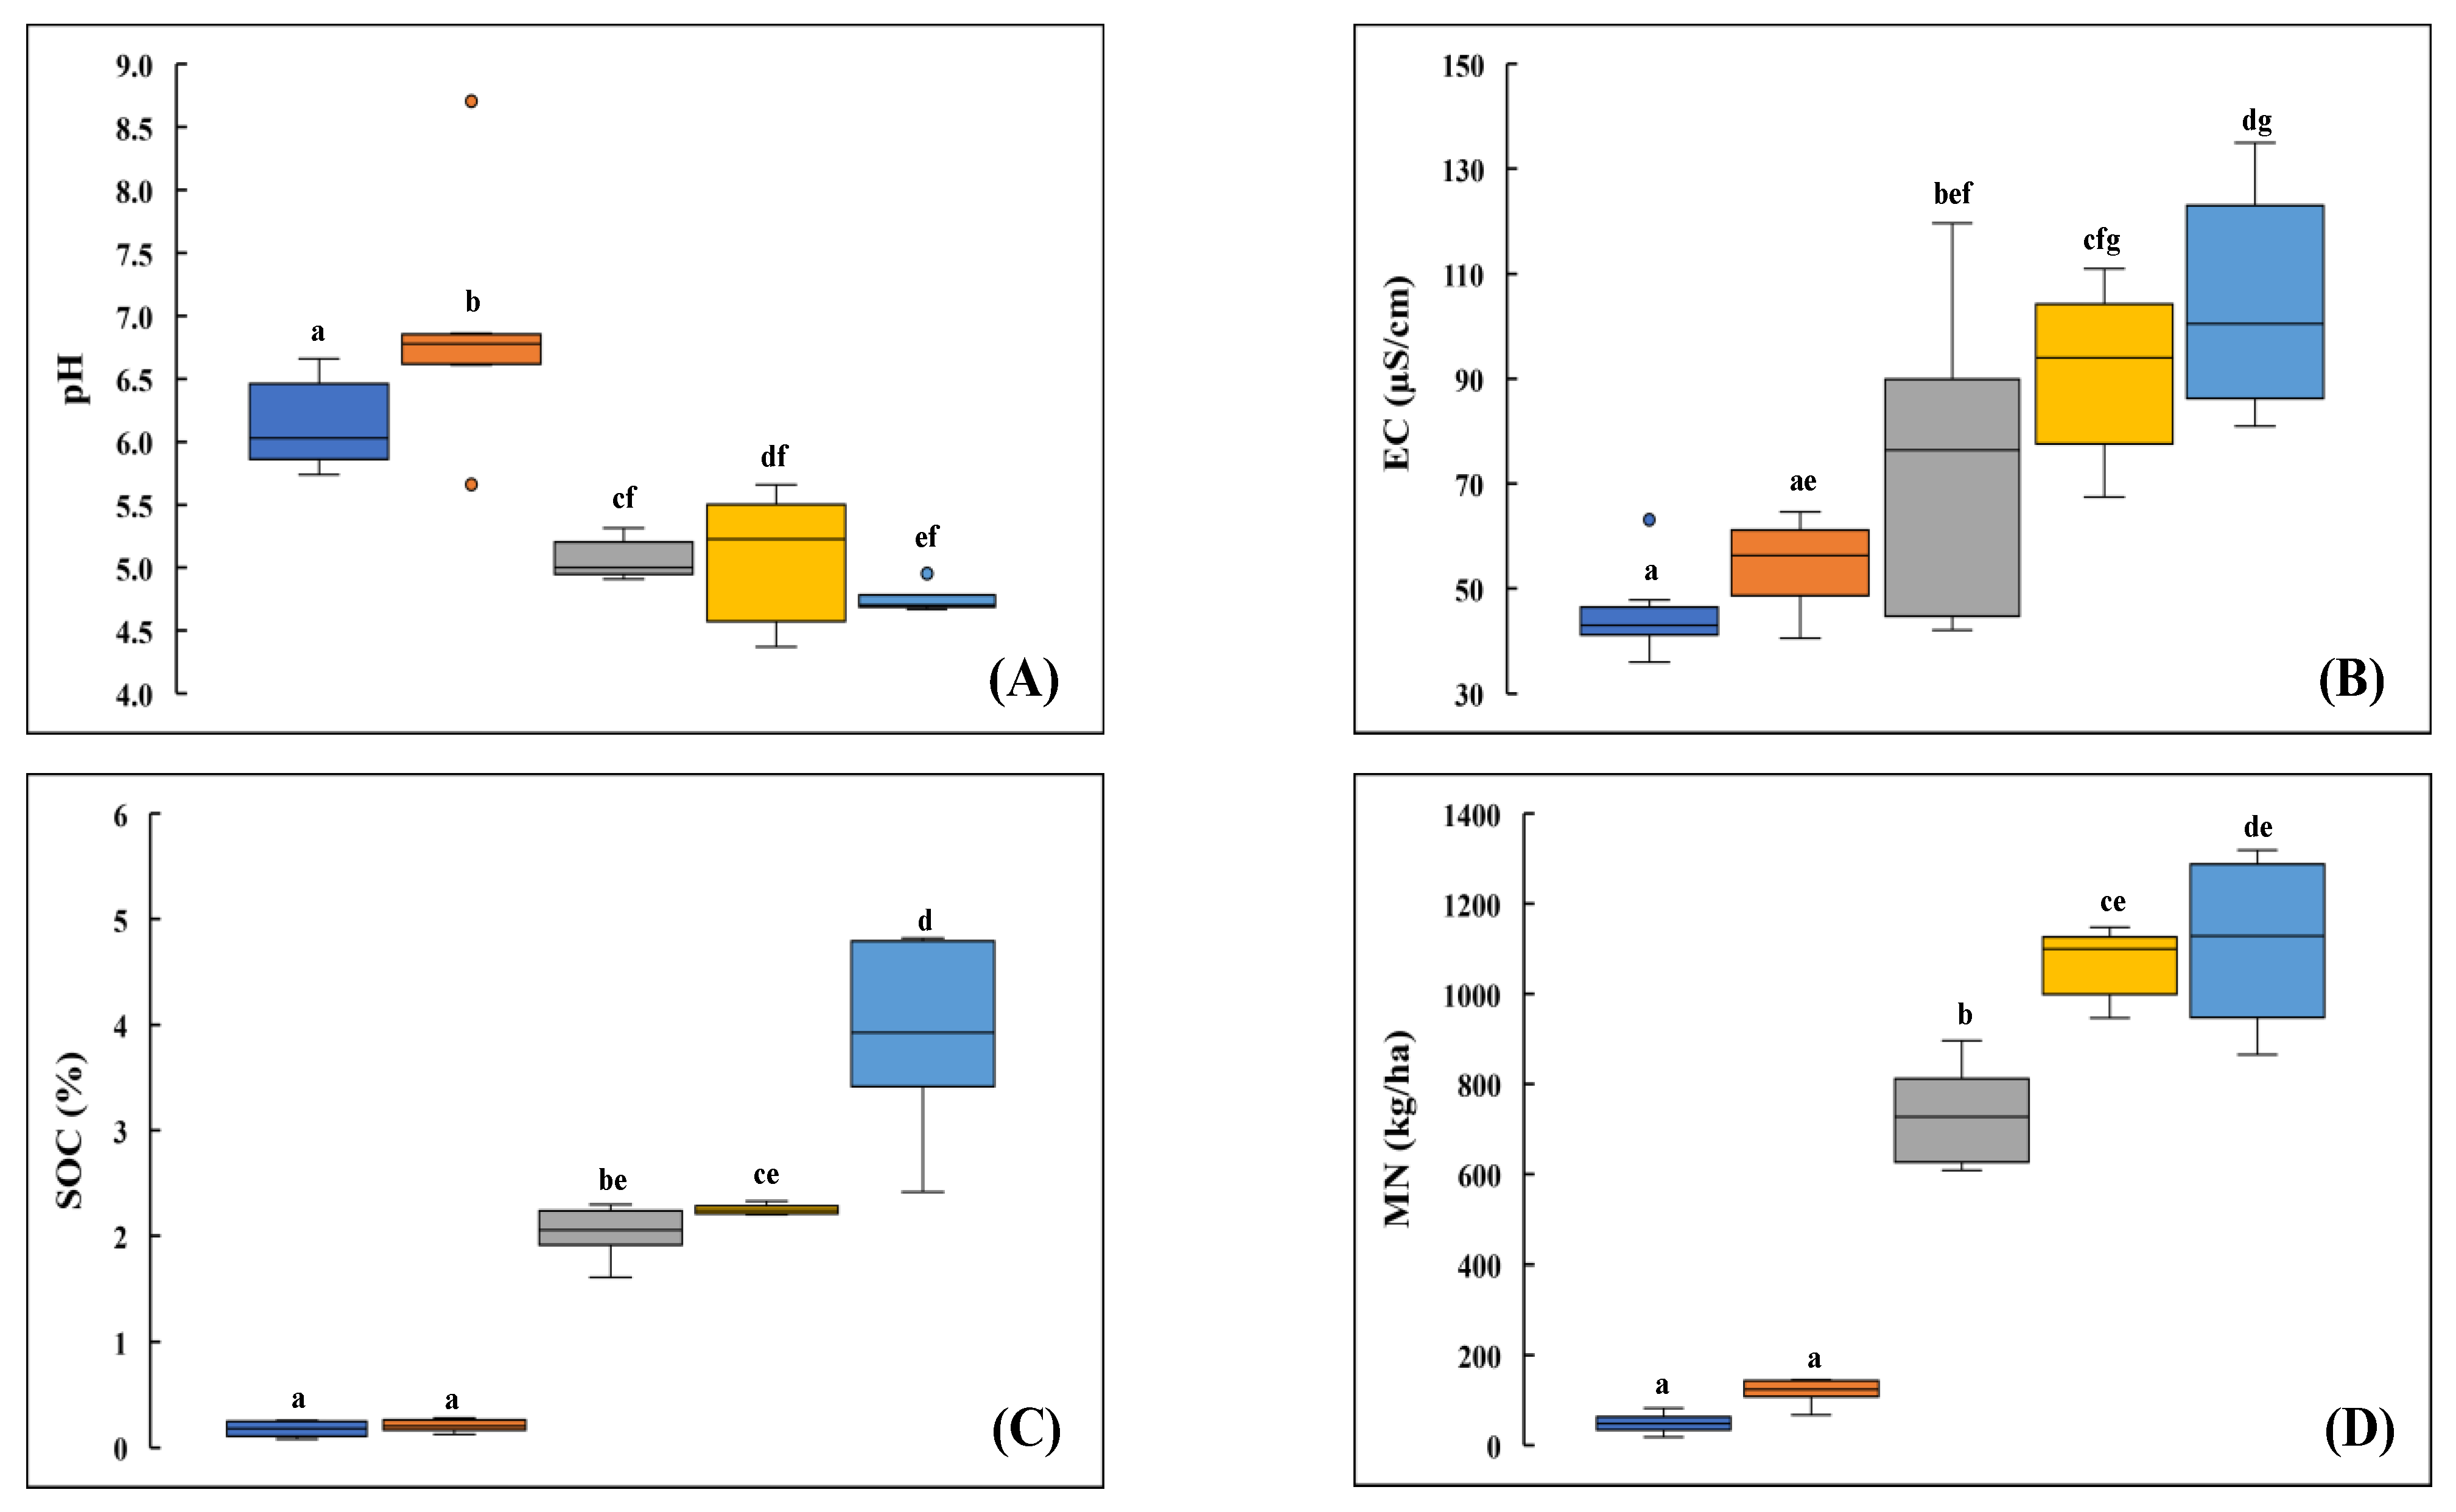
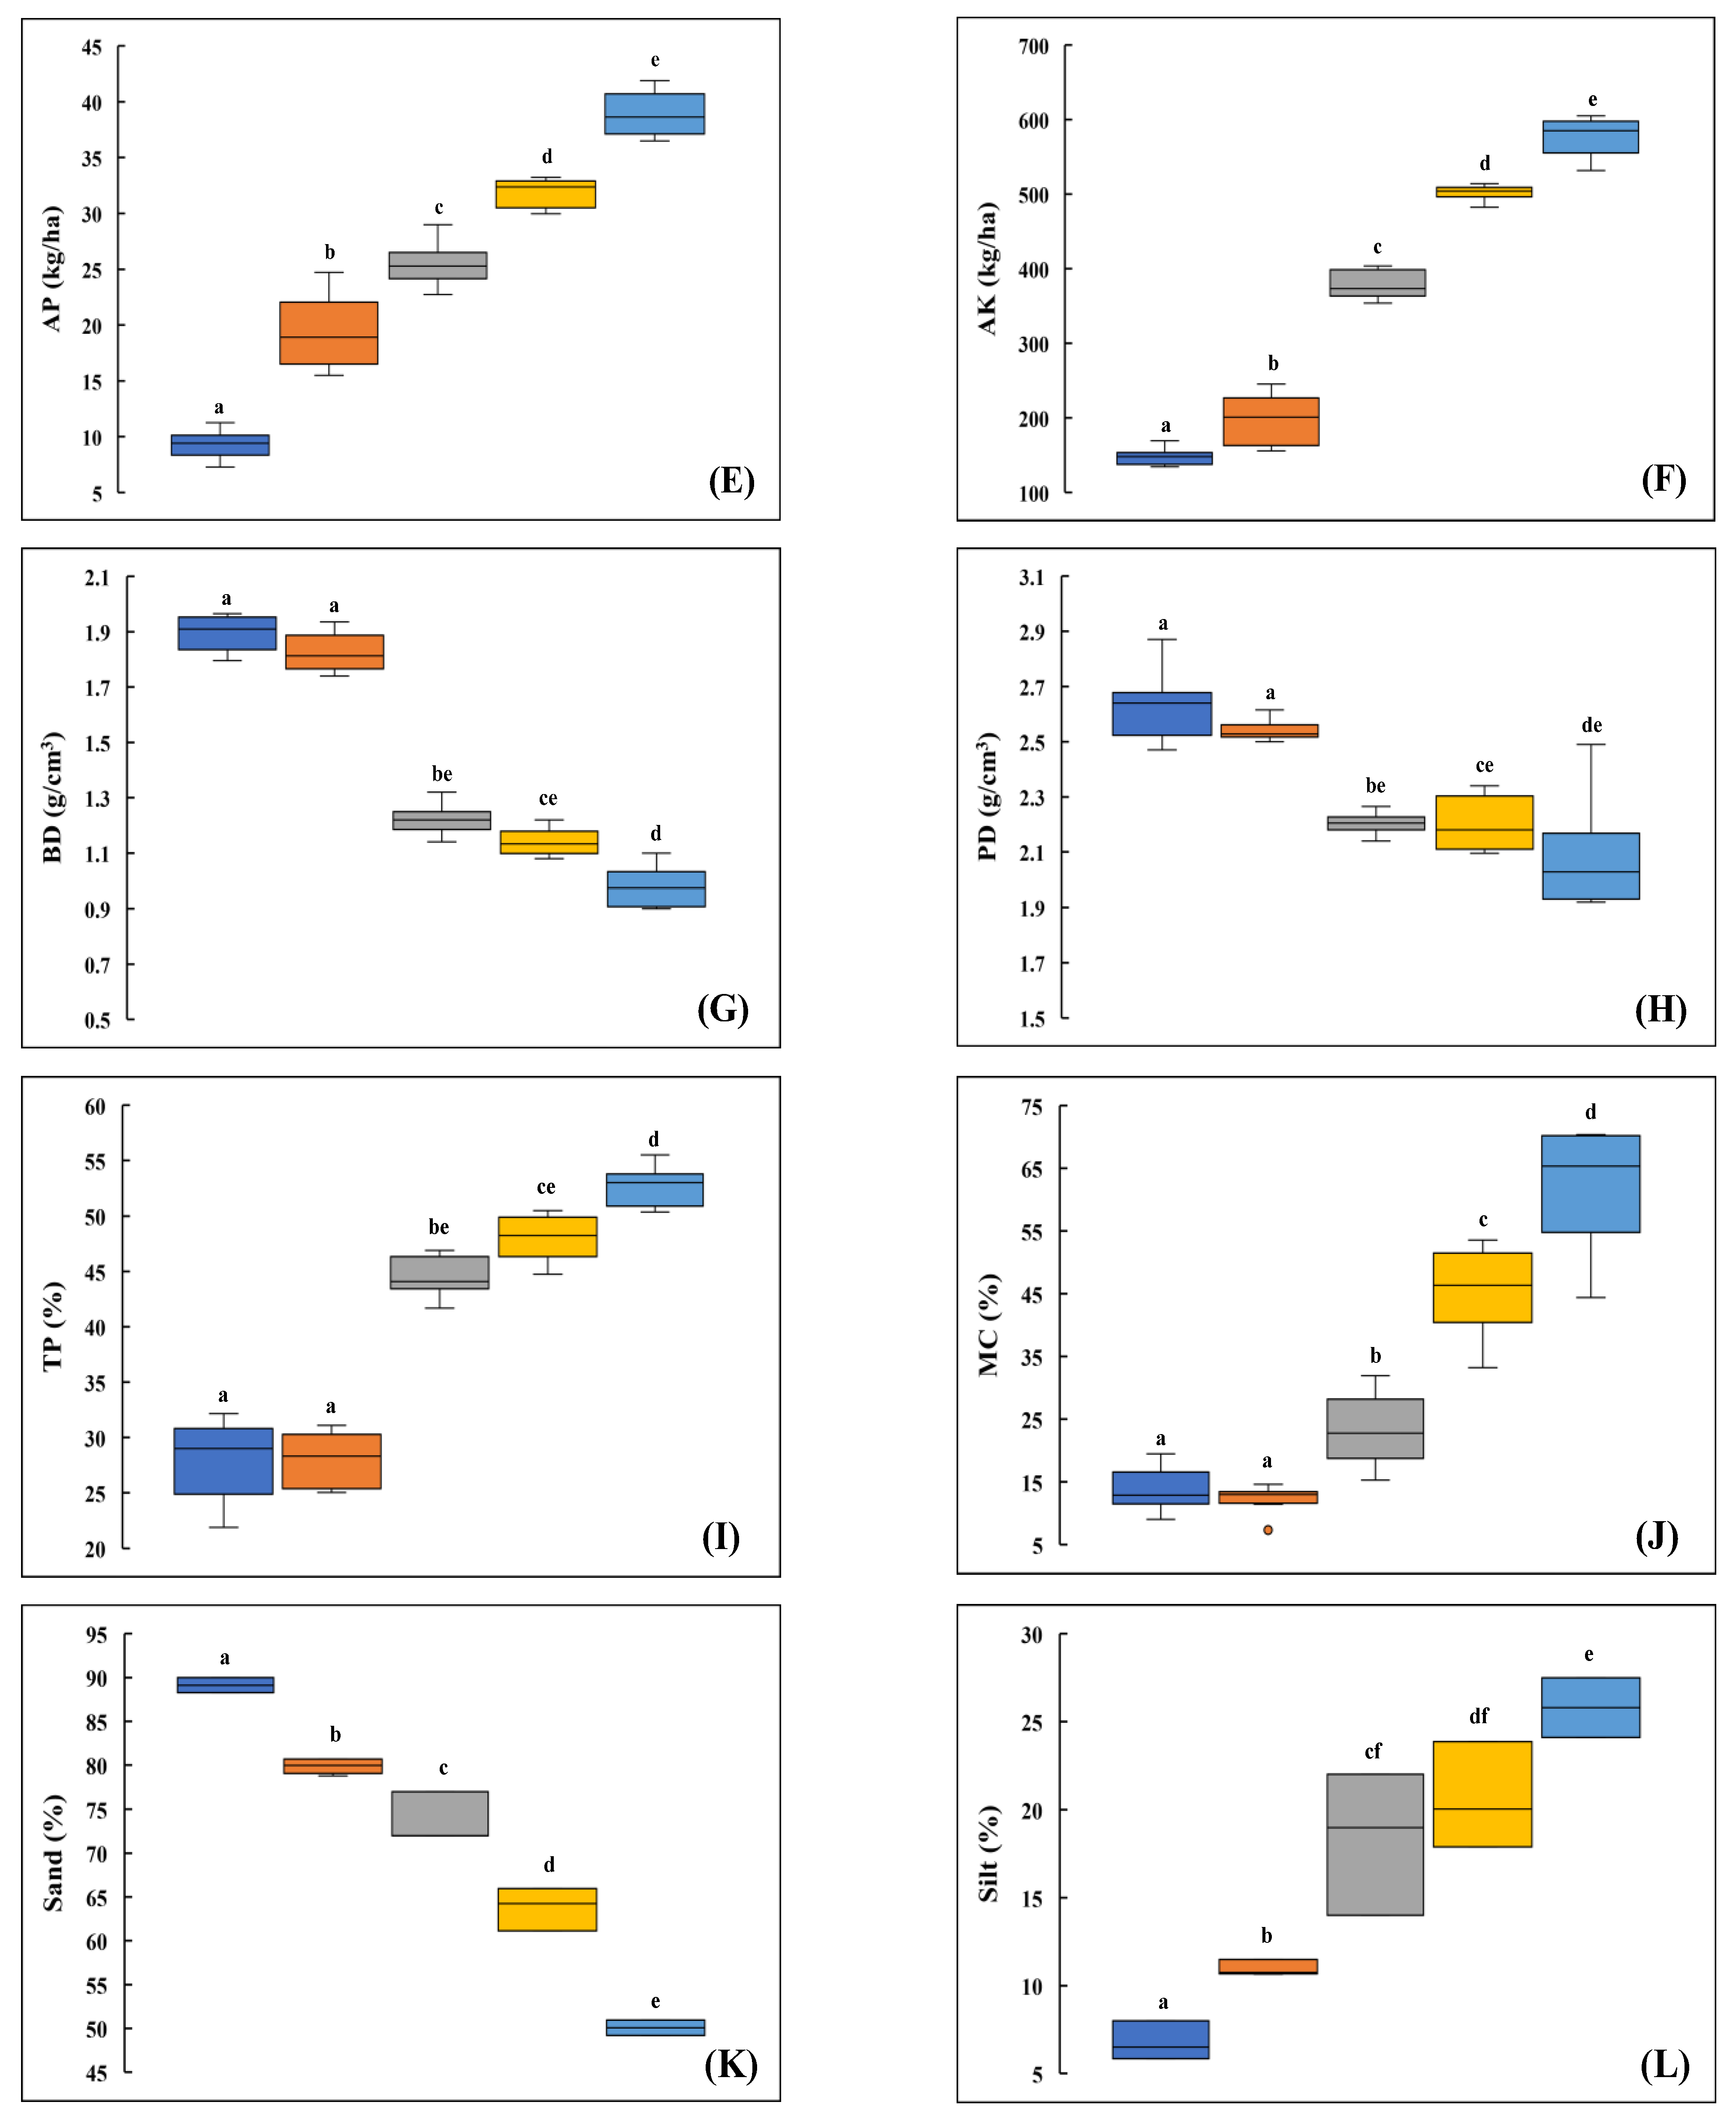
3.1. Impact of Landslide Disturbance on Soil Characteristics

The results indicated that landslides have a significant impact on the soil physico–chemical characteristics after the occurrence of the landslide. All the soil characteristics exhibited significant differences (ANOVA, p < 0.05) between the landslide–disturbed sites and the reference site (Figure 5). However, there is an absence of significant differences (Tukey’s HSD, p > 0.05) in all the chemical properties between the young sites—L6 and L16—and the old sites—L21 and L26—except in AP and AK (Figure 5). Considering soil chemical characteristics, the mean soil pH varies from 4.75–6.86 but pH does not show any clear trend with the age of landslides. The electrical conductivity (EC) increased significantly from 44.85 μS/cm at site L6 to 91.6 μS/cm at site L26 and the maximum has been observed in the reference site. The mean values of SOC range from 0.18% to 2.25% in the landslide–affected sites, which increases gradually with time. However, the maximum concentration of SOC had been found in the reference site. A similar trend is also observed among the studied macronutrients (MN, AP and AK) of the soil (Figure 5).
Among soil physical characteristics, sites L6 and L16 are characterised by significantly higher BD, PD and sand fraction as compared to the old landslide sites; however, a significant difference is absent (Tukey’s HSD, p > 0.05) between the L6 and L16 sites and between the L21 and L26 sites (Figure 5). Bulk density in landslide–affected sites varies from 1.14 to 1.89 g/cm3.
Significantly higher TP, MC, silt and clay fraction have been observed in L21 and L26 sites as compared to the young landslide sites and the maximums have been found in the reference site (Figure 5).

3.2. Selection of Indicators for the Minimum Data Set (MDS) for Principal Component Analysis (PCA)

All the studied properties (indicators) of soil have shown significant differences between the soils of disturbed sites and the reference site. Therefore, all the 13 parameters are being considered for the PCA to select a representative MDS to calculate the soil quality index (SQI). The PCA is incorporated as the data reduction tool because of its ability to select the MDS from the list of indicators [29].
Based on the results obtained from the principal component analysis, two PCs are considered having eigenvalues ≥ 1, which explained 86.92% of the total variance of the soil indicators (Table 3). PC1 explained 79.73% of the variance with five highly weighted variables and PC2 explained 7.19% of the variance with only two highly weighted variables. In each PC, only the indicators having absolute loading values within 10% of the highest loading value are considered as highly weighted variables. Therefore, pH, SOC, BD, TP and MC from PC1, and AP and clay from PC2, are considered the highly weighted eigenvectors (Table 3).
The Pearson’s correlation of highly weighted variables was calculated. The variables were highly correlated (r > 0.7) (Table S2). Therefore, the variables with highest sum of correlation coefficients were selected for the minimum dataset (MDS) (Table 4). SOC was selected from PC1 and AP and clay were selected from PC2. Therefore, the final MDS consists of three indicators, i.e., SOC, AP, and clay.

3.3. Determination of Soil Quality Index (SQI)

Soil OC plays an important role in enhancing the soil fertility and primary productivity of an ecosystem [67]. Available phosphorus is a necessary nutrient for the proper growth of plants and to improve the availability of other nutrients as well [32,68]. Similarly, clay fraction (20–25%) in soil indirectly helps in improving the soil quality. Clay in the soil has effects on the adsorption and desorption of nutrients and hydraulic properties [63,69]. The weight of the selected three indicators in the final MDS was calculated (Table 5), which showed that the SOC plays a more important role in determining the soil quality in the present study as compared to the AP and clay because the weight of SOC is comparatively higher than the other indicators.
The SQI value of all the sample locations in all the studied sites varied from 0.136 to 0.882 (Figure 6), and it was significantly higher in the mature forest (reference site) and in the old landslide sites (L21 and L26) as compared to the young landslide sites (L6 and L16). The significant differences existed between the SQI of each of the studied sites (p < 0.05, Tukey’s HSD). This implies that, although the soil quality of the disturbed sites progressively improves with time, the soil quality is significantly reduced in the recent landslide sites (L6 and L16) as the concentration of SOC and available nutrients are notably reduced due to the occurrence of the landslides.

4. Discussion

The present study indicated that oligotrophic conditions (less nutrients) predominated in the young landslide sites (L6 and L16). Soil physical properties are the key indicators of soil structure and hydrological status to assess soil quality. The present study also indicated that the landslide–disturbed sites have a lower fraction of silt and clay and a higher fraction of sand. The disturbed sites have recovered to some extent in the old disturbed sites—L21 and L26 (Figure 5). The reclamation is slow due to long–term significant effects of the landslides. The texture of soils at disturbed sites varies from sandy (L6) to sandy loam (L26), and was sandy clay loam at the reference site.
Remoulding and disintegration of clays and silts during landslides reduces structure and porosity and increases the density of soil. The present study showed the gradual increase in MC and TP content and the decrease in bulk density and particle density with increasing landslide age in the upper soil layer. The high moisture content might be due to the fact that vegetation increases with the passage of time and, hence, the evaporation of soil water decreases and the soil retains high water content. However, the reduction in bulk and particle density might be due to higher biological activity and litter accumulation underneath the vegetation cover with time [24,32,70] revealed that MC and TP were lower at landslide–affected sites than in the non–affected sites. Conversely, bulk and particle density were higher in the affected sites, which results in more compacted and drier soil.
Soil chemical characteristics also altered prominently, due to the occurrence of landslides, the soil pH, which tends to decrease with the age of landslides. There exists a significant difference between the landslide–affected sites and the reference site (Figure 5). Soils in the disturbed sites (especially in young landslide sites L6 and L16) have higher pH as compared to the reference site, due to less weathering and leaching, which may limit the availability and utilisation of nutrients. Similarly, Ref. [71] found higher pH in three recent landslides in Southeast Alaska.
Regarding variations in other soil chemical properties, most of the authors have reported lower concentration of soil organic carbon (SOC), soil organic matter (SOM) and nutrients (available N, P and K) in soils of recent landslides as compared to undisturbed soils because lower surface soil has lesser amounts of SOC and available nutrients that get exposed and reallocated to the surface [19,20,22,72,73,74]. Similar results were also obtained for the Uluguru Mountains in Tanzania by [75], who found lower OC and clay fraction inside landslides compared to undisturbed soils seven years after the occurrence of a landslide. Lower concentrations of AP in landslide–affected sites as compared to reference sites was also observed by [76,77]. The concentration of SOC here exhibits the initial stage of soil quality restoration.
In young landslide sites, the SOC concentration does not exceed 1%, which is a significance of preliminary restoration of soil quality. Ref. [78] mentioned that soil organic matter is crucial for the early stages of pedogenesis, i.e., soil formation and restoration of ecosystem services in post–mining areas. Ref. [20] also reported that in landslides in Poland, during the initial stages of recovery of the soil, the concentration of OC was less than 1%.
Considering nutrients (MN, AP and AK), significant differences are observed in all the sites, but there is an exception in the case of mineralisable nitrogen (MN) where a significant difference between the oldest site (L26) and the reference site is not observed (Tukey’s HSD, p < 0.05). Mineralisable nitrogen (MN) shows a remarkable increase and reaches to about 96% of the reference site. The rapid growth of early colonisers, and the rise in soil temperature due to the removal of fertile soil and vegetation after the disturbance, increase the biological activity and rate of mineralisation. These could be possible reasons for the significant increase in the concentration of MN in the old sites (L21 and L26). Similar observations were also reported by [74,79,80].
Available P and K recovered to about 82–87% of the reference (undisturbed) site. These variations in soil quality may be due to the decomposition of plant litter andresidues which are the main source of nutrients, especially OC and nitrogen. The concentrations of nutrients in the soil are highly influenced by vegetation. Plants provide the organic matter in the form of dead debris and root secretions. The increase in concentrations over time may also be due to the weathering of primary minerals and the deposition of colluvial material. Ref. [72] found that in the Kumaun Himalayas the concentration of various soil properties increased with the progression of succession and age of landslides. Ref. [19] also noticed that the recovery of topsoil characteristics on landslip scars on an erodible siltstone soil in New Zealand was predicted to reach about 80% of those on non–slipped sites. Similar results are observed in the present study as well regarding the recovery of nutrients, viz., AP, AK and MN.
On comparing all the disturbed sites, a significant difference has been observed among all the studied sites (Tukey’s HSD, p < 0.05), which signifies that the concentration of organic carbon and nutrients replenishes with the passage of time with an increase in soil quality. According to [81], in the reference site the concentration of SOC and nutrients demonstrated an increasing pattern due to lower tree density, decreased growth rate of vegetation, limited return of plant litter and relatively low absorption that facilitates the accumulation of soil nutrients in forests. Temporal variations in the different properties of soils in landslide–affected sites have been reported by various other researchers also for organic carbon (OC), available nitrogen (AN), available P (AP), exchangeable basic cations and soil texture [19,21,72,73].
In the restoration of soil quality, SOC plays a key role and also has positive effects on other physical [82] chemical [83] and biochemical properties [84,85], which in turn can be used as a valuable indicator for the assessment of soil quality [19,20]. The restoration of many soil properties follows similar trends and, if resources are limited, then SOC, AP and clay alone could provide adequate measures to assess soil quality and soil development [19]. In addition, Ref. [86] studied the ecological significance of forest age in the functional interpretation of a selected SQI in the Tropical Mountain Cloud Forest (TMCF) of Mexico and the results demonstrated that soil organic carbon, pH and available phosphorus are important evaluation indicators.
The mean values of SQI scores showed significant differences between all the sites, which indicates the huge variations in terms of soil quality in the landslide disturbed sites and the reference site. The SQI observed was in the sequence MF > L4 > L3 > L2 > L1. Due to steep slopes and the absence of vegetation in disturbed sites, soil nutrients are easily leached out as the landslide sites have less ability to restrict the water infiltration.

5. Conclusions

The present study has demonstrated the impact of landslides on soil quality in the Garhwal Himalayas, Uttarakhand. The study highlighted that landslides have a prominent negative effect on soil quality. The results demonstrated the obvious changes in soil characteristics along the chronosequence of landslides. In young landslide sites, the SOC concentration does not exceed 1%, which is a significance of preliminary restoration of soil quality. The soil quality recovers much faster during the initial phase of succession with chemical characteristics recovering comparatively faster than the physical properties. Although the soil quality of the affected sites has not reached to the pre–disturbance level, the concentration of nutrients in the 26-year-old site (L26) is comparable to the reference site. Therefore, it can be considered that more than 26 years are required for the complete recovery of soil nutrients.
SOC, AP and clay were selected as the MDS based on the results of PCA, which indicated that these parameters can be considered as an indicator of variations in soil quality if resources are limited. In addition, soil organic matter (SOM), which in turn is formed from SOC, can also be considered as an important indicator for soil quality assessment.
Lower nutrient levels (oligotrophic conditions) prevail in the young or recent landslides, which could be more problematic for restoration of soil and vegetation; however, the variations in the concentration of SOC and other nutrients observed between the studied sites make it more difficult to predict which specific nutrient may become limiting at any particular location. Therefore, insights from site–specific, long–term chronosequence studies are required.
The results of the study may provide insight about the suitable measures which should be taken to promote reclamation of disturbed areas in order to speed up the process of natural recovery based on the local climatic conditions. It may be concluded that the improvement of soil quality, especially in terms of soil nutrients, should be accentuated in the process of recovery and restoration in landslide–disturbed areas.

Supplementary Materials

The following supporting information can be downloaded at: https://www.mdpi.com/article/10.3390/land11101819/s1.

Author Contributions

Conceptualization, D.G. and V.J.; methodology, D.G.; software, D.G.; validation, D.G., V.J. and N.G.; formal analysis, D.G., V.J., N.G., M.M.S.C.-P.; investigation, D.G.; resources, D.G.; data curation, D.G.; writing—original draft preparation, D.G.; writing—review and editing, D.G., V.J. and N.G.; supervision, V.J.; funding acquisition, M.M.S.C.-P. All authors have read and agreed to the published version of the manuscript.

Funding

This research received no external funding.

Acknowledgments

Authors are grateful to the Dean of University School of Environment Management, Guru Gobind Singh Indraprastha University, for continuous support and providing the laboratory facilities. The first author is also thankful to Guru Gobind Singh Indraprastha University for providing financial assistance in the form of an Indraprastha Research Fellowship (IPRF) to carry out this research.

Conflicts of Interest

The authors declare no conflict of interest.

References

  1. Nadim, F.; Kjekstad, O.; Peduzzi, P.; Herold, C.; Jaedicke, C. Global landslide and avalanche hotspots. Landslides 2006, 3, 159–173. [Google Scholar] [CrossRef]
  2. Allen, S.K.; Rastner, P.; Arora, M.; Huggel, C.; Stoffel, M. Lake outburst and debris flow disaster at Kedarnath, June 2013: Hydrometeorological triggering and topographic predisposition. Landslides 2016, 13, 1479–1491. [Google Scholar] [CrossRef]
  3. Bilham, R. Earthquakes in India and the Himalaya: Tectonics, geodesy and history. Ann. Geophys. 2004, 47, 839–858. [Google Scholar] [CrossRef]
  4. Mugnier, J.–L.; Gajurel, A.; Huyghe, P.; Jayangondaperumal, R.; Jouanne, F.; Upreti, B. Structural interpretation of the great earthquakes of the last millennium in the central Himalaya. Earth–Sci. Rev. 2013, 127, 30–47. [Google Scholar] [CrossRef]
  5. Wasson, R.; Sundriyal, Y.; Chaudhary, S.; Jaiswal, M.K.; Morthekai, P.; Sati, S.; Juyal, N. A 1000–year history of large floods in the Upper Ganga catchment, central Himalaya, India. Quat. Sci. Rev. 2013, 77, 156–166. [Google Scholar] [CrossRef]
  6. Ziegler, A.D.; Wasson, R.J.; Bhardwaj, A.; Sundriyal, Y.P.; Sati, S.P.; Juyal, N.; Nautiyal, V.; Srivastava, P.; Gillen, J.; Saklani, U. Pilgrims, progress, and the political economy of disaster preparedness—The example of the 2013 Uttarakhand flood and Kedarnath disaster. Hydrol. Process. 2014, 28, 5985–5990. [Google Scholar] [CrossRef]
  7. Cheng, C.–H.; Hsiao, S.–C.; Huang, Y.–S.; Hung, C.–Y.; Pai, C.–W.; Chen, C.–P.; Menyailo, O.V. Landslide–induced changes of soil physicochemical properties in Xitou, Central Taiwan. Geoderma 2016, 265, 187–195. [Google Scholar] [CrossRef]
  8. Restrepo, C.; Walker, L.R.; Shiels, A.B.; Bussmann, R.; Claessens, L.; Fisch, S.; Lozano, P.; Negi, G.; Paolini, L.; Poveda, G.; et al. Landsliding and Its Multiscale Influence on Mountainscapes. BioScience 2009, 59, 685–698. [Google Scholar] [CrossRef] [Green Version]
  9. Sidle, R.; Ochiai, H. Landslides: Processes, prediction, and land use. In Water Resources Monograph; American Geophysical Union: Washington, DC, USA, 2006. [Google Scholar]
  10. Dash, P.; Singh, R.P.; Voss, F. Anomalous stress pattern in Chamoli region observed from IRS–IB data. Curr. Sci. 2000, 78, 1066–1070. [Google Scholar]
  11. Joshi, V.; Kumar, K. Extreme rainfall events and associated natural hazards in Alaknanda valley, Indian Himalayan region. J. Mt. Sci. 2006, 3, 228–236. [Google Scholar] [CrossRef]
  12. Khanduri, S.; Sajwan, K.S.; Rawat, A.; Dhyani, C.; Kapoor, S. Disaster in Rudraprayag District of Uttarakhand Himalaya: A Special Emphasis on Geomorphic Changes and Slope Instability. J. Geogr. Nat. Disasters 2018, 8, 218. [Google Scholar] [CrossRef]
  13. Geertsema, M.; Highland, L.; Vaugeouis, L. Environmental Impact of Landslides. In Landslides—Disaster Risk Reduction; Sassa, K., Canuti, P., Eds.; Springer: Berlin/Heidelberg, Germany, 2009; pp. 589–607. [Google Scholar] [CrossRef]
  14. Sassa, K.; Canuti, P. Landslides–Disaster Risk Reduction, 1st ed.; Springer: Berlin/Heidelberg, Germany, 2008. [Google Scholar]
  15. Sidle, R.C.; Ziegler, A.D.; Negishi, J.N.; Nik, A.R.; Siew, R.; Turkelboom, F. Erosion processes in steep terrain—Truths, myths, and uncertainties related to forest management in Southeast Asia. For. Ecol. Manag. 2006, 224, 199–225. [Google Scholar] [CrossRef]
  16. Lal, R. Soil degradation by erosion. Land Degrad. Dev. 2001, 12, 519–539. [Google Scholar] [CrossRef]
  17. Acharya, A.K.; Kafle, N. Land Degradation Issues in Nepal and Its Management Through Agroforestry. J. Agric. Environ. 2009, 10, 133–143. [Google Scholar] [CrossRef]
  18. Huang, R.Q. Characteristics of geological disasters of 5·12 Wenchuan Earthquake and recommendation on its impact on reconstruction. Chin. Geol. Educ. 2008, 2, 21–24. [Google Scholar]
  19. Sparling, G.; Ross, D.; Trustrum, N.; Arnold, G.; West, A.; Speir, T.; Schipper, L. Recovery of topsoil characteristics after landslip erosion in dry hill country of New Zealand, and a test of the space–for–time hypothesis. Soil Biol. Biochem. 2003, 35, 1575–1586. [Google Scholar] [CrossRef]
  20. Blonska, E.; Lasota, J.; Piaszczyk, W.; Wiecheć, M.; Klamerus–Iwan, A. The effect of landslide on soil organic carbon stock and biochemical properties of soil. J. Soils Sediments 2018, 18, 2727–2737. [Google Scholar] [CrossRef]
  21. Van Eynde, E.; Dondeyne, S.; Isabirye, M.; Deckers, J.; Poesen, J. Impact of landslides on soil characteristics: Implications for estimating their age. CATENA 2017, 157, 173–179. [Google Scholar] [CrossRef]
  22. Wilcke, W.; Valladarez, H.; Stoyan, R.; Yasin, S.; Valarezo, C.; Zech, W. Soil properties on a chronosequence of landslides in montane rain forest, Ecuador. CATENA 2003, 53, 79–95. [Google Scholar] [CrossRef]
  23. Powlson, D.S.; Smith, P.; Coleman, K.; Smith, J.U.; Glendining, M.J.; Körschens, M.; Franko, U. A European network of long–term sites for studies on soil organic matter. Soil Tillage Res. 1998, 47, 263–274. [Google Scholar] [CrossRef]
  24. Cheng, S.; Yang, G.; Yu, H.; Li, J.; Zhang, L. Impacts of Wenchuan Earthquake–induced landslides on soil physical properties and tree growth. Ecol. Indic. 2012, 15, 263–270. [Google Scholar] [CrossRef]
  25. Chou, W.–C.; Lin, W.–T.; Lin, C.–Y. Vegetation recovery patterns assessment at landslides caused by catastrophic earthquake: A case study in central Taiwan. Environ. Monit. Assess. 2009, 152, 245–257. [Google Scholar] [CrossRef]
  26. Jenkinson, D.S.; Hart, P.B.S.; Rayner, J.H.; Parry, L.C. Modelling the turnover of organic matter in long–term experiments at Rothamsted. INTECOL Bull. 1987, 15, 1–8. [Google Scholar]
  27. Huggett, R. Soil chronosequences, soil development, and soil evolution: A critical review. CATENA 1998, 32, 155–172. [Google Scholar] [CrossRef]
  28. Walker, L.R.; Wardle, D.A.; Bardgett, R.D.; Clarkson, B.D. The use of chronosequences in studies of ecological succession and soil development. J. Ecol. 2010, 98, 725–736. [Google Scholar] [CrossRef]
  29. Doran, J.W.; Parkin, T.B. Defining and assessing soil quality. In Defining Soil Quality for a Sustainable Environment; Doran, J.W., Coleman, D.C., Bezdicek, D.F., Stewart, B.A., Eds.; Soil Science Society of America Inc.: Madison, WI, USA, 1994; pp. 3–21. [Google Scholar]
  30. Doran, J.W.; Parkin, T.B. Quantitative indicators of soil quality: A minimum data set. In Methods for Assessing Soil Quality; Doran, J.W., Jones, A.J., Eds.; Soil Science Society of America Inc.: Madison, WI, USA, 1997; pp. 25–37. [Google Scholar]
  31. Karlen, D.L.; Mausbach, M.J.; Doran, J.W.; Cline, R.G.; Harris, R.F.; Schuman, G.E. Soil Quality: A Concept, Definition, and Framework for Evaluation (A Guest Editorial). Soil Sci. Soc. Am. J. 1997, 61, 4–10. [Google Scholar] [CrossRef] [Green Version]
  32. Yin, X.; Zhao, L.; Fang, Q.; Ding, G. Differences in Soil Physicochemical Properties in Different–Aged Pinus massoniana Plantations in Southwest China. Forests 2021, 12, 987. [Google Scholar] [CrossRef]
  33. Biswas, S.; Hazra, G.C.; Purakayastha, T.J.; Saha, N.; Mitran, T.; Roy, S.S.; Basak, N.; Mandal, B. Establishment of critical limits of indicators and indices of soil quality in rice–rice cropping systems under different soil orders. Geoderma 2017, 292, 34–48. [Google Scholar] [CrossRef]
  34. Mukhopadhyay, S.; Masto, R.; Yadav, A.; George, J.; Ram, L.; Shukla, S. Soil quality index for evaluation of reclaimed coal mine spoil. Sci. Total Environ. 2016, 542, 540–550. [Google Scholar] [CrossRef] [PubMed]
  35. Larson, W.E.; Pierce, F.J.; Doran, J.; Coleman, D.; Bezdicek, D.; Stewart, B. The Dynamics of Soil Quality as a Measure of Sustainable Management. In Defining Soil Quality for a Sustainable Environment; Doran, J.W., Coleman, D.C., Bezdicek, D.F., Stewart, B.A., Eds.; Soil Science Society of America Inc.: Madison, WI, USA, 1994; pp. 37–51. [Google Scholar] [CrossRef]
  36. Andrews, S.S.; Karlen, D.L.; Mitchell, J.P. A comparison of soil quality indexing methods for vegetable production systems in Northern California. Agric. Ecosyst. Environ. 2002, 90, 25–45. [Google Scholar] [CrossRef]
  37. Doran, J.W.; Jones, A.J. Methods for Assessing Soil Quality, 49th ed.; Soil Science Society of America Inc.: Madison, WI, USA, 1997. [Google Scholar] [CrossRef]
  38. Nabiollahi, K.; Golmohamadi, F.; Taghizadeh–Mehrjardi, R.; Kerry, R.; Davari, M. Assessing the effects of slope gradient and land use change on soil quality degradation through digital mapping of soil quality indices and soil loss rate. Geoderma 2018, 318, 16–28. [Google Scholar] [CrossRef]
  39. Ditzler, C.A.; Tugel, A.J. Soil Quality Field Tools: Experiences of USDA-NRCS soil quality institute. Agron. J. 2002, 94, 33–38. [Google Scholar] [CrossRef]
  40. Xue, Y.–J.; Liu, S.–G.; Hu, Y.–M.; Yang, J.–F. Soil Quality Assessment Using Weighted Fuzzy Association Rules. Pedosphere 2010, 20, 334–341. [Google Scholar] [CrossRef]
  41. Singh, A.K.; Rai, A.; Banyal, R.; Chauhan, P.S.; Singh, N. Plant community regulates soil multifunctionality in a tropical dry forest. Ecol. Indic. 2018, 95, 953–963. [Google Scholar] [CrossRef]
  42. Sajwan, K.S.; Sushil, K. A Geological Appraisal of Slope Instability in Upper Alaknanda Valley, Uttarakhand Himalaya, India. J. Geol. Geophys. 2016, 5, 1–7. [Google Scholar] [CrossRef]
  43. Sahoo, P.K.; Kumar, S.; Singh, R.P. Neotectonic study of Ganga and Yamuna tear faults, NW Himalaya, using remote sensing and GIS. Int. J. Remote Sens. 2000, 21, 499–518. [Google Scholar] [CrossRef]
  44. Rawat, M.S.; Uniyal, D.P.; Dobhal, R.; Joshi, V.; Rawat, B.S.; Bartwal, A.; Singh, D.; Aswal, A. Study of landslide hazard zonation in Mandakini Valley, Rudraprayag district, Uttarakhand using remote sensing and GIS. Curr. Sci. 2015, 109, 158–170. [Google Scholar]
  45. Singh, D.; Chhonkar, P.K.; Dwivedi, B.S. Electrical conductivity. In Manual on Soil, Plant and Water Analysis; Westville Publishing House: New Delhi, India, 2005; p. 26. [Google Scholar]
  46. Singh, D.; Chhonkar, P.K.; Dwivedi, B.S. Soil reaction. In Manual on Soil, Plant and Water Analysis; Westville Publishing House: New Delhi, India, 2005; pp. 23–25. [Google Scholar]
  47. Walkley, A.; Black, I.A. An examination of the Degtjareff method for determining soil organic matter, and a proposed modification of the chromic acid titration method. Soil Sci. 1934, 37, 29–38. [Google Scholar] [CrossRef]
  48. Subbiah, B.V.; Asija, G.L. A rapid procedure for the estimation of available nitrogen in soils. Curr. Sci. 1956, 25, 259–260. [Google Scholar]
  49. Watanabe, F.S.; Olsen, S.R. Test of an Ascorbic Acid Method for Determining Phosphorus in Water and NaHCO3 Extracts from Soil. Soil Sci. Soc. Am. J. 1965, 29, 677–678. [Google Scholar] [CrossRef]
  50. Hanway, J.J.; Heidel, H. Soil analysis methods as used in Iowa state college soil testing laboratory. Iowa State Coll. Agric. Bull. 1952, 57, 1–31. [Google Scholar]
  51. Bandyopadhyay, K.K.; Aggarwal, P.; Chakraborty, D.; Pradhan, S.; Garg, R.N.; Singh, R. Practical Manual on Measurement of Soil Physical Properties. In Division of Agricultural Physics; Indian Agricultural Research Institute: New Delhi, India, 2012. [Google Scholar]
  52. Bouyoucos, G.J. Hydrometer Method Improved for Making Particle Size Analyses of Soils. Agron. J. 1962, 54, 464–465. [Google Scholar] [CrossRef]
  53. Hadi, N.U.; Naziruddin, A.; Ilham, S. An Easy Approach to Exploratory Factor Analysis: Marketing Perspective. J. Educ. Soc. Res. 2016, 6, 215. [Google Scholar] [CrossRef]
  54. Hutcheson, G.D.; Sofroniou, N. The Multivariate Social Scientist: Introductory Statistics Using Generalized Linear Models; Sage Publications: New York, NY, USA, 1999. [Google Scholar]
  55. Kaiser, H.F. An index of factorial simplicity. Psychometrika 1974, 39, 31–36. [Google Scholar] [CrossRef]
  56. Field, A. Discovering Statistics Using IBM SPSS Statistics, 4th ed.; Sage Publications: New York, NY, USA, 2013. [Google Scholar]
  57. Pallant, J. SPSS Survival Manual: A Step by Step Guide to Data Analysis Using SPSS, 4th ed.; Allen & Unwin: Berkshire, UK, 2013. [Google Scholar]
  58. Lin, Y.; Deng, H.; Du, K.; Li, J.; Lin, H.; Chen, C.; Fisher, L.; Wu, C.; Hong, T.; Zhang, G. Soil quality assessment in different climate zones of China’s Wenchuan earthquake affected region. Soil Tillage Res. 2017, 165, 315–324. [Google Scholar] [CrossRef]
  59. Mandal, U.K.; Warrington, D.; Bhardwaj, A.; Bar–Tal, A.; Kautsky, L.; Minz, D.; Levy, G. Evaluating impact of irrigation water quality on a calcareous clay soil using principal component analysis. Geoderma 2008, 144, 189–197. [Google Scholar] [CrossRef]
  60. Govaerts, B.; Sayre, K.D.; Deckers, J. A minimum data set for soil quality assessment of wheat and maize cropping in the highlands of Mexico. Soil Tillage Res. 2006, 87, 163–174. [Google Scholar] [CrossRef]
  61. Kaiser, H.F. The Application of Electronic Computers to Factor Analysis. Educ. Psychol. Meas. 1960, 20, 141–151. [Google Scholar] [CrossRef]
  62. Shukla, M.K.; Lal, R.; Ebinger, M. Determining soil quality indicators by factor analysis. Soil Till. Res. 2006, 87, 194–204. [Google Scholar] [CrossRef]
  63. Vasu, D.; Singh, S.K.; Ray, S.K.; Duraisami, V.P.; Tiwary, P.; Chandran, P.; Nimkar, A.M.; Anantwar, S.G. Soil quality index (SQI) as a tool to evaluate crop productivity in semi–arid Deccan plateau, India. Geoderma 2016, 282, 70–79. [Google Scholar] [CrossRef]
  64. Andrews, S.S.; Carroll, C.R. Designing a soil quality assessment tool for sustainable agroecosystem management. Ecol. Appl. 2001, 11, 1573–1585. [Google Scholar] [CrossRef]
  65. Liu, Z.; Zhou, W.; Shen, J.; Li, S.; He, P.; Liang, G. Soil quality assessment of Albic soils with different productivities for eastern China. Soil Tillage Res. 2014, 140, 74–81. [Google Scholar] [CrossRef]
  66. Mukherjee, A.; Lal, R. Comparison of Soil Quality Index Using Three Methods. PLoS ONE 2014, 9, e105981. [Google Scholar] [CrossRef]
  67. Jiang, M.; Xu, L.; Chen, X.; Zhu, H.; Fan, H. Soil Quality Assessment Based on a Minimum Data Set: A Case Study of a County in the Typical River Delta Wetlands. Sustainability 2020, 12, 9033. [Google Scholar] [CrossRef]
  68. Zavišić, A.; Yang, N.; Marhan, S.; Kandeler, E.; Polle, A. Forest Soil Phosphorus Resources and Fertilization Affect Ectomycorrhizal Community Composition, Beech P Uptake Efficiency, and Photosynthesis. Front. Plant Sci. 2018, 9, 463. [Google Scholar] [CrossRef] [Green Version]
  69. Chaudhari, S.K. Saturated hydraulic conductivity, dispersion, swelling and exchangeable sodium percentage of different textured soils as influenced by water quality. Commun. Soil Sci. Plant Anal. 2001, 32, 2439–2455. [Google Scholar] [CrossRef]
  70. Sutinen, R.; Panttaja, M.; Teirila, A.; Sutinen, M.L. Effect of mechanical site preparation on soil quality in former Norway spruce sites. Geoderma 2006, 136, 411–422. [Google Scholar] [CrossRef]
  71. Adams, P.W.; Sidle, R.C. Soil conditions in three recent landslides in Southeast Alaska. For. Ecol. Manag. 1987, 18, 93–102. [Google Scholar] [CrossRef]
  72. Joshi, M. A study on soil and vegetation changes after landslide in Kumaun Himalaya. Proc. Indian National Sci. Acad. 1990, 56, 351–359. [Google Scholar]
  73. Reddy, V.; Singh, J. Changes in Vegetation and Soil During Succession Following Landslide Disturbance in the Central Himalaya. J. Environ. Manag. 1993, 39, 235–250. [Google Scholar] [CrossRef]
  74. Singh, K.; Mandal, T.; Tripathi, S. Patterns of restoration of soil physciochemical properties and microbial biomass in different landslide sites in the sal forest ecosystem of Nepal Himalaya. Ecol. Eng. 2001, 17, 385–401. [Google Scholar] [CrossRef]
  75. Lundgren, L. Studies of Soil and Vegetation Development on Fresh Landslide Scars in the Mgeta Valley, Western Uluguru Mountains, Tanzania. Geogr. Ann. Ser. A, Phys. Geogr. 1978, 60, 91–127. [Google Scholar] [CrossRef]
  76. Guariguata, M.R. Landslide Disturbance and Forest Regeneration in the Upper Luquillo Mountains of Puerto Rico. J. Ecol. 1990, 78, 814. [Google Scholar] [CrossRef]
  77. Dalling, J.W.; Tanner, E.V.J. An Experimental Study of Regeneration on Landslides in Montane Rain Forest in Jamaica. J. Ecol. 1995, 83, 55–64. [Google Scholar] [CrossRef]
  78. Pietrzykowski, M.; Krzaklewski, W. Potential for carbon sequestration in reclaimed mine soil on reforested surface mining areas in Poland. Nat. Sci. 2010, 02, 1015–1021. [Google Scholar] [CrossRef]
  79. Driscoll, K.; Arocena, J.; Massicotte, H. Post–fire soil nitrogen content and vegetation composition in Sub–Boreal spruce forests of British Columbia's central interior, Canada. For. Ecol. Manag. 1999, 121, 227–237. [Google Scholar] [CrossRef]
  80. Vitousek, P.M.; Matson, P.A.; Van Cleve, K. Nitrogen availability and nitrification during succession: Primary, secondary, and old–field seres. Plant Soil 1989, 115, 229–239. [Google Scholar] [CrossRef]
  81. Montfort, F.; Nourtier, M.; Grinand, C.; Maneau, S.; Mercier, C.; Roelens, J.–B.; Blanc, L. Regeneration capacities of woody species biodiversity and soil properties in Miombo woodland after slash–and–burn agriculture in Mozambique. For. Ecol. Manag. 2021, 488, 119039. [Google Scholar] [CrossRef]
  82. Masri, Z.; Ryan, J. Soil organic matter and related physical properties in a Mediterranean wheat–based rotation trial. Soil Tillage Res. 2006, 87, 146–154. [Google Scholar] [CrossRef]
  83. Sebastia, J.; Labanowski, J.; Lamy, I. Changes in soil organic matter chemical properties after organic amendments. Chemosphere 2007, 68, 1245–1253. [Google Scholar] [CrossRef]
  84. Aranda, V.; Macci, C.; Peruzzi, E.; Masciandaro, G. Biochemical activity and chemical–structural properties of soil organic matter after 17 years of amendments with olive–mill pomace co–compost. J. Environ. Manag. 2015, 147, 278–285. [Google Scholar] [CrossRef]
  85. Valarini, P.J.; Alvarez, M.C.D.; Gascó, J.M.; Guerrero, F.; Tokeshi, H. Assessment of soil properties by organic matter and EM–microorganism incorporation. Rev. Bras. Cienc. Solo. 2003, 27, 519–525. [Google Scholar] [CrossRef] [Green Version]
  86. Bautista–Cruz, A.; del Castillo, R.F.; Etchevers, J.D.; Gutiérrez–Castorena, M.D.C.; Baez, A. Selection and interpretation of soil quality indicators for forest recovery after clearing of a tropical montane cloud forest in Mexico. For. Ecol. Manag. 2012, 277, 74–80. [Google Scholar] [CrossRef]
Figure 1. Topography of Alaknanda watershed. (a) Illustrated watershed region showing Alaknanda River (blue); black features (circles) represent the landslide sites. The black outline indicates the location of the study area. Inset map shows the geographical area of Uttarakhand state and the Alaknanda watershed (blue). (b) Enlarged view of the study area. Black circles represent the location of selected landslide sites with the year of occurrence. The triangle illustrates the location of the reference site.
Land 11 01819 g001
Figure 2. Rainfall pattern of the study area (IMD, 2018).
Land 11 01819 g002
Figure 3. Photos of the study sites. (a) L6, landslide site of 2013, (b) L16, landslide site of 2003, (c) L21, landslide site of 1998, (d) L26, landslide site of 1993, (e) reference (control) site.
Land 11 01819 g003
Figure 4. Soil map of the study area showing that the selected landslide sites and the reference site (blue circle) have a similar soil type, i.e., Lithic Udorthents (Entisols) (NBSS&LUP, 1999).
Land 11 01819 g004
Figure 5. Soil physico–chemical properties in landslide–affected sites (L6, L16, L21 and L26) and reference site (Control). (A) pH, (B) electrical conductivity (EC), (C) soil organic carbon (SOC), (D) mineralisable nitrogen (MN), (E) available phosphorus (AP), (F) available potassium (AK), (G) bulk density (BD), (H) particle density (PD), (I) total porosity (TP), (J) moisture content (MC), (K) sand, (L) silt, (M) clay. Different letters represent significant difference at p < 0.05 (Tukey’s post hoc HSD test).
Land 11 01819 g005aLand 11 01819 g005bLand 11 01819 g005c
Figure 6. Mean soil quality index (SQI) values in landslide disturbed sites (L6, L16, L21 and L26) and reference site (MF—mature forest) with standard error bars (±S.E.) of total index values having significant difference at p < 0.05. AP- Available phosphorus; SOC- Soil organic carbon.
Land 11 01819 g006
Table 1. Characteristics of studied landslide sites and reference (control) site in Garhwal Himalayas.
SitesYear of Landslide OccurrenceCoordinatesElevation
(m a.s.l.)
Slope (°)AspectParent Material
LongitudeLatitude
L6201379°0′01.62″ N30°38′03.55″ E176432WestSchist
L16200379°27′58.54″ N30°28′41.27″ E142338North EastDolomite, phyllite
L21199879°05′02.87″ N30°33′52.09″ E125634SouthSchist, gneiss
L26199379°01′22.04″ N30°35′55.57″ E167228EastQuartzite, schist
Reference
(control) site
79°0′26.24″ N30°37′29.60″ E171126North EastSchist, phyllite
Table 2. Methods used for the analysis of selected properties of soil in the present study.
PropertiesMethod UsedReference
pHSoil water suspension (soil:water = 1:2.5)[45]
ECSupernatant of soil water extract[46]
SOCRapid titration[47]
MNKjeldahl method[48]
APAscorbic acid method[49]
AKAmmonium acetate method[50]
BDCore sampler method[51]
PDUsing pycnometer bottles[51]
TP Porosity = ( 1 BD PD )   * 100
MCGravimetric and oven–dry method
SandHydrometer method[52]
SiltHydrometer method[52]
ClayHydrometer method[52]
Table 3. Result of principal component analysis (PCA) of significant soil indicators.
PCsPC 1PC 2
Percent of variance (%)79.7327.191
Cumulative variance (%)79.73286.924
Eigenvalues11.1631.007
Factor loadings (Rotated component matrix)
pH−0.904−0.219
EC0.4920.647
SOC0.8360.523
MN0.3350.798
AP0.3780.898
AK0.6710.696
BD−0.834−0.537
PD−0.733−0.551
TP0.8150.462
MC0.8380.339
Sand−0.642−0.591
Silt0.5700.763
Clay0.2990.897
Abbreviations are the same as Table 2; bold factor loadings under each PC are highly weighted and bold underlined were selected for the MDS.
Table 4. Correlation coefficients and sums of highly weighted soil parameters in a particular principal component (PC).
PC 1 VariablespHSOCBDTPMC
pH1.0000.7690.7930.8140.641
SOC0.7691.0000.9380.9090.895
BD0.7930.9381.0000.8970.828
TP0.8140.9090.8971.0000.824
MC0.6410.8950.8280.8241.000
Sum of correlation coefficients4.0174.5114.4564.4444.188
PC 2 VariablesAPClay
AP1.0000.870
Clay0.8701.000
Sum of correlation coefficients1.8701.870
Table 5. Estimated communalities and weight of the soil indicators selected as the minimum data set (MDS).
MDS IndicatorsCommunalitiesWeight
SOC0.9710.345
AP0.9490.337
Clay0.8950.318
Publisher’s Note: MDPI stays neutral with regard to jurisdictional claims in published maps and institutional affiliations.

