Article

Carbon Storage of Single Tree and Mixed Tree Dominant Species Stands in a Reserve Forest—Case Study of the Eastern Sub-Himalayan Region of India

1
Department of Forestry, Uttar Banga Krishi Viswavidyalaya, Pundibari 736165, India
2
Department of Agronomy and Agroforestry, MS Swaminathan School of Agriculture, Centurion University of Technology and Management, Parlakhemundi, Gajapati 761211, India
3
Department of Forest Products and Utilization, College of Horticulture and Forestry, Rani Lakshmi Bai Central Agricultural University, Jhansi 284003, India
4
School of Hydrology and Water Resources, Nanjing University of Information Science and Technology, Nanjing 210044, China
5
Department of Forestry and Natural Resources, HNB Garhwal University, Srinagar-Garhwal 249161, India
6
Department of Geosciences, University of Aveiro, Campus de Santiago, 3810-193 Aveiro, Portugal
*
Author to whom correspondence should be addressed.
These authors contributed equally to this work.
Land 2021, 10(4), 435; https://doi.org/10.3390/land10040435
Submission received: 8 March 2021 / Revised: 12 April 2021 / Accepted: 16 April 2021 / Published: 19 April 2021
(This article belongs to the Special Issue Geochemical Mapping in Land Managing)

Abstract

:
In recent decades, carbon (C) management is an important point on the agenda to identify the best viable mitigation strategies for its reduction. The study was conducted at Jaldapara National Park located in the Eastern Himalayan region of India. The study quantified litter production, decomposition, periodic nutrient release, soil fertility status, and soil organic carbon (SOC) of five major forest stands i.e., Tectona grandis (TGDS), Shorea robusta (SRDS), Michelia champaca (MCDS), Lagerstroemia parviflora (LPDS) and miscellaneous stand (MS). A stratified random nested quadrate method was adopted for sample collection. Results reveal that the greatest amount of litter production and decomposition was under MCDS followed by MS, LPDS, SRDS, and the smallest under TGDS. The material annual turnover through litter decomposition in all the stands varies between 96.46% and 99.34%. The content and amount of the available nutrients in litter varied significantly among the stands. Moreover, release of these nutrients was nearly equal to the amount available in the initial litter mass. In general, the magnitude of the total nutrient return was in the same order as the total litter fall and the nutrient availability was more closely related to litter nutrient content and soil organic carbon. The range of pH (4.86–5.16), EC (0.34–0.50), soil moisture (27.01–31.03) and available primary nutrients (N: (0.21–0.26 Mg/ha), P: (0.09–0.12 Mg/ha), K: (0.13–0.14 Mg/ha)) also varied significantly among the stands. Significant positive correlations were observed between SOC, N and K. Both the fertility indices exhibited no definite pattern in the stands but a significant correlation between the two indicates the healthy soil fertility status of the stands. SOC varies significantly under different forest stands, but the greatest content was found under MS. The estimated SOC ranges between 75.9 and 107.7 Mg ha−1 up to 60 cm and is reported to be below the Indian average of 182.94 Mg ha−1. The present study strongly recommends that Tectona grandis, Shorea robusta, Michelia champaca, and Lagerstroemia parviflora should be the important commercial timbers of the Eastern Himalayan region because they may help further to increase the C sink in agricultural and degraded landscapes.

1. Introduction

Carbon management through enhancing carbon uptake and storage by plants and forests is now globally recognized as a vital strategy to mitigate climate change [1,2]. Assessing carbon sequestration of forest stands will help in prioritizing the tree species-specific land use practices to ensure sustainability and share carbon credits [1,3]. Soil and vegetation have a complex interrelationship. Forest productivity is a function of the factors of the site quality, including the growth behavior of the inhabitant species. Thus, it is necessary to study the relationship between soil nutrients and biomass production and the interrelationship of woody vegetation density with soil characteristics. Forests normally have higher soil organic matter (SOM) due to the continuous and large amount of litter which primarily influences the net primary productivity [4]. Moreover, organic matter (OM) is vital for the forest ecosystem; it influences the carbon dynamics and further changes the regional and/or global carbon budgets. Therefore, it is worth quantifying the carbon in forest soil in addition to litter production and soil fertility status (i.e., soil fertility index and soil evaluation factor). Quantification of soil organic carbon (SOC) pools on the national, regional, and global scale is necessary to analyze the role of soils in the global carbon cycle, along with biological responses to climatic dynamics [3].
The carbon sequestration potential of different forest-based land uses in India was estimated through quantification of litter fall, biomass, and carbon stock in biomass, but their SOC pool is yet to be estimated properly as most of the attempts were based on an indirect estimation of bulk density along with a limited understanding of structural and functional relationships of forests [5,6,7]. Consequently, prioritizing Indian forests and their underlying soils based on the carbon sequestration potential is still a challenging task for researchers. Studies on the floristic and quantitative aspect of the forest and its litter dynamics have been reported by many works in the past [8,9,10,11], but little attention has been given to nutrient status and the standing stock of forest biomass. Due to rapid changes in the climate, CO2 enrichment needs advanced mitigating strategies to maintain a sustainable environment. The main focus of the present study is to understand both the nutrient status and the total carbon stock in different stands of the forest in the Eastern Himalayas of India. The present study will be of great help in understanding the carbon dynamics in the Himalaya region, so that advanced mitigation steps may be taken to safeguard the future climate.

2. Materials and Methods

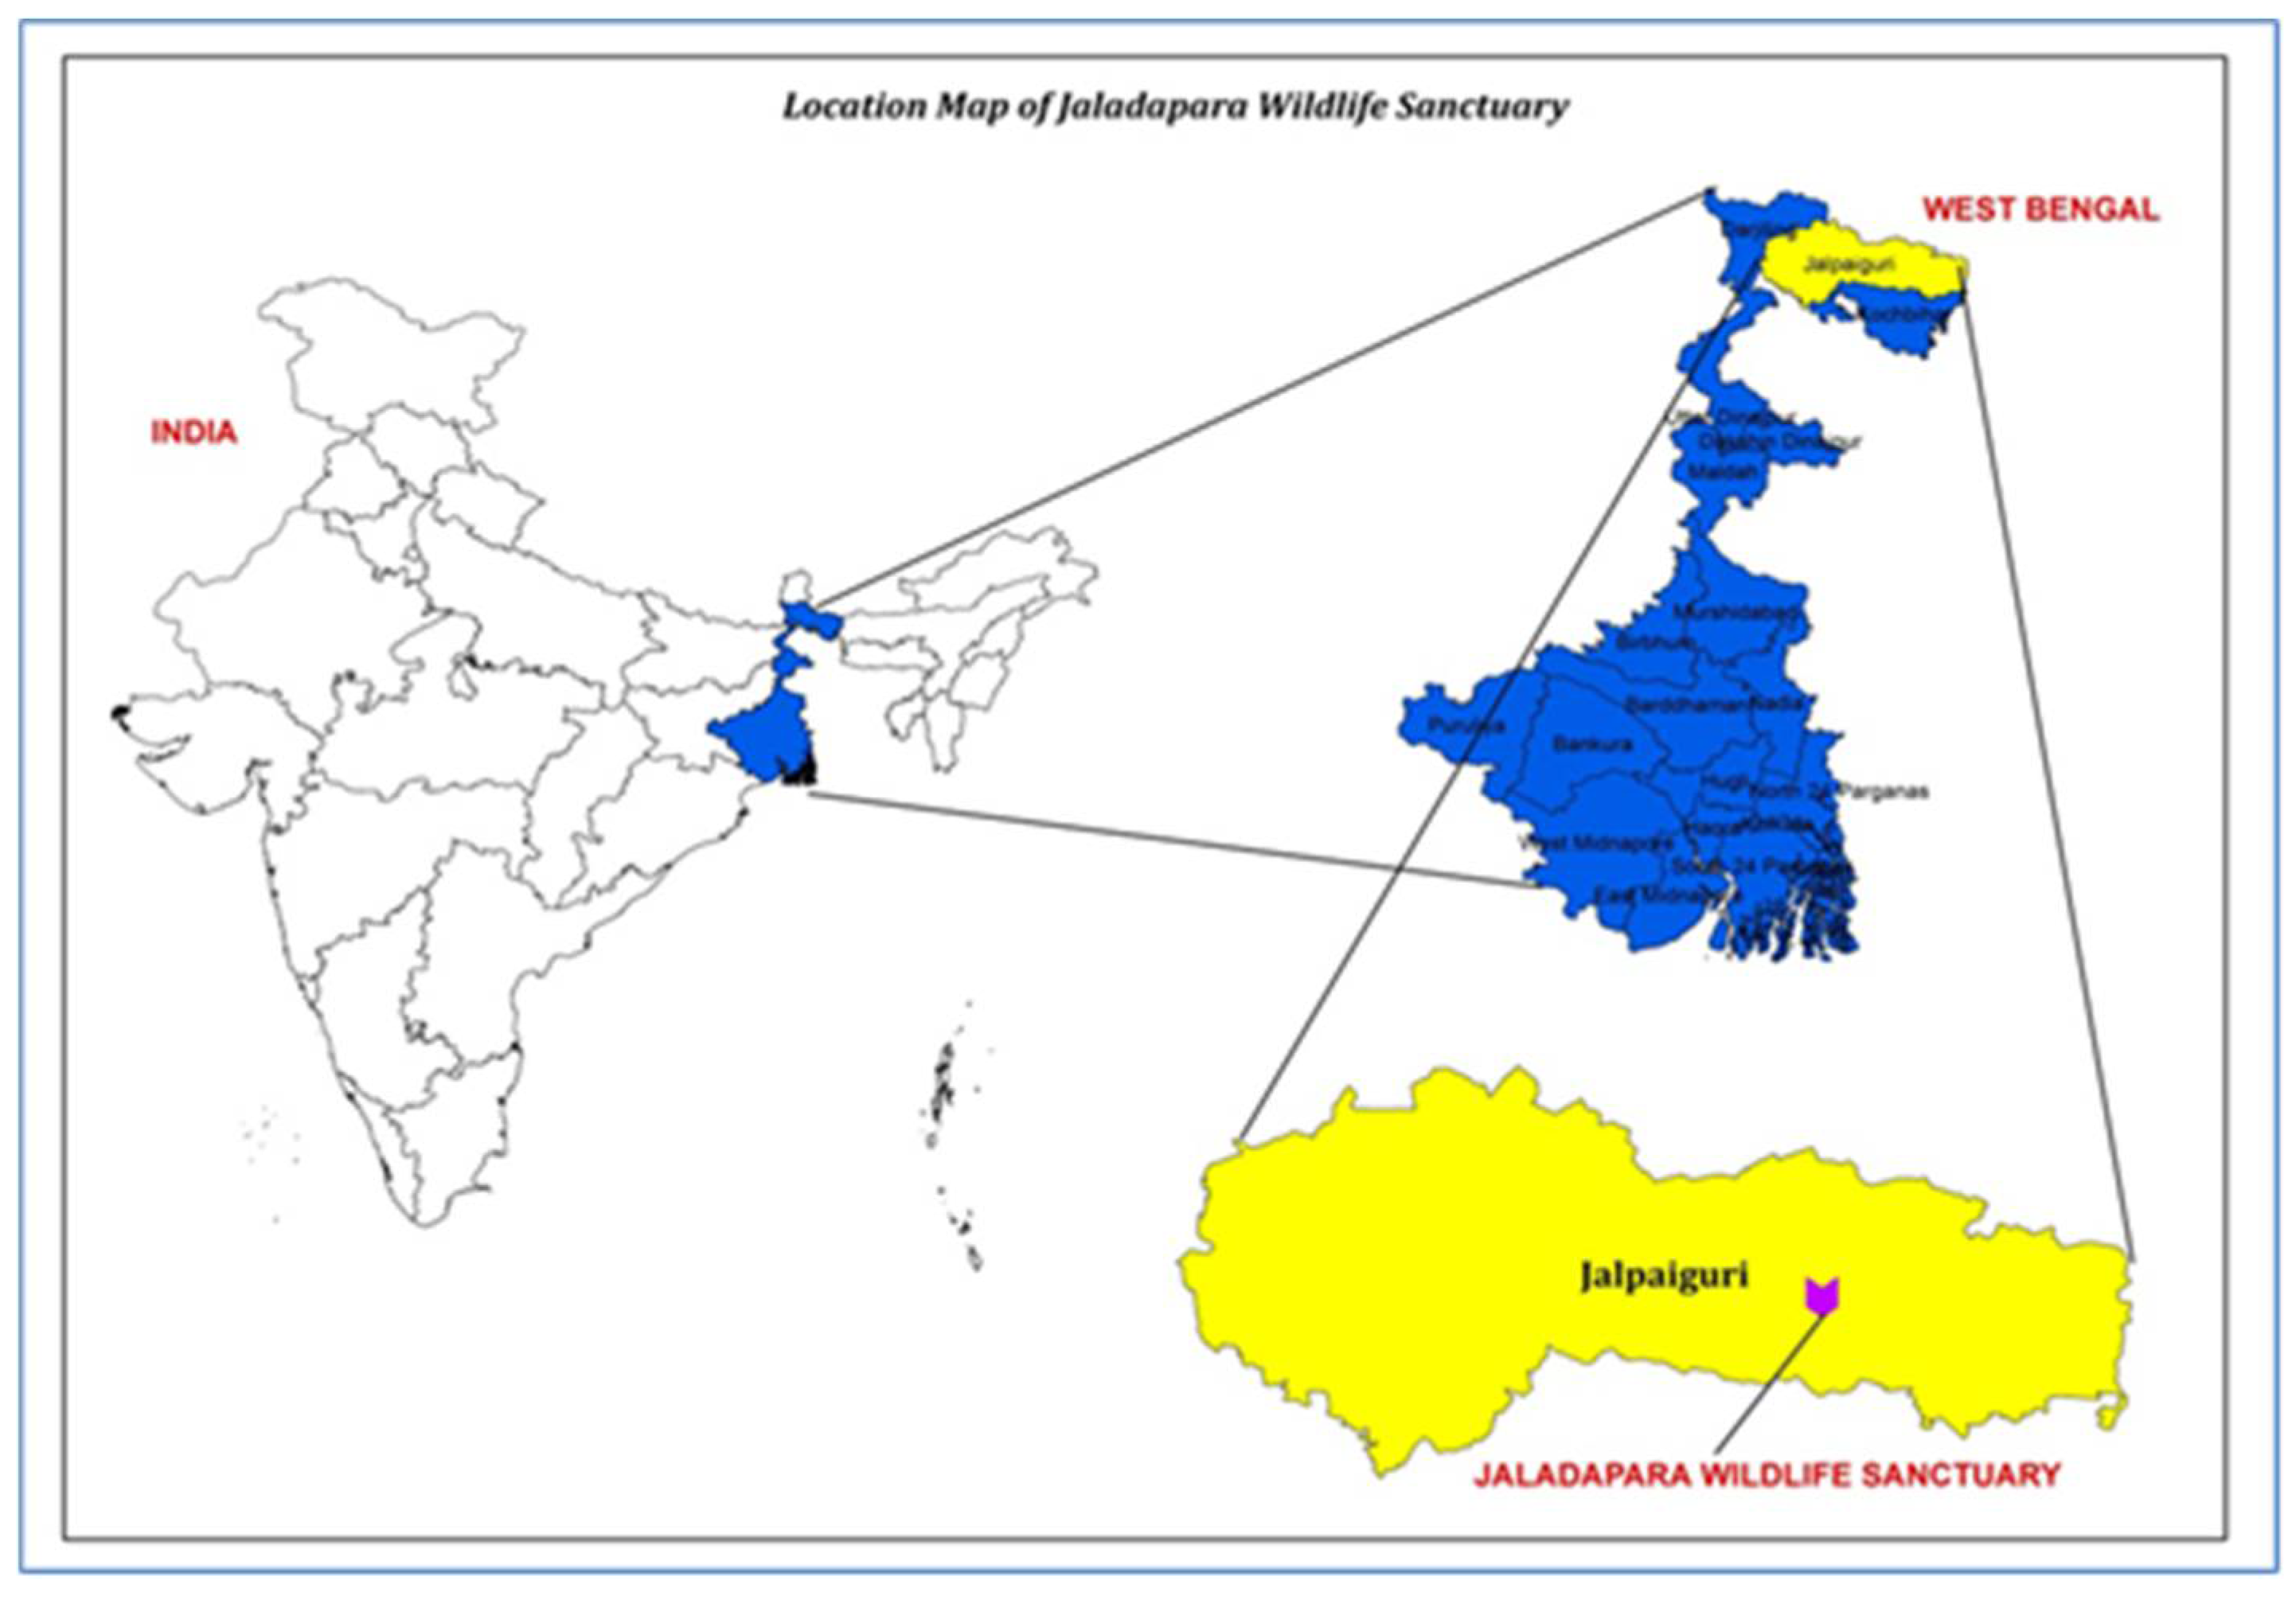
2.1. Site Description and Stand Structure

The study was conducted at Jaldapara National Park (JNP) in the foothills of the Eastern Himalayas in the Terai region of West Bengal, India along the bank of the Torsa River (Scheme 1). The National Park is one of the largest habitats of great Indian one-horned Rhinoceros (Rhinoceros unicornis L.) in India.
The GPS (Germin-72) coordinates of the study site recorded were in between 25°58′ N and 27°45′ N latitude and 89°08′ E and 89°55′ E longitude, at an elevation of 47 m above mean sea level (m.a.s.l). The study area falls under the Moist Tropical Zone (Anon., 2001), where annual rainfall is about 2600 mm and the relative humidity varies between 46% and 94%. The highest summer and the lowest winter temperatures recorded during the study period were 36 °C (April-May) and 6 °C (February), respectively (Figure 1). The soil of the region is generally acidic, with a high amount of organic carbon and medium available of nitrogen, phosphorus, and potassium [12].
Forest stands were classified based on their composition of dominant tree species as pure stand (≥75% of the tree population is single species); single species dominant stand (i.e., 50–75% are single species); mixed stand (25–50% are single species) and miscellaneous stand with <25% of stand species comprising single species [1,2]. Based on this classification, five types of stands were classified, of which four were of single species dominant and one was of a miscellaneous stand (MS). The four single species dominant stands were Tectona grandis (TGDS), Shorea robusta (SRDS), Michelia champaca (MCDS), and Lagerstroemia parviflora (LPDS).
In the entire five stands, a total of 50 sampling plots (quadrats) were marked. In each stand, 10 quadrats were selected with the help of stratified random nested quadrate sampling methods for soil and litter sampling. In each sampling plot (quadrats), three different soil depths, i.e., 0–20, 20–40, and 40–60 cm, were taken to collect soil samples. Collected samples were further processed, i.e., oven dried (at 80 °C till constant weight), grinded and sieved (through 2 mm pore), and were stored in cloth bags for analysis. Litter samples were also collected once from three different quadrats (each of 1 m × 1 m size) placed diagonally in each quadrat. The entire marked spot in each quadrate was cleared and swept of all the deposited debris/litter. The collected debris was air-dried in the shade and then weighed to quantify the litter production in mega grams per hectare (Mg ha−1) for each stand separately. After weighing, some of the dried litters collected were also grounded separately from each quadrate for further analysis. Moreover, nine meshed (mesh diameter 2 mm) nylon bags (size 15 cm × 15 cm) were filled with 25 g dried grounded litter and then buried on the forest floor of each quadrate (three each in three separate spots of every quadrate from which litter was collected) for decomposition. One bag from each three spots of every quadrate was retrieved after every three months. The decomposed litters were air-dried in shade at the laboratory and ground for analysis every time they were collected [13]. Soil moisture, electrical conductivity and pH were estimated through the volumetric method, with a Solubridge conductivity meter and Beckman’s pH meter [14]. Available soil organic carbon, nitrogen, phosphorus and potassium were estimated following Walkley and Black’s rapid titration method, modified Kjeldahl method, and Brays method, respectively [14,15].

2.2. Computation of Indices

Soil fertility was quantified with the help of soil fertility index SFI [16] and soil evaluation factor, SEF [17]. The following equations were used:
SFI = pH + organic matter content (%) + available P + exchangeable K (ceq kg−1, dry soil) + exch. Ca (ceq kg−1, dry soil) + exch. Mg (ceq kg−1, dry soil) − exch. Al (ceq kg−1, dry soil)
SEF = [exch. K + exch. Ca + exch. Mg − log (1 + exch. Al)] × organic matter content + 5
Exchangeable cations, i.e., calcium (Ca), potassium (K), and magnesium (Mg) were extracted with ammonium acetate (1 M at pH 7.0). Potassium content was estimated through flame photometry, while Ca and Mg were estimated through ethylene diamine tetraacetic acid (EDTA) titration. Exchangeable Al was estimated using 1 N potassium chloride (I N)) solution titrated with sodium hydroxide (0.1 N) solution.

2.3. Soil Organic Carbon (SOC) Stock

SOC stock for a given soil depth was quantified in mega grams per ha−1 (Mg ha−1) as a product of soil organic carbon content, bulk density and soil depth [18].

2.4. Statistical Analysis

Analytical statistical methods like regression, correlation, and one-way ANOVA were used for data analysis using SPSS version 17 (VSN International, Oxford, UK).

3. Results and Discussion

3.1. Litter Production and Decomposition

The litter production, its subsequent rate of decomposition and leftover litter quantity in three months intervals over the yearly period of all five stands are given in Table 1. It non-significantly varied among the stands initially, throughout the year during decomposition and the end of the year also.
The maximum amount of litter was produced by MCDS (13.9 Mg ha−1) followed by MS (13.4 Mg ha−1), LPDS (13.2 Mg ha−1), SRDS (10.6 Mg ha−1), and minimum by TGDS (8.9 Mg ha−1). A comparable amount of annual litter fall of 4.33–8.39 Mg ha−1 was also reported from various stands in a forest [1]. Primary productivity of the stands can be indicated by its amount of litter production because of nutrient cycling nutrients and OM is returned to the system [10,19,20]. Litter production also indicates the productivity of the stands, i.e., higher the litter production, the higher the productivity because on decomposition it releases energy and nutrients [21], primarily nitrogen [22]. Litter is thus a crucial link providing an interrelationship of plant communities and their productivity with the forest ecosystem processes [23] as it is the primary source of OM for soils in forests [24].
The release of nutrients after decomposition of litter in all the stands was highest during the first trimester (5.2, 3.3, 6.0, 4.3, and 5.6 Mg ha−1) and then progressively decreased throughout the year. The minimum return in all the stands was during the last trimester (0.7, 0.5, 1.1, 0.8 and 0.9 Mg ha−1). Litter decomposition is generally influenced by the decomposer community, tree species attributes like foliage properties and chemical composition of litter (e.g., nutrients, nature of element and lignin content) along with its geographical location, i.e., like soil properties and climate [25,26,27,28,29] and management practices followed [30]. The rate of litter decomposition in terms of trimester intervals in all the stands was highest during first trimester (1.1–2.0 Mg ha−1 month−1), which then gradually decreased throughout the year of the second trimester with the rate of 1.0–1.33 Mg ha−1 month−1, third trimester rate of 0.67–1.17 Mg ha−1 month−1 and the lowest decomposition rate during the last trimester with 0.17–0.37 Mg ha−1 month−1. During the initial period of decomposition, the soft and tender parts of the litter material decomposed quickly, leaving the hard wood materials, which decomposed slowly, lowering the rate of decomposition [31]. Despite favorable conditions, the rate of decomposition was lowest in the last quarter; as the remaining volume of litter was much lower (6.12–12.74% of the initial litter amount) after decomposition in first two quarters. In addition, litter quality varies with decomposition over time, changing the variables that cause the loss of litter mass as well [29]. The availability of ‘N’ and ‘P’ influences initial decomposition, while in the advanced stage lignin along with carbon is decomposed [32].
Among the stands, the rate of decomposition varied but non-significantly because the tree species of the stands were different [33] and subsequently produced a different amount and quality of litter varied in the species-specific micro-environment like fertility, temperature, humidity, relative humidity, faunal and microbial communities [34,35,36]. The MCDS has a higher rate of decomposition as compared to other stands throughout the year, except during the third trimester (2.0, 1.33, 0.77, and 0.37 Mg ha−1 month−1) when it was higher in LPDS (1.17 Mg ha−1 month−1) and MS (1.07 Mg ha−1 month−1). This high rate of decomposition is mainly due to favorable temperatures and relative humidity for litter degradation [35]. Similarly, TGDS had a lowest rate of decomposition in all the trimesters (1.1, 1.0, 0.67, and 0.17 Mg ha−1 month−1). The decomposed material gradually increased with time and after the end of the year, almost all the litter produced in the five stands was decomposed (LPDS-13.1 Mg ha−1, TGDS-8.8 Mg ha−1, MCDS-13.4 Mg ha−1, SRDS-10.4 Mg ha−1, and MS-13.2 Mg ha−1) due to occurrence of favorable climatic conditions (Figure 1) and soil moisture regime in the study area (Table 2).
In other words, the litter decomposition in this stand produced a material turnover (i.e., amount of litter decomposed in 12 months) of 8.8–13.4 Mg ha−1 or 96.46–99.34% of the initial litter mass, indicating that the turnover rate (time required to decompose 95% of litter) of these stands is only 12 months. The study site, i.e., Jaldapara National Park, is a moist deciduous forest with a humid tropical climate [37]. Deciduous forests in humid tropics were reported to have a faster turnover rate than any other forests [38,39] due to optimum climatic conditions for the microbial activity responsible for rapid and complete litter decomposition [40,41,42]. The litters produced by the deciduous trees are of a high quality, which decomposes rapidly, resulting in faster nutrient cycling and turnover of nutrients [43,44].

3.2. Soil pH, EC (m mhos Decisiemens m−1) and Moisture (%)

The pH, EC and soil moisture of different stands at three soil depths is given in Table 2. The pH of the stands was statistically similar and moderately acidic in the range of 4.61–4.98 at 0–20 cm; 4.83–5.20 at 20–40 cm and 5.09–5.52 at 40–60 cm soil depth. The topmost soil layer in all the stands was more acidic than the layers below it. Higher OM accumulation on the top-most layers of forest soils increases its acidity with a pH in the range of 5.0–6.8 [45]. In all the stands, as the soil depth increased, the acidity decreased gradually but very nominally [1]. Mildly acidic soil pH of 5.98–6.67 was reported for Pinus roxburghii, Tectona grandis and Eucalyptus stands while soil under Shorea robusta stand was moderately acidic with a pH of 4.65–5.97 [46]. The undisturbed nature of the forest soils and the rapid leaching of its bases due to faster litter decomposition enhances the weathering process increases the soil EC, while decreasing the pH [47]. Moreover, accumulation of OM in the soil decreases the subsequent decomposition rate, which releases acids, further reducing the soil pH [48]. This explains the pH value of less than five in all the stands.
EC of the stands varied significantly at the surface layer and at 0–60 cm depth, while soil moisture did not vary significantly throughout the soil profile examined. Non-significant soil parameters in the stands were due to similar site quality factors or similar micro-climatic conditions. Similar EC values were also reported from forest plantations [1,49,50]. The soil moisture in all the stands was estimated to be in the range of 22.91–28.61% at 0–20 cm, 26.87–33.53% at 20–40 cm, and 30.55–34.92% at 40–60 cm soil depth, while at these depths the EC was in the range of 0.24–0.45, 0.31–0.65 and 0.33–0.44 m mhos decisiemens m−1, respectively. Higher soil moisture in the forest was reported to be influenced by factors like rainfall, radiation received, humidity, and temperature, along with its vegetation structure and function [1,5]. Higher rainfall and humidity of the study (Figure 1) was thus a factor of high soil moisture in the stands. More or less continuous canopy cover of the stands had intercepted most of the solar radiation, which reduced the evaporation rate from the soil floor of the stands, thereby conserving high soil moisture. High OM of forest soil also substantiates soil moisture conservation by retaining moisture up to 20 times of its mass, reducing evaporation and increasing infiltration [51]. This explains higher soil moisture in MS as compared to other stands, as MS has a comparatively higher production of OM in the form of litter.

3.3. Litter Available ‘N’, ‘P’ and ‘K’ Release

The available ‘N’, ‘P’ and ‘K’ content (%) and the amount (Mg ha−1) in fresh and decomposing litter with their periodic release into the soil are given in Table 3, which was also generally similar among the stands.
Nutrient cycling varies from species to species due to species-specific leaf litter nutrient flux with biotic and abiotic environments below their canopy [35]. However, in mixed forest stands, the species-specific conditions may differ from pure or dominant species stands due to positive, negative or neutral interactions among the litter of different species [52]. In fresh litter, the highest ‘N’ content of 2.02% and amounts of 0.27 Mg N ha−1 was estimated for SRDS and MS, respectively. Similarly, the lowest ‘N’ content of 1.2% and amount of 0.17 Mg N ha−1, respectively were estimated for MCDS. The lowest amount of ‘N’ in fresh litter was also estimated for TGDS, which has an ‘N’ content of 1.96%. The highest ‘P’ content of 1.23% and amount of 0.16 Mg P ha−1 was estimated for MS, while the lowest ‘P’ content of 0.90% and amount of 0.09 Mg P ha−1 was estimated for MCDS and SRDS, respectively. SRDS was estimated with highest ‘K’ content of 1.80% but the highest ‘K’ amount of 0.23 Mg K ha−1 was estimated for MS. Similarly, the lowest ‘K’ content of 1.05% and amount of 0.15 Mg K ha−1 were both estimated for MCDS. Moreover, TGDS was also estimated with the lowest ‘K’ amount of 0.15 Mg K ha−1 but was estimated to have a higher ‘K’ content (1.65%) than the MCDS. The amount of the nutrient release from the litter not only depends on the content of the nutrients but also is a function of the amount of the litter produced. A similar high and low trend of content and amount of these available nutrients was exhibited in all the stands during all the trimesters as litter decomposed advanced over a yearly period [1].
The content and amount of these nutrients decreased gradually in all the stands as decomposition progressed and was lowest in the third trimester, which was in the range of 0.09–0.21% and 0.01–0.03 Mg N ha−1; 0.16–0.20% and 0.02–0.03 Mg K ha−1; and 0.07–0.19% and 0.01–0.03 Mg P ha−1. The trend of total available ‘N’, ‘P’ and ‘K’ and its periodic change was also similar to its content [1]. The total return amount of these available nutrients from litter after decomposition over the yearly period cumulated for three trimesters was almost equal to the amount in fresh litter of all studied stands. The return amount of available ‘N’, ‘K’ and ‘P’ after one year of litter decomposition in LPDS was 0.19, 0.16 and 0.14 Mg ha−1, respectively; in MCDS it was 0.15, 0.12 and 0.12 Mg ha−1, respectively; in SRDS it was 0.19, 0.17 and 0.11 Mg ha−1, respectively; in TGDS it was 0.16, 0.13 and 0.08 Mg ha−1, respectively and in MS it was 0.24, 0.20 and 0.13 Mg ha−1, respectively. The amount of these released nutrients from the initial litter mass was 0.20, 0.18 and 0.15 Mg ha−1, respectively for LPDS; 0.17, 0.15 and 0.13 Mg ha−1, respectively for MCDS; 0.21, 0.19 and 0.12 Mg ha−1, respectively for SRDS; 0.17, 0.15 and 0.09 Mg ha−1, respectively for TGDS and 0.27, 0.23 and 0.16 Mg ha−1, respectively for MS. There was no net change in the amount of these available nutrients at the stands indicating homeostasis. A similar variation in the release of nutrients from the decomposition of litter in stands has been reported from Sal, Chir pine, and Teak plantation [53] and Sal > Teak > Pine > Eucalypts [44].
Nutrient release after litter decomposition initiates mineralization, rendering these released nutrients to be available in the soil. This process is influenced by litter quality, environmental factors, and soil organisms [54,55]. There was a periodic variation in the litter content of these available nutrients. Release of ‘N’ and ‘K’ was slow during the earlier stages of litter decomposition in the stands, while it increased during the latter stages, but no such variation in ‘P’ release was observed in the stands as was also reported for other tropical forests [56]. It was reported that the trend of total nutrient return was similar to total litter production, i.e., the higher the litter fall and its nutrient content, the more nutrients were released [1,5]. The available ‘N’, ‘P’ and ‘K’ in the soil of different stands at different soil depths did not differ significantly among the stands (Table 4).
The data indicate that the soil of all the stands is low in available ‘N’ and high in available ‘P’, except for the TGDS, which was medium in available ‘P’ and low in available ‘K’ [57]. The availability of these nutrients was in the order N > K > P, similar to that reported by Pande [5]. The availability of these nutrients also decreased gradually with the increasing soil depth, as was also reported in earlier studies [1,58]. These available soil nutrients of all stands varied significantly at all the soil depths studied. At these depths (0–20, 20–40 and 40–60 cm), the range of available ‘N’ estimated was 0.23–0.29, 0.21–0.26 and 0.15–0.22 Mg ha−1, respectively; available ‘K’ was 0.14–0.16, 0.13–0.15 and 0.10–0.13 Mg ha−1, respectively; and available ‘P’ was 0.11–0.13, 0.09–0.13 and 0.06–0.11 Mg ha−1, respectively. MS was quantified with the highest available amount of ‘N’, ‘P’ and ‘K’ at all the soil depths, except for the amount of available ‘K’ at 20–40 and 40–60 cm soil depths. This is because MS was most diverse with the dense undergrowth producing more OM, which was decomposed to release more nutrients [59]. The higher amount of available ‘P’ in MS might be due to its deep mining by the tree roots subsequently recycled by litter decomposition [60]. The exchangeable ‘Al’, ‘Ca’ and ‘Mg’ cations of different stands are given in Table 5, which also varied non-significantly among the stands.
Exchangeable nutrient cations (Al, Ca and Mg) varied significantly among the stands (Table 5). Higher accumulation of Ca in the deepest soil layer in some stands explains the pH at that particular depth. No consistent trend was observed in the content of these exchangeable nutrients. Similar behaviour of these exchangeable cations in forest soil and other land uses was also observed by Panwar et al. [60] The Pearson correlation matrix also indicates significant positive correlations between SOC, ‘N’ and ‘K’ (Table 6).
Soils under plantation of many tree species and forest stands were reported to be well supplied with ‘N’, ‘P’ and ‘K’ [1,61] because the availability of nutrients in soil is strongly correlated with the content of nutrients in the litter [62]. Organic matter produced by litter decomposition influences the physico-chemical properties and the availability of nutrients in the soil [63], which was reported to be similar for locations with similar site quality factors or with similar micro-climatic conditions [47,64]. Plant community structures and its productivity in an ecosystem are primarily influenced by the amount of nutrients present in its soil [65].
The productivity of the forest ecosystem can be related to its soil fertility status [60]. The amount of litter produced by the forest stands and the amount returned to the soil defines the soil fertility status of the stands [5,13,20,22,23,43,48], which is quantified with help of soil fertility indices [60]. Soil fertility indices of different stands estimated at all the depths quantified did not vary significantly (Figure 2, Figure 3, Figure 4 and Figure 5), indicating a similar fertility status of these entire studied stands. This was because of the similar soil parameters, soil and primary nutrient statuses, along with similar litter production and return of nutrients after litter decomposition in these different stands. The estimated values of SFI at 0–20, 20–20 and 40–60 cm soil depths are in the range of 5.35–7.04, 5.94–7.73 and 6.08–7.34, while the corresponding SEF values are 5.7–6.0, 5.5–6.1 and 5.8–6.3, respectively. Similar higher values for both of these soil fertility indices from the Terai zone of West Bengal were reported by Panwar et al. [60] However, these fertility indices did not exhibit any significant relationship with soil parameters, which was due to statistically similar soil parameters and the fertility status of the different stands. Similar observations and significant correlations of SFI and SEF, indicating strong fertility status of the forest stand soils, were also reported earlier from the region [60].
The SOC content and its amount in the forest stands at different depths are given in Table 7.
The content and amount of SOC estimated under different soil depths were statistically at par, except at the surface soil layer, where SOC content significantly differed among the stands. The tree species of the stands, however, differed in their influence on the stock and composition of soil carbon [31], but overall, the stands produced similar amounts of litter, and consequently, the stands were also quantified with a similar amount of SOC build-up in their soil [66,67]. Moreover, the forest stands were defined on the basis of the proportion of tree species [1,2]. The single species dominant stands were also not 100% pure, i.e., such stands also contain at least 25% other species and as these stands were in a reserve forest, all the stands were abundant, with understorey vegetation. This might be the reason for non-significant variation of soil organic carbon among the stands, i.e., mixed species and single species dominant stands. The range estimated at 0–20 cm, 20–40 cm and 40–60 cm soil depths was 1.26–1.81% and 28.22–40.54 Mg C ha−1, 1.10–1.63% and 24.64–36.23 Mg C ha−1 and 1.03–1.38% and 23.07–30.91 Mg C ha−1 at 40–60 cm soil depth, respectively. Similar SOC contents and amounts were also reported by earlier studies from the forest of the Terai zone in West Bengal [1,61]. Among the stands, MS was estimated with the highest SOC (content and amount) at all soil depths, while the least was estimated for TGDS at all the depths, which can be related to the amount of litter produced.
Tree species cause a “bridging” effect between soil carbon and clay particles through their influence on cation chemistry, thereby reducing carbon decomposition [68,69]. In addition, low soil pH, resulting from the inputs of acidic tissues of various tree species, may enhance soil carbon accumulation through microbial inhibition [64]. This explains the higher carbon accumulation in MS as compared to stands dominated by other species. Moreover, differences in soil carbon stocks between stands can be attributed to differences in tree species, which had differences in litter quality and the quantity of tree species. Differences in the amount of litter produced may have affected litter decomposition rates, and eventually influenced soil carbon stocks [70]. Studies have established functional relationships between plant diversity and carbon storage [71,72,73,74,75,76,77,78,79] and higher carbon storage of MS than the species-dominated stands indicate this relationship. Higher plant assemblages with many species in the MS diversity resulted in a higher resource use efficiency, with higher productivity, litter production, and SOC than the species-dominated stands [80,81,82]. The soil in all the stands at all depths was high in organic carbon [57] due to higher litter production by the stands, adding corresponding amounts of OM in the soil. Moreover, SOC content and amount in the soil decreased with the increasing soil depth because OM in the soil also decreases with increasing soil depth. SOC is directly correlated with the amount of OM and the amount of litter added to the soil [83].
The total SOC estimate of 75.9–107.7 Mg C ha−1 up to 60 cm soil depth is similar to the estimate of 8.9–176.1 Mg ha−1 of the top 50 cm depth from tropical moist deciduous forests in India [84]. The present estimate of the studied stands is far lower than the national average of 182.94 Mg ha−1 [85]. SOC varies spatially from the local to the global [86] due to geographic variations [87] and also varies with increasing altitude [88]. SOC stock is crucial for an ecosystem. whether behaving as a sink or a source of carbon [89]. Tropical forests, especially humid ones, cannot accumulate a high amount of OM due to rapid litter decomposition rates [87]. This explains the total SOC stock in the studied forest stands in the Terai zone of West Bengal being lower than the national average. Moreover, SOC stock is positively correlated with total N, available P, and available K [45].

4. Conclusions

The stands were similar in soil parameters, such as pH, EC, moisture, available primary nutrients, fertility status and organic carbon. Litter production and periodic release of nutrients after litter decomposition were also similar in these stands. Consequently, all the stands were quantified with a similar amount of nutrients and soil organic carbon build up, which indicated a similar soil fertility status of these stands, either mixed-species stands or single-species dominant stands. However, the amount estimated for these parameters was highest for mixed-species stands. The available primary nutrients and organic carbon in the stand soil were strongly correlated with the higher amount of litter produced. This was because of the rapid release of nutrients and carbon into the soil after the complete decomposition of litter within a year in the stands. The present study was an area- and species-specific assessment of the carbon sequestration potential of different forest stands that also identified the best tree species-based land use among the most commercially important timber species in the Terai zone of West Bengal, India to conserve carbon and restrict emission. Mixed species stands in the forest are the best land use in terms of carbon sequestration (with respect to higher SOC build up) than single dominant species stands, though they were statistically similar. Therefore, the study advocates conserving forests in situ for climate change mitigation, while also recommends extending the carbon sequestration potential by promoting trees outside forests, particularly the species capable of enhancing avoided deforestation potential of the non-forested lands as well. This is because deforestation and increasing areas of degraded land require an urgent rehabilitation action through afforestation and reforestation drives to improve SOC stock and improve the fertility status of these lands, while also releasing pressure from the forests. Tectona grandis, Shorea robusta, Michelia champaca, and Lagerstroemia parviflora are the prominent commercial timber species of the region and thus can be used to rehabilitate the lands where there is little or no canopy to extend the carbon sink in agricultural or human-dominated landscapes and to enable these non-forested lands capable of avoided deforestation meeting the regional and national timber demands. The organic carbon sink in these soils will also aid effectively in increasing the biomass carbon to accumulate temporally. This is because SOC sequestration is believed to be a viable strategy to mitigate climate change through permanently converting atmospheric CO2. Managing soil carbon through such plantations will mitigate climate change in the sense of true sequestration, because it will not just be an emission avoided, but additionally there will be a net transfer of carbon from atmosphere to land, which can lead to the achievement of objectives set in the ambitious 4 per mille global initiative.

Author Contributions

P.R., V., A.M.K, G.S., S.C. designed the study, collected field data and developed the draft manuscript; J.AB., A.K., M.K., M.C.-P. and S.C. improved the manuscript for final submission. All authors have read and agreed to the published version of the manuscript.

Funding

This research received no external funding.

Informed Consent Statement

Not applicable.

Data Availability Statement

Data could be provided on reasonable request from the first author or the corresponding author.

Acknowledgments

We would like to express our gratitude to all those who helped us during the writing of this article. The authors are thankful to the reviewers for their constructive comments to improve the quality of the paper and farmers of the study area are highly acknowledged.

Conflicts of Interest

The authors declare no conflict of interest.

References

  1. Shukla, G.; Chakravarty, S. Vegetation Analysis and Production Potential of Chilapatta Reserve Forest Ecosystem of West Bengal. Ph.D. Thesis, Uttar Banga Krishi Viswavidyalaya, Behar, India, 2012; pp. 12–18. [Google Scholar]
  2. Rawat, R.S. Studies on interrelationship of woody vegetation, density and soil characteristics along an altitudinal gradient in a montane forest of Garhwal Himalayas. Indian For. 2005, 131, 991–995. [Google Scholar]
  3. Schimel, D.S. Terrestrial ecosystems and the carbon cycle. Glob. Chang. Biol. 1994, 1, 77–91. [Google Scholar] [CrossRef]
  4. Jha, M. A preliminary study of ecosystems and biodiversity in Lonar Crater. Indian For. 2003, 129, 1192–1200. [Google Scholar]
  5. Pande, P.K. Litter nutrient dynamics of Shorea robusta Gaertn. plantation at Doon Valley (Uttaranchal), India. Indian For. 2001, 127, 980–994. [Google Scholar]
  6. Bhadwal, S.; Singh, R. Carbon sequestration estimates for forestry options under different land use scenarios in India. Curr. Sci. 2002, 83, 1380–1386. [Google Scholar]
  7. Chhabra, A.; Palria, S.; Dadhwal, V.K. Growing stock-based forest biomass estimates for India. Biomass Bioenergy 2002, 22, 187–194. [Google Scholar] [CrossRef]
  8. Shadangi, D.K.; Nath, V. Litter decomposition in eucalyptus and pines plantations and natural Sal forests related to micro-arthropods in different season in Amarkantak, Madhya Pradesh. Indian For. 2006, 132, 420–428. [Google Scholar]
  9. Chacon, N.; Dezzeo, N. Litter decomposition in primary forest and adjacent fire-disturbed forests in the Gran Sabana, southern Venezuela. Biol. Fertil. Soils 2007, 43, 815–821. [Google Scholar] [CrossRef]
  10. Hossain, M.; Hoque, A.F. Litter production and decomposition in mangroves—A review. Indian J. For. 2008, 31, 227–238. [Google Scholar]
  11. Shukla, G.; Biswas, R.; Das, A.P.; Chakravarty, S. Plant diversity at Chilapatta Reserve Forest of Terai Duars in sub-humid tropical foothills of Indian Eastern Himalayas. J. For. Res. 2014, 25, 591–596. [Google Scholar] [CrossRef]
  12. Paul, S.C. Land Use Effects on Soil Characteristics of Terai Region of West Bengal. Master’s Thesis, Uttar Banga Krishi Viswavidyalaya, West Bengal, India, 2004. [Google Scholar]
  13. Pande, P.K. Litter Production and Decomposition, Mineral Release and Biochemical Diversity of Four Forest Stands at FRI Demonstration Area. Ph.D. Thesis, Garhwal University, Srinagar (Garhwal), Indian, 1986. Unpublished. [Google Scholar]
  14. Jackson, M.L. Soil Chemistry Analysis; Prentice Hall of India Pvt. Ltd.: New Delhi, India, 1967. [Google Scholar]
  15. Bray, R.H.; Kurtz, L.T. Determination of total, organic and available form of phosphorus in soils. Soil Sci. 1945, 59, 39–45. [Google Scholar] [CrossRef]
  16. Moran, E.F.; Brondizion, E.S.; Tucker, J.M.; Da Silva-Forsberg, M.C.; McCracken, S.; Falesi, I. Effects of soil fertility and land use on forest succession in Amazônia. For. Ecol. Manag. 2000, 139, 93–108. [Google Scholar] [CrossRef]
  17. Lu, D.; Moran, E.; Mausel, P. Linking Amazonian secondary succession forest growth to soil properties. Land Degrad. Dev. 2002, 13, 331–343. [Google Scholar] [CrossRef]
  18. De M. Sá, J.C.; Cerri, C.C.; Dick, W.A.; Lal, R.; Filho, S.P.V.; Piccolo, M.C.; Feigl, B.E. Organic matter dynamics and carbon sequestration rates for a tillage chronosequence in Brazilian Oxisol. Soil Sci. Soc. Am. J. 2001, 65, 1486–1499. [Google Scholar] [CrossRef]
  19. Takeda, H. A 5 year study of pine needle litter decomposition in relation to mass loss and faunal abundances. Pedobiologia 1988, 32, 221–226. [Google Scholar]
  20. Pande, P.K.; Sharma, S.C. Litter decomposition in some plantation (India). Ann. For. 1993, 1, 90–101. [Google Scholar]
  21. Swift, M.J.; Heal, O.W.; Anderson, J.M. Decomposition in Terrestrial Ecosystems; University of California Press: Los Angeles, CA, USA, 1979; p. 361. [Google Scholar]
  22. Xiao-wen, D.; Ying, L.; Shi-jie, H. Carbon and nitrogen dynamics in early stages of forest litter decomposition as affected by nitrogen addition. J. For. Res. 2009, 20, 111–116. [Google Scholar]
  23. Uriarte, M.; Turner, B.L.; Thompson, J.; Zimmerman, J.K. Linking spatial patter ns of leaf litter fall and soil nutrients in a tropical forest: A neighborhood approach. Ecol. Appl. 2015, 25, 2022–2034. [Google Scholar] [CrossRef] [PubMed] [Green Version]
  24. Bhat, J.A.; Kumar, M.; Kumar, A.; Negi, A.K.; Todaria, N.P.; Malik, Z.A.; Pala, N.A.; Kumar, A.; Shukla, G. Altitudinal gradient of species diversity and community of woody vegetation in the Western Himalayas. Glob. Ecol. Conserv. 2020, 24, e01302. [Google Scholar] [CrossRef]
  25. Ashton, C.E.; Hogarth, P.J.; Ormond, R. Breakdown of mangrove leaf litter in a managed mangrove forest in Peninsular, Malaysia. Hydrobiology 1999, 413, 77–88. [Google Scholar] [CrossRef]
  26. Tam, N.F.Y.; Wong, S.Y.; Lan, Y.C.; Wang, N.L. Litter production and decomposition in a subtropical mangrove swamp receiving wastewater. J. Exp. Mar. Biol. Ecol. 1999, 226, 1–18. [Google Scholar] [CrossRef]
  27. Hagen-Thron, A.; Callesen, I.; Armolaitis, K.; Nihlgard, B. The impact of six European tree species on the chemistry of mineral topsoil in forest plantations on former agricultural land. For. Ecol. Manag. 2006, 195, 373–384. [Google Scholar] [CrossRef]
  28. Berg, B.; McClaugherty, C. Plant Litter; Springer: Berlin/Heidelberg, Germany, 2008. [Google Scholar]
  29. Purahong, W.; Kapturska, D.; Pecyna, M.J.; Schulz, E.; Schloter, M.; Buscot, F.; Hofrichter, M.; Dirk Kruger, D. Influence of different forest system management practices on leaf litter decomposition rates, nutrient dynamics and the activity of ligninolytic enzymes: A case study from central European forests. PLoS ONE 2014, e93700. [Google Scholar] [CrossRef] [Green Version]
  30. Aponte, C.; Garcia, L.V.; Maranon, T. Tree species effect on litter decomposition and nutrient release in Mediterranean Oak Forests changes over time. Ecosystem 2012, 15, 1204–1218. [Google Scholar] [CrossRef] [Green Version]
  31. Berg, B.; Davey, M.; De Marco, A.; Emmett, B.; Faituri, M.; Hobbie, S.; Johansson, M.B.; Liu, C.; McClaugherty, C.; Norell, L.; et al. Factors influencing limit values for pine needle litter decomposition: A synthesis for boreal and temperate pine forest systems. Biogeochemistry 2010, 100, 57–73. [Google Scholar] [CrossRef]
  32. Jacob, M.; Viedenz, K.; Polle, A.; Thomas, F.M. Leaf litter decomposition in temperate deciduous forest stands with a decreasing fraction of beech (Fagus sylvatica). Oecologia 2010, 164, 1083–1094. [Google Scholar] [CrossRef] [Green Version]
  33. Austin, A.T.; Vivanco, L. Plant litter decomposition in a semi-arid ecosystem controlled by photo degradation. Nature 2006, 442, 555–558. [Google Scholar] [CrossRef] [PubMed]
  34. Aponte, C.; García, L.V.; Pérez-Ramos, I.M.; Gutiérrez, E.; Marañó, T. Oak trees and soil interactions in Mediterranean forests: A positive feedback model. J. Veg. Sci. 2011, 22, 856–867. [Google Scholar] [CrossRef] [Green Version]
  35. Kumar, A.; Sharma, M.P.; Yang, T. Estimation of carbon stock for greenhouse gas emissions from hydropower reservoirs. Stoch. Environ. Res. Risk Assess. 2018, 32, 3183–3193. [Google Scholar] [CrossRef]
  36. Champion, H.G.; Seth, S.K. A Revised Survey of the Forest Types of India; Manager of Publications: New Delhi, India, 1968. [Google Scholar]
  37. Kumar, A.; Sharma, M.P. Estimation of carbon stock of Balganga reserve forest, Uttarakhand, India. For. Sci. Technol. 2015, 11, 177–181. [Google Scholar]
  38. Pastor, J. Successional changes in nitrogen availability as a potential factor contributing to spruce declines in boreal North America. Can. J. For. Res. 1987, 17, 1394–1400. [Google Scholar] [CrossRef]
  39. Zhang, Z.S.; Li, X.R.; Liu, L.C.; Jia, R.L.; Zhang, J.G.; Wang, T. Distribution, biomass and dynamics of root in revegetated stand of Caragana korshinskii in the Tengger Desert, northwestern China. J. Plant Res. 2009, 122, 109–119. [Google Scholar] [CrossRef] [PubMed]
  40. Singh, J.S.; Gupta, S.R. Plant decomposition and soil respiration in terrestrial ecosystems. Bot. Rev. 1977, 43, 449–528. [Google Scholar] [CrossRef]
  41. Zhang, Q.F.; Song, Y.C.; Wu, H.Q.; You, W.H. Dynamics of litter amount and its decomposition in different successional stage of evergreen broad-leaved forest in Tiantong, Zhejiang, Province. Acta Phytoecol. Sin. 1999, 23, 250–255. [Google Scholar]
  42. Wang, J.; Huang, J.H. Comparison of major nutrient release patterns in leaf litter decomposition in warm temperate zone of China. Acta Phytoecol. Sin. 2001, 25, 375–380. [Google Scholar]
  43. Scott, N.A.; Binkley, D. Foliage litter quality and annual net N mineralization: Comparison across North America forest site. Oecologia 1997, 111, 151–159. [Google Scholar] [CrossRef]
  44. Pande, P.K.; Meshram, P.B.; Banerjee, S.K. Litter production and nutrient return in tropical dry deciduous teak forests of Satpura Plateau in central India. Trop. Ecol. 2002, 43, 337–344. [Google Scholar]
  45. Gairola, S.; Sharma, C.M.; Ghildiyal, S.K.; Suyal, S. Chemical properties of soils in relation to forest composition in moist temperate valley slopes of Garhwal Himalaya, India. Environmentalist 2012, 32, 512–523. [Google Scholar] [CrossRef]
  46. Jha, M.N.; Gupta, M.K.; Dimri, B.M. Soil organic matter status under different social forestry plantations. Indian For. 1999, 125, 883–890. [Google Scholar]
  47. Paudel, S.; Sah, J.P. Physiochemical characteristic of soil in Sal (Shorea robusta) forests in eastern Nepal. Himal. J. Sci. 2003, 1, 107–110. [Google Scholar]
  48. De Hann, S. Humus, its formation, its relation with the mineral part of the soil and its significance for soil productivity. In Organic Matter Studies; International Atomic Energy Agency: Vienna, Austria, 1977; pp. 21–30. [Google Scholar]
  49. Chakraborthy, R.N.; Chakraborthy, D. Changes in soil properties under Acacia auriculiformis plantation in Tripura. Indian For. 1989, 115, 272–273. [Google Scholar]
  50. Sharma, B.D.; Gupta, I.C. Effect of tree cover on soil fertility in western Rajasthan. Indian For. 1989, 115, 57–68. [Google Scholar]
  51. Stevenson, F.J. Humus Chemistry, 2nd ed.; Wiley: New York, NY, USA, 1994. [Google Scholar]
  52. Hattenschwiler, S.; Gasser, P. Soil animals alter plant litter diversity effects on decomposition. Proc. Natl. Acad. Sci. USA 2005, 102, 1519–1524. [Google Scholar] [CrossRef] [PubMed] [Green Version]
  53. Srivastava, P.B.L.; Kaul, O.N.; Mathur, R.N. Seasonal variation of nutrient in foliage and their return through leaf-litter in some plantation ecosystem. In Proceedings of the Symposium on Man-Made Forests in India, Dehradun, India, 8–10 June 1972. [Google Scholar]
  54. Kumar, A.; Sharma, M.P. Carbon stock estimation in the catchment of Kotli Bhel 1A Hydroelectric Reservoir, Uttarakhand, India. Ecotoxicol. Environ. Saf. 2016, 134, 365–369. [Google Scholar] [CrossRef]
  55. Upadhyay, S.D.; Singh, V.P. Microbial turnover of organic matter in litter decomposition in semi-arid grassland. Ecology 1981, 21, 100–109. [Google Scholar]
  56. Kumar, A.; Sharma, M.P. Estimation of Soil Organic Carbon in the Forest Catchment of two Hydroelectric Reservoirs in Uttarakhand, India. Hum. Ecol. Risk Assess. 2016, 22, 991–1001. [Google Scholar] [CrossRef]
  57. Tandon, H.L.S. Methods of Analysis of Soils, Plants, Waters, Fertilizers and Organic Manures; Fertilizer Development and Consultation Organization: New Delhi, India, 2005; p. 204. [Google Scholar]
  58. Jha, M.N.; Dimri, B.M. Soil nutrient and forest productivity in four stands. J. Indian Soc. Soil Sci. 1991, 39, 735–738. [Google Scholar]
  59. Srinivasan, U.M.; Caulfield, I. Agroforestry land management system in developing countries: An overview. Indian For. 1989, 115, 57–68. [Google Scholar]
  60. Panwar, P.; Pal, S.; Reza, S.K.; Sharma, B. Soil fertility index, soil evaluation factor, and microbial indices under different land use in acidic soil of humid subtropical India. Commun. Soil Sci. Plant Anal. 2011, 42, 2724–2737. [Google Scholar] [CrossRef]
  61. Koul, D.N. Carbon Sequestration Estimates of Various Land Uses in Terai Zone of West Bengal. Master’s Thesis, Uttar Banga Krishi Viswavidyalaya, Pundibari, India, 2004. [Google Scholar]
  62. Jerabkova, L.; Prescott, C.E.; Kishchuk, B.E. Nitrogen availability in soil and forest floor of contrasting types of boreal mixed wood forests. Can. J. For. Res. 2006, 36, 112–122. [Google Scholar] [CrossRef]
  63. Johnston, A.E. Soil organic matter, effects on soil and crops. Soil Use Manag. 1986, 2, 97–105. [Google Scholar] [CrossRef]
  64. Kumar, A.; Sharma, M.P.; Taxak, A.K. Effect of vegetation communities and altitudes on the SOC stock in Kotli Bhel-1A Catchment, India. Clean Soil Air Water 2017, 45, 1600650. [Google Scholar] [CrossRef]
  65. Binkly, D.; Vitousek, P.M. Soil nutrient availability. In Plant Physiological, Field Methods and Instrumentation; Pearcy, R.W., Ehleringer, J.R., Mooney, H., Rundel, P.W., Eds.; Champan and Hall: London, UK, 1989; pp. 75–96. [Google Scholar]
  66. Chauhan, M.; Kumar, M.; Kumar, A. Impact of carbon stocks of Anogeissus latifolia on climate change and socio-economic development: A case study of Garhwal Himalaya, India. Water Air Soil Pollut. 2020, 231, 1–15. [Google Scholar] [CrossRef]
  67. Rana, K.; Kumar, M.; Kumar, A. Assessment of annual shoot biomass and carbon storage potential of Grewia optiva: An approach to combat Climate Change in Garhwal Himalaya. Water Air Soil Pollut. 2020, 231, 1–13. [Google Scholar] [CrossRef]
  68. Dimri, B.M.; Jha, M.N.; Gupta, M.K. Status of soil nitrogen at different altitudes in Garhwal Himalaya. Van Vigyan 1997, 359, 77–84. [Google Scholar]
  69. Kumar, M.; Kumar, A. Carbon stock potential in Pinus roxburghii forests of Indian Himalayan regions. Environ. Dev. Sustain. 2021. [Google Scholar] [CrossRef]
  70. Sariyildiz, T.; Anderson, J.M. Interactions between litter quality, decomposition and soil fertility: A laboratory study. Soil Biol. Biochem. 2003, 35, 391–399. [Google Scholar] [CrossRef]
  71. Loreau, M. Biodiversity and ecosystem functioning: Recent theoretical advances. Oikos 2000, 91, 3–17. [Google Scholar] [CrossRef] [Green Version]
  72. Spehn, E.M.; Hector, A.; Joshi, J.; Scherer-Lorenzen, M.; Schmid, B.; Bazeley-White, E.; Beierkuhnlein, C.; Caldeira, M.C.; Diemer, M.; Dimitrakopoulos, P.G. Ecosystem effects of biodiversity manipulations in European grasslands. Ecol. Monogr. 2005, 75, 37–63. [Google Scholar] [CrossRef] [Green Version]
  73. Erskine, P.D.; Lamb, D.; Bristow, M. Tree species diversity and ecosystem function: Can tropical multi-species plantations generate greater productivity? For. Ecol. Manag. 2006, 233, 205–210. [Google Scholar] [CrossRef]
  74. Vila, M.; Vayreda, J.; Comas, L.; Ibanez, J.J.; Mata, T.; Obon, B. Species richness and wood production: A positive association in Mediterranean forests. Ecol. Lett. 2007, 10, 241–250. [Google Scholar] [CrossRef]
  75. Fornara, D.A.; Tilman, D. Plant functional composition influences rates of soil carbon and nitrogen accumulation. J. Ecol. 2008, 96, 314–322. [Google Scholar] [CrossRef]
  76. Healy, C.; Gotelli, N.J.; Potvin, C. Partitioning the effects of biodiversity and environmental heterogeneity for productivity and mortality in a tropical tree plantation. J. Ecol. 2008, 96, 903–913. [Google Scholar] [CrossRef]
  77. Piotto, D. A meta-analysis comparing tree growth in monocultures and mixed plantations. For. Ecol. Manag. 2008, 255, 781–786. [Google Scholar] [CrossRef]
  78. Ruiz-Jaen, M.C.; Potvin, C. Can we predict carbon stocks in tropical ecosystems from tree diversity? Comparing species and functional diversity in a plantation and a natural forest. New Phytol. 2010, 189, 978–987. [Google Scholar] [CrossRef]
  79. Zhang, Y.; Duan, B.; Xian, J.R.; Korpelainen, H.; Li, C. Links between plant diversity, carbon stocks and environmental factors along a successional gradient in a subalpine coniferous forest in Southwest China. For. Ecol. Manag. 2011, 262, 361–369. [Google Scholar] [CrossRef]
  80. Vandermeer, J. The Ecology of Intercropping; Cambridge University Press: Cambridge, UK, 1989; p. 249. [Google Scholar]
  81. Catovsky, S.; Bradford, M.A.; Hector, A. Biodiversity and ecosystem productivity: Implications for carbon storage. Oikos 2002, 97, 443–448. [Google Scholar] [CrossRef]
  82. Kirby, K.R.; Potvin, C. Variation in carbon storage among tree species implications for the management of a small scale carbon sink project. For. Ecol. Manag. 2007, 246, 208–221. [Google Scholar] [CrossRef]
  83. Singh, P.; Dubey, P.; Jha, K.K. Biomass production and carbon storage at harvest age in superior Dendrocalamus strictus plantation in dry deciduous forest region in India. In Proceedings of the Abstract Volume of VIIth World Bamboo Congress, Proceedings of the VIIth World Bamboo Congress, New Delhi, India, 27 February–4 March 2004. [Google Scholar]
  84. Chhabra, A.; Dhadwal, V.K. Forest soil organic carbon pool: An estimate and review of Indian studies. Indian For. 2005, 131, 201–214. [Google Scholar]
  85. Jha, M.N.; Gupta, M.K.; Saxena, A.; Kumar, R. Soil organic carbon store in different forest in India. Indian For. 2003, 129, 715–724. [Google Scholar]
  86. Scharlemann, J.P.; Tanner, E.V.; Hiederer, R.; Kapos, V. Global soil carbon: Under-standing and managing the largest terrestrial carbon pool. Carbon Manag. 2014, 5, 81–91. [Google Scholar] [CrossRef]
  87. Minasny, B.; Malone, B.P.; McBratney, A.B.; Angers, D.A.; Arrouays, D.; Chambers, A.; Chaplot, V.; Chen, Z.-S.; Cheng, K.; Das, B.S.; et al. Soil carbon 4 per mille. Gederma 2017, 292, 59–86. [Google Scholar] [CrossRef]
  88. Bhat, J.A.; Kumar, M.; Negi, A.K.; Pala, N.A.; Todaria, N.P. Soil organic carbon stock and sink potential in high mountain temperate Himalayan forests of India. Int. J. Curr. Res. 2012, 4, 206–209. [Google Scholar]
  89. Woomer, P.L.; Martin, A.; Albrecht, A.; Reseck, D.V.S.; Scharpenseel, H.W. The importance and management of soil organic matter in the tropics. In The Biological Management of Tropical Soil Fertility; Woomer, P.L., Swift, M.J., Eds.; Wiley: Chichester, UK, 1994. [Google Scholar]
Scheme 1. Map of the study area.
Land 10 00435 sch001
Figure 1. Rainfall, temperature and relative humidity of the study area.
Land 10 00435 g001
Figure 2. Soil fertility index of the stands at different soil depths.
Land 10 00435 g002
Figure 3. Soil fertility indices of the stands irrespective of soil depth.
Land 10 00435 g003
Figure 4. Soil evaluation factor of different stands at different soil depths.
Land 10 00435 g004
Figure 5. Soil evaluation factor of different stands irrespective of soil depth.
Land 10 00435 g005
Table 1. Litter production and its progressive decomposition rate in different stands.
StandILMDecomposition
(of Total Litter %)
Litter Decomposed
(Mg ha−1/3 Months)
TD
MarJunSeptDecMarJunSeptDec
LPDS13.2a39.567.693.999.35.2ab3.7a3.5a0.7b13.1a
MCDS13.9a43.172.288.396.56.0a4.0a2.3b1.1a13.4a
SRDS10.6b40.369.990.398.54.3c3.1c2.2b0.8b10.4b
TGDS8.90c37.071.193.198.83.3d3.0c2.0b0.5c8.8c
MS13.4a41.668.091.498.25.6a3.5ab3.2a0.9b13.2a
SEm0.130.110.120.020.060.090.070.050.050.08
SEd0.180.150.160.020.090.120.100.070.070.11
P = 0.050.400.330.360.050.190.270.230.160.160.24
Where TGDS: Tectona grandis, SRDS: Shorea robusta, MCDS: Michelia champaca, LPDS: Lagerstroemia parviflora and MS: miscellaneous stand; ILM: initial litter mass in Mg ha−1; TD: total decomposition in Mg ha−1.
Table 2. Soil pH, EC and moisture in different stands.
StandsSoil Parameter/Soil Depth
pHEC
(m mhos Decisiemens m−1)
Soil Moisture
(%)
0–20 cm20–40 cm40–60 cm0–20 cm20–40 cm40–60 cm0–20 cm20–40 cm40–60 cm
LPDS4.614.835.130.370.420.4426.0333.5334.35
MCDS4.744.935.180.240.390.3822.9126.8731.26
SRDS4.765.205.520.350.400.3324.7632.6334.57
TGDS4.914.985.090.450.310.3723.1527.7630.55
MS4.985.125.320.410.650.4328.6130.2334.92
SEm0.140.100.080.010.020.010.020.540.01
SEd0.200.140.110.020.030.020.030.760.02
P = 0.050.440.300.230.040.060.040.071.660.05
Table 3. Initial and periodic available ‘N’, ‘P and ‘K’ in litter of different stands during decomposition.
StandsJanMarJunSeptRS *
ICIQDCDQ 1DCDQ 2DCDQ 3
Nitrogen
LPDS1.550.201.20.160.930.120.090.010.19
MCDS1.20.170.920.130.630.090.120.020.15
SRDS2.020.211.670.170.850.090.140.020.19
TGDS1.960.171.460.130.810.070.140.010.16
MS1.980.271.430.190.830.110.210.030.24
SEm0.070.010.050.0040.040.010.010.010.02
SEd0.100.020.070.010.060.010.010.010.02
P = 0.050.230.040.160.010.130.020.020.020.05
Phosphorus
LPDS1.150.150.940.120.580.080.100.010.14
MCDS0.900.130.750.100.420.060.070.010.12
SRDS1.170.120.950.100.380.040.110.010.11
TGDS1.020.090.950.080.380.030.110.010.08
MS1.230.161.110.150.920.120.190.030.13
SEm0.070.010.030.030.020.010.020.100.01
SEd0.090.010.050.040.030.030.030.120.01
P = 0.050.210.030.100.010.060.040.070.250.03
Potassium
LPDS1.360.181.060.140.810.110.160.020.16
MCDS1.050.150.950.130.620.090.180.030.12
SRDS1.800.191.290.140.730.080.210.020.17
TGDS1.650.151.290.110.730.060.210.020.13
MS1.750.231.390.190.970.130.200.030.20
SEm0.140.050.010.040.200.030.040.010.04
SEd0.200.070.020.050.330.050.060.010.06
P = 0.050.400.150.040.110.060.110.120.030.13
IC: initial content (%); IQ: initial quantity (Mg ha−1); DC: decomposed content (%); DQ1: decomposed quantity (Mg ha−1); RS *: return to soil = (IQ – DQ 1) + (DQ 1 – DQ 2) + (DQ 2 – DQ 3).
Table 4. Available ‘N’, ‘P’ and ‘K’ in soil of different stands.
StandsSoil Nutrients/Depth
Available N (Mg ha−1)Available P (Mg ha−1)Available K (Mg ha−1)
0–20 cm20–40 cm40–60 cm0–20 cm20–40 cm40–60 cm0–20 cm20–40 cm40–60 cm
LPDS0.270.230.190.130.110.100.150.150.125
MCDS0.260.220.160.120.100.080.160.130.115
SRDS0.260.220.150.120.100.080.150.130.126
TGDS0.230.210.190.110.090.060.140.130.108
MS0.290.260.220.130.130.110.160.130.096
SEm0.070.060.050.030.030.030.040.040.03
SEd0.100.090.070.050.050.040.060.050.05
P = 0.050.230.190.160.110.090.080.130.130.10
Table 5. Exchangeable ‘Al’, ‘Ca’ and ‘Mg’ in soil of different stands.
StandsSoil Depth
0–20 cm20–40 cm40–60 cm
Exchangeable Al (c mol Kg−1)
LPDS1.161.381.09
MCDS1.111.191.09
SRDS1.030.960.91
TGDS0.950.880.77
MS1.261.681.49
SEm0.060.050.02
SEd0.080.070.04
P = 0.050.180.150.08
Exchangeable Ca (c mol Kg−1)
LPDS0.630.610.68
MCDS0.610.610.57
SRDS0.570.550.62
TGDS0.430.400.32
MS0.710.690.72
SEm0.040.020.02
SEd0.050.030.02
P = 0.050.120.060.05
Exchangeable Mg (c mol Kg−1)
LPDS0.190.200.20
MCDS0.170.170.17
SRDS0.180.180.19
TGDS0.140.120.11
MS0.220.230.23
SEm0.010.020.02
SEd0.020.020.02
P = 0.050.040.050.05
Table 6. Pearson correlation coefficients between different soil properties irrespective of stands and soil depth.
OCNPKMgCaAlpHECSMSEFSFI
Overall (0–60 cm Soil Depth)
OC1
N0.8 **1
P0.3NS1
K0.8 **0.7 **0.6 *1
Mg−0.1−0.1−0.4−0.11
Ca0.1−0.1−0.20.10.9 **1
Al0.20.30.20.2−0.5 *−0.7 **1
pH0.40.10.30.6 *0.10.10.11
EC−0.10.2−0.5−0.20.1−0.20.2−0.11
SM0.50.20.10.3−0.2−0.20.20.40.11
SEF−0.20.1−0.3−0.10.30.1−0.1−0.10.7 **0.11
SFI−0.4−0.2−0.3−0.30.30.1−0.2−0.20.4−0.10.7 **1
OC: organic carbon; SM: soil moisture; SEF: soil evaluation factor; SFI: soil fertility index; ** correlation is significant at the 0.01 level (2-tailed); * correlation is significant at the 0.05 level (2-tailed).
Table 7. SOC content and amount in the forest stands.
StandsSoil Parameter/Soil Depth
SOC (%)SOC (Mg ha−1)
0–20 cm20–40 cm40–60 cm0–20 cm20–40 cm40–60cmTotal
LPDS1.521.351.2134.0530.2427.1091.4
MCDS1.361.251.1430.4628.0025.5484.0
SRDS1.441.341.1932.2730.0226.6688.9
TGDS1.261.101.0328.2224.6423.0775.9
MS1.811.631.3840.5436.2330.91107.7
SEm0.0070.0370.0460.700.990.943.78
SEd0.0100.0520.0650.991.401.335.35
P = 0.050.0230.1140.1422.163.052.9011.65
Publisher’s Note: MDPI stays neutral with regard to jurisdictional claims in published maps and institutional affiliations.

