Article

Responses of NDVI to Climate Change and LUCC along Large-Scale Transportation Projects in Fragile Karst Areas, SW China

1
School of Geography and Resources, Guizhou Education University, Guiyang 550018, China
2
School of Earth System Science, Tianjin University, Tianjin 300072, China
3
Guizhou Provincial Key Laboratory of Geographic State Monitoring of Watershed, Guizhou Education University, Guiyang 550018, China
4
College of Geography and Remote Sensing Sciences, Xinjiang University, Urumqi 830017, China
5
Administration of Ecology and Environment of Haihe River Basin and Beihai Sea Area, Ministry of Ecology and Environment of People’s Republic of China, Tianjin 300061, China
6
Department of Geography and Spatial Information Techniques, Center for Land and Marine Spatial Utilization and Governance Research, Ningbo University, Ningbo 315211, China
7
College of Ecological and Environmental Sciences, Xinjiang University, Urumqi 830017, China
8
State Key Laboratory of Environmental Geochemistry, Institute of Geochemistry, Chinese Academy of Sciences, Guiyang 550081, China
9
Shanghai Ecology and Environment Scientific Research Center, Yangtze River Basin Ecological Environment Supervision and Administration Bureau, Ministry of Ecology and Environment of People’s Republic of China, Shanghai 200120, China
*
Author to whom correspondence should be addressed.
Land 2022, 11(10), 1771; https://doi.org/10.3390/land11101771
Submission received: 31 August 2022 / Revised: 5 October 2022 / Accepted: 9 October 2022 / Published: 12 October 2022
(This article belongs to the Special Issue Karst Land System and Sustainable Development)

Abstract

:
The fragile karst habitat is extremely sensitive to human activities such as large-scale engineering construction. To explore the influence of the construction and operation of the GH (Guiyang-Huangguoshu) highway on the vegetation within a certain range and the response of NDVI to climate factors, Landsat data were used to synthesize annual NDVI maps using the maximum value compositing method. Trend, correlation, and coefficient of variation analyses were performed. The results demonstrate that: (1) During the construction and operation periods, NDVI showed an overall upward trend, and the NDVI value and growth rate in the contrast area were greater than those in the core area; (2) the correlation between temperature and vegetation cover along the GH highway was stronger than that between precipitation and vegetation; (3) construction of the GH highway has had a significant impact on the surrounding vegetation, with the impact on vegetation ecology along the road mainly concentrated within the 2 km range. The increase of artificial surfaces along the road has had a great impact on the NDVI, and the vegetation cover change in the core area is more significant than that in the contrast area; and (4) the overall disturbance of the GH highway project to the surrounding ecology was mainly observed in the form of low and medium fluctuations. This study aims to provide a reference for environmental assessment and management in karst areas.

1. Introduction

The environment is the basis of human survival and development, comprising the sum of various natural factors within and around human society [1]. At present, China is committed to conserving natural ecosystems, focusing on strengthening the protection of the environment in large river basins [2]. Guizhou Province is located in the southwest karst area of China—the largest continuous karst landform region in the world [3]—which spans the Yangtze River and the Pearl River. It is an important ecological barrier in the upper reaches of the “two rivers”. The entire ecological quality of this region is in good condition [4]; however, its ecosystems are vulnerable due to their significant sensitivity to external disturbances (including human activities and climate change) in this zone [5]. The Chinese government completed built numerous transportation infrastructure projects in Southwest China in recent years. As a consequence, the depth of highway access, road quality and network level in Guizhou been significantly improved. However, road construction projects are often in conflict with ecological protection. The rapid expansion of road traffic has brought unprecedented challenges to the local environment, and the construction or expansion of various types of roads may (directly or indirectly) leads to serious degradation of the natural environment, as well as increased local plant mortality. Therefore, a primary ecological problem to be addressed is to determine the current situation and change trend of vegetation along highways in karst region.
Highway construction and other large-scale construction activities can directly affect the environment by changing the surface vegetation cover. A construction project may greatly change the topography of the original slope conditions, geological conditions and natural stability, leading to increased vulnerability of the surrounding environment. Furthermore, with the promotion of large-scale projects, economic activities along the project will be activated, potentially including unreasonable human cultivation, excessive reclamation, overgrazing and urban expansion, all of which can lead to a decrease in vegetation coverage [6,7,8]. Therefore, large-scale artificial engineering activities have a significant impact on the growth and distribution of land surface vegetation [9,10], and can even change the distribution of vegetation coverage at the regional scale [11]. In contrast, reasonable project construction planning and ecological protection measures, such as afforestation, mountain closure afforestation and the improvement of agricultural technology, can facilitate the recovery vegetation [12,13].
Vegetation is one of the key components of the terrestrial ecosystem playing a fundamental role in regulating energy exchange and material cycling [14], especially in the process of karst rocky desertification control and ecological restoration [15,16]. Evidence has shown that, climate change is an important environmental factor having a significant impact on vegetation dynamics [17,18]. It influences the function and structure of the ecosystem by acting on the growth and adaptation characteristics of plants [19]. Temperature and precipitation are the most direct and important factors for vegetation growth and phenology [20,21]. At present, the normalized vegetation index (NDVI) is widely used to monitor vegetation and explore its response to climate change [22]. NDVI is an effective indicator of vegetation growth status and vegetation coverage, and it has a good linear relationship with surface vegetation. In a study on the correlation between global climate factors and NDVI changes, it has been found that NDVI presented an increasing trend with the increase in temperature in the middle high latitudes of the Northern Hemisphere [23]. In a regional study, it has been found that the seasonal variation of NDVI in different years were also responsive to land processes [24]. A spatial–temporal variation trend has been observed to vegetation degradation along with its response to climate change and anthropogenic stress [25]. Temperature may be an important driving force limiting forest greening in mountainous areas due to recent climate warming [26]. The NDVI of Guizhou karst area has been found to be more affected by temperature than precipitation and was one of the provinces with the most obvious environmental improvement [27,28]. In karst areas, a significant increase in vegetation NDVI is has been closely related to climate warming, but weakly related to precipitation [27,29]. Climate change in karst regions typically presents a cold-dry trend, while vegetation NDVI presents a recovery trend [30].
Although many scholars have studied the response of vegetation to human activities and climate factors, few have studied the impact of large engineering construction on the environment in karst areas. Relevant studies have revealed the spatial and temporal response relationship between NDVI and climate factors along the Qinghai–Tibet (QT) railway, as well as human activities, indicating that the influence of construction and operation of the QT railway on NDVI tended to weaken outward from the QT railway, while temperature and precipitation were positively correlated with NDVI [31,32]. Human activities have contributed to the response relationship between regional vegetation change and climate change [33,34]. In karst areas, human activities tend to have a stronger role in vegetation improvement and degradation than climate change [35].
The Guiyang–Huangguoshu highway (GH highway) is the first highway built in the karst area. Over a long times scale (35 a), the construction and operation activities of this large project and the subsequent enhancement of human activities along the line were sufficient to change the original land-cover and affect the surrounding environment, resulting in the destruction of habitats along the line. Therefore, GH highway is an ideal research area. In this study, we take the earliest GH highway in the karst region as the research object. High-resolution NDVI data from 1986 to 2020 are used. The trend of NDVI in the area within 8 km of the GH highway route is analyzed. The impacts of temperature, climate, land use and land-cover change (LUCC) on the vegetation along the highway are comprehensively considered. We explored the long-term impact of road traffic engineering on vegetation, in order to provide guidance for future road traffic route planning and industrial layout in fragile karst regions.

2. Materials and Methods

2.1. Study Area

The GH highway is the first high-grade highway in the karst region [36]. It started construction in August 1986 and opened to traffic in May 1991. GH highway starts from Guiyang and finally reaches Huangguoshu, with a total length of 137 km (Figure 1). The average elevation of the road is about 1200 to 1300 m, low in the middle and high around the ends. The climate is subtropical monsoon with a mean annual temperature (MAT) of 15.3 °C. The mean annual precipitation (MAP) is about 1100 mm. The GH highway is located in a typical karst landform area, within karst landforms accounting for 76.5% [37].

2.2. Data Collection and Processing

2.2.1. NDVI Data

Landsat 5, Landsat 7, Landsat 8 TM image data has been collected by the Google Earth Engine. The time resolution is 16 days and the spatial resolution is 30 m. The Maximum Value Composite (MSV) method [38] was used to generate the annual Maximum NDVI Value from 1986 to 2020. This study taken NDVI as an indicator and used the current situation vector data of GH highway to generate a 4 km buffer zone (hereafter referred to as the core area) in ArcGIS to evaluate the direct impact of human activities on the environment of GH highway. To evaluate the indirect effects of human activities on the environment of GH highway. We generated a 4 km buffer zone (hereafter referred to as the contrast area) in the periphery of the core area. The NDVI of the core area was divided into four buffer zones according to 1 km, and the direct impact of GH highway on the NDVI of human activities along the highway was evaluated.

2.2.2. Meteorological Data

Raster data of temperature and precipitation at 1 km resolution were used. The temperature and precipitation from 1986 to 2015 were collected from the Data Center of Institute of Geographic Sciences and Natural Resources Research, Chinese Academy of Sciences (https://www.resdc.cn/, accessed on 1 October 2022). The data of annual precipitation and annual temperature from 2016 to 2020 are from the monthly scale data provided by China Meteorological Administration (http://data.cma.cn/, accessed on 1 October 2022). The meteorological interpolation software ANUSPLIN was used to interpolate the temperature and precipitation data with a spatial resolution of 30 m. The digital elevation map (DEM) was introduced in the interpolation process to reduce the effect of topography on climate, thus minimizing the interpolation error and greatly improving the accuracy compared with other interpolation methods [39], which is more suitable for the analysis of meteorological elements of time series [40]. The above monthly synthesized temperature and precipitation data are extracted by ArcGIS to synthesize the annual average precipitation and annual average temperature data, and resampling into 30 m in ArcGIS.

2.2.3. Terrestrial Surface Data

The DEM digital elevation model is derived from the Geospatial Data Cloud (http://www.gscloud.cn/, accessed on 1 October 2022) with a spatial resolution of 30 m. LUCC data from 2000 to 2020 are obtained from the Globalland30 (http://www.globallandcover.com/, accessed on 1 October 2022), the spatial resolution is 30 m, the dataset includes ten types of land cover [41]. Wetlands are reclassified as water bodies due to its small area in the study region.

2.3. Methods

2.3.1. Trend Analysis Method

Trend analysis is a linear regression analysis of the changes of variables over timescales. It can not only track and analyze the change trend of variables, but also predict the change trend of variables. In the analysis of the change trend of inter-annual NDVI, the slope is the minimum power of the raster value of the time series, and the change value of spatial pixel on the time scale can be calculated by traversing pixel by pixel, and the change trend can be obtained [42]. The calculation method is as follows:
S l o p e = n × i = 1 n ( i × N D V I i ) i = 1 n i i = 1 n N D V I i n × i = 1 n i 2 ( i = 1 n i ) 2
where, S l o p e is pixel regression Slope, NDVIi is NDV value in the n year, and n is time length. When S l o p e > 0, it indicates an increasing NDVIi trend, and when S l o p e < 0, it indicates a decreasing NDVI trend.

2.3.2. Analysis of Correlation

Correlation analysis is a statistical method to study the correlation between two or more variables. In data analysis, it is often used to analyze the relationship between continuous independent variables and continuous dependent variables. When there are many features, Pearson correlation analysis is used. Pearson’s correlation coefficient is a statistic reflecting the degree of linear correlation between two variables. The calculation formula goes as follows:
r x y = i = 1 n ( x i x ¯ ) ( y i y ¯ ) i = 1 n ( x i x ¯ ) 2 i = 1 n ( y i y ¯ ) 2
where, r x y is the correlation coefficient of NDVI precipitation or temperature, which is between −1 and 1. The larger the value, the greater the correlation, and the smaller the value, the smaller the correlation. x ¯ , y ¯ are the mean values of multi-year NDVI and precipitation or temperature, x i , y i are the NDVI values of the ith year and the temperature and precipitation values of the i year.
R 12 , 3 = r 12 r 13 r 23 ( 1 r 13 2 ) ( 1 r 23 2 )
where R 12 , 3 , R 13 , 2 , R 23 , 1 is the partial correlation coefficients among variables; R 12 , 3 is the partial correlation coefficient between r1 and r2 after fixing the variable r3. R 12 , 3 > 0 indicates positive correlation, that is, the two factors are correlated in the same direction; R 12 , 3 < 0 indicate negative correlation, that is, the two elements of heterotrophy correlation; the larger the partial correlation coefficient is, the stronger the correlation between the two elements at the pixel is.

2.3.3. Coefficient of Variation

The coefficient of variation, also known as the “coefficient of dispersion”, is a normalized measure of the degree of dispersion of a probability distribution. The calculation formula is shown below.
C v = 1 x ¯ i = 1 n ( x i x ¯ ) 2 n 1
C v stands for the coefficient of variation of NDVI; x i stands for the NDVI value in the i-th year; x ¯ stands for the mean NDVI value in the n years. The higher the C v value, the more discrete the data, the higher the variation degree of the corresponding NDVI value, and the greater the inter-annual variation. The smaller the C v value is, the more the data is aggregated, the lower the variation degree of the corresponding NDVI value and the lower the inter-annual variation.

3. Results

3.1. Trends in Time Scale and Spatial Change of NDVI

In order to explore the influence of the construction and operation activities along the GH highway, the NDVI obtained along the GH highway was divided into the construction period (1986–1991) and the operation period (1992–2020) in the time scale. By piecewise fitting of time-series NDVI, the trend of NDVI change in each time period was obtained.
Within the construction period, the NDVI in both the core and contrast areas showed a clear upward trend (Figure 2a). The NDVI increased more significantly in the contrast area at 0.0170/a, while it increased in the core area at 0.0149/a (Figure 2a). The results revealed that the construction of the GH highway caused some damage to the surrounding vegetation, and the NDVI values decreased most significantly in the early stage of construction (1987).
During the operation period, the vegetation cover in the core and contrast areas of GH highway gradually improved and the NDVI showed a generally increasing trend. The growth rates in the core and contrast areas were 0.0024/a and 0.0027/a, respectively (Figure 2b). However, the change trend of NDVI obviously differed before and after 2000. The NDVI increased at a faster rate in the core area (0.0137/a) than in the contrast area (0.0130/a) during 1992 to 2000. After this period of growth, the NDVI reaching a relatively stable state, with little fluctuation around 2000. However, after this, the NDVI in both the core and the contrast areas decreased (at rate of −0.0030/a and −0.0002/a, respectively), showing two significant decreases (in 2010 and 2018) and one significant increase (2012) between 2001 and 2020.
The overall NDVI level in the operation period was higher than that in the construction period, while the fluctuation of NDVI was smaller than that in the construction period. Within the construction period, the MAT decreased slightly, while the MAP and NDVI increased significantly (Figure 3a). The MAP increased at a rate of 12.04 mm/a, while the MAT decreased at a rate of −0.0180 °C/a.
The trend of MAT generally increased, while the MAP decreased (Figure 3b). In the fitting of temperature and precipitation from 1992 to 2020, the temperature increased at a rate of 0.0288 °C/a, while the precipitation decreased at a rate of −16.44 mm/a.
Considering that there are many other traffic routes, cities, towns and villages along the GH highway. The core area was divided into four buffer zones with a distance of 1 km in order to measure the spatial impact level of GH highway. In the temporal dimension, the NDVI showed an overall increase due to self-healing of the environment. In the spatial dimension, the construction and operation of the GH road negatively affected the vegetation within 2 km of the route. This impact was inversely proportional to the distance from the GH highway route. The NDVI values were higher within the 1 km buffer than the 2 km buffer, but did not increase outward at the 3 km and 4 km ranges (Figure 4a,b).
Within the construction and operation period, the slopes of the regression equations in the core and contrast areas are concentrated between −0.05–0.15 and 0.002–0.015, respectively (Table 1).
Within the construction period, the extent of NDVI damage in the core area was greater than that in the contrast area. However, the total trend of NDVI change was still overall slightly increasing, with the proportion accounting for 92.42% and 92.99% in core and contrast areas, respectively. Within the operating period, the NDVI showed an increasing trend as before. However, the proportion showing a slight increase became larger, accounting for 94.10% and 94.84% in the core and contrast areas, respectively.
Spatial differences in the increase or decrease in NDVI were observed along the GH road. Slight and significant decreases were dominant near the road and in urban areas (Figure 5a), while slight increases were dominant elsewhere. In particular, the increase was more significant in the mountain forest area (Figure 5b).

3.2. Coefficient of Variation Analysis

The construction and operation of the GH freeway has had a negative impact on the stability of vegetation along the route. The fluctuations of NDVI in the construction period were greater than those in the operation period, and all fluctuations in the core area were greater than those in the contrast area. The NDVI, in terms of both periods and area were dominated by lower fluctuations, with lower fluctuations in the construction and operation periods of 845.12 km2 and 993.80 km2, respectively, and lower fluctuations in the core and contrast areas of 793.49 km2 and 968.78 km2, respectively. The high fluctuation of NDVI in the construction period were larger than those in the operation period, as well as were larger in the core than in the contrast area. The high fluctuation areas for the construction and operation periods were 280.64 km2 and 121.98 km2, respectively, while the high fluctuation sizes in the core and contrast areas were 225.54 km2 and 177.08 km2 respectively (Figure 6).

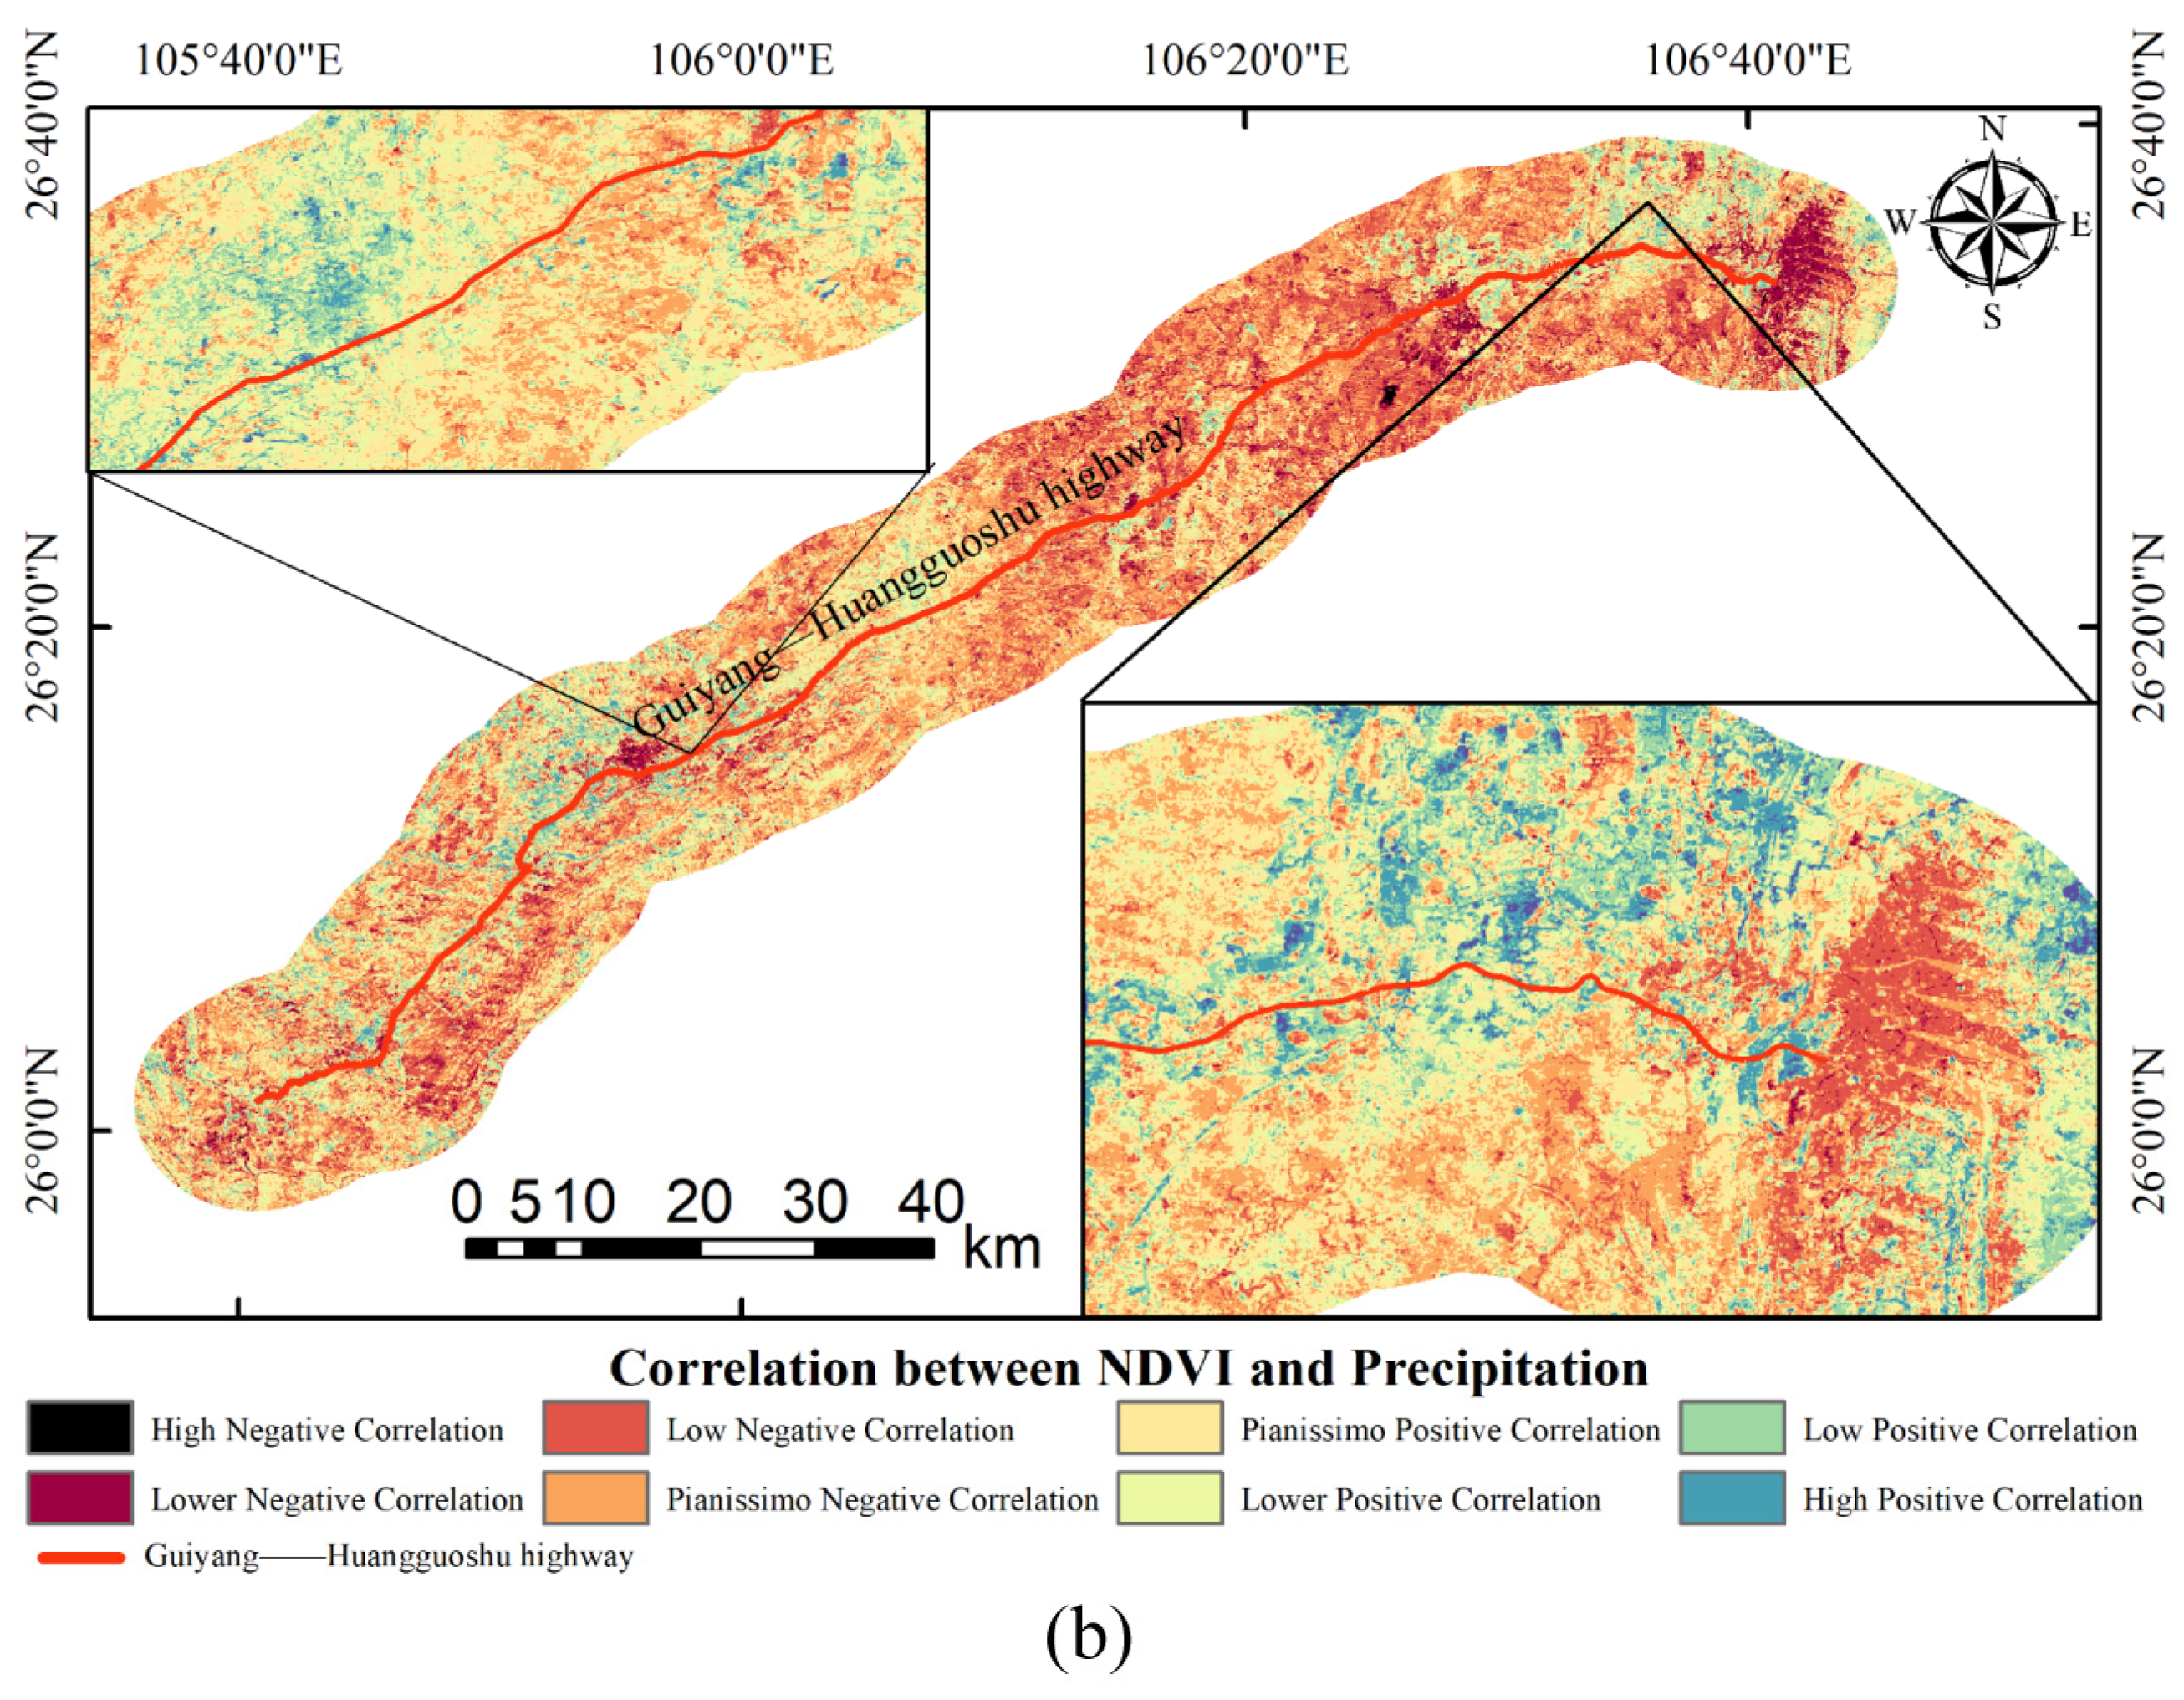
3.3. Correlation Analysis of NDVI with Temperature and Precipitation

The correlation coefficient between NDVI and precipitation from 1986 to 2020 was mainly concentrated between −0.45 and 0 (mean = −0.03), showing a low negative correlation, while, its correlation coefficient with air temperature mainly ranged from 0–0.5 (mean = 0.08), showing a low positive correlation. The mean partial correlation coefficients of NDVI with precipitation and temperature were 0.05 and 0.17, respectively, which were both less than 0.5 (Figure 7).
The correlation of NDVI with temperature was mainly low positive, while the correlation with precipitation is mainly low negative; however, the correlation between NDVI and precipitation was positive, while the correlation between NDVI and temperature was negative in where the underlying surface was artificial, especially in urban areas and along roads (Figure 7).

3.4. Analysis of Study Area LUCC

Wetlands were re-classified as water bodies before the calculations, due to their small size. The LUCC decreased by 0.39% for forest, 6.04% for cultivated land, 0.97% for water, 0.48% for shrub, and 0.97% for grass from 2000 to 2020, while the artificial cover increased by 8.67% (Table 2).
The trend of NDVI decreased significantly along the GH highway (Figure 8), especially in urban areas along the route (Figure 8). The construction and operation of the GH highway and other later roads drove the development of towns along the route, leading to an expansion of artificial cover along the route and exacerbating the decline of NDVI (see Figure 5).

4. Discussion

4.1. Characteristics and Reasons for Change in NDVI during the Construction Period

Within the construction period, the annual average value and growth rate of the NDVI in the core area along the GH highway were smaller than those in the contrast area, and the coefficient of variation was larger than that in the contrast area, due to by the destruction of the original land-cover caused by the construction of the GH highway. The closer to the road, the greater the damage to the vegetation. This slowed the NDVI growth rate in the surrounding 4 km from the road, and breaks the environment for a certain distance along the line, thus increasing the variation in fluctuation of vegetation along the line. The fluctuation caused by highway construction activities on vegetation along the road were also larger closer to the road, indicating that the construction activities of GH highway had a negative effect on the stability of the surrounding environment. The construction and operation of the GH highway have increased the intensity of human activities in towns along the route, resulting in higher ecological fluctuations around the towns than other areas. The influence of the GH highway is mainly within 2 km, as the highway along the road are mainly within 2 km, making this the area with the strongest human activities. In the area far from the GH highway, the vegetation was weakly affected by the highway, and the heterogeneity of the surface was observed to have a greater impact on NDVI than the highway and human activities. In the early stage of construction (1987), the NDVI in both the area and the contrast areas declined sharply. This was due to the large-scale destruction of the surface vegetation in the early stage of the project construction, which led to a sharp decline in NDVI in this year. In addition, the rocky desertification was serious in this period, and there was a lack of relevant control work, leading to damage of the fragile environment [43]. The engineering construction in the core area can easily affect involve the vegetation cover in the contrast area, causing further damages.

4.2. Characteristics and Reasons for Change in NDVI during the Operation Period

Within the operation period, the overall NDVI in the core and contrast areas showed an upward trend, where the growth rate in the contrast area was greater than that in the core area; however the increase was small. Due to the implementation of environmental protection policy [44], the vegetation being slowly restored by regeneration, afforestation, and returning farmland to forest. The NDVI along the GH highway rose to a high value and the change is relatively stable in 2000. However, after 2000, the NDVI showed a downward trend. During the nearly 30 years of the operation period, human activities along the GH highway have substantially enhanced, as is reflected by an increase in artificial surfaces along the highway and the construction and widening of other roads along the highway. In addition, the NDVI showed an obvious downward trend in 2008 and 2009, related to the severe snow disaster in southwest China in the winter of 2008. A certain range of vegetation died due to freezing, which affected the maximum NDVI in the following year. The same significant decrease also occurred from 2010 to 2012, which was related to the destruction of vegetation on the original surface due to the construction of the Shanghai-Kunming highway in this section in 2010, and the severe drought in Guizhou in 2012, which resulted in a decline in and reduced growth of NDVI from 2010 to 2012. Furthermore, the NDVI decreased significantly in 2019–2020. Meteorological bureau data (http://gz.cma.gov.cn/ access on 1 October 2022) indicated that a spring drought occurred in the spring in Central Guizhou during 2019–2020. This spring drought caused the vegetation to be short of water during the growth period, leading to inhibition of vegetative growth throughout the year, thus significantly reducing the NDVI value over this period.
The construction and operation of GH highway has increased the intensity of human activities in towns along the line, these activities Include change of cropland area along the GH highway will also affect the vegetation [45], causing the fluctuation of NDVI along the GH highway to be higher than that in other regions. The construction and operation of the GH highway mainly affected the area within 2 km, where a large number of villages, towns, cities, and trunk roads are concentrated. These areas are characterized by strong human activities. In the area far from the GH highway, the vegetation is less affected by the highway, and the heterogeneity of the karst surface becomes the main factor affecting the NDVI. Although the impact of human engineering construction on the environment is not unique to karst, the heterogeneity, vulnerability, and sensitivity of the karst surface are strong [46]. Therefore, the impact of human activities tends to cause greater damage in karst areas. In recent decades, the frequency and intensity of extreme climate events have increased, and the impact of high temperatures and drought on the productivity of the mid-latitude ecosystem in the Northern Hemisphere has become greater and greater, leading to a more sensitively responsive of NDVI [47]. Over the past three decades, the reduction of precipitation and the increase in temperature have led to increased evaporation. The soil moisture in many areas has decreased [48], while the sensitivity of vegetation to soil moisture has generally increased [49]. In particular, soil moisture restricts karst ecological restoration [50]. The study area is a typical karst area, with thin soil layer, weak soil water holding capacity, many underground rivers, strong surface water infiltration, and easy soil water loss. Under the trend of long-term temperature rise and precipitation decrease, soil moisture evaporation will inevitably be intensified, leading to soil moisture reduction, which will further affect the growth and development of vegetation along the line. The enhancement of human activities along the GH highway will also lead to intensification of soil erosion, especially with expansion of cities along the highway. The construction of other highways will increase the sensitivity of vegetation in artificial surface areas to drought, resulting in water shortages during the peak growth season, ultimately leading to declining annual biomass.

4.3. Correlation between Climatic Factors and NDVI

Consistent with previous research, the correlation coefficient between NDVI and precipitation along the GH highway showed an insignificant negative correlation. During the nearly 30 years of the operation period, the slight decrease in total precipitation did not cause major a catastrophe for vegetation growth in the Southwest China; instead, the change in precipitation frequency made local rain recruitment more frequent, which partly compensated for the growth of southwestern vegetation being limited by the alternating time of dry and wet periods, rather than total precipitation [51]. At the same time, the partial correlation coefficients of NDVI with precipitation and temperature were 0.05 and 0.17, respectively; both were less than 0.5, which is basically consistent with previous research [29]. The proportion of karst landform in the study area is high (76.5%); together with the large change of karst underlying surface and the high degree of topographic relief, the spatial heterogeneity of temperature within a small range may be high. This results in temperature being a major factor controlling vegetative growth over a small range. A previous study has shown that terrain is generally a covariate of temperature, which is highly consistent with temperature change. Therefore, we did not consider terrain factors as covariates to participating in the partial correlation analysis [29].
Similar to previous studies, the correlation between NDVI and precipitation was weakly positive on the artificial surface, while the correlation between NDVI and temperature was low and negative on artificial surfaces [30]. Human activities are strong in artificial surface areas, and the environment is more fragile than in other areas. The low precipitation infiltration of hardened surface exacerbates water shortages and temperature increases, which may force the growth of vegetation to be slow. The surrounding ecology is fragile. The increase of precipitation makes the water supply needed for the growth of regional vegetation sufficient, thus reducing the vulnerability, while artificial surface vegetation is more sensitive to drought.

5. Conclusions

In this paper, NDVI and climate data were used to analyze the influence of the GH highway on the area within 8 km of the route. It was found that the annual mean and growth rate of NDVI in the core area within the construction and operation periods of the GH highway were smaller than those in the contrast area, the inter-annual variation fluctuated greatly, and the influence on the area was mainly within 2 km of the GH highway. Within the operation period, the NDVI reached a peak and then decreased slightly. Within the construction and operation period, the NDVI along the route increased overall, precipitation showed a downward trend, and temperature showed an upward trend. The correlation between NDVI and climate factors indicated that the correlation between NDVI and temperature is stronger than that between NDVI and precipitation. The influence of LUCC on NDVI was mainly manifested as an increase in artificial cover surface and the decline of other land-use types, resulting in the change of NDVI.

6. Limitations and Prospects

In this study, only the inter-annual variability of climate variables in response to NDVI was considered, seasonal variation of climate indicators was not considered; furthermore, only the annual maximum value of Landsat was used to synthesize the NDVI images, and multi-source remote sensing data fusion methods were not considered. In the future, multi-source remote sensing can be used to explore the corresponding relationship between NDVI and other climatic factors (e.g., surface soil humidity, evaporation, seasonal drought, and so on). Remote sensing data under nighttime lighting can also be adopted, in order to explore the correlation between vegetation cover and human activities.

Author Contributions

Conceptualization, Y.W. and S.L.; methodology, G.L.; software, L.G. and J.Y.; formal analysis, C.G. and F.Y.; investigation, L.G., J.Y., Z.S. and X.Y.; data curation, Y.C., H.P. and X.Y.; writing—original draft preparation, Y.W.; writing—review and editing, C.G. and S.L.; visualization, L.G.; supervision, Y.X.; project administration, G.L.; funding acquisition, Y.W. All authors have read and agreed to the published version of the manuscript.

Funding

This research was funded by Guizhou Provincial Science and Technology Projects (ZK [2022] YB334) and Doctoral Program of Guizhou Education University (X2021049).

Data Availability Statement

Not applicable.

Acknowledgments

We thank the anonymous reviewers for their valuable comments. We gratefully acknowledge the design of S.L. and the contribution of co-authors.

Conflicts of Interest

The authors declare no conflict of interest.

References

  1. Zhang, Y.; Wang, X.; Li, C. NDVI dynamics under changing meteorological factors in a shallow lake in future metropolitan, semiarid area in North China. Sci. Rep. 2018, 8, 15971. [Google Scholar] [CrossRef] [PubMed] [Green Version]
  2. Zhang, S.R.; Bai, X.Y.; Zhao, C.W.; Tan, Q.; Luo, G.J.; Wu, L.H.; Xi, H.P.; Li, C.J.; Chen, F.; Ran, C.; et al. China’s carbon budget inventory from 1997 to 2017 and its challenges to achieving carbon neutral strategies. J. Clean. Prod. 2022, 347, 130966. [Google Scholar] [CrossRef]
  3. Li, C.J.; Bai, X.Y.; Tan, Q.; Luo, G.J.; Wu, L.H.; Chen, F.; Xi, H.P.; Luo, X.L.; Ran, C.; Chen, H.; et al. High-resolution mapping of the global silicate weathering carbon sink and its long-term changes. Glob. Chang. Biol. 2022, 28, 4377–4394. [Google Scholar] [CrossRef]
  4. Du, C.C.; Bai, X.Y.; Li, Y.B.; Tan, Q.; Zhao, C.W.; Luo, G.J.; Wu, L.H.; Chen, F.; Li, C.J.; Ran, C.; et al. Inventory of China’s net biome productivity since the 21 st century. Land 2022, 11, 1244. [Google Scholar] [CrossRef]
  5. Wu, Y.Y.; Liu, L.B.; Guo, C.Z.; Zhang, Z.H.; Hu, G.; Ni, J. Low carbon storage of woody debris in a karst forest in southwestern China. Acta Geochim. 2019, 38, 576–586. [Google Scholar] [CrossRef]
  6. Shi, S.Y.; Yu, J.G.; Wang, F.; Wang, P.; Zhang, Y.C.; Jin, K. Quantitative contributions of climate change and human activities to vegetation changes over multiple timescales on the Loess Plateau. Sci. Total Environ. 2020, 755, 142419. [Google Scholar] [CrossRef]
  7. Zhang, M.; Wu, X.Q. The rebound effects of recent vegetation restoration projects in Mu Us Sandy land of China. Ecol. Indic. 2020, 113, 106228. [Google Scholar] [CrossRef]
  8. Liu, Y.; Li, Y.; Li, S.C.; Motesharrei, S. Spatial and temporal patterns of global NDVI trends: Correlations with climate and human factors. Remote Sens. 2015, 7, 13233–13250. [Google Scholar] [CrossRef] [Green Version]
  9. Feng, K.; Wang, T.; Liu, S.; Yan, C.; Kang, W.; Chen, X.; Guo, Z. Path analysis model to identify and analyse the causes of aeolian desertification in Mu Us Sandy Land, China. Ecol. Indic. 2021, 124, 107386. [Google Scholar] [CrossRef]
  10. Liu, X.; Pei, F.; Wen, Y. Global urban expansion offsets climate-driven increases in terrestrial net primary productivity. Nat. Commun. 2019, 10, 5558. [Google Scholar] [CrossRef] [PubMed]
  11. Wang, C.G.; Zhao, H.R. The assessment of urban environment in watershed scale. Procedia Environ. Sci. 2016, 36, 169–175. [Google Scholar] [CrossRef] [Green Version]
  12. Liu, D.; Chen, J.; Ou, Y.Z. Responses of landscape structure to the ecological restoration programs in the farming-pastoral ecotone of Northern China. Sci. Total Environ. 2020, 710, 136311. [Google Scholar] [CrossRef] [PubMed]
  13. Sun, Z.; Mao, Z.; Yang, L.; Liu, Z.; Han, J.; Wang, H.; He, W. Impacts of climate change and afforestation on vegetation dynamic in the Mu U: Desert. China. Ecol. Indic. 2021, 129, 108020. [Google Scholar] [CrossRef]
  14. Bégué, A.; Vintrou, E.; Ruelland, D.; Claden, M.; Dessay, N. Can a 25-year trend in Soudano-Sahelian vegetation dynamics be interpreted in terms of land use change? A remote sensing approach. Glob. Environ. Chang. 2011, 21, 413–420. [Google Scholar] [CrossRef]
  15. Huang, Q.H.; Cai, Y.L. Spatial pattern of karst rock desertification in the middle of Guizhou Province, Southwestern China. Environ. Geol. 2007, 52, 1325–1330. [Google Scholar] [CrossRef]
  16. Liu, M.; Bai, X.; Tan, Q.; Luo, G.; Zhao, C.; Wu, L.; Luo, X.; Ran, C.; Zhang, S. Climate Change Enhances the Positive Contribution of Human Activities to Vegetation restoration in China. Geocarto Int. 2022, 1–24. [Google Scholar] [CrossRef]
  17. Guo, B.; Zhou, Y.; Wang, S.X.; Tao, H.P. The relationship between normalized difference vegetation index (NDVI) and climate factors in the semiarid region: A case study in Yalu Tsangpo river basin of Qinghai-Tibet Plateau. J. Mt. Sci. 2014, 11, 926–940. [Google Scholar] [CrossRef]
  18. Xia, C.F.; Li, J.; Liu, Q.H. Review of advances in vegetation phenology monitoring by remote sensing. Nat. Remote Sens. Bull. 2013, 17, 1–16. (In Chinese) [Google Scholar] [CrossRef]
  19. Guo, K.M.; Qiu, T.; Zong, L.L.; Lu, H.X.; Yao, W. Change of NDVI in Hexi region and its response to temperature and precipitation. Sci. Surv. Mapp. 2021, 46, 83–89. (In Chinese) [Google Scholar] [CrossRef]
  20. Nemani, R.R.; Keeling, C.D.; Hashimoto, H.; Jolly, W.M.; Piper, S.C.; Tucker, C.J.; Myneni, R.B.; Running, S.W. Climate-driven increases in global terrestrial net primary production from 1982 to 1999. Science 2003, 300, 1560–1563. [Google Scholar] [CrossRef]
  21. Braswell, B.H.; Schimel, D.S.; Linder, E.; Moore, B. The response of global terrestrial ecosystems to interannual temperature variability. Science 1997, 278, 870–873. [Google Scholar] [CrossRef]
  22. Justice, C.O.; Townshend, J.R.G.; Holben, B.N.; Tucker, C.J. Analysis of the phenology of global vegetation using meteorological satellite data. Int. J. Remote Sens. 1985, 6, 1271–1318. [Google Scholar] [CrossRef]
  23. Myneni, R.B.; Keeling, C.D.; Tucker, C.J.; Asrar, G.; Nemani, R.R. Increased plant growth in the northern high latitudes from 1981 to 1991. Nature 1997, 386, 698–702. [Google Scholar] [CrossRef]
  24. Ramírez-Cuesta, J.M.; Minacapilli, M.; Motisi, A.; Consoli, S.; Intrigliolo, D.S.; Vanella, D. Characterization of the main land processes occurring in Europe (2000–2018) through a MODIS NDVI seasonal parameter-based procedure. Sci. Total Environ. 2021, 799, 149346. [Google Scholar] [CrossRef]
  25. Fokeng, R.M.; Fogwe, Z.N. Landsat NDVI-based vegetation degradation dynamics and its response to rainfall variability and anthropogenic stressors in Southern Bui Plateau, Cameroon. Geosyst. Geoenviron. 2022, 1, 100075. [Google Scholar] [CrossRef]
  26. Prăvălie, R.; Sîrodoev, I.; Nita, I.A.; Patriche, C.; Dumitraşcu, M.; Roşca, B.; Tişcovschi, A.; Bandoc, G.; Săvulescu, I.; Mănoiu, V.; et al. NDVI-based ecological dynamics of forest vegetation and its relationship to climate change in Romania during 1987–2018. Ecol. Indic. 2022, 136, 108629. [Google Scholar] [CrossRef]
  27. Ren, R.Y.; Hr, Z.H.; Liang, H.; Xia, C.H.; Zhang, L.; Yang, M.K. Spatiotemporal variation of NDVI and its response to changes in temperature and precipitation in Guizhou Province. Bull. Soil Water Conserv. 2021, 28, 118–129. (In Chinese) [Google Scholar] [CrossRef]
  28. Jiang, L.G.; Liu, Y.; Wu, S.; Yang, C. Analyzing environment change and associated driving factors in China based on NDVI time series data. Ecol. Indic. 2021, 129, 107933. [Google Scholar] [CrossRef]
  29. Liu, W.; Jiao, S.L.; Li, Y.G.; Mo, Y.S.; Zhao, Z.Q.; Zhang, J.; Zhao, M. Analysis on the correlation between vegetation cover of land surface and climatic factors in karst area. Bull. Soil Water Conserv. 2021, 28, 203–215. (In Chinese) [Google Scholar] [CrossRef]
  30. Zhang, Y.R.; Zhou, Z.F.; Ma, S.B.; Zhang, Y.H. A study on response of vegetation to climate change based on NDVI in karst region-a case study at Liupanshui city in Guizhou Province. Bull. Soil Water. Conserv. 2014, 34, 114–117+2. (In Chinese) [Google Scholar] [CrossRef]
  31. Yang, C.; Xing, Y.Q.; Ma, C. The response of NDVI along the QT railway to human activities and climate change. Sci. Surv. Map. 2022, 47, 137–145. (In Chinese) [Google Scholar] [CrossRef]
  32. Hao, A.H.; Duan, H.C.; Wang, X.F.; Zhao, G.H.; You, Q.G.; Peng, F.; Du, H.Q.; Liu, F.Y.; Li, C.Y.; Lai, C.M.; et al. Different response of alpine meadow and alpine steppe to climatic and anthropogenic disturbance on the Qinghai-Tibetan Plateau. Glob. Ecol. Conserv. 2021, 27, e01512. [Google Scholar] [CrossRef]
  33. He, P.; Xu, L.H.; Liu, Z.C.; Jing, Y.D.; Zhu, W.B. Dynamics of NDVI and its influencing factors in the Chinese Loess Plateau during 2002–2018. Reg. Sustain. 2021, 2, 36–46. [Google Scholar] [CrossRef]
  34. Gao, W.D.; Zheng, C.; Liu, X.H.; Lu, Y.D.; Chen, Y.F.; Wei, Y.; Ma, Y.D. NDVI-based vegetation dynamics and their responses to climate change and human activities from 1982 to 2020: A case study in the Mu Us Sandy Land, China. Ecol. Indic. 2022, 137, 108745. [Google Scholar] [CrossRef]
  35. Xu, Y.; Huang, W.T.; Lu, M.Y.; Ou, Y.X.; Zhang, Z.Y.; Li, M.J.; Guo, Z.D.; Ma, R.X. Vegetation Cover Change and the Relative Role of Climate Change and human Activities in Southwest Karst Areas. Bull. Soil Water Conserv. 2022, 29, 292–299. (In Chinese) [Google Scholar] [CrossRef]
  36. Huang, Z. The first high-grade road in Guizhou, the construction process of Guiyang Huangguoshu highway. Gui Lite Hist. 2020, 6, 12–16. (In Chinese) [Google Scholar]
  37. Chen, K.S.; Yin, Y.; Wu, J. Investigation and Analysis of Slope Protection on Guiyang-Huangguoshu Expressway. J. Guizhou Univ. Nat. Sci. 2011, 45, 120–123. (In Chinese) [Google Scholar] [CrossRef]
  38. Holben, B.N. Characteristics of maximum-value composite images from temporal AVHRR data. Int. J. Remote Sens. 1986, 7, 1417–1434. [Google Scholar] [CrossRef]
  39. Guo, B.; Zhang, J.; Meng, X.; Xu, T.; Song, Y. Long-term spatio-temporal precipitation variations in China with precipitation surface interpolated by ANUSPLIN. Sci. Rep. 2020, 10, 81. [Google Scholar] [CrossRef] [Green Version]
  40. Price, D.T.; McKenney, D.W.; Nalder, I.A.; Hutchinson, M.F.; Kesteven, J.L. A comparison of two statistical methods for spatial interpolation of Canadian monthly mean climate data. Agric. For. Meteorol. 2000, 101, 81–94. [Google Scholar] [CrossRef]
  41. Jun, C.; Ban, Y.; Li, S. Open access to Earth land-cover map. Nature 2014, 514, 434. [Google Scholar] [CrossRef]
  42. Fensholt, R.; Proud, S.R. Evaluation of Earth Observation based global long term vegetation trends—Comparing GIMMS and MODIS global NDVI time series. Remote Sens. Environ. 2012, 119, 131–147. [Google Scholar] [CrossRef]
  43. Wu, L.; Wang, S.; Bai, X.; Chen, F.; Li, C.; Ran, C.; Zhang, S. Identifying the Multi-Scale Influences of Climate Factors on Runoff Changes in a Typical Karst Watershed Using Wavelet Analysis. Land 2022, 11, 1284. [Google Scholar] [CrossRef]
  44. Chen, F.; Bai, X.; Liu, F.; Luo, G.; Tian, Y.; Qin, L.; Li, Y.; Xu, Y.; Wang, J.; Wu, L.; et al. Analysis Long-Term and Spatial Changes of Forest Cover in Typical Karst Areas of China. Land 2022, 11, 1349. [Google Scholar] [CrossRef]
  45. Song, F.; Wang, S.; Bai, X.; Wu, L.; Wang, J.; Li, C.; Chen, H.; Luo, X.; Xi, H.; Zhang, S. A New Indicator for Global Food Security Assessment: Harvested Area Rather Than Cropland Area. Chin. Geogr. Sci. 2022, 32, 204–217. [Google Scholar] [CrossRef]
  46. Xiong, L.; Bai, X.Y.; Zhao, C.W.; Li, Y.B.; Tan, Q.; Luo, G.J.; Wu, L.H.; Chen, F.; Li, C.J.; Chen Ran, C.; et al. High-resolution datasets for global carbonate and silicate rock weathering carbon sinks and their change trends. Earth’s Future 2022, 10, e2022EF002746. [Google Scholar] [CrossRef]
  47. Jiao, W.; Wang, L.; Smith, W.K.; Chang, Q.; Wang, H.; D’Odorico, P. Observed increasing water constraint on vegetation growth over the last three decades. Nat. Commun. 2021, 12, 3777. [Google Scholar] [CrossRef] [PubMed]
  48. Deng, Y.H.; Wang, S.J.; Bai, X.Y.; Luo, G.J.; Wu, L.H.; Chen, F.; Wang, J.F.; Li, Q.; Li, C.J.; Yang, Y.J.; et al. Characteristics of soil moisture storage from 1979 to 2017 in the karst area of China. Geocarto Int. 2021, 36, 903–917. [Google Scholar] [CrossRef]
  49. Gampe, D.; Zscheischler, J.; Reichstein, M.; O’Sullivan, M.; Smith, W.K.; Sitch, S.; Buermann, W. Increasing impact of warm droughts on northern ecosystem productivity over recent decades. Nat. Clim. Chang. 2021, 11, 772–779. [Google Scholar] [CrossRef]
  50. Li, W.; Migliavacca, M.; Forkel, M.; Denissen, J.M.C.; Reichstein, M.; Yang, H.; Duveiller, G.; Weber, U.; Orth, R. Widespread increasing vegetation sensitivity to soil moisture. Nat. Commun. 2022, 13, 3959. [Google Scholar] [CrossRef] [PubMed]
  51. Luo, L.; Ma, W.; Zhuang, Y.; Zhang, Y.; Yi, S.; Xu, J.; Long, Y.; Ma, D.; Zhang, Z. The impacts of climate change and human activities on alpine vegetation and permafrost in the Qinghai-Tibet Engineering Corridor. Ecol. Indic. 2018, 93, 24–35. [Google Scholar] [CrossRef]
Figure 1. Location and elevation of the study area.
Land 11 01771 g001
Figure 2. Inter annual dynamic change of average NDVI within construction (a) and operation (b) periods in the study area.
Land 11 01771 g002
Figure 3. Trend fitting of MAT (a), MAP (b) and NDVI within the construction and operation periods.
Land 11 01771 g003
Figure 4. NDVI values at different distances within construction (a) and operation (b) periods.
Land 11 01771 g004
Figure 5. Spatial distribution of the trend of NDVI from 1986–2020. Trends were separated into the following classification: significantly decrease (<−0.005), slightly decrease (−0.005–0), slightly increase (0–0.005), non-significant increase (0.005–0.010), significantly increase (0.010–0.015), more significantly increase (>0.015).
Land 11 01771 g005
Figure 6. CV for the core (a) and contrast (b) areas within the construction period divided into five levels; namely, low fluctuation (0–0.2), lower fluctuation (0.2–0.4), medium fluctuation (0.4–0.6), higher fluctuation (0.6–0.8) and high fluctuation (0.8–1). CV in the core (c) and contrast (d) areas within the operating period was divided into five levels, namely, low fluctuation (0–0.1), lower fluctuation (0.1–0.2), medium fluctuation (0.2–0.3), higher fluctuation (0.3–0.4) and high fluctuation (0.4–1).
Land 11 01771 g006
Figure 7. Correlation between temperature (a), precipitation (b), and NDVI from 1986 to 2020. The distribution range of correlation coefficients were divided into high negative correlation (<−0.6), lower negative correlation (−0.6–−0.4), low negative correlation (−0.4–−0.2), pianissimo negative correlation (−0.2–0), pianissimo positive correlation (0–0.2), lower positive correlation (0.2–0.4), low positive correlation (0.4–0.6) and high positive correlation (>0.6).
Land 11 01771 g007aLand 11 01771 g007b
Figure 8. 2000 LUCC classification (a) and 2020 LUCC classification (b).
Land 11 01771 g008
Table 1. Classification statistics of different trends in core and contrast areas within construction and operation periods.
PeriodClassificationSlopeCore AreaContrast Area
PixelsArea (km2)PercentPixelsArea (km2)Percent
Construction PeriodSignificantly Decrease<−0.051752614.080.17%1656213.310.13%
Slightly Decrease−0.05–0219687176.552.10%204681164.491.65%
Slightly Increase0–0.0596914497788.5192.42%115518499283.6292.99%
Significant Increase0.05–0.1429426345.114.10%498663400.754.01%
More Significantly Increase>0.1127995102.861.22%151227121.531.22%
Operation PeriodSignificantly Decrease<−0.0194137.560.09%49974.020.04%
Slightly Decrease−0.01–0140109112.601.34%8572168.890.69%
Slightly Increase0–0.0198675937930.0794.10%117819449468.5494.84%
Significant Increase0.01–0.02464370373.194.43%544514437.604.38%
More Significantly Increase<0.0246223.710.04%57964.660.05%
Table 2. LUCC Classification statistics from 2000 to 2020.
Classification2000 LUCC2020 LUCC
Area (km2)PercentageArea (km2)Percentage
Cultivated Land1070.7145.82%929.6139.78%
Forest510.8521.86%501.7521.47%
Grass338.6714.49%316.0213.52%
Shrub225.159.64%214.169.16%
Water64.462.76%46.101.97%
Artificial Cover126.945.43%329.4114.10%
Publisher’s Note: MDPI stays neutral with regard to jurisdictional claims in published maps and institutional affiliations.

